
Analysis of Operation Characteristics of Phase-Change Temperature Maintenance System Heating by Solar Source and Sewage Source Heat Pump

Abstract
1. Foreword
2. Modeling
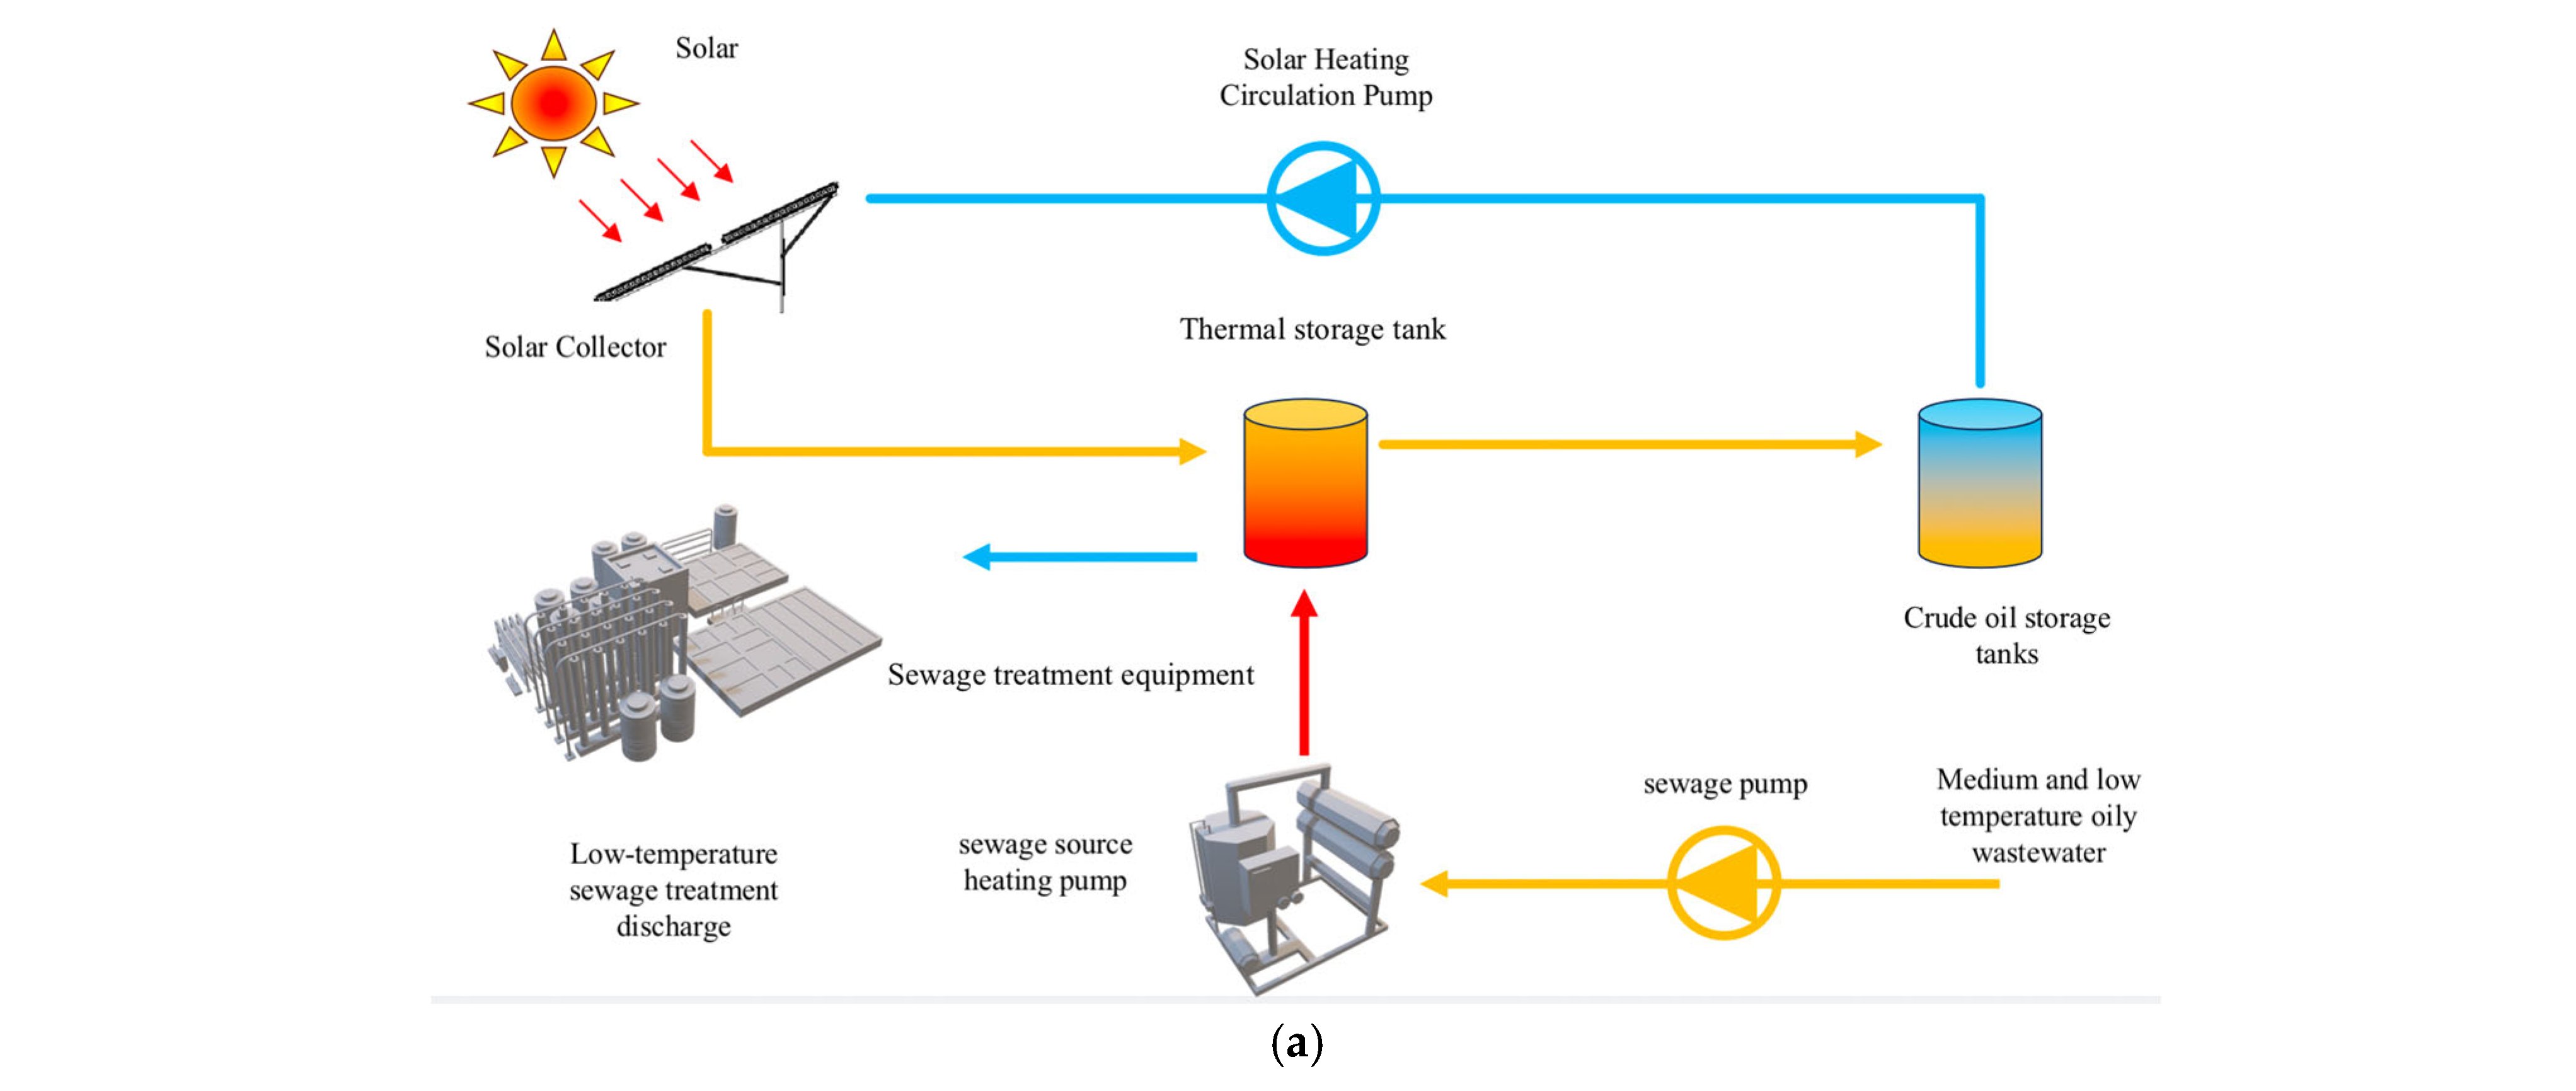
2.1. Physical Model
2.2. Mathematical Model
2.3. System Control Plan
2.4. Boundary Conditions and Assumptions
| Storage Tank | a—Length in the x-direction of the storage tank; b—Length of the storage tank in the y-direction; Tair—Ambient Temperature; λ—coefficientof conduction; h—coefficient of convection | |
| PipeLine | r—Radius of pipeline |
3. Results and Discussion
3.1. Model Validation
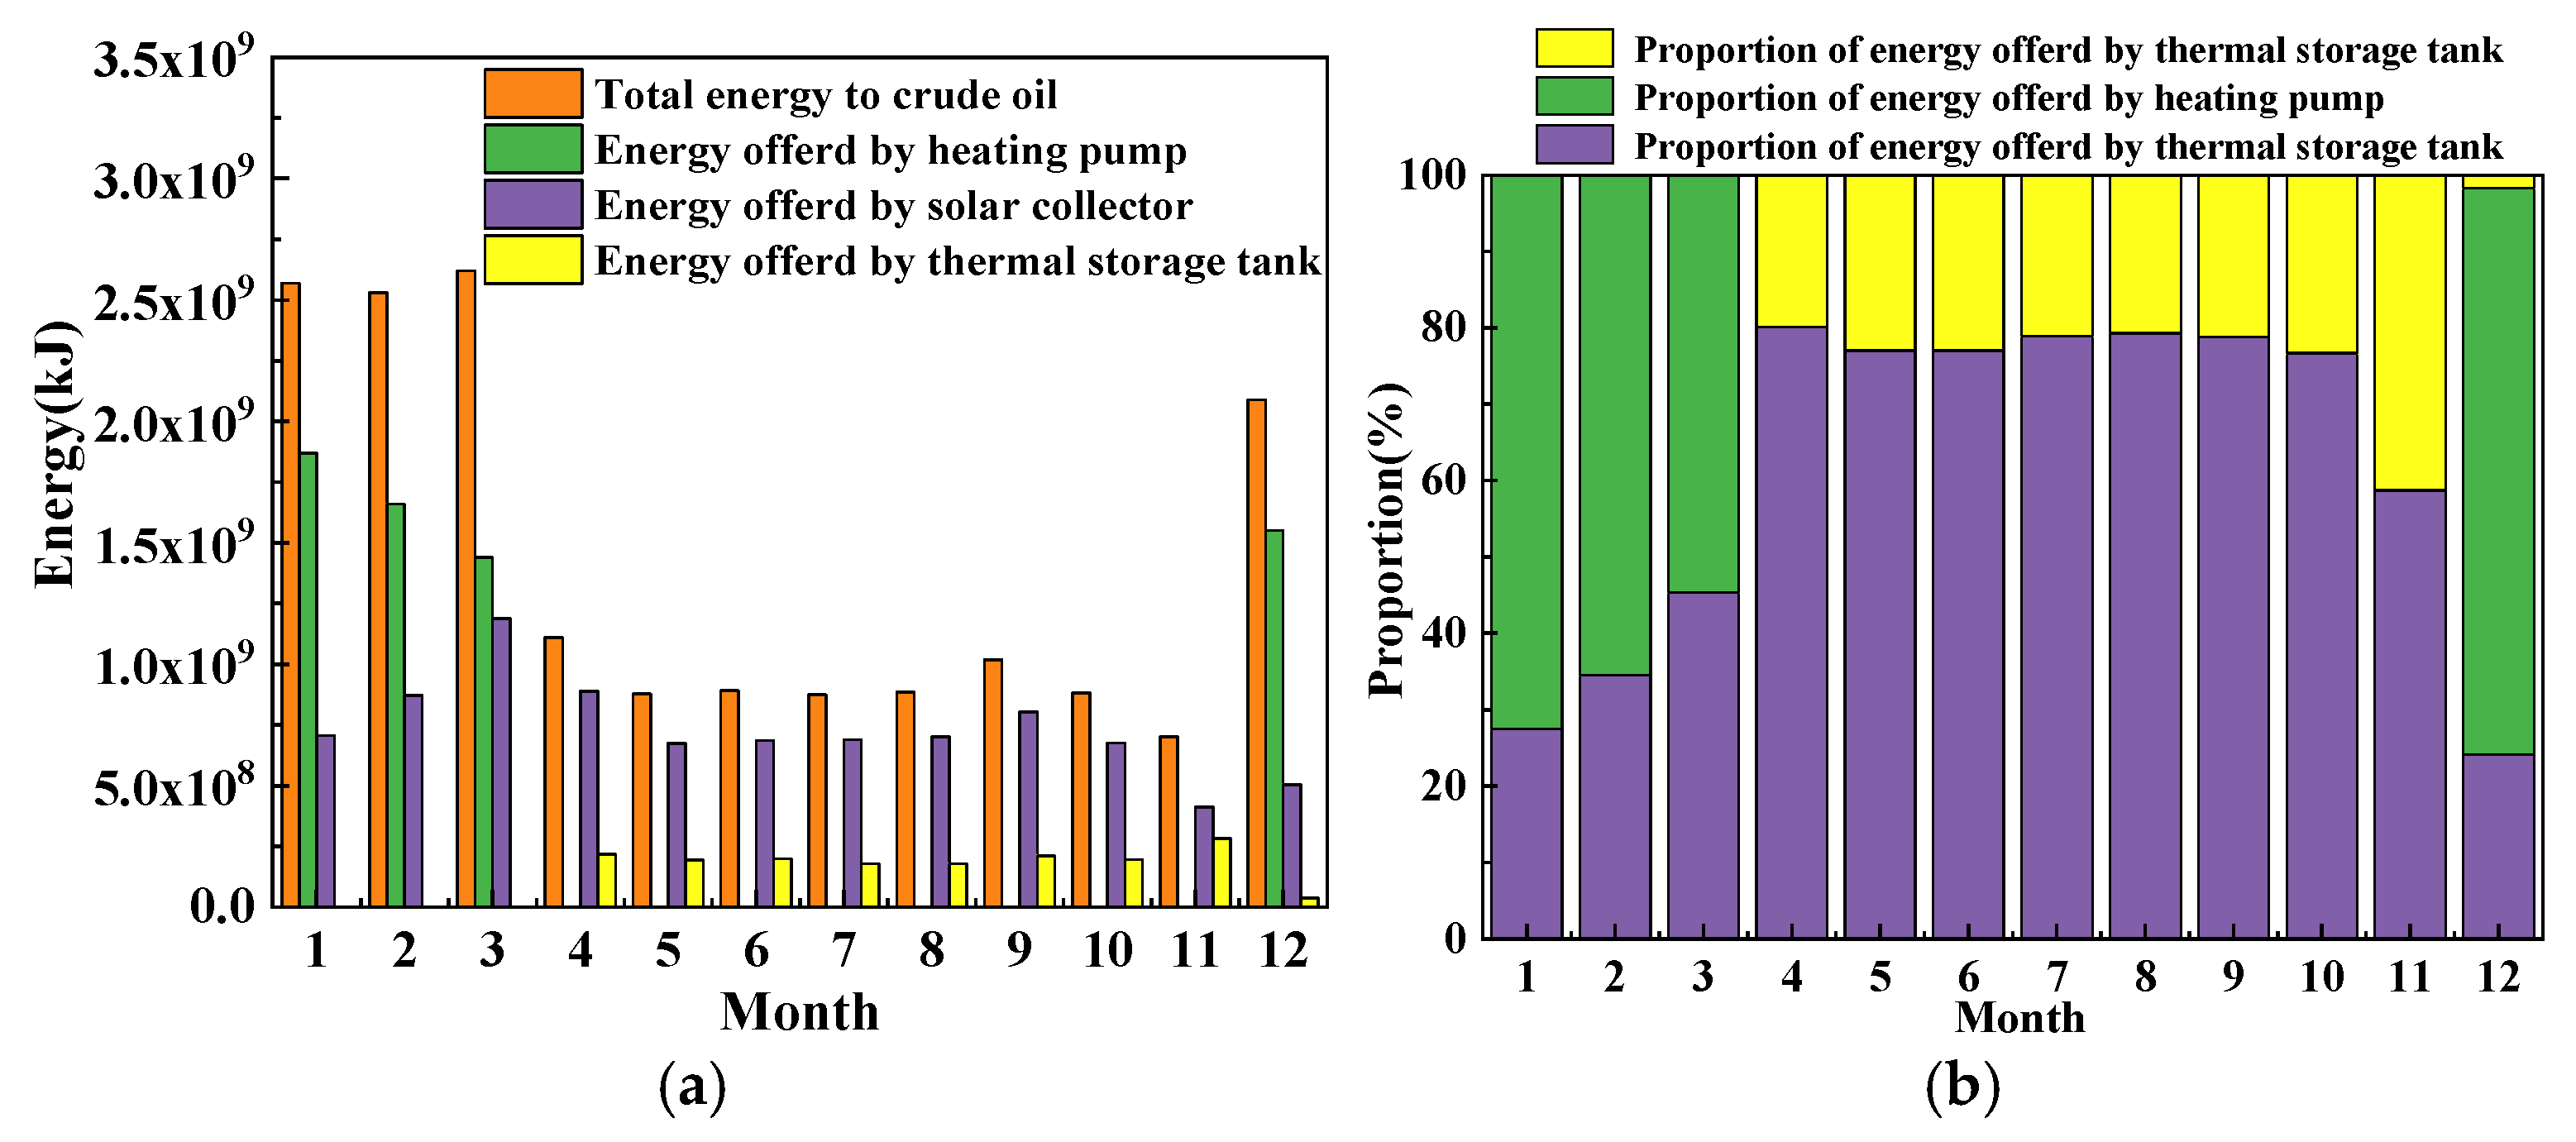
3.2. Analysis of Operating Characteristics
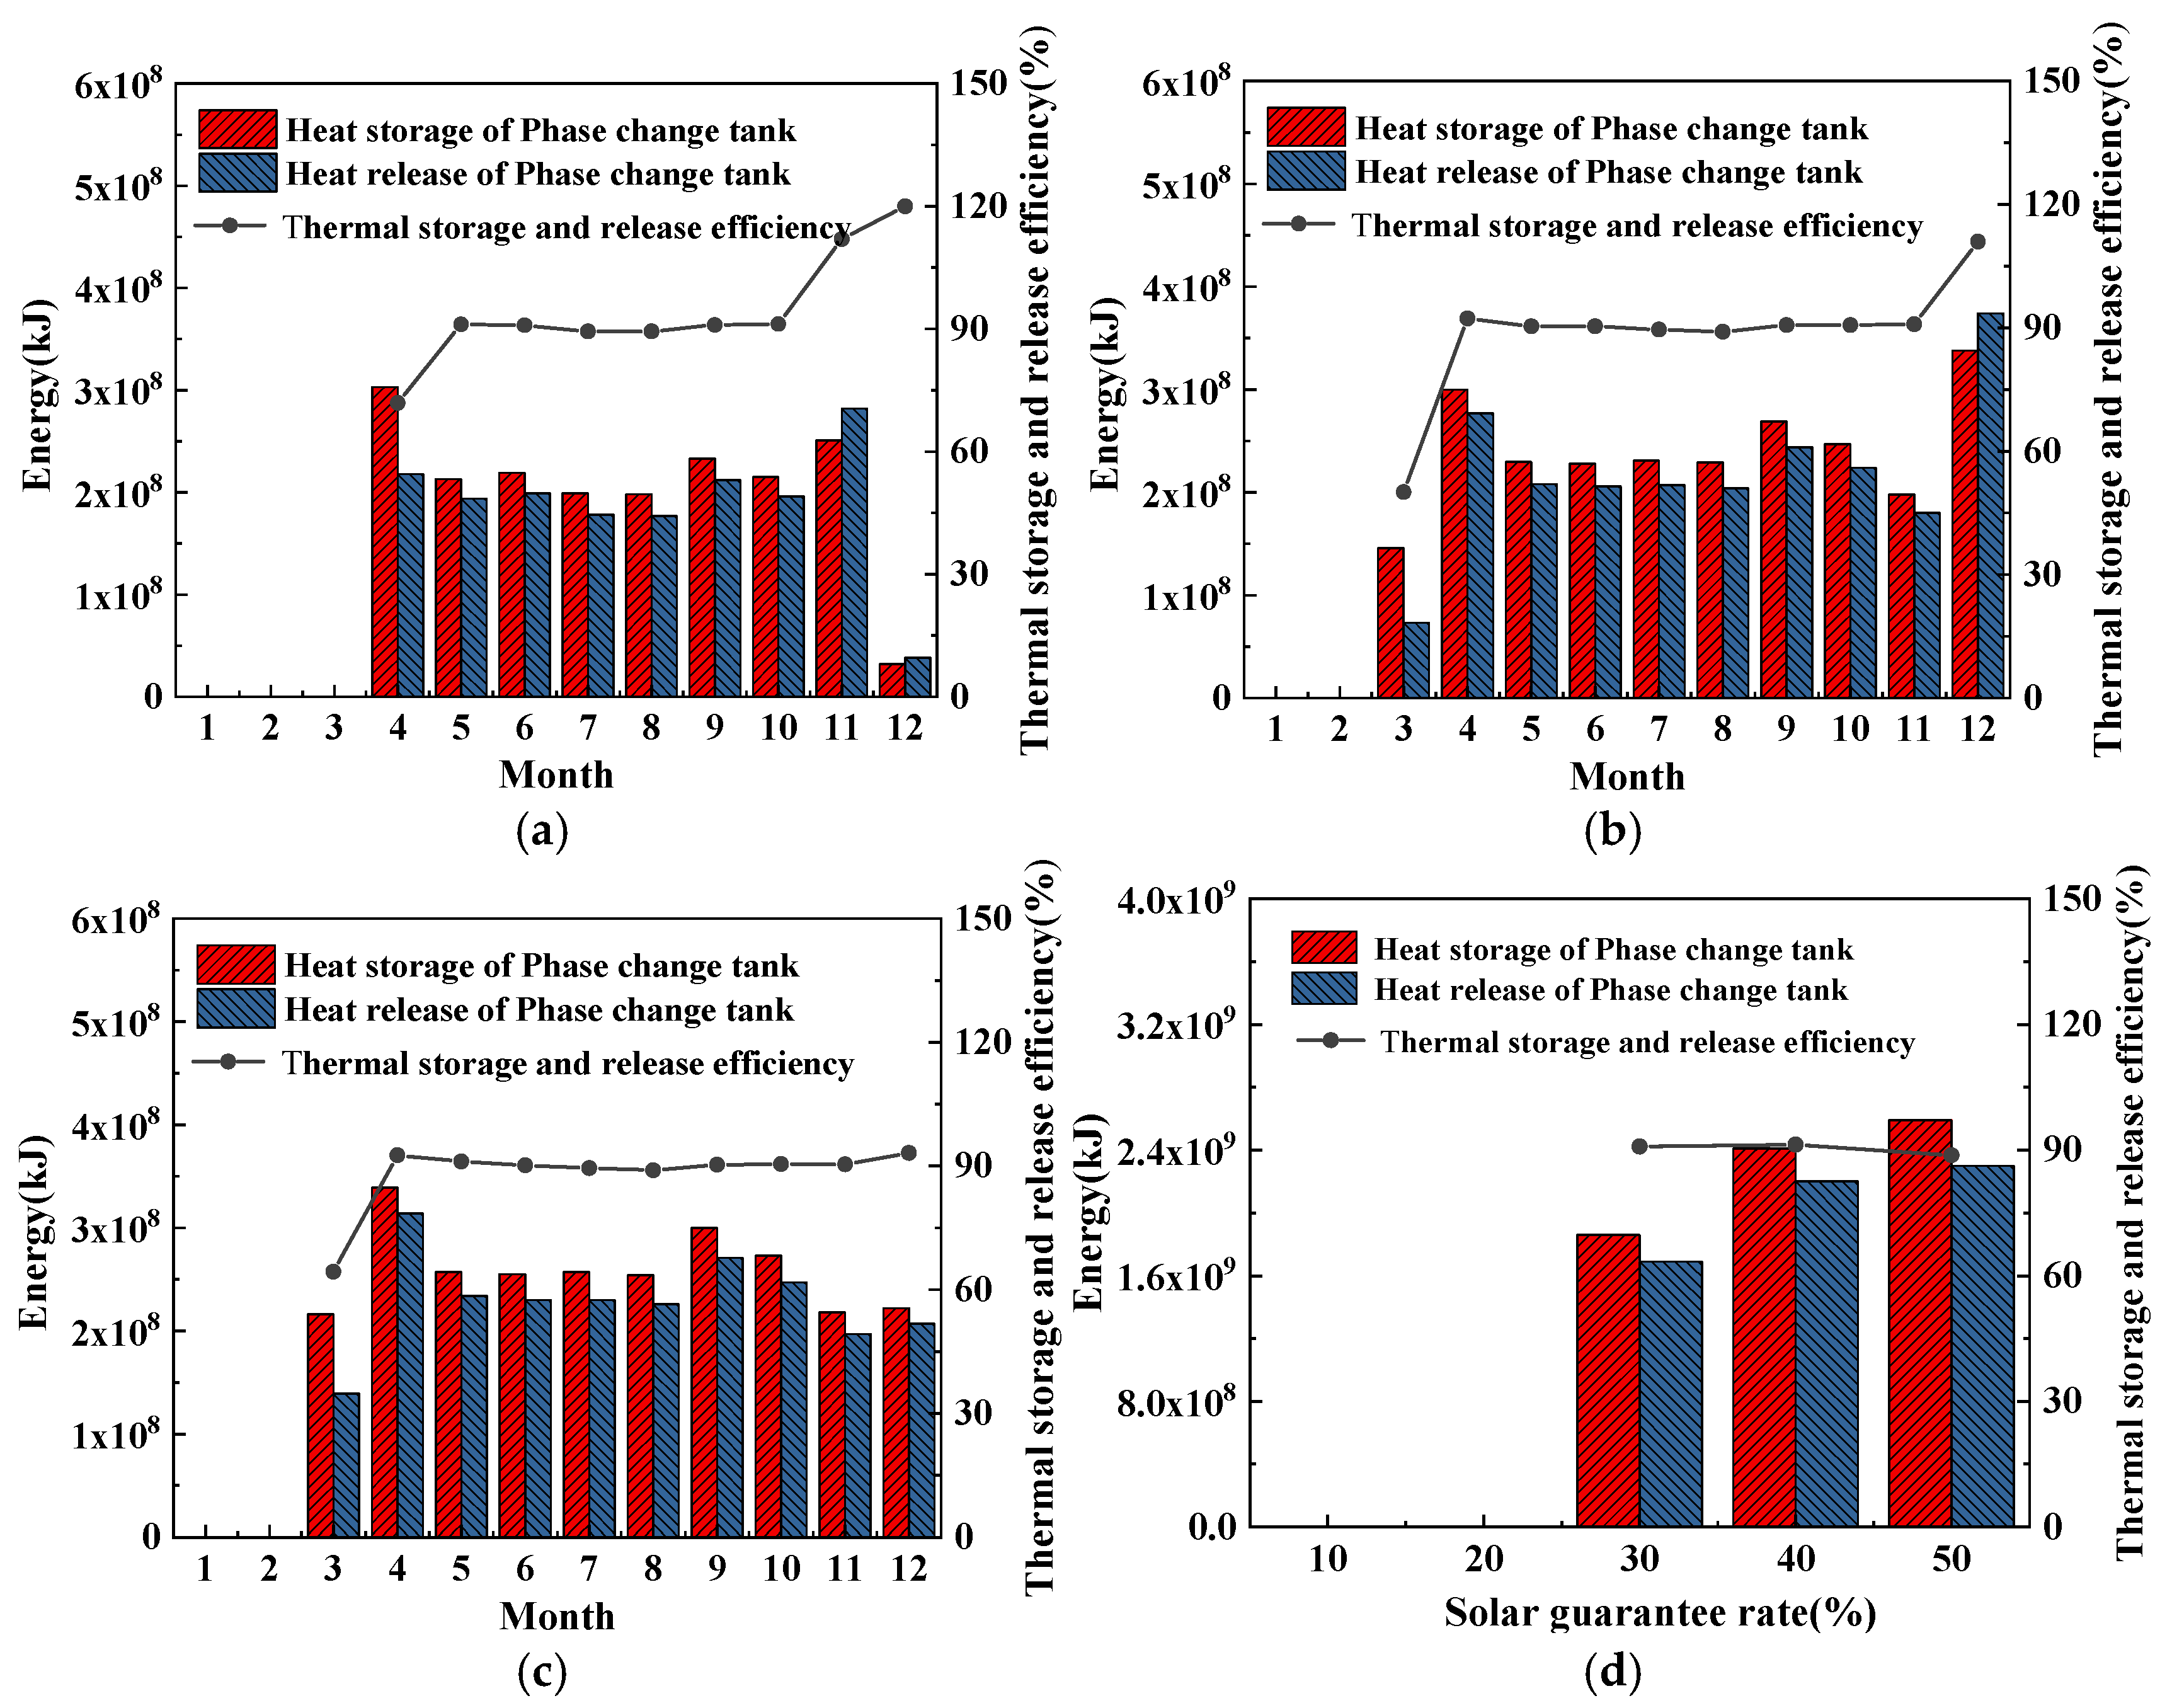
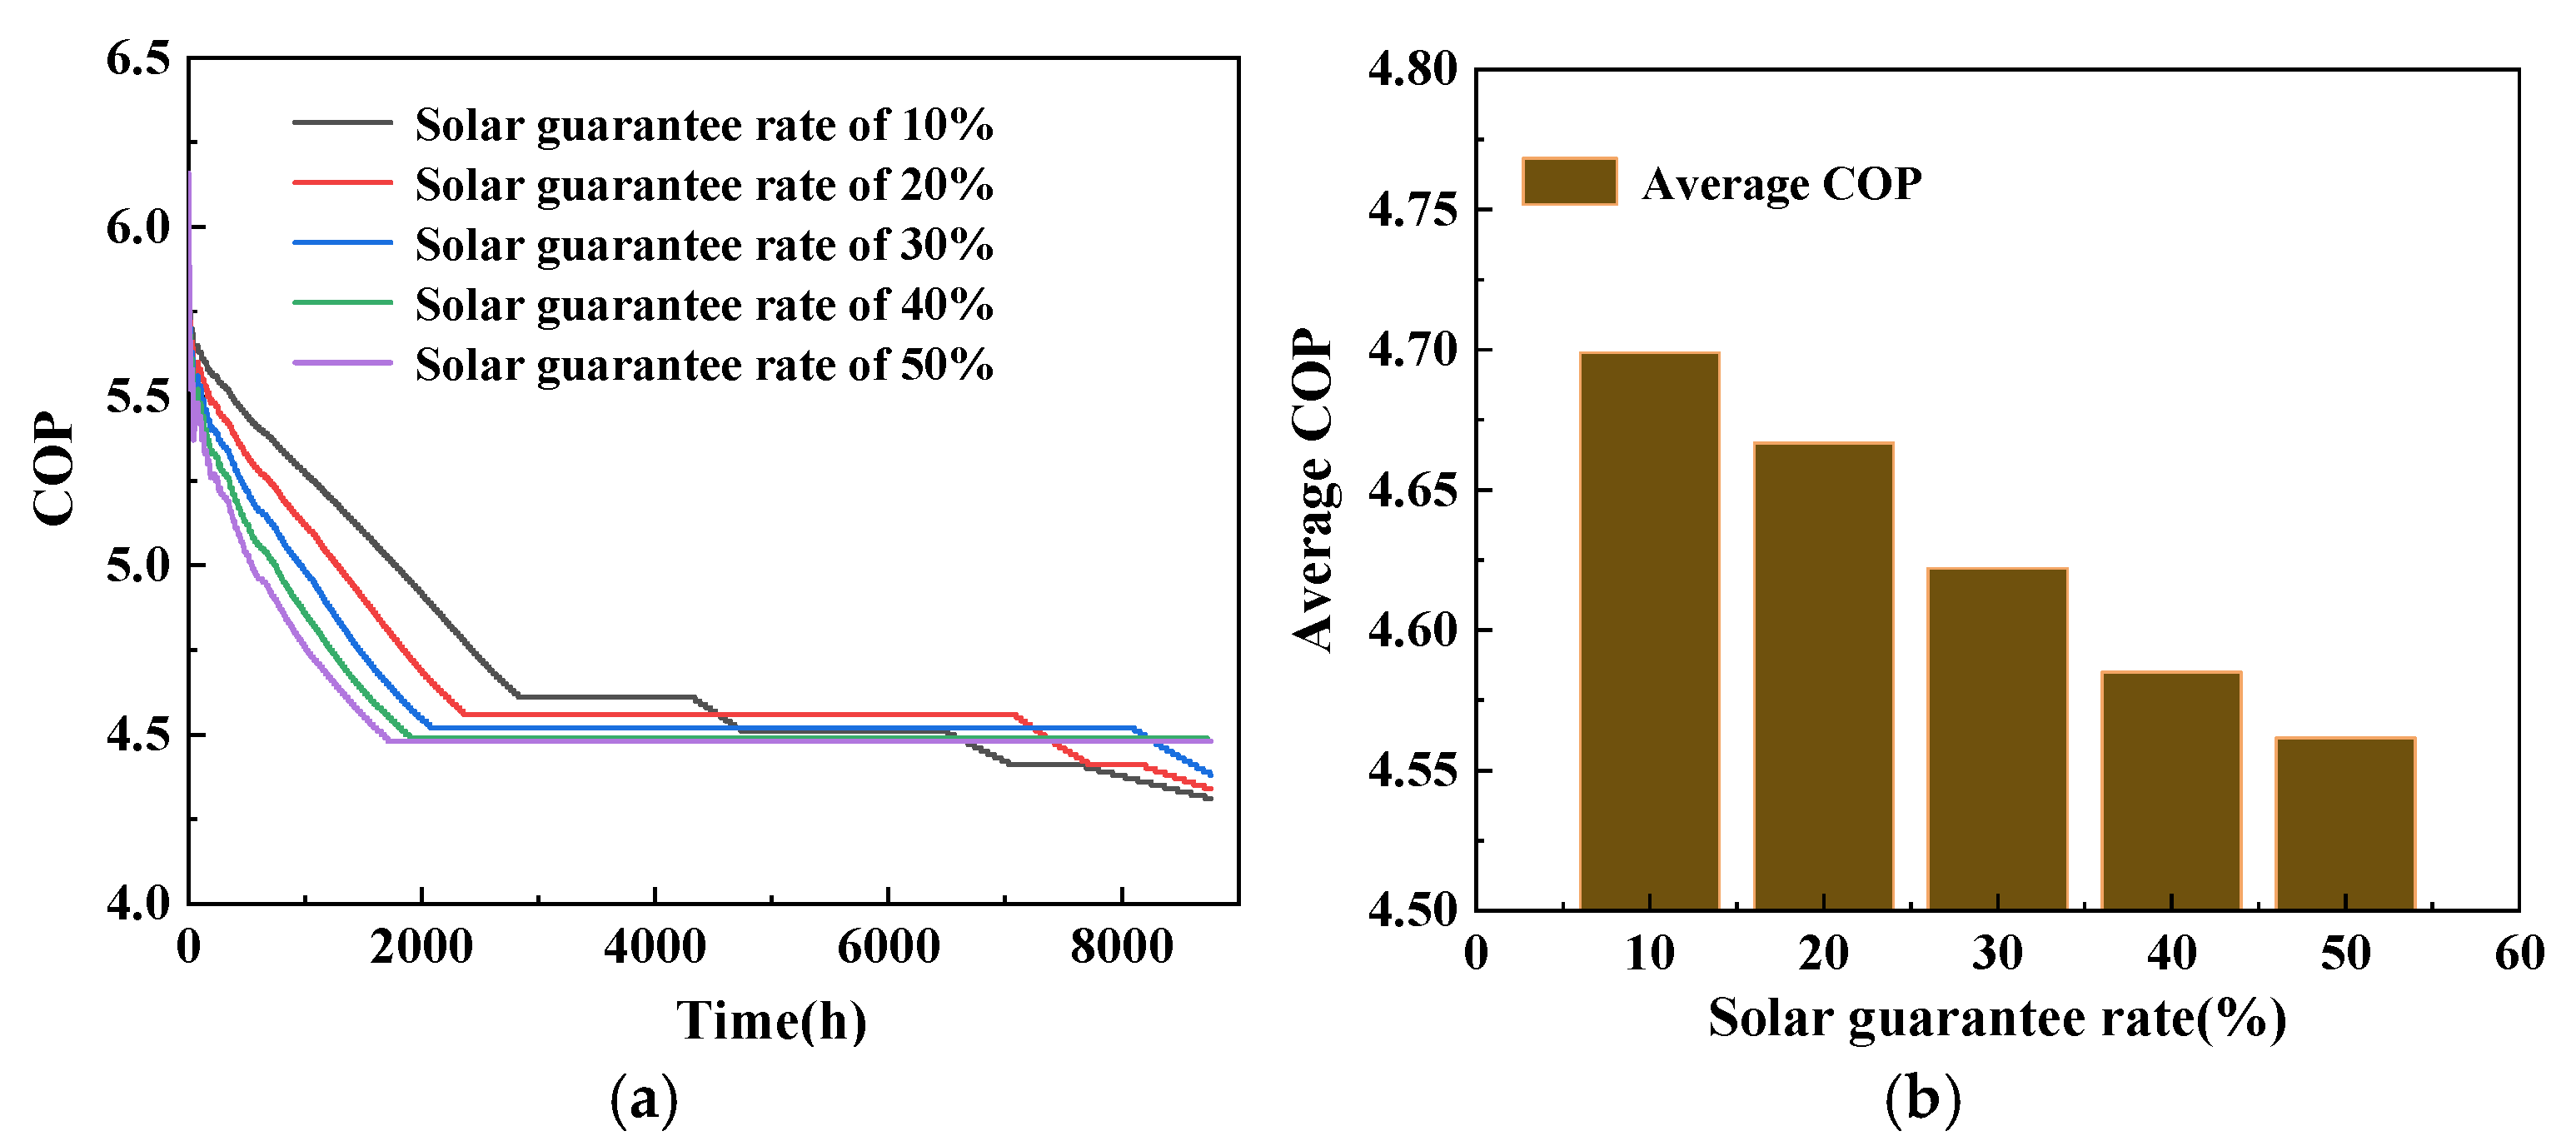
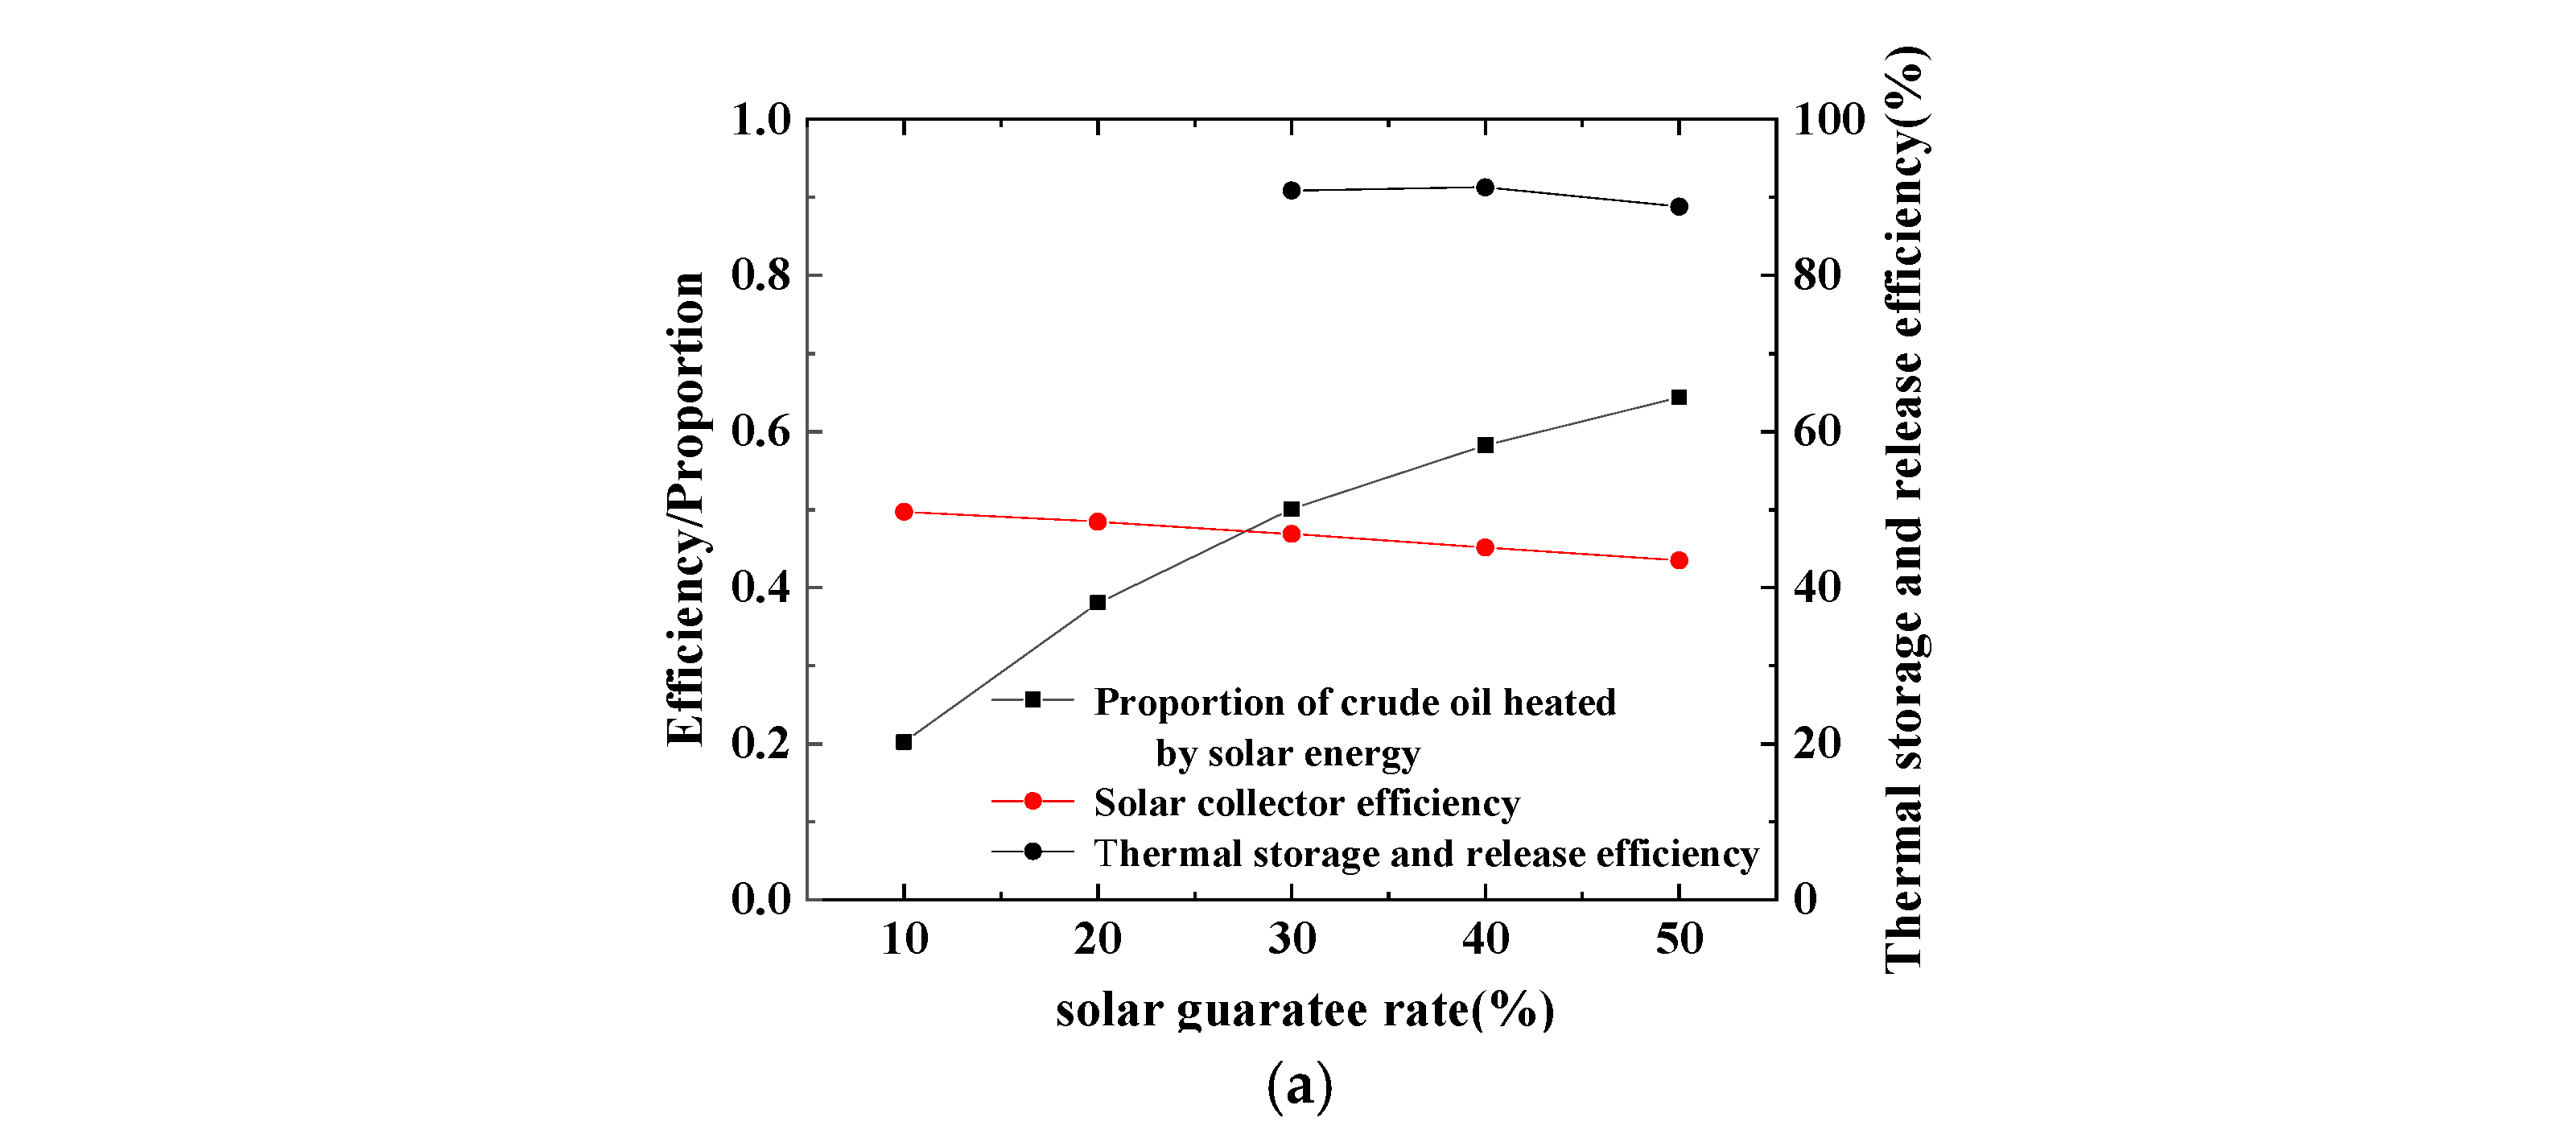
3.2.1. Solar Energy Guarantee Rate
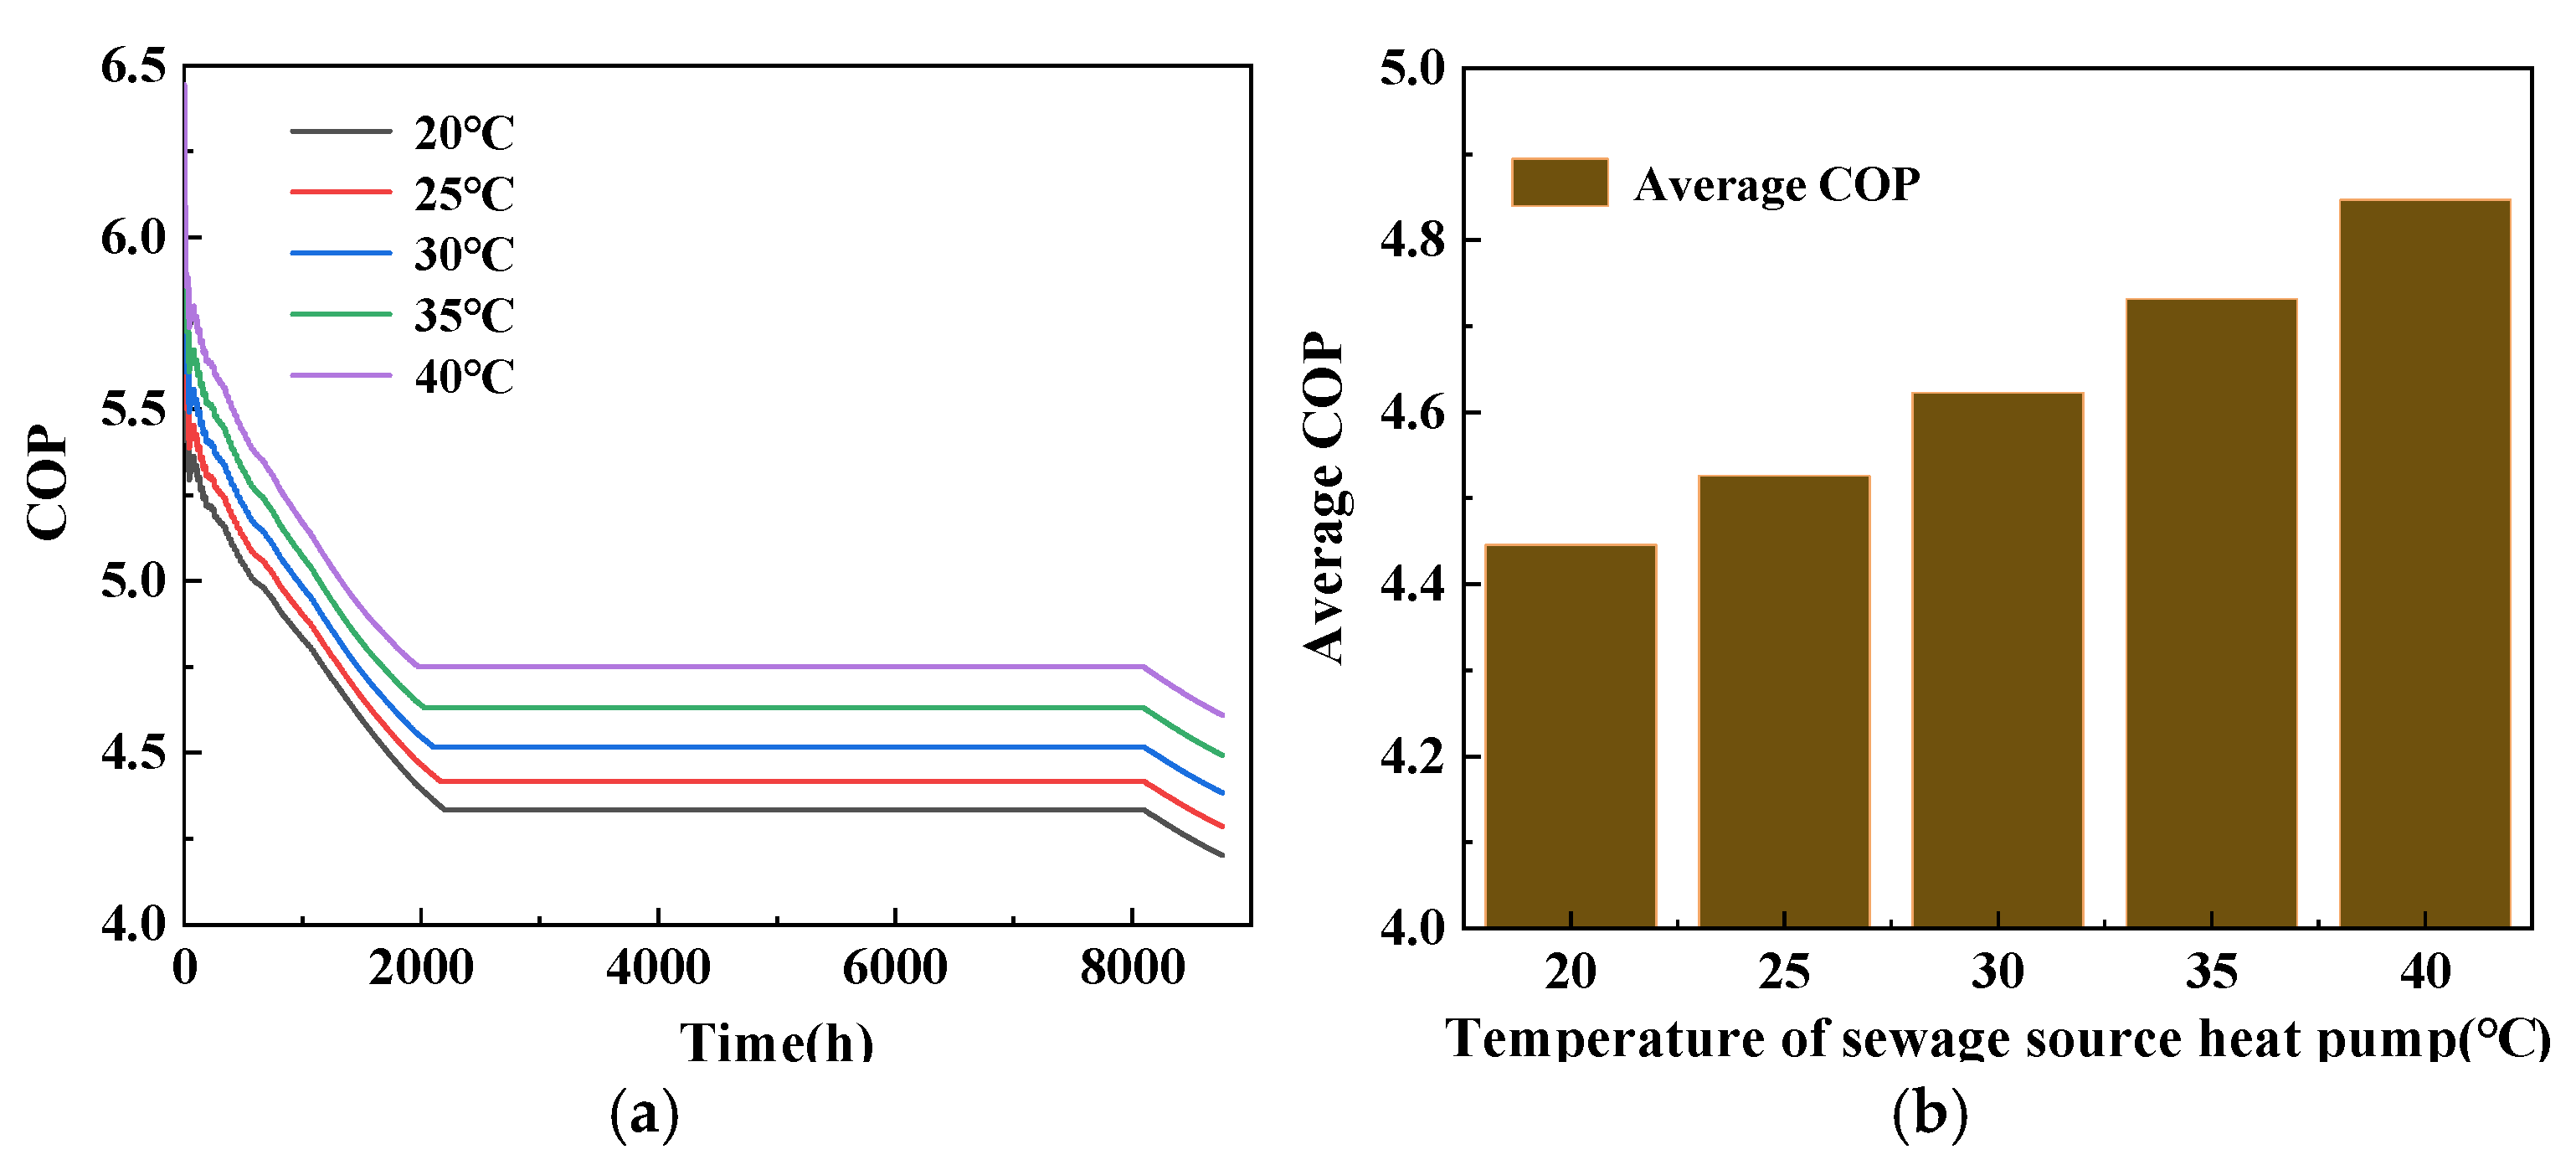
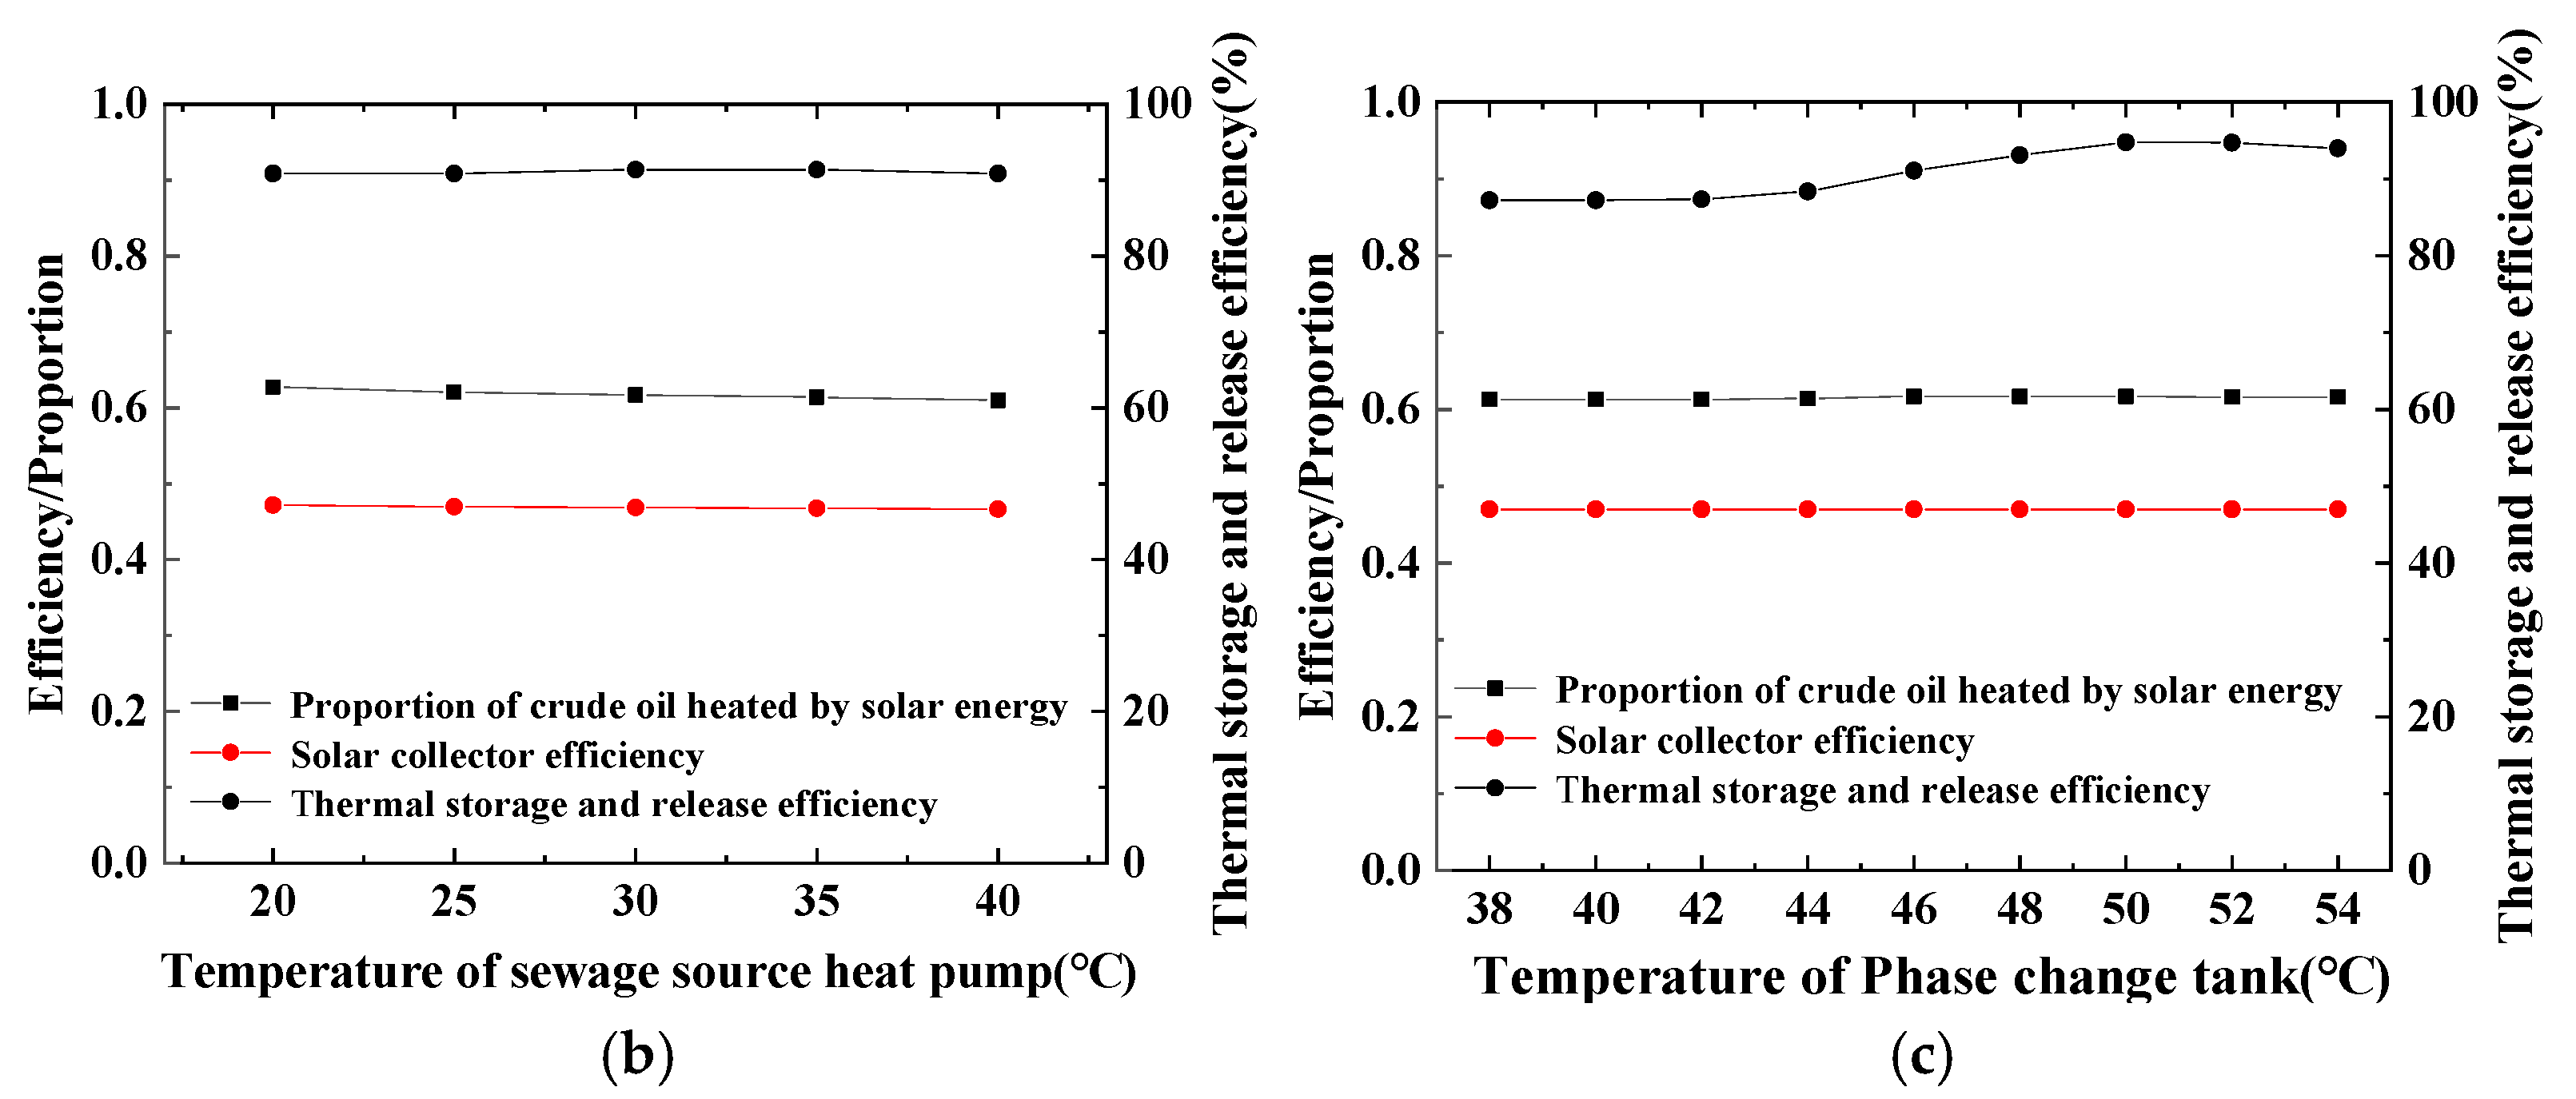
3.2.2. Sewage Source Heat Pump Temperature
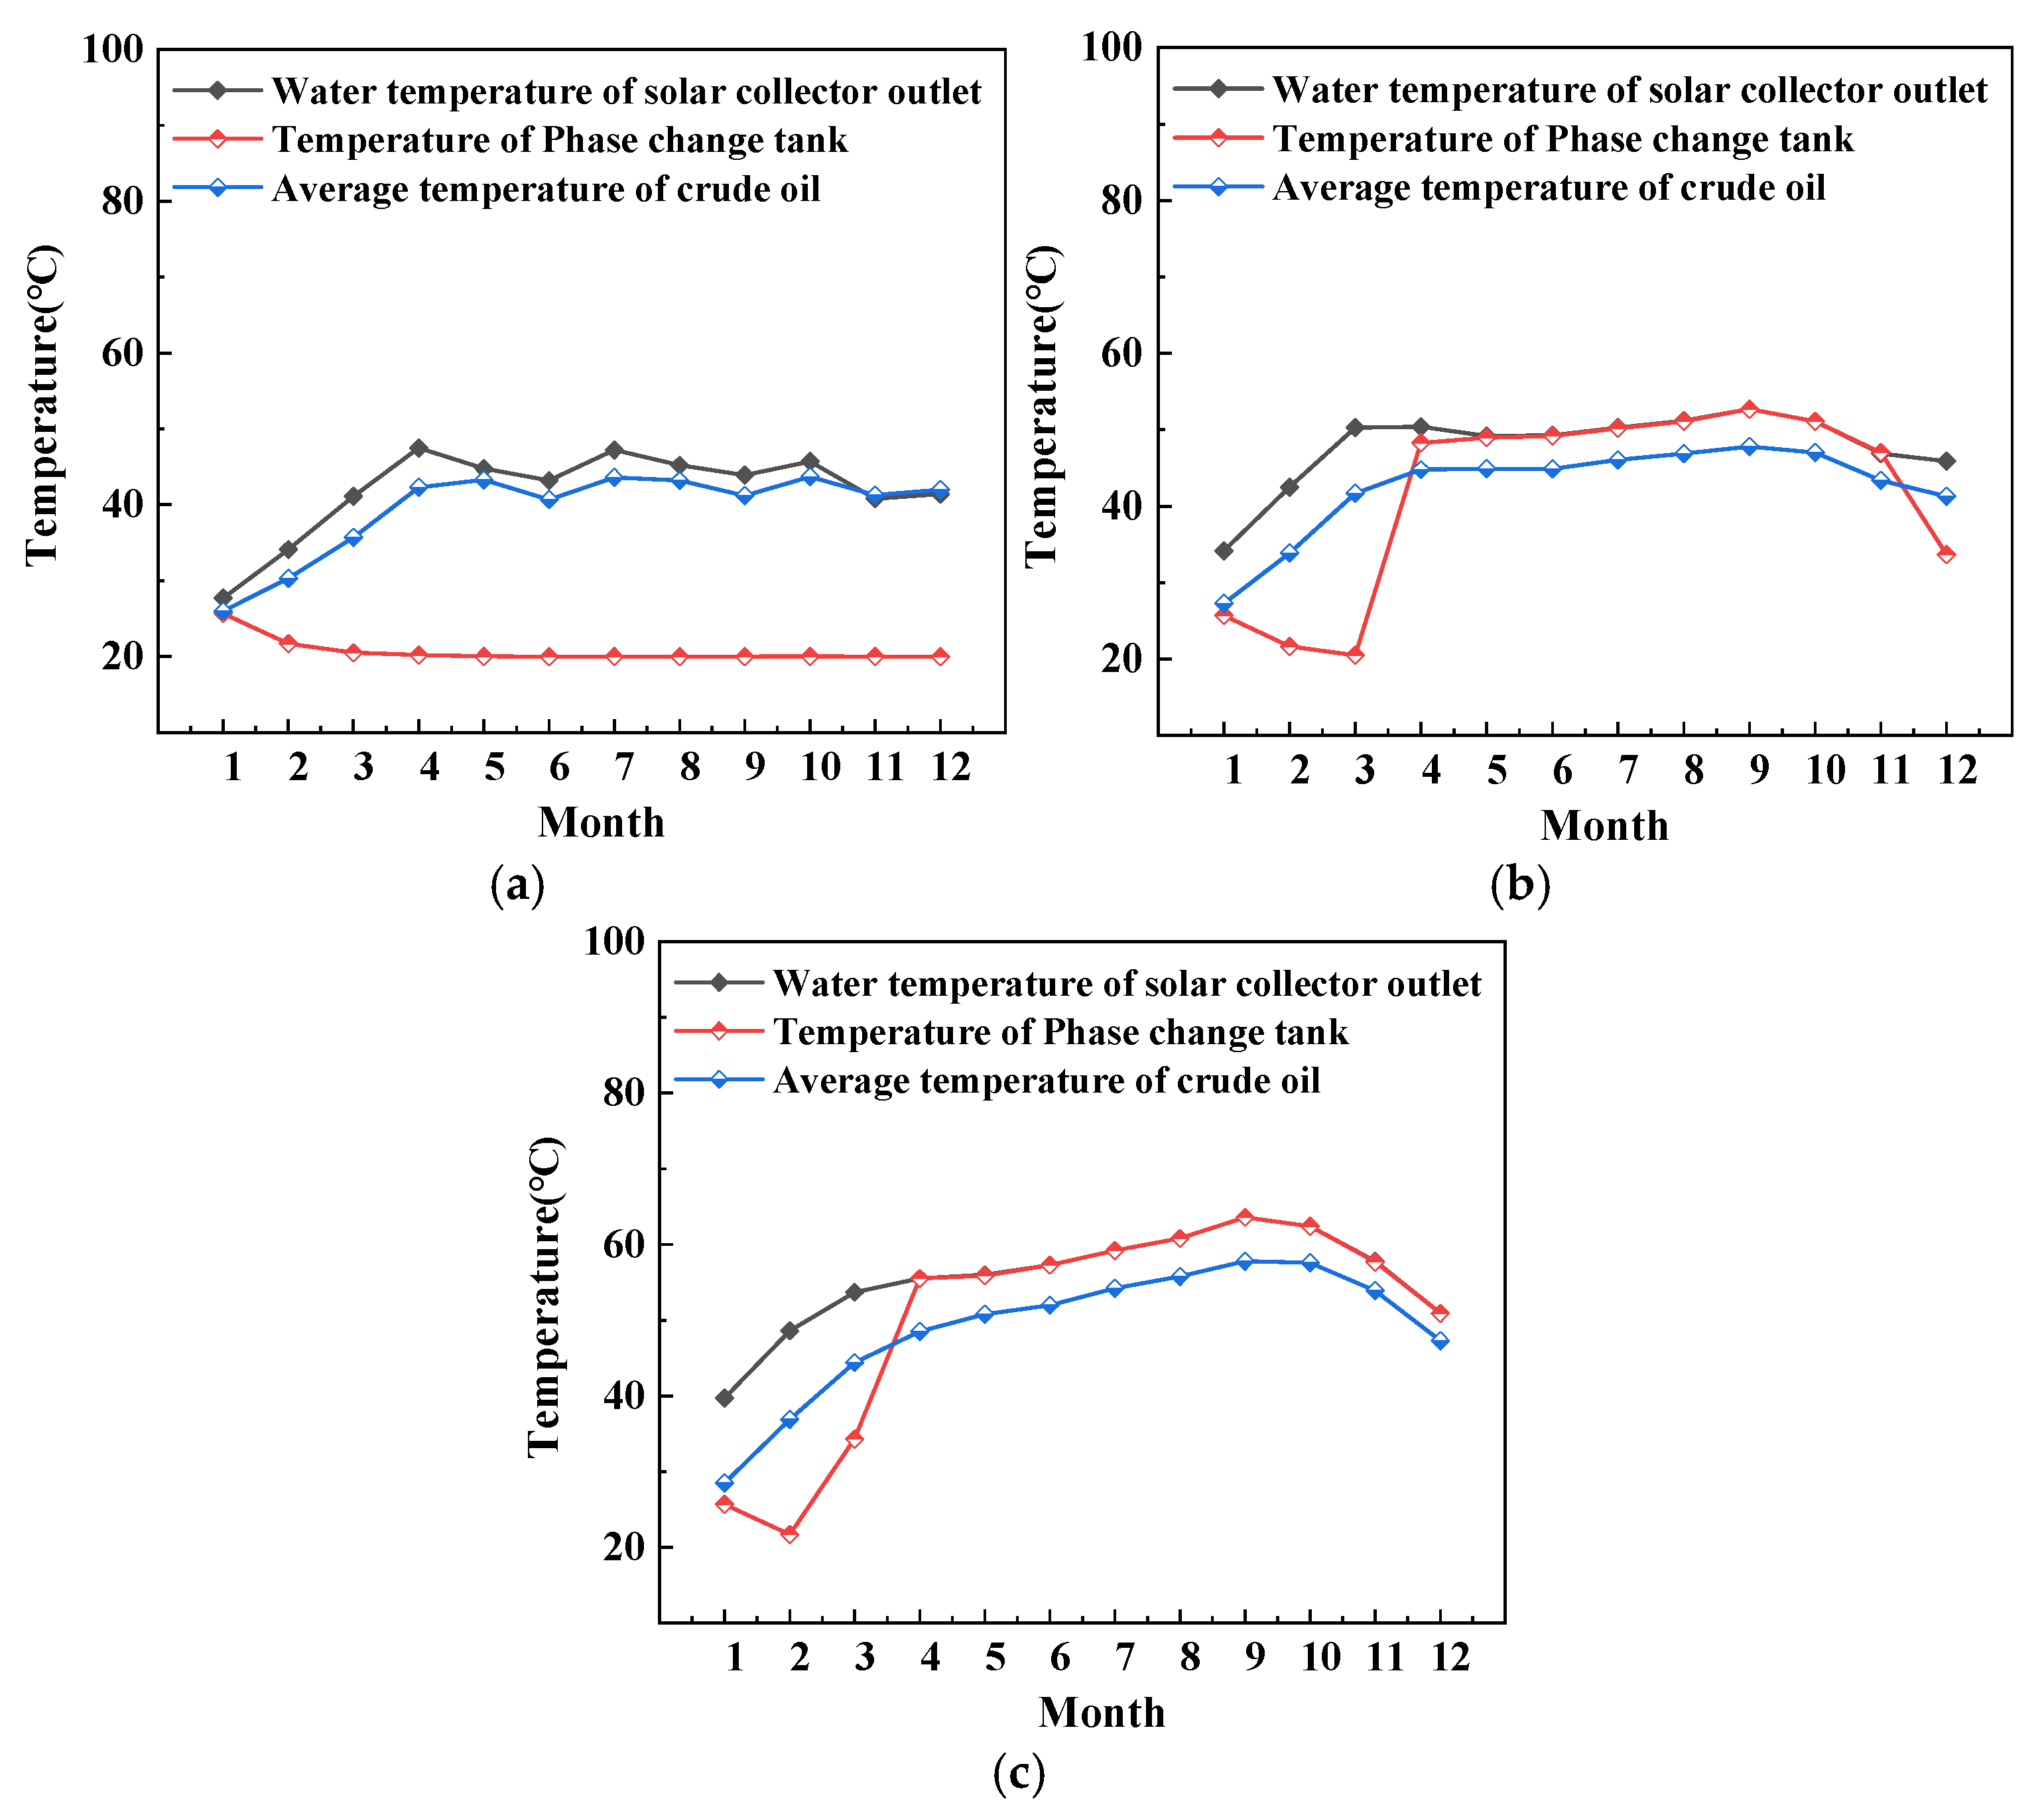
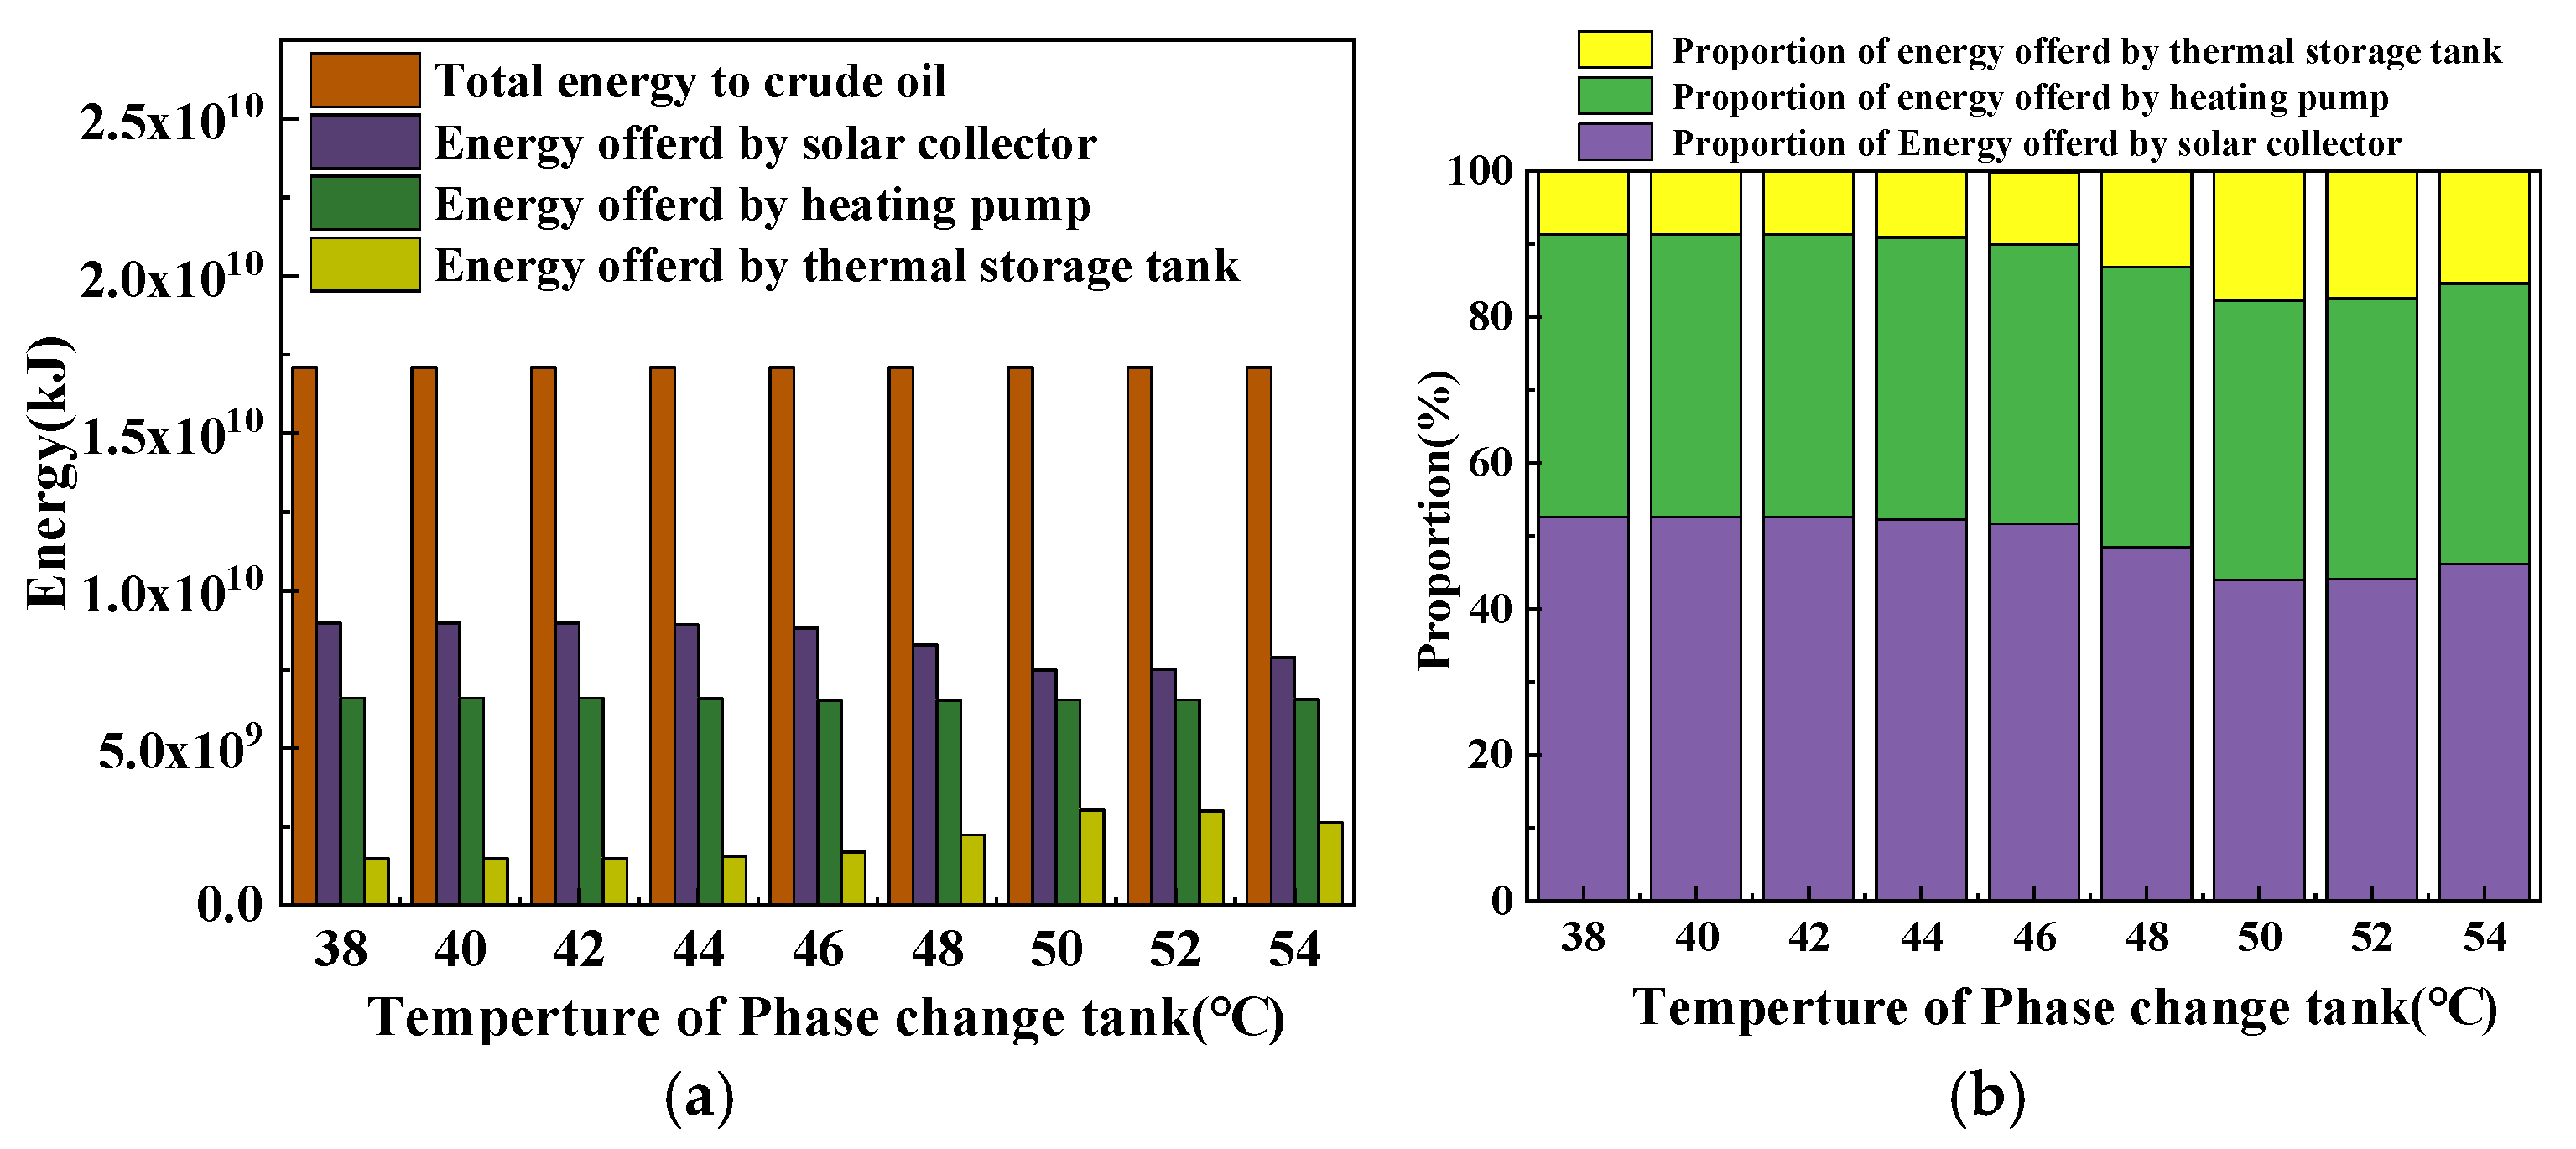
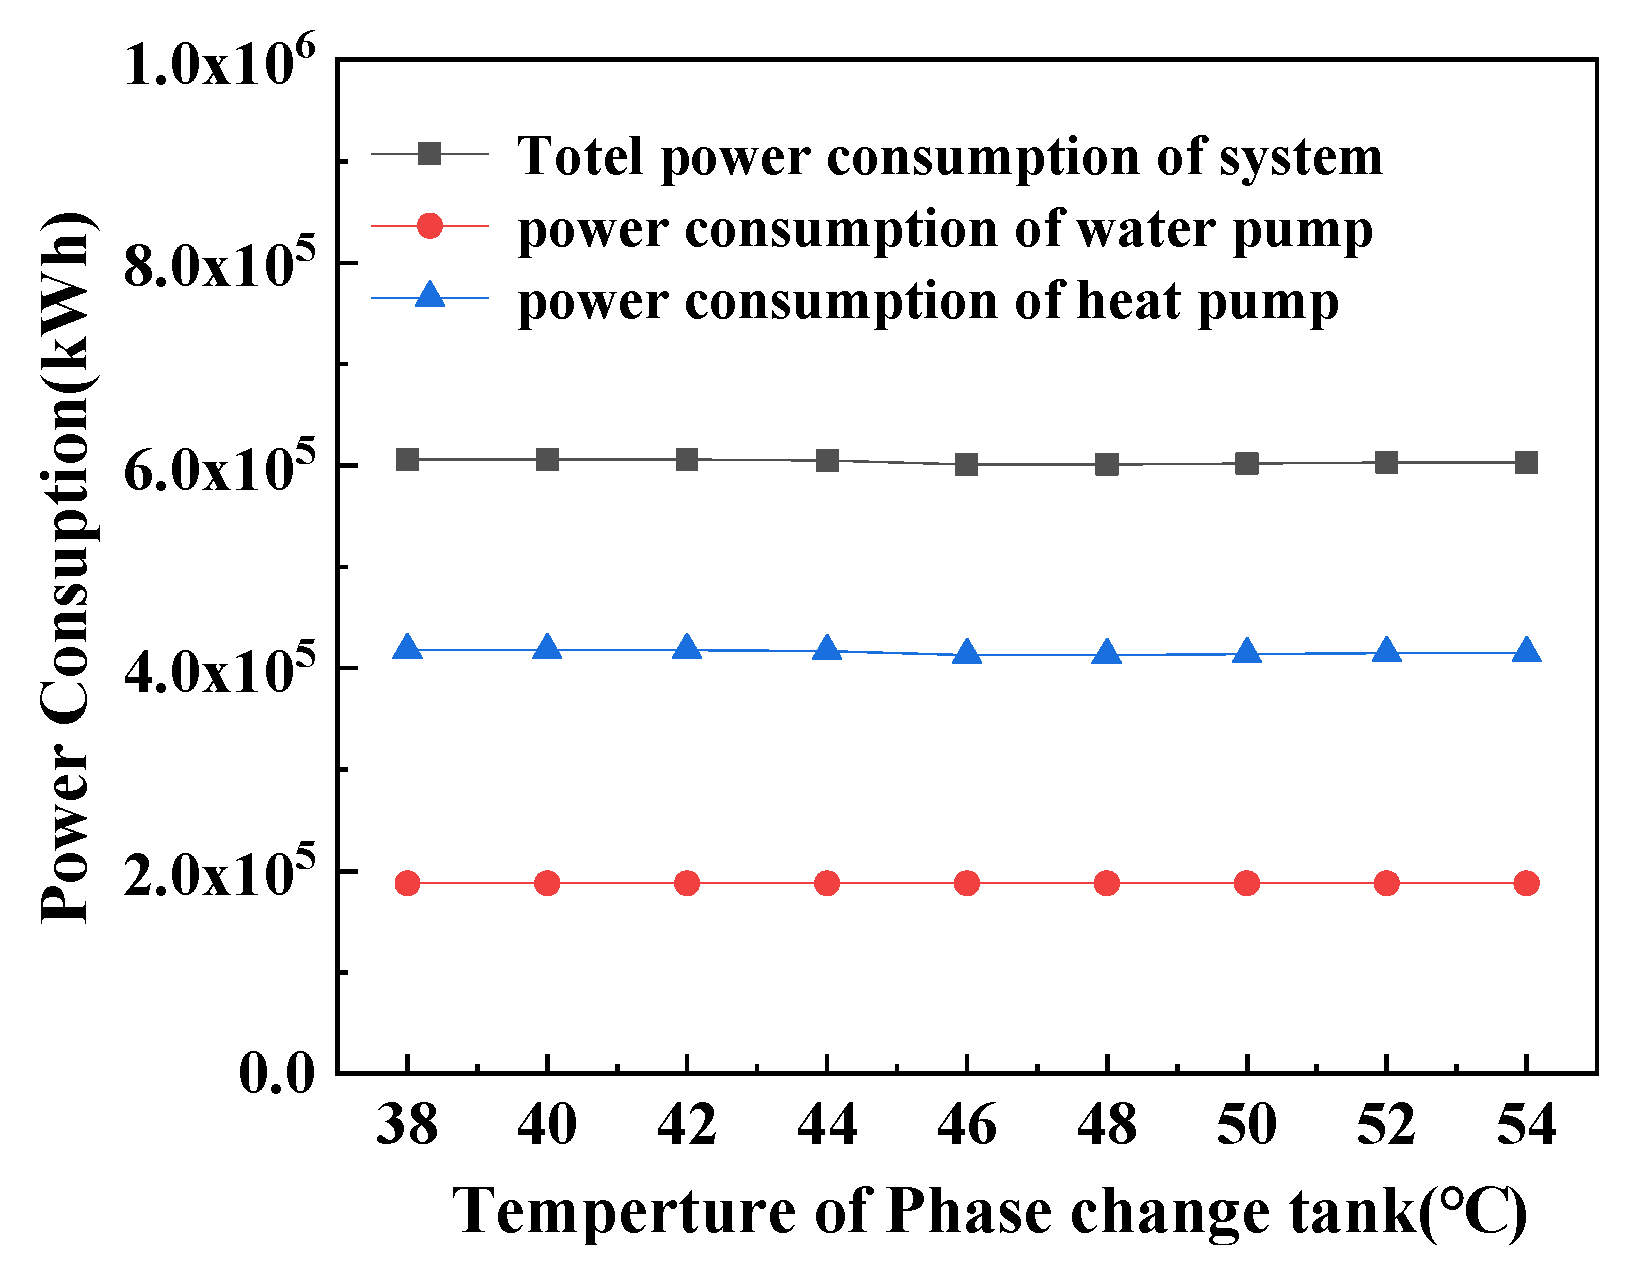
3.2.3. Temperature of Phase-Change Thermal Storage Tank
3.3. Sensitivity Analysis of Parameters
3.4. Economic Benefit Evaluation
3.5. Environmental Benefit Assessment
4. Conclusions
Author Contributions
Funding
Data Availability Statement
Conflicts of Interest
References
- Li, J.; Li, X.; Chen, Y. Suggestions for National Petroleum Strategic Reserve. Pet. Plan. Des. 2004, 7–9+48. [Google Scholar]
- Zhao, J.; Liu, J.; Dong, H.; Zhao, W. Effect of physical properties on the heat transfer characteristics of waxy crude oil during its static cooling process. Int. J. Heat Mass Transf. 2019, 137, 242–262. [Google Scholar] [CrossRef]
- Lei, H. Party Pengfei Solid state storage and heating technology for waxy crude oil. Energy Sav. Technol. 2010, 28, 454–457. [Google Scholar]
- Pei, J.; Chen, G. Application of Solar Energy and Heat Pump Technology in Crude Oil Heating System. Oil Gas Storage Transp. 2012, 31, 289–291+326–327. [Google Scholar]
- Liu, F. Research on Heat Transfer Characteristics of Crude Oil in Storage Tanks Under Different Heating Methods; Northeast Petroleum University: Daqing, China, 2017. [Google Scholar]
- Rui, Y. Research on Solar Heating System in High altitude and Cold Regions; Tianjin University of Commerce: Tianjin, China, 2016. [Google Scholar]
- Li, K.; He, F. Regional Analysis of Potential Development of Land Solar Energy Resources in China. Adv. Geogr. Sci. 2010, 29, 1049–1054. [Google Scholar]
- Ji, X. Design and Application Effect Evaluation of Solar Hot Water System for High Rise Buildings. Sichuan Cem. 2024, 5, 108–110. [Google Scholar]
- Li, W.; Xing, T.; Zhang, M.; Chen, X. Optimization Design of Roof Solar Hot Water System Heat Source for Renovation Project. Water Supply Drain. 2024, 60, 109–111. [Google Scholar] [CrossRef]
- Kreith, F. Review of solar heating design by the F-chart method. Sol. Energy 1978, 20, 439–440. [Google Scholar] [CrossRef]
- Liu, K.; Cai, Y. Experimental Study on the Application of a New Type of Phase Change Thermal Storage Water Tank in Solar Energy Combination System. Energy Storage Sci. Technol. 2019, 8, 1230–1234. [Google Scholar]
- Wang, X.; Wang, Z.; Wang, Y. The current status and prospects of phase change material selection in air source heat pump energy storage systems. Energy Conserv. 2024, 43, 124–128. [Google Scholar]
- Zhu, S.; Li, D.; Zhang, M.; Wu, Y.; Zhao, X.; Meng, L. Analysis of Operation Characteristics of Floating Roof Oil Tank Solar Phase Change Temperature Maintenance System. Energy Sav. Technol. 2022, 40, 248–252. [Google Scholar]
- Zhu, S. Research on the Operation Characteristics of Solar Phase Change Thermal Storage and Temperature Maintenance System for Large Floating Roof Oil Tanks; Northeast Petroleum University: Daqing, China, 2022. [Google Scholar]
- Available online: https://www.rubitherm.eu (accessed on 10 November 2023).
- Li, B.; You, S.; Zhang, H.; Zheng, W. Testing and Analysis of Solar Compound Heat Pump Air Conditioning System Applied to Rural Residential Buildings. Build. Sci. 2013, 29, 12–16. [Google Scholar]


| Solar Energy Guarantee Rate f (%) | Collector Heat Collection Area Asolar (m2) | Circulating Water Pump Flow Rate qHTF (m3/h) |
|---|---|---|
| 10 | 1226.32 | 61.32 |
| 20 | 2452.64 | 122.63 |
| 30 | 3678.95 | 183.95 |
| 40 | 4905.27 | 245.26 |
| 50 | 6131.59 | 306.58 |
| Solar Collector | |||
|---|---|---|---|
| Solar Energy Guarantee Rate | Unit Price of Collector/Ten Thousand CNY/m2 | Area of Collector/m2 | Design Cost of Collector/Ten Thousand CNY |
| 10% | 0.05 | 1226.32 | 61.32 |
| 20% | 0.05 | 2452.64 | 122.63 |
| 30% | 0.05 | 3678.95 | 183.95 |
| 40% | 0.05 | 4905.27 | 245.26 |
| 50% | 0.05 | 6131.59 | 306.58 |
| Solar Energy Guarantee Rate | Annual Power Consumption of Water Pump/kWh | Annual Power Consumption of Sewage Source Heat Pump/kWh | Prices of Electricity/CNY/kWh | Operating Cost of Water Pump/Ten Thousand CNY | Operating Cost of Heat Pump/Ten Thousand CNY |
|---|---|---|---|---|---|
| 10% | 102,000 | 784,000 | 0.55 | 5.60 | 43.12 |
| 20% | 99,800 | 556,000 | 0.55 | 5.49 | 30.58 |
| 30% | 188,000 | 413,000 | 0.55 | 10.33 | 22.72 |
| 40% | 240,000 | 280,000 | 0.55 | 13.19 | 15.41 |
| 50% | 291,000 | 240,000 | 0.55 | 16.03 | 13.21 |
| Plan | Phase-Change Temperature Maintenance System Heating by Solar Source and Sewage Source Heat Pump | |||||
|---|---|---|---|---|---|---|
| Original Investment | Annual Operating Cost | Annual Total Investment Cost | ||||
| Solar Energy Guarantee Rate | Paraffin Cost/Ten Thousand CNY | Collector Cost/Ten Thousand CNY | Other Cost/Ten Thousand CNY | Operating Cost of Water Pump/Ten Thousand CNY | Operating Cost of Heat Pump/Ten Thousand CNY | |
| 10% | 120.12 | 61.32 | 8.5 | 5.60 | 43.12 | 238.66 |
| 20% | 120.12 | 122.63 | 8.5 | 5.49 | 30.58 | 287.32 |
| 30% | 120.12 | 183.95 | 8.5 | 10.33 | 22.72 | 345.62 |
| 40% | 120.12 | 245.26 | 8.5 | 13.19 | 15.41 | 402.48 |
| 50% | 120.12 | 306.58 | 8.5 | 16.03 | 13.21 | 464.44 |
| Plan | Original Investment/Ten Thousand CNY | Annual Operating Cost/Ten Thousand CNY | Annual Total Investment Cost/Ten Thousand CNY |
|---|---|---|---|
| Phase-change temperature maintenance system heating by solar source and sewage source heat pump | 435.2 | 29.24 | 464.44 |
| Phase-change temperature maintenance system heating by solar source | 380.2 | 39.1 | 419.3 |
| Temperature maintenance system heating by solar source | 357.3 | 59.6 | 416.9 |
| Temperature maintenance system heating by boiler | 96.5 | 131.9 | 228.4 |
| Plan | Annual Power Consumption/kW·h | Carbon Emission Factor/kg CO2/kWh | Annual Gas Consumption/m3 | Energy Conversion Coefficient × Carbon Emission Factor/kg CO2/m3 | Emissions of CO2/kg |
|---|---|---|---|---|---|
| Phase-change temperature maintenance system heating by solar source and sewage source heat pump | 531,000 | 0.71 | 0 | 2.137 | 377,010 |
| Phase-change temperature maintenance system heating by solar source | 300,041.3 | 0.71 | 48,839.8 | 2.137 | 317,400.0 |
| Temperature maintenance system heating by solar source | 300,041.3 | 0.71 | 51,847.7 | 2.137 | 323,828 |
| Temperature maintenance system heating by boiler | 311,330.4 | 0.71 | 331,724.9 | 2.137 | 929,941 |
Disclaimer/Publisher’s Note: The statements, opinions and data contained in all publications are solely those of the individual author(s) and contributor(s) and not of MDPI and/or the editor(s). MDPI and/or the editor(s) disclaim responsibility for any injury to people or property resulting from any ideas, methods, instructions or products referred to in the content. |
© 2025 by the authors. Licensee MDPI, Basel, Switzerland. This article is an open access article distributed under the terms and conditions of the Creative Commons Attribution (CC BY) license (https://creativecommons.org/licenses/by/4.0/).
Share and Cite
Zuo, Q.; Wu, Q.; Zhu, S. Analysis of Operation Characteristics of Phase-Change Temperature Maintenance System Heating by Solar Source and Sewage Source Heat Pump. Processes 2025, 13, 1676. https://doi.org/10.3390/pr13061676
Zuo Q, Wu Q, Zhu S. Analysis of Operation Characteristics of Phase-Change Temperature Maintenance System Heating by Solar Source and Sewage Source Heat Pump. Processes. 2025; 13(6):1676. https://doi.org/10.3390/pr13061676
Chicago/Turabian StyleZuo, Qingfu, Qing Wu, and Shangwen Zhu. 2025. "Analysis of Operation Characteristics of Phase-Change Temperature Maintenance System Heating by Solar Source and Sewage Source Heat Pump" Processes 13, no. 6: 1676. https://doi.org/10.3390/pr13061676
APA StyleZuo, Q., Wu, Q., & Zhu, S. (2025). Analysis of Operation Characteristics of Phase-Change Temperature Maintenance System Heating by Solar Source and Sewage Source Heat Pump. Processes, 13(6), 1676. https://doi.org/10.3390/pr13061676