Article

Photoautotrophic Production of Eicosapentaenoic Acid (EPA) with Nannochloropsis oceanica Under Dynamic Climate Simulations

1
Chair of Biochemical Engineering, School of Engineering and Design, Technical University of Munich, Boltzmannstr. 15, 85748 Garching, Germany
2
Werner Siemens-Chair of Synthetic Biotechnology, School of Natural Sciences, Technical University of Munich, 85748 Garching, Germany
3
TUM-AlgaeTec Center, Technical University of Munich, 82024 Taufkirchen, Germany
*
Author to whom correspondence should be addressed.
Processes 2025, 13(6), 1649; https://doi.org/10.3390/pr13061649 (registering DOI)
Submission received: 25 March 2025 / Revised: 12 May 2025 / Accepted: 14 May 2025 / Published: 24 May 2025
(This article belongs to the Special Issue Biochemical Processes for Sustainability, 2nd Edition)

Abstract

:
Marine microalgae from the genus Nannochloropsis are promising candidates for the photoautotrophic production of eicosapentaenoic acid (EPA, C20:5), a polyunsaturated fatty acid known for its numerous health benefits. A recent study demonstrated that Microchloropsis salina can accumulate high amounts of EPA when cultivated in flat-plate gas-lift photobioreactors. This study aimed to characterize an alternative strain, Nannochloropsis oceanica, and compare its biomass and EPA productivity to M. salina. Applying simulated dynamic climate conditions of a repeated sunny summer day in Eastern Australia, N. oceanica was cultivated in LED-illuminated flat-plate gas-lift photobioreactors. The results showed significantly higher biomass growth and EPA contents compared to M. salina. An EPA productivity of 33.0 ± 0.6 mgEPA L−1 d−1 has been achieved in batch processes with N. oceanica. Scaling up the photoautotrophic process to 8 m2 thin-layer cascade photobioreactors resulted in doubled concentrations of N. oceanica biomass compared to laboratory-scale batch processes. This improvement was likely due to the reduced fluid layer depth, which enhanced light availability to the microalgal cells. Using urea instead of nitrate as a nitrogen source further improved the EPA production of N. oceanica in thin-layer cascade photobioreactors, achieving CDW concentrations of up to 17.7 g L−1 and thus a high EPA concentration of 843 mg L−1. These findings highlight N. oceanica as an alternative to M. salina for sustainable EPA production, offering potential for further industrial applications.

1. Introduction

The polyunsaturated long-chain omega-3 fatty acid eicosapentaenoic acid (EPA, C20:5) has been associated with many health benefits regarding cardiovascular and inflammatory diseases [1,2,3]. Cold water fish, such as salmon and herring, contain a high amount of EPA and are among the traditional sources of this valuable fatty acid [4]. The recommended daily intake of 500 mg EPA (+DHA) requires an annual demand of 1.4 million tonnes for global supply [5,6]. However, only approximately 60% of this demand can currently be met through capture fisheries, primarily in the form of food fish, fish oil, and fish meal, resulting in a tremendous gap between demand and supply [7]. Decades of overfishing have caused sustainable fish stocks to stagnate, leading to a fivefold increase in aquaculture production from the 1990s to 2022 to bridge this gap [8]. Nevertheless, aquaculture also relies on fish oil and fish meal, highlighting the need for alternative EPA producers.
EPA is primarily produced by marine micro-organisms, particularly microalgae, making them the main producers of omega-3 fatty acids in the marine food chain [9]. This positions microalgae as a sustainable alternative for omega-3 fatty acid production.
Over the past decades, many potential microalgae species for EPA production have been examined. Key elements for industrial and large-scale EPA production are a high EPA amount, scalability of the process, and the possibility of cultivation in open reactor systems under realistic climate conditions [10,11]. Strains belonging to the genus Nannochloropsis sp. and Microchloropsis sp. have been reported to be good EPA producers, with EPA contents of up to 12% of the dry weight [12]. Especially N. oculata and N. oceanica have been shown to accumulate high amounts of the polyunsaturated fatty acid EPA under indoor and outdoor conditions. N. oceanica CY2, when cultivated photoautotrophically in an indoor 5 L plastic bag at a constant temperature of 25 °C, reached a maximal EPA productivity of 10.54 mg L−1 d−1 [13]. Maximal EPA share contents of 29.45% ± 0.41% (w/w) of the total fatty acid (TFA) were reached with N. oceanica CCAP 849/10 in spring in the Algarve using open raceway ponds with a total area of 28 m2 [14]. N. oculata UTEX2164 achieved high EPA share contents of 33% TFA when supplemented with nitrate during the process [15]. In addition to high EPA accumulation, high biomass growth is equally important. Strains from the genus Nannochloropsis have been successfully cultivated in large-scale photobioreactors, demonstrating high maximum biomass productivity [16,17,18].
In microalgae, de novo fatty acid synthesis begins in the chloroplast by converting acetyl-CoA to malonyl-CoA, producing palmitic acid (C16:0) via the fatty acid de novo synthesis (FAS) pathway. Following elongation to stearic acid (C18:0), polyunsaturated fatty acids like EPA are synthesized through the n-6 or n-3 pathway, which occurs in the mitochondria and endoplasmic reticulum via desaturation and elongation processes [19,20]. Approximately 5–20% of the dry cell weight of microalgae consists of glycerol-based membrane lipids, primarily glycosyl glycerides in the chloroplast and phosphoglycerides in the plasma membrane. Polyunsaturated fatty acids are the main constituent of the membrane lipids [21]. Nitrogen starvation induces lipid accumulation of mostly saturated or mono-unsaturated fatty acids in the form of triacylglycerol, serving as a carbon and energy storage compound [22,23]. Polyunsaturated fatty acids are mainly produced under optimal growth conditions [21]. Many studies have shown increased polyunsaturated fatty acid production during nitrogen-replete conditions associated with biomass growth. In contrast, nitrogen-limited conditions lead to a biomass growth stop and lipid accumulation induction as a stress response [24,25,26]. Consequently, high biomass growth is crucial for high EPA production. The nitrogen source is a main factor affecting microalgae biomass and EPA production. Increased biomass growth has been observed in several studies using urea as a nitrogen source [27,28].
Microalgal cultivation can be carried out in closed and open photobioreactors. Controlled temperature and light conditions, small area requirements, lower contamination risk, and higher biomass productivity are advantages of closed photobioreactors [11,29]. The most common types of closed photobioreactors are tubular reactors with glass or transparent plastic tubes and flat plate reactors. In flat plate reactors, the microalgal suspension is mixed by air bubbling and is exposed directly to sunlight or artificial LED light [10]. A highly illuminated surface area and a small light path allow high biomass concentrations [30,31]. Closed photobioreactors are often used in lab-scale experiments or to produce high-value products due to their high operational costs [11]. Open circular or raceway ponds are commonly used for commercial, large-scale microalgae production. One of the main advantages is the direct use of sunlight. Despite their low operational costs, they achieve low cell densities due to limited light availability caused by increased layer thickness (20–25 cm), insufficient mixing, and poor CO2 supply [32]. Nevertheless, high aerial productivity is crucial regarding the economic aspects of open cultivation systems. Thin-layer cascade reactors are designed to maintain a fluid layer depth of less than 1 cm, resulting in a high surface-to-volume ratio that significantly enhances light availability for algal cells [10]. The first thin-layer cascade reactor has been described by Šetlík et al. (1970) [33], and high cell densities of 30–50 g L−1 dry cell mass have been reported using this reactor system outdoors [33,34,35,36]. Apel et al. (2017) [37] designed an improved and scalable thin-layer cascade reactor located in the TUM AlgaeTec Center, a facility that allows the investigation of microalgae growth under the physical simulation of variable climate conditions. The strain M. salina has been successfully cultivated photoautotrophically with these thin-layer cascade reactors with surface areas of up to 50 m2 by applying a climate simulation of a repeated Mediterranean summer day in Almeria, Spain, with maximal average daily areal productivities of up to 27 g m−2 d−1 [18,26,38,39].
To make EPA production with microalgae economically viable, a microalgae strain with high biomass and EPA productivity is crucial. Additionally, the strain should be cultivable in open photobioreactors under realistic climate conditions to reduce production costs. For this purpose, the strain Nannochloropsis oceanica, described in the literature as an excellent EPA producer, will be investigated regarding its biomass and EPA productivity in open and closed reactor systems. In the first part of the research, N. oceanica will be cultivated in closed flat-panel gas-lift photobioreactors (FPR) under controlled conditions using various nutrient concentrations and nitrogen sources. Subsequently, biomass growth and EPA production will be studied in open thin-layer cascade reactors (TLC) with a surface area of 8 m2 to verify industrial application.

2. Materials and Methods

2.1. Strain and Reaction Media

The unicellular and marine microalgae strain Nannochloropsis oceanica CCAP849/10 was obtained from the Culture Collection of Algae and Protozoa from the Scottish Association for Marine Science (Argyll, UK). Modified f/2 media with adapted nitrogen and phosphorus levels prepared with artificial seawater (ASW) was used for all lab and semi-technical-scale batch processes. Sodium nitrate (1.8 g L−1) or urea (0.8 g L−1) served as a nitrogen source, while disodium hydrogen phosphate dihydrate (0.2 g L−1) was used as a phosphorus source. The artificial sea water (ASW) was composed of NaCl (25 g L−1), MgCl2 (5.2 g L−1), NaSO4 (4.09 g L−1), CaCl2 (1.16 g L−1), KCl (0.695 g L−1), NaHCO3 (0.201 g L−1), KBr (0.101 g L−1), H3BO3 (0.027 g L−1), and NaF (0.003 g L−1) (Lake Products Company, Florissant, MO, USA).

2.2. Seed Cultures and Pre-Cultures in Bubble Column Reactors

Seed cultures were maintained in 200 mL Erlenmeyer shaking flasks filled with sterile f/2 media with nitrate as a nitrogen source under laboratory light and temperature. Pre-cultures for the batch processes in flat-plate gas-lift photobioreactors were grown in a modified Infors incubator system (Infors, Bottmingen, Switzerland) in 250 mL bubble column reactors without reflecting light tubes [40] at a continuous light irradiance of 83 ± 17 μmol m−2 s−1 and a constant temperature of 25 °C. A continuous gassing rate of 12 L h−1 with 5% CO2 ensured carbon dioxide supply and culture mixing. Reaching the late exponential phase at OD750 of approximately 3–4, the flat-plate gas-lift photobioreactors were inoculated.

2.3. Cultivation in Flat-Plate Gas-Lift Photobioreactors

Sterilized 1.8 L flat-plate gas-lift photobioreactors with an illuminated surface area of 0.09 m2 and a light pathway of 2 cm were used for all batch processes in the lab scale (Figure 1, left). Two hundred sixty high-performance LEDs provided light irradiation of the culture with a characteristic spectrum in the visible range of light (400–800 nm). Temperature control was ensured by a temperature chamber attached to the light-averted side of the reactor. The controlled addition of CO2 (0–10%) at a constant gassing rate of 2 L min−1, which also ensured the mixing of the culture, enabled pH control with a set point of pH 8.0. Dissolved oxygen and pH measurements were performed using optical sensors (VisiFerm DO ECS 120 H0 and Easyferm Plus ARC, Hamilton Germany GmbH, Hoechst, Germany). Temperature and light irradiance were set according to the data of the used climate simulation. The photobioreactors were inoculated to an initial OD750 of 0.2.
Under the same process conditions, cultures from the flat-plate gas-lift photobioreactors were used to inoculate the 4 m2 thin-layer cascade photobioreactors (Figure 1, right) at the TUM AlgaeTec Center once they reached a cell dry weight concentration of 6 g L−1.

2.4. Climate Simulation and AlgaeTec Center

A physically dynamic climate simulation of a daily repeated sunny summer day in eastern Australia (19 January 2018) reaching a maximal temperature of 30 °C and a maximal incident PAR photon flux density (PPFD) during the day of 2000 µmol m−2 s−1 was applied for all batch processes in the lab scale and the semi-technical scale. The photon flux density and air temperature data have been shown previously [41]. For the simulation in the lab-scale flat-plate gas-lift photobioreactors, the measured light intensity and temperature data were fitted through 3rd- and 6th-degree polynomial functions.
All batch processes at the semi-technical scale were conducted at the TUM AlgaeTec Center in Ottobrunn, Germany, a facility designed for microalgae cultivation under realistically simulated light and air conditions. The TLC reactors, located in glass halls, were exposed to natural sunlight. To supplement the local irradiance, LEDs (FutureLED, Berlin, Germany) mounted on each reactor provided artificial light in the photosynthetically active range of 400–700 nm, adjusting the current irradiance set point according to the climate simulation. Air temperature was controlled by the air conditioning system or through natural ventilation via automated window openings. The TUM-AlgaeTec Center and the climate simulation have been previously described [37].

2.5. Cultivation in Thin-Layer Cascade Photobioreactors

All batch processes on the semi-technical scale were operated in 8 m2 (55 L) thin-layer cascade photobioreactors that consisted of two 4 m × 1 m polyethylene channels in opposite directions with an inclination of 1° and a fluid layer depth of 5.5 ± 1.4 mm (Figure 1, right). A flow reversal module connected the two channels, with a retention tank positioned at the lower end and an inlet module at the upper end. The circulation of the algae suspension at a volume flow of 2.4 L s−1 was conducted by a centrifugal pump (MKPG, Ventaix, Monschau, Germany). Liquid level sensors (LFFS, Baumer, Friedberg, Germany) and pH sensors (tecLine 201020/51-18-04-18-120, Jumo, Fulda, Germany) were installed in the retention tank. Adding pure CO2 through perforated hoses (Solvocarb, Linde, Pullach, Germany) in the retention tank ensured pH control at pH 8.0. To compensate for water loss due to evaporation, a magnetic valve controlled by the level sensor added tap water to the retention tank. Before starting an experiment, the retention tank was filled with tap water, and media components were added. Circulation ensured the dissolution of all added salts.
A structurally identical 4 m2 thin layer cascade photobioreactor, operated at a constant air temperature of 25 °C and a 70% reduced light irradiance according to the climate data of 19 January 2018 in Newcastle, Australia, was used for pre-culture preparation. The reduced light intensity was intended to avoid photoinhibition and slow down the growth of the culture. The reactor was regularly diluted with fresh media to keep the culture in the early linear growth phase. The 8 m2 photobioreactor was inoculated with an initial OD750 of 1.0 with the pre-culture. Apel et al. (2017) [37] have given a detailed description of the TLC.

2.6. Determination of Optical Density and Cell Dry Weight Concentration

The optical density (OD750) was measured in triplicate using a UV-Vis-Spectrometer (Genesys 10 UV–Vis, Thermo Fischer, Waltham, MA, USA). A 2.5% (w/w) NaCl solution served for the sample dilution and as a blank. The cell dry weight concentration was determined gravimetrically in triplicate using glass microfiber filters (GF/C, Whatman, GE Healthcare, Düsseldorf, Germany). Pre-dried filters were weighed, filled with a defined volume of the microalgae suspension, and rinsed with distilled water. Afterward, they were dried for 48 h to ensure mass consistency and weighed again. The cell dry weight concentration was determined by calculating the weight difference before and after sample loading.

2.7. Determination of Nitrate and Urea Concentrations, and Salinity

The nitrate concentration was measured photometrically in the supernatant of a centrifuged sample (14,500× g, 4 min, Espresso, Thermo Fisher, Waltham, MA, USA) using a calorimetric enzyme assay (Enzytec™ Liquid NitrateR-Biopharm, Darmstadt, Germany). The assay was based on the enzyme nitrate reductase, which enabled the reduction of nitrate to nitrite. A urea/ammonia assay (Enzytec™ Liquid Urea/Ammonia, R-Biopharm, Darmstadt, Germany) was used to determine the remaining urea concentration in the supernatant of the sample. The photometric measurement relied on a coupled enzymatic reaction of urease and glutamate dehydrogenase, where urea is converted to ammonia. A temperature compensation refractometer (Hanna Instruments, Deutschland GmbH, Vohringen, Germany) was used for salinity measurements in ppt.

2.8. Determination of EPA Concentration and Microalgae Content

For EPA content determination, a biomass sample volume of 10–25 mL was frozen at −80 °C, lyophilized at −50 °C and 0.12 mbar for 48 h (Lyophilizer Alpha 1–2 LD plus, Martin Christ Gefriertrocknungsanlagen GmbH, Osterode am Harz, Germany), and transferred into 10 mL analysis vials. As previously described, an adapted extraction and transesterification protocol was performed [30]. A gas chromatograph with a fused silica FAMEWAX column (Restek GmbH, Bad Homburg, Germany) was used to separate the fatty acid methyl esters (FAME). A detailed description of the gas chromatograph conditions has already been given [41]. A marine oil mix (Marine Oil FAME Mix, C14:0 to C24:1, Restek GmbH, Bad Homburg, Germany) was used as an external standard for peak identification. A C12-TAG (Sigma-Aldrich, Saint Louis, MO, USA) was selected as an internal standard. The EPA concentration was measured by calculating the ratio of its peak area to the total peak area. The EPA content was determined by relating the EPA concentration to the actual cell dry weight concentration.

3. Results and Discussion

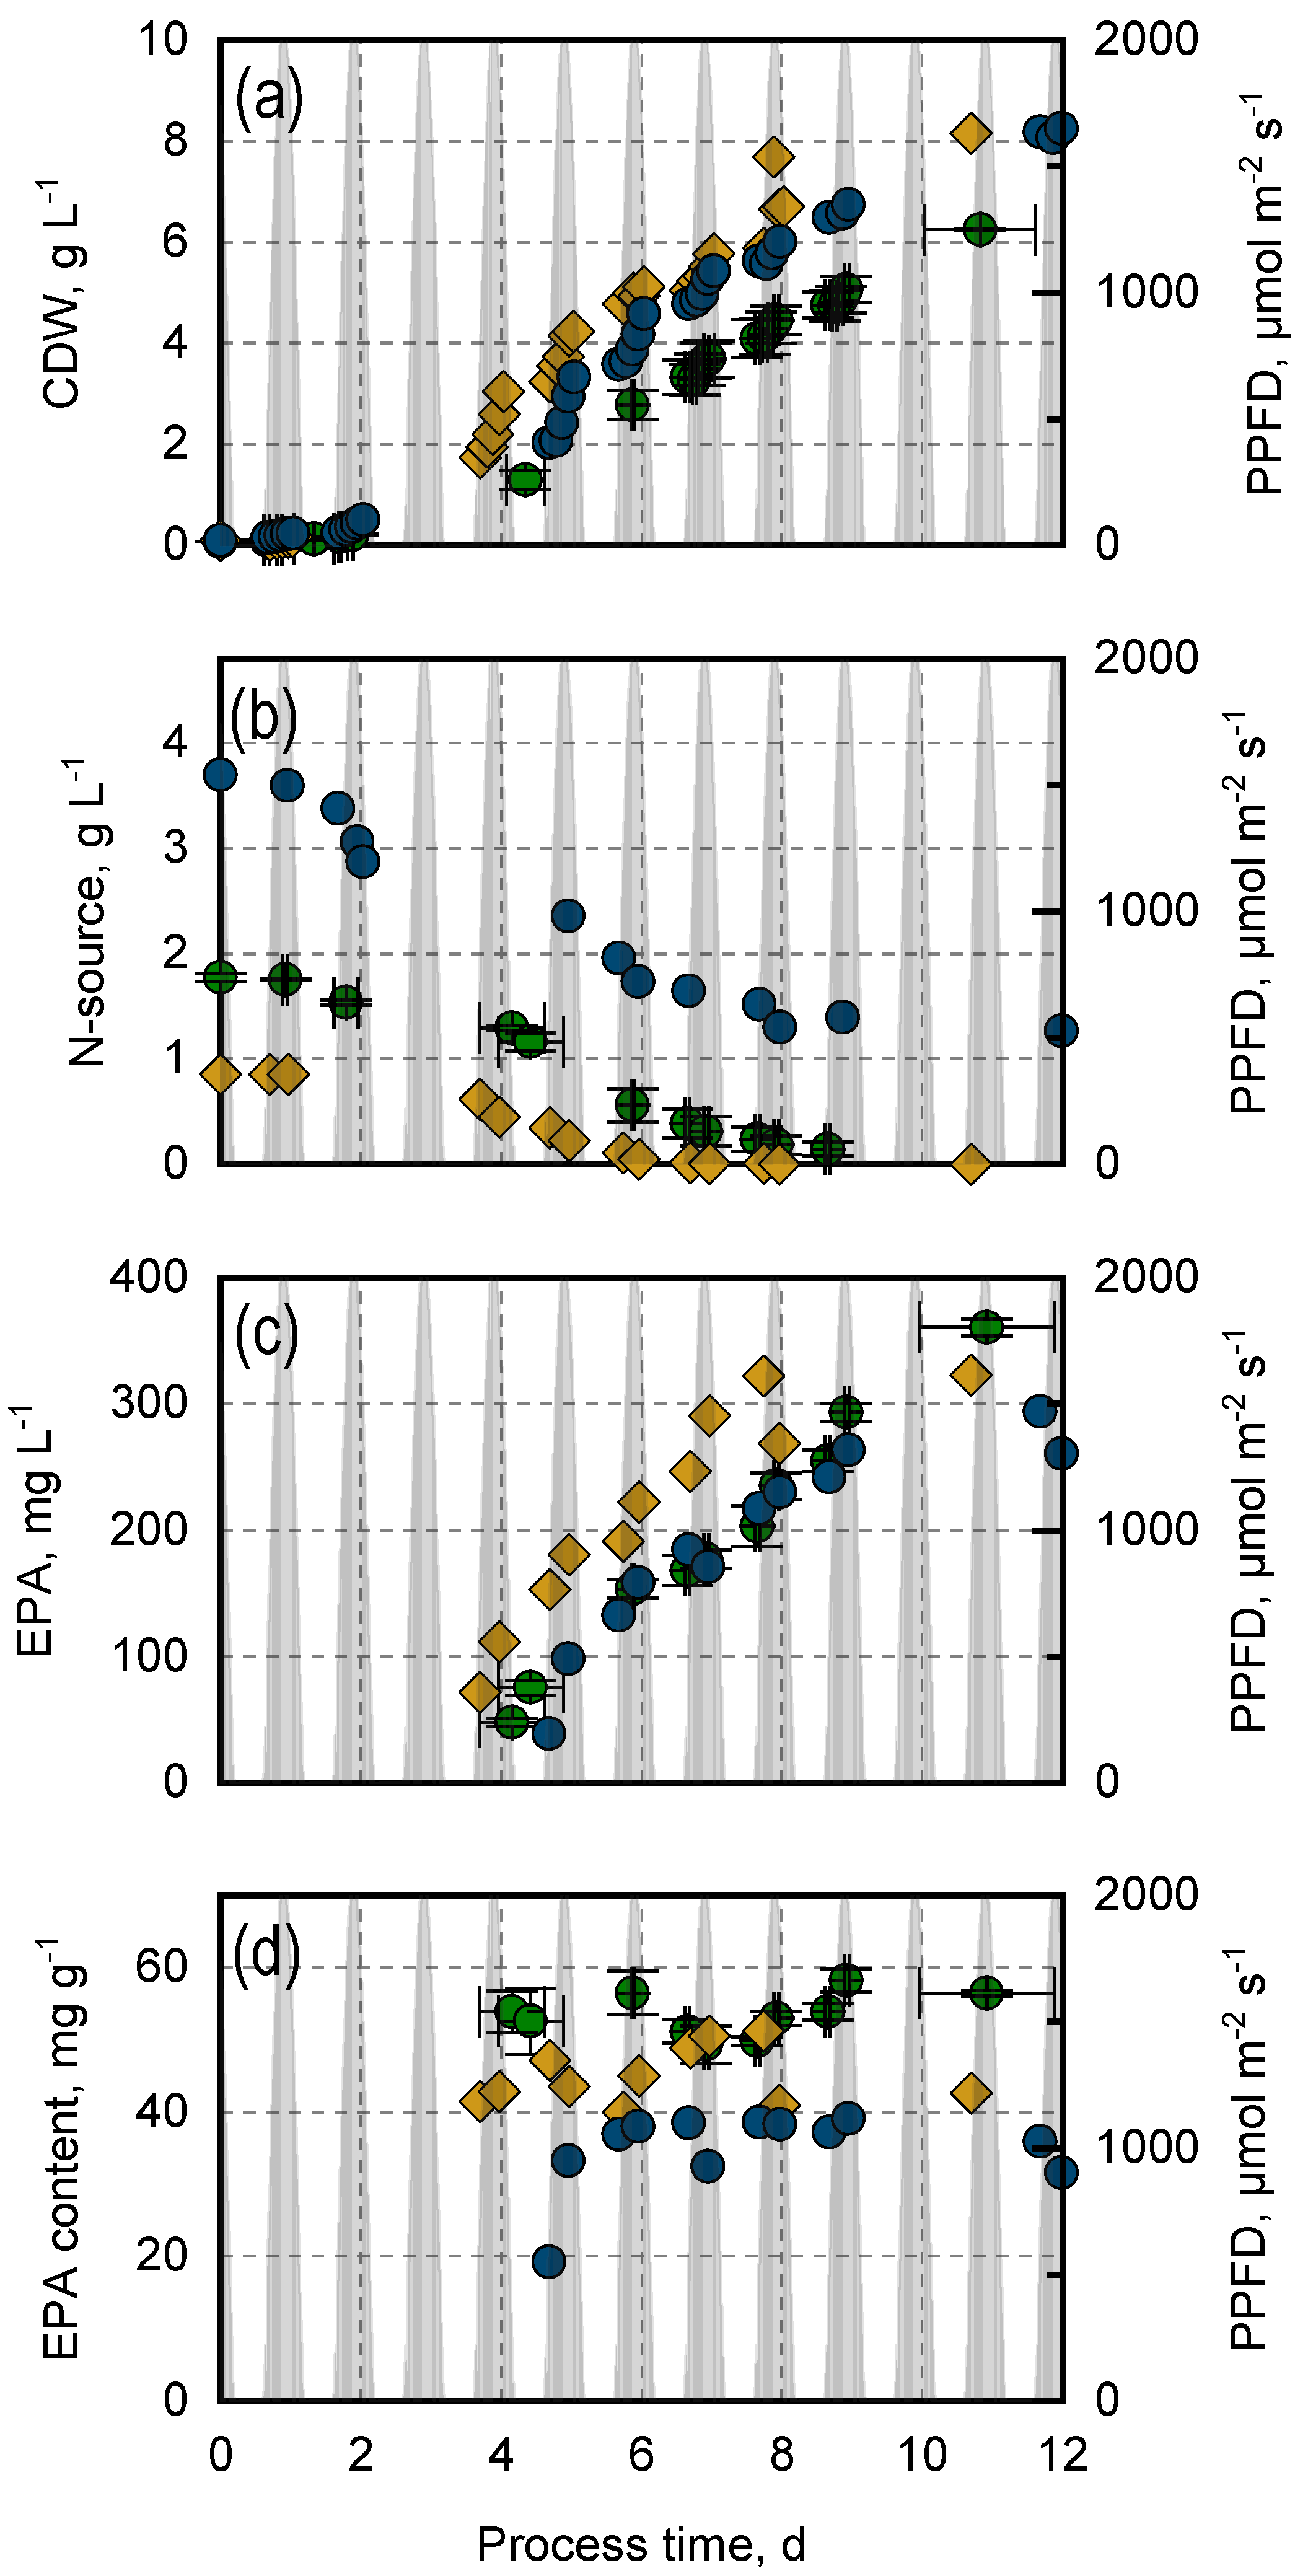
3.1. Photoautotrophic Biomass Growth and EPA Production in Closed Flat-Plate Gas-Lift Photobioreactors with N. oceanica Compared to M. salina

To achieve efficient EPA production on an industrial scale, it is crucial to identify a strain capable of high biomass growth and substantial EPA accumulation. In this context, we investigated the EPA-producing strain Nannochloropsis oceanica in controlled flat-plate gas-lift photobioreactors, applying a dynamic climate simulation of a repeated sunny summer day in eastern Australia. An initial nitrate concentration of 1.8 g L−1 was used. The biomass and EPA production of N. oceanica were then compared to the performance of Microchloropsis salina, a strain previously studied in earlier research [28,41] (Figure 2). After a process time of eleven days, when the initially supplied nitrate was entirely consumed, N. oceanica reached a total cell dry weight concentration of 6.3 ± 0.0 g L−1. The batch processes were stopped after depletion of the nitrogen source because EPA production is associated with biomass growth.
With increasing biomass concentration and decreasing nitrate concentration, the EPA concentration increased throughout the process, reaching a maximum EPA concentration of 360 ± 7 mg L−1 at the end of the photoautotrophic batch process. The EPA content of the microalgae stayed constant throughout the process, achieving a maximum of 58 ± 2 mg EPA g−1 dry cell mass on day 9. The EPA productivity increased as nitrate concentrations decreased and remained stable when nitrate levels dropped below 0.3 g L−1 (Figure 3). The maximal achieved space-time yield of EPA (STYEPA) was 33.0 ± 0.6 mg L−1 d−1. A study with N. oceanica in flat plate gas lift photobioreactors at a constant temperature of 25 °C and a light-night cycle of 16 h: 8 h reported similar EPA contents of approximately 60 mg g−1 [25]. Another study with Nannochloropsis sp. reached maximal EPA contents of 49 ± 3.9 mg g−1 when cultivated in a 400 mL flat-plate photobioreactor with a light path of 14 mm under nitrogen-replete conditions and constant light and temperature conditions [42]. In a previous study, the EPA-producing strain M. salina was cultivated using the same process conditions [41] (data is shown in Figure 2). Compared to the batch process with M. salina, N. oceanica achieved a 17% ± 2% higher cell dry weight concentration after a process time of eleven days. A slightly higher use of the nitrogen source nitrate has also been observed. Regarding the ability of EPA accumulation, a 41% ± 4% higher EPA concentration and a 17% ± 0% higher EPA content were observed in the batch process with N. oceanica (Table 1). The EPA content in M. salina increased as nitrate levels decreased, whereas a stable EPA content throughout the process was observed with N. oceanica. The EPA productivity of N. oceanica with a maximal STYEPA of 33.0 ± 0.6 mgEPA L−1 d−1 is 1.4-fold higher than the STYEPA of M. salina on the same day (23.7 ± 0.1 mgEPA L−1 d−1). Overall, N. oceanica showed higher biomass and EPA productivity than M. salina. Given the importance of high EPA content and biomass growth for industrial-scale EPA production, further investigations on N. oceanica were conducted.
Figure 2. Photoautotrophic batch processes with N. oceanica () and M. salina () in flat-plate gas-lift photobioreactors applying dynamically simulated climate conditions of a repeated sunny summer day in eastern Australia (19 January 2018, Newcastle); the PPFD is indicated as a grey shaded area. (a) Cell dry weight concentration, (b) nitrate concentration, (c) EPA concentration, and (d) EPA content of the biomass. The batch processes were operated at pH 8.0, an initial nitrate concentration of 1.8 g L−1, and a working volume of 1.8 L. Error bars indicate the min-max values of two batch processes (N. oceanica) or the standard deviation of three batch processes (M. salina). The data with M. salina has already been published in Thurn et al. (2022) [41].
Processes 13 01649 g002
Figure 3. EPA space-time yield in mg L−1 d−1 of batch processes with N. oceanica () and M. salina () in 1.8 L flat-plate gas-lift photobioreactors under physically dynamic climate conditions of a repeated sunny summer day in Australia; the PPFD is indicated as a grey shaded area. An f/2 medium with an initial nitrate concentration of 1.8 g L−1 was used. Error bars indicate the min-max values of two batch processes (N. oceanica) or the standard deviation of three batch processes (M. salina). The data with M. salina has already been published in Thurn et al. (2022) [41].
Processes 13 01649 g003
Table 1. Comparison of cell dry weight concentration and EPA production of batch processes with N. oceanica (n = 2) and M. salina (n = 3) in 1.8 L flat-plate gas-lift photobioreactors under dynamic climate simulation.
t = 11 dN. oceanicaM. salina
CDW, g L−16.3 ± 0.05.4 ± 0.5
EPA, mg L−1360 ± 7255 ± 23
EPA content, mg g−156 ± 048 ± 1
STYEPA, mg L−133.0 ± 0.623.7 ± 0.1

3.2. Variation of Nitrogen Concentration and Nitrogen Source in Photoautotrophic Batch Processes with N. oceanica

EPA production is associated with biomass growth. Therefore, we aimed to determine whether increasing the initial nitrate concentration would improve biomass production and EPA accumulation. To this end, a batch process with N. oceanica was conducted using a doubled initial nitrate concentration (3.6 g L−1). The concentrations of phosphate, trace elements, and vitamins were proportionally increased. The results for cell dry weight concentration, EPA concentration, and EPA content are presented in Figure 4.
As expected, N. oceanica showed a higher biomass growth when cultivated with increased nitrate levels in the media, resulting in a higher final cell dry weight concentration of 8.3 g L−1. Reaching a cell dry weight concentration of approximately 6 g L−1, the nitrate consumption ceased, resulting in a residual nitrate concentration of approximately 1 g L−1. However, further biomass growth from days 8 to 12 was observed. The additional biomass growth without nitrate consumption can be explained by an accumulation of saturated lipids as the total lipid content increased (data shown in Supplementary Materials). Light limitation due to high biomass concentrations may explain the lack of consumption of the remaining nitrate. Despite the higher biomass growth, both batch processes achieved similar EPA concentrations during the first eight days of nitrogen consumption. The EPA content of the batch process with doubled nitrate levels (EPA contentaverage: 37 ± 6 mg g−1) was decreased compared to the reference process (EPA contentaverage: 53 ± 3 mg g−1). No increase in EPA accumulation was observed due to the higher initial nitrate levels.
Another approach to increase biomass concentration and, consequently, EPA accumulation may be to use urea as a nitrogen source instead of nitrate. A previous study with Nannochloropsis oceanica and Isochrysis galbana in co-culture demonstrated an 80% increase in EPA accumulation and a 46% increase in biomass concentration [28]. Additionally, other studies have reported enhanced biomass growth with Nannochloropsis strains when using urea as a nitrogen source [27,43].
A batch process with N. oceanica was performed using urea instead of nitrate (nitrogen concentration of 400 mg L−1) (Figure 4). Compared to the process with nitrate, N. oceanica achieved a 30% higher biomass concentration by day 11 with 8.2 g L−1. Further, the initially supplied urea was depleted after a process time of 6 days, two days earlier than in the process with nitrate. The EPA concentration increased until day 7 and remained constant until the end of the process. An average EPA content of 43 ± 4 mg g−1 was achieved in the batch process with urea, which was lower than in the nitrate process (53 ± 3 mg g−1). A batch process with M. salina using urea in a flat-plate gas-lift photobioreactor and applying the same climate conditions also resulted in increased biomass concentrations but a decreased EPA content [28]. Nevertheless, aiming for a large-scale industrial production of EPA, a batch process using urea is favorable due to its advantages, such as lower cost, bioenergetically facilitated assimilation by microalgae resulting in higher biomass concentrations, and its capacity to enhance CO2 efficiency in open photobioreactors [39,44].
Overall, increasing the nitrate concentration or using urea instead of nitrate led to higher biomass concentrations of N. oceanica in photoautotrophic batch processes but did not increase the EPA content.

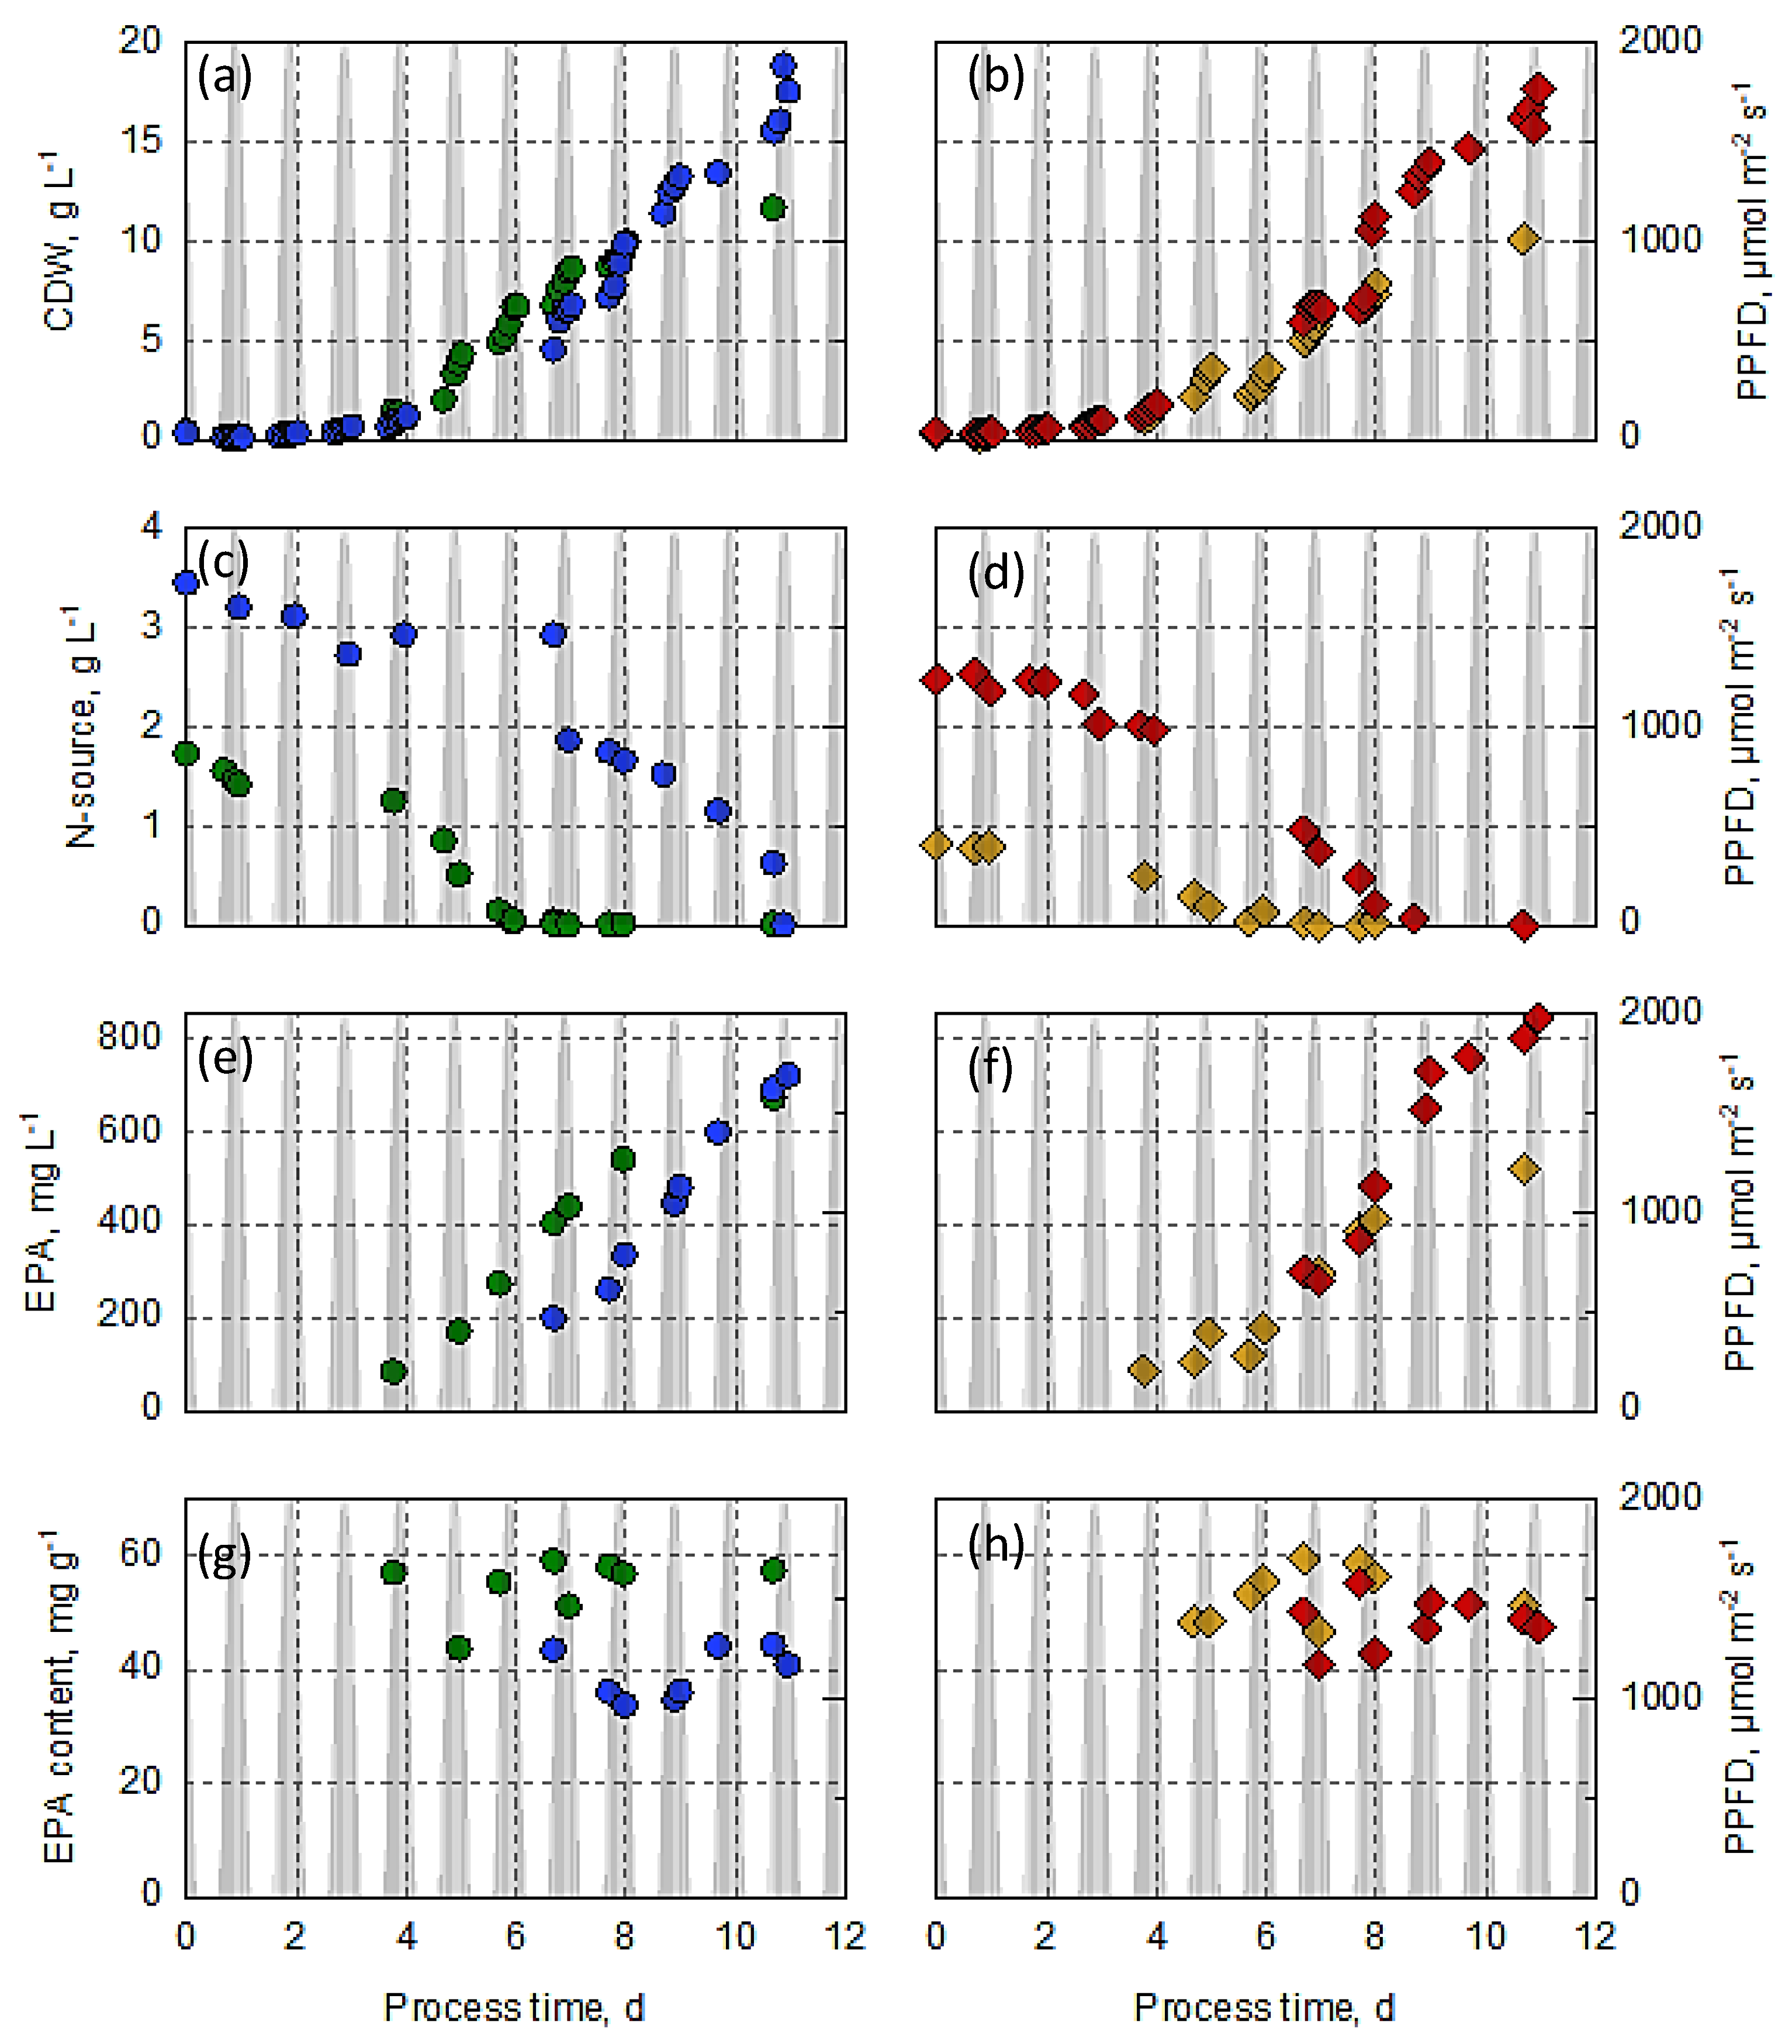
3.3. Production of EPA in Open Thin-Layer Cascade Reactors with N. oceanica, Varying the Nitrogen Source and Concentration

To assess biomass growth and EPA production of Nannochloropsis oceanica in open reactors under simulated climate conditions on a semi-technical scale, two batch processes were carried out in open thin-layer cascade photobioreactors, applying the same dynamic climate simulation of a repeated sunny summer day in eastern Australia. Nitrate and urea were evaluated as nitrogen sources, each supplied in equimolar ratios equivalent to 400 mg L−1 of nitrogen. Figure 5 illustrates the cell dry weight concentrations, nitrogen source consumption, and EPA production of the photoautotrophic batch processes.
Similar biomass growth was observed within the first 5 days of both batch processes. However, a technical failure in the reactor’s evaporation control system in the urea batch process on day 5 led to an overnight biomass reduction. This loss was caused by a damaged magnetic valve, resulting in constant water addition and subsequent reactor dilution at night. As a result, the urea batch process displayed reduced biomass concentrations for the rest of the cultivation process. Consequently, the batch process with nitrate achieved a higher final cell dry weight of 11.7 g L−1, compared to 10.1 g L−1 in the urea process. The supplied nitrogen source was entirely consumed in both processes within six days. Nitrogen consumption and biomass growth were associated with increasing EPA concentrations, while the EPA contents of the microalgae remained consistent throughout the process. Due to the reduced biomass concentration, the EPA concentration in the batch process with urea was slightly lower than in the nitrate process. However, the EPA content of the biomass (as a percentage of CDW) was comparable: the batch process with nitrate achieved an overall EPA content of 57 ± 5 mg g−1, and the urea batch process reached a constant EPA content of 53 ± 5 mg g−1. Overall, no significant influence of the nitrogen source has been observed regarding biomass growth and EPA production of N. oceanica in open photobioreactors.
Further, we wanted to evaluate the influence of the nutrient concentration on biomass and EPA production on a large scale. Therefore, two more batch processes were performed with increased concentrations of nitrate (2-fold) and urea (3-fold). Urea levels were increased 3-fold due to its rapid consumption in the batch process in closed photobioreactors. Despite higher nitrogen levels in the batch process with urea, similar final cell dry-weight concentrations of 18.9 g L−1 (nitrate) and 17.7 g L−1 (urea) were reached. In both batch processes, an increase in nutrient levels resulted in higher final biomass concentrations. However, increasing the nitrate concentration did not lead to higher EPA concentrations and caused a decrease in EPA content. On the other hand, increasing the urea concentration led to a rise in the final EPA concentration. Nevertheless, the EPA content decreased slightly.
The comparison of biomass growth and EPA production with N. oceanica under varying nitrogen concentrations and sources on a semi-technical scale revealed mixed results: A higher nitrate concentration led to an increase in CDW but caused a decrease in EPA concentration during the first eight days. Consequently, increasing the nitrate concentration resulted in a lower EPA content. In the batch process with a threefold urea concentration, a higher CDW and EPA concentration was achieved compared to the batch process with the basic urea concentration. Overall, the highest EPA concentration of 843 mg L−1 was observed in cultures supplemented with elevated urea concentrations. However, N. oceanica exhibited a higher EPA content when grown in media with lower nitrogen concentrations, regardless of the nitrogen source. Thus, an increase in nutrients resulted in higher cell dry weight concentrations and, in the case of urea, in elevated EPA concentration, but did not improve the EPA content of the microalgae.
A batch process with M. salina in open thin-layer cascade reactors applying similar climate conditions (Almeria, Spain) using urea as a nitrogen source with an initial concentration of 0.9 g L−1 achieved a cell dry weight concentration of approximately 10 g L−1 after a process time of 10 days [26]. We reached similar biomass concentrations with N. oceanica using the same amount of urea, showing that the strain is an alternative for large-scale biomass production. However, our lab-scale photobioreactor experiments showed a higher EPA productivity with N. oceanica compared to M. salina, making N. oceanica an interesting strain for EPA production in open photobioreactors.

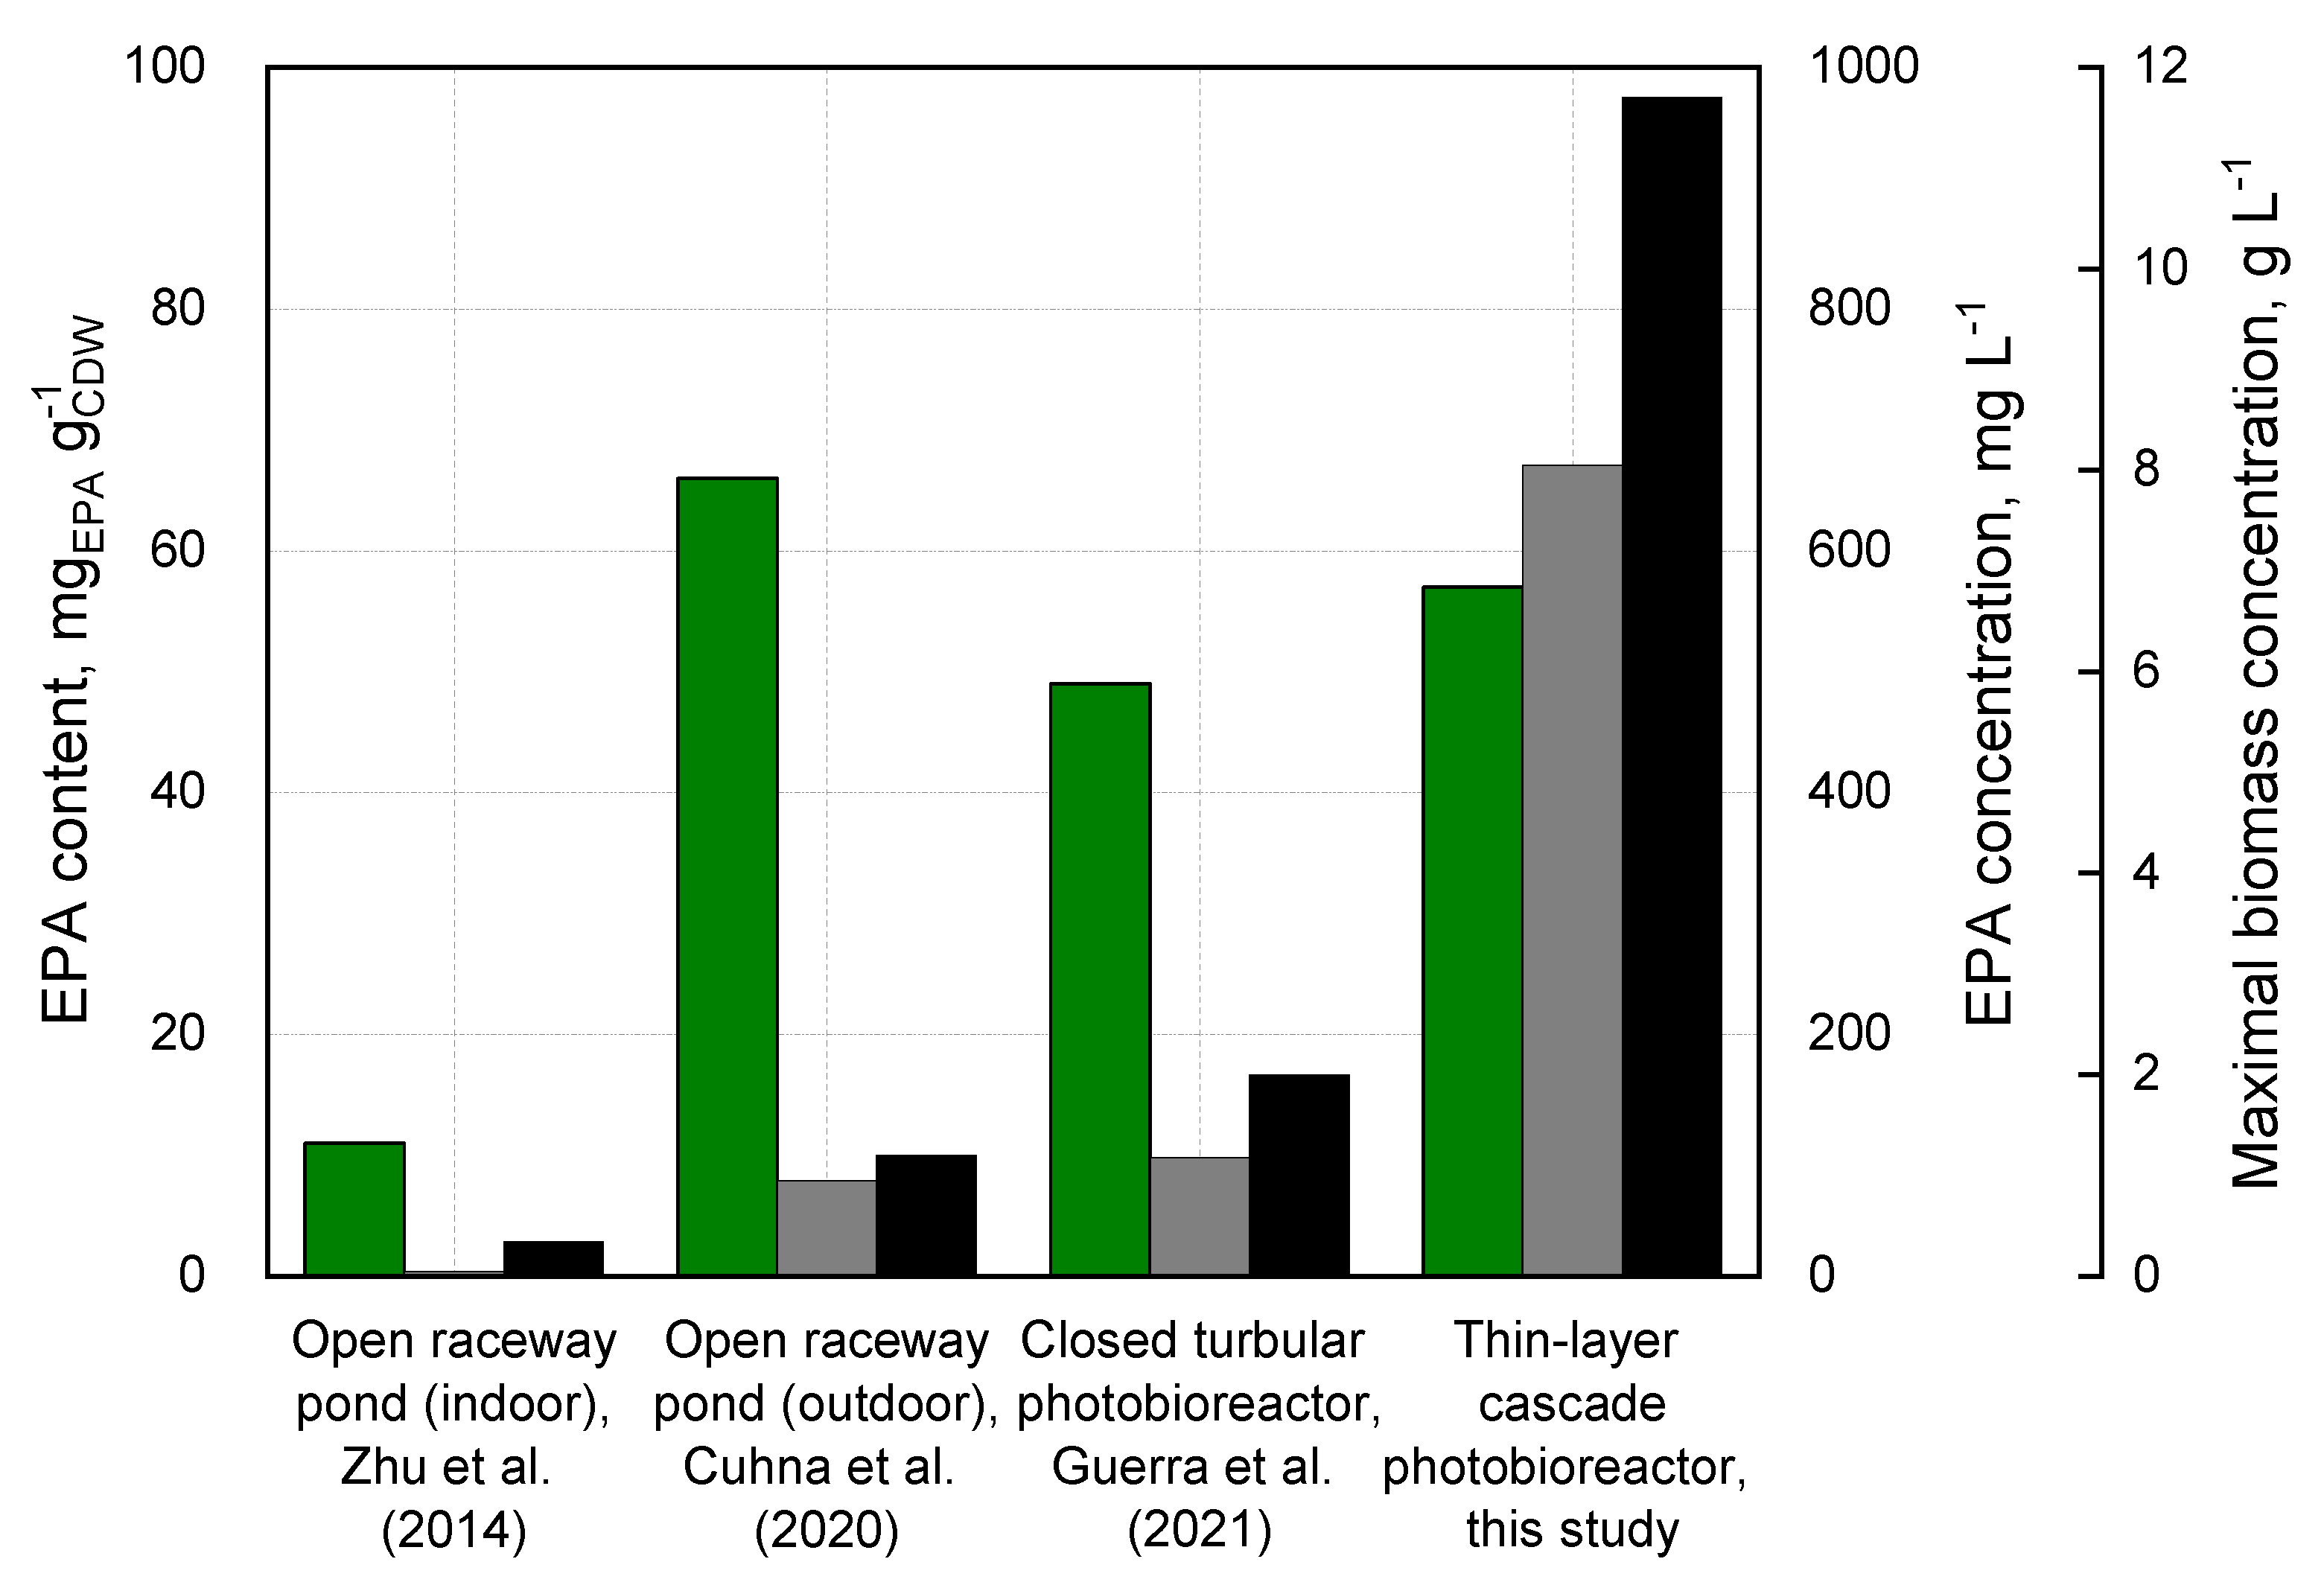
3.4. Comparison of Biomass and EPA Production in Open and Closed Photobioreactors

In this research, N. oceanica was cultivated in closed 1.8 L flat-plate gas-lift photobioreactors and open 8 m2 thin-layer cascade photobioreactors. The main technical differences between these two reactor types are summarized in Table 2.
The photoautotrophic batch cultivation of N. oceanica in an open thin-layer cascade photobioreactor applying the same climate conditions and nutrient concentrations (1.8 g L−1 nitrate) as in the batch process in flat-plate gas-lift photobioreactors almost doubled the final biomass concentration of 6.3 ± 0.0 g L−1 to 11.7 g L−1. The EPA concentration was increased by a factor of 1.9 from 360 ± 7 mg L−1 to 671 mg L−1 after a process time of 11 days. The EPA productivity has also been doubled from 33.0 ± 0.3 mg L−1 d−1 to 65.7 mg L−1 d−1. EPA content of the biomass was similar in both photobioreactors (Table 3). Further, the nitrate was consumed 2 days earlier on the semi-technical scale. The smaller fluid layer depth in the thin-layer cascade reactors improves light availability per cell, probably resulting in enhanced biomass growth and increased EPA production.
Tendentially the same differences could be observed with the strains M. salina and N. gaditana: both strains showed a significantly higher final cell dry weight concentration when cultured in a thin-layer cascade photobioreactor using constant photon flux densities, or a dynamic climate simulation of a repeated Mediterranean summer day in the south of Spain [30,37,38].
Increasing the nitrate concentration further increased the cell dry weight concentration of N. oceanica in both photobioreactors, with a final biomass concentration of 18.9 g L−1 in the thin-layer cascade reactor. Compared with the batch process on a lab scale (final biomass concentration of 8.3 g L−1), the final cell dry weight concentration could be increased by a factor of 2.25. Only 60% of the initially supplied nitrate has been consumed in the flat-plate reactor, while the microalgae in the thin-layer cascade batch process fully used nitrate. A delayed light limitation due to a higher surface-to-volume ratio may be the reason for improved nitrate consumption and biomass growth. A decrease in the EPA content when increasing the nutrient concentration was observed in both photobioreactors.
The batch process with N. oceanica using urea on a semi-technical scale resulted in a biomass concentration of 10 g L−1. This is only an increase of 2 g L−1 compared to the lab-scale process (8 g L−1). The initially supplied urea was entirely consumed within the first 6 days in both reactors. An approx. 100 mg L−1 higher EPA concentration could be detected on a semi-technical scale, resulting in similar EPA contents of the microalgae.
Overall, the cell dry weight concentration of N. oceanica was doubled using nitrate as a nitrogen source in thin-layer cascade reactors compared to the lab-scale photobioreactors. This effect was not observed with urea as a nitrogen source. Nevertheless, increasing the urea concentration on the semi-technical scale achieved high EPA concentrations of >800 mg L−1.
A comparison of the maximal EPA contents and CDW concentrations of N. oceanica in different photobioreactor systems reported in the literature, compared to this study, is shown in Figure 6.
A batch process reported in the literature with N. oceanica CCAP849/10 in closed tubular photobioreactors with a working volume of 2.6 m3 and an illuminated volume of 1.6 m3 resulted in similar EPA contents of the cells but lower final CDW concentrations (2 g L−1 with an EPA content of 49 mgEPA gCDW−1). The batch process was carried out under real climate conditions outdoors with an average temperature of 17.5 ± 0.8 °C and an average daily solar radiation of 1355.5 µmol m−2 s−1. The used media was f/2 media with an initial nitrate concentration of 0.31 g L−1 [45]. Our study achieved a 6 times higher cell dry weight concentration (11.7 g L−1 instead of 2 g L−1). Furthermore, the illuminated volume in the study by Guerra et al. (2021) [45], with 63% of the total volume, was similar to the illuminated volume (64%) of the TLC used in this study, explaining comparable EPA contents of the microalgal cells.
Another study with the same strain N. oceanica CCAP849/10 cultivated in a batch process of 13 days in an open raceway pond with a water depth of 13 cm and a liquid flow velocity of 0.3 m s−1 in Patais (Portugal) with maximal temperatures of 35 °C during the day and minimal temperatures of 10 °C during the night, reported a maximal CDW concentration of approx. 1.2 g L−1 with a maximal EPA content of 66 mg g−1. The maximum light intensity during the day was approximately 1700 µmol m−2 s−1 with nitrate concentrations maintained over 0.12 g L−1 throughout the process [14]. In our study, employing a TLC photobioreactor with a water depth of 0.5 cm, the final CDW concentration increased by a factor of 10 using the same strain. This improvement can likely be attributed to the reduced fluid layer depth, which enhanced the surface-to-volume ratio and thereby improved light accessibility for the cells, leading to higher biomass concentrations. However, the EPA content in the open raceway pond was slightly increased compared to our data (Figure 5). The light intensity in the study by Cunha et al. (2020) [14] was lower than the maximal PPFD in the climate simulation used in this study. Lower light intensities are often associated with an increased accumulation of polar lipids, which contain the highest proportions of polyunsaturated fatty acids [21].
Another study in open indoor 8000 L raceway ponds by Zhu et al. (2014) [46] reported a maximal CDW concentration of 0.34 g L−1 and a maximal EPA content of approx. 11 mg g−1 cell dry weight with N. oceanica cultivated with nitrate as nitrogen source at an average temperature of 8 °C and an incident light intensity of 250 µmol s−1 m−2 in a batch process for 16 days. The higher suspension depth layer, due to the geometry of the raceway pond, combined with very low light intensity, resulted in lower final cell dry weight concentrations (factor 34) and a fivefold reduced EPA content of 11 mg g−1 compared to this study (57 mg g−1).
The highest reported EPA content of Nannochloropsis strains was reported with N. oculata CCAP849/1. This microalgae accumulated more than 75 mg EPA per cell dry weight in a 300 L outdoor glass tube photobioreactor in 15 days with temperatures ranging from 15 to 35 °C, and light intensities from 1000 to 2000 µmol m−2 s−1 over the day in July in Sheffield, United Kingdom [47]. F/2 media with nitrate as a nitrogen source at a concentration of 34 mg L−1 was used. Nitrate was depleted after 10 days, resulting in a maximal achieved cell dry weight concentration of approximately 0.7 g L−1. Our study achieved a 16 times higher cell dry weight concentration. The CO2 supply in the glass tube reactor was introduced only at the initial point of the serpentine glass tubes, likely leading to CO2 limitations throughout the reactor length and, consequently, lower cell densities.
Figure 6. Comparison of maximal EPA contents (green), EPA concentration (grey), and maximal biomass concentrations (black) of photoautotrophic batch cultivations with N. oceanica described in the literature (estimated values) in different photobioreactors [14,45,46].
Processes 13 01649 g006

4. Conclusions

Photoautotrophic biomass and EPA production of Nannochloropsis oceanica were successfully transferred to open thin-layer cascade photobioreactors under a dynamic physical climate simulation of a repeated sunny summer day in eastern Australia, achieving a twofold increase in final cell dry weight and EPA concentrations due to a fourfold reduction in fluid layer depth compared to flat-plate gas-lift photobioreactors. The initially supplied nitrogen source concentration impacted the final cell dry weight and EPA concentrations of the batch processes. Using urea as the most cost-efficient nitrogen source instead of nitrate resulted in this study’s highest EPA concentration of >800 mg L−1.
Compared to cultivations of Nannochloropsis oceanica in open raceway ponds under similar real climate conditions, the use of a thin-layer cascade (TLC) photobioreactor resulted in a tenfold increase in the final cell dry weight concentration while maintaining comparable EPA contents. The high EPA productivity and successful cultivation in open photobioreactors demonstrate the strain’s suitability for industrial-scale, cost-efficient microalgal EPA production. Furthermore, due to their low fluid layer depth, cultivation in thin-layer cascade reactors achieved high biomass concentrations, enabling the harvest of large amounts of EPA-rich algal biomass.

Supplementary Materials

The following supporting information can be downloaded at: https://www.mdpi.com/article/10.3390/pr13061649/s1, Figure S1: Total lipid content in % of a batch process with N. oceancia in 1.8 L flat-plate gas-lift photobioreactors under physically dynamic climate conditions of a repeated sunny summer day in Australia; the PPFD is indicated as a grey shaded area. An f/2 medium with an initial nitrate concentration of 3.6 g L−1 was used.

Author Contributions

Conceptualization, A.-L.T. and D.W.-B.; methodology, A.-L.T.; investigation, A.-L.T. and S.G.; discussion and analysis, A.-L.T., S.G. and D.W.-B.; writing—original draft preparation and visualization, A.-L.T.; writing—review and editing, D.W.-B.; supervision, project administration, funding acquisition, T.B. and D.W.-B. All authors have read and agreed to the published version of the manuscript.

Funding

Funding was provided by the Technical University of Munich (TUM), Munich, Germany.

Data Availability Statement

Data are contained within the article.

Acknowledgments

The support of Anna-Lena Thurn by the TUM Graduate School is acknowledged.

Conflicts of Interest

The authors declare no conflicts of interest.

Abbreviations

The following abbreviations are used in this manuscript:
CDWCell dry weight
EPAEicosapentaenoic acid
FPRFlat-plate gas-lift photobioreactor
PPFDPAR photon flux density
STYSpace-time yield
TLCThin-layer cascade photobioreactor

References

  1. Calder, P.C.; Yaqoob, P. Marine omega-3 fatty acids and coronary heart disease. Curr. Opin. Cardiol. 2012, 27, 412–419. [Google Scholar] [CrossRef]
  2. Delgado-Lista, J.; Perez-Martinez, P.; Lopez-Miranda, J.; Perez-Jimenez, F. Long chain omega-3 fatty acids and cardiovascular disease: A systematic review. Br. J. Nutr. 2012, 107 (Suppl. S2), S201–S213. [Google Scholar] [CrossRef] [PubMed]
  3. Wall, R.; Ross, R.P.; Fitzgerald, G.F.; Stanton, C. Fatty acids from fish: The anti-inflammatory potential of long-chain omega-3 fatty acids. Nutr. Rev. 2010, 68, 280–289. [Google Scholar] [CrossRef] [PubMed]
  4. Mozaffarian, D.; Wu, J.H.Y. (n-3) Fatty Acids and Cardiovascular Health: Are Effects of EPA and DHA Shared or Complementary?1–323. J. Nutr. 2012, 142, 614S–625S. [Google Scholar] [CrossRef]
  5. Kris-Etherton, P.M.; Grieger, J.A.; Etherton, T.D. Dietary reference intakes for DHA and EPA. Prostaglandins Leukot. Essent. Fat. Acids 2009, 81, 99–104. [Google Scholar] [CrossRef]
  6. Hamilton, H.A.; Newton, R.; Auchterlonie, N.A.; Müller, D.B. Systems approach to quantify the global omega-3 fatty acid cycle. Nat. Food 2020, 1, 59–62. [Google Scholar] [CrossRef]
  7. Tocher, D.R. Omega-3 long-chain polyunsaturated fatty acids and aquaculture in perspective. Aquaculture 2015, 449, 94–107. [Google Scholar] [CrossRef]
  8. FAO. The State of World Fisheries and Aquaculture 2024—Blue Transformation in Action; FAO: Rome, Italy, 2024. [Google Scholar]
  9. Remize, M.; Brunel, Y.; Silva, J.L.; Berthon, J.Y.; Filaire, E. Microalgae n-3 PUFAs Production and Use in Food and Feed Industries. Mar. Drugs 2021, 19, 113. [Google Scholar] [CrossRef]
  10. Posten, C. Design principles of photo-bioreactors for cultivation of microalgae. Eng. Life Sci. 2009, 9, 165–177. [Google Scholar] [CrossRef]
  11. Xu, L.; Weathers, P.J.; Xiong, X.-R.; Liu, C.-Z. Microalgal bioreactors: Challenges and opportunities. Eng. Life Sci. 2009, 9, 178–189. [Google Scholar] [CrossRef]
  12. Sharma, K.; Schenk, P.M. Rapid induction of omega-3 fatty acids (EPA) in Nannochloropsis sp. by UV-C radiation. Biotechnol. Bioeng. 2015, 112, 1243–1249. [Google Scholar] [CrossRef] [PubMed]
  13. Chen, C.-Y.; Nagarajan, D.; Cheah, W.Y. Eicosapentaenoic acid production from Nannochloropsis oceanica CY2 using deep sea water in outdoor plastic-bag type photobioreactors. Bioresour. Technol. 2018, 253, 1–7. [Google Scholar] [CrossRef] [PubMed]
  14. Cunha, P.; Pereira, H.; Costa, M.; Pereira, J.; Silva, J.T.; Fernandes, N.; Varela, J.; Silva, J.; Simões, M. Nannochloropsis oceanica Cultivation in Pilot-Scale Raceway Ponds—From Design to Cultivation. Appl. Sci. 2020, 10, 1725. [Google Scholar] [CrossRef]
  15. Gharat, K.; Agarwal, A.; Pandit, R.A.; Lali, A.M. Development of fed batch strategies to improve the production of eicosapentaenoic acid from a marine microalga Nannochloropsis oculata. Bioresour. Technol. Rep. 2018, 4, 193–201. [Google Scholar] [CrossRef]
  16. de Vree, J.H.; Bosma, R.; Janssen, M.; Barbosa, M.J.; Wijffels, R.H. Comparison of four outdoor pilot-scale photobioreactors. Biotechnol. Biofuels 2015, 8, 215. [Google Scholar] [CrossRef]
  17. San Pedro, A.; González-López, C.V.; Acién, F.G.; Molina-Grima, E. Marine microalgae selection and culture conditions optimization for biodiesel production. Bioresour. Technol. 2013, 134, 353–361. [Google Scholar] [CrossRef]
  18. Koruyucu, A.; Schädler, T.; Gniffke, A.; Mundt, K.; Krippendorf, S.; Urban, P.; Blums, K.; Halim, B.; Brück, T.; Weuster-Botz, D. Energy-Efficient Production of Microchloropsis salina Biomass with High CO2 Fixation Yield in Open Thin-Layer Cascade Photobioreactors. Processes 2024, 12, 1303. [Google Scholar] [CrossRef]
  19. Khozin-Goldberg, I. Lipid Metabolism in Microalgae. In The Physiology of Microalgae; Borowitzka, M.A., Beardall, J., Raven, J.A., Eds.; Springer International Publishing: Cham, Switzerland, 2016; pp. 413–484. [Google Scholar]
  20. Gurr, M.I.; Harwood, J.L. Fatty Acid Structure and Metabolism. In Lipid Biochemistry; Springer: Boston, MA, USA, 2002; pp. 13–92. [Google Scholar]
  21. Hu, Q.; Sommerfeld, M.; Jarvis, E.; Ghirardi, M.; Posewitz, M.; Seibert, M.; Darzins, A. Microalgal triacylglycerols as feedstocks for biofuel production: Perspectives and advances. Plant J. 2008, 54, 621–639. [Google Scholar] [CrossRef]
  22. Harwood, J.L. Membrane Lipids in Algae. In Lipids in Photosynthesis: Structure, Function and Genetics; Paul-André, S., Norio, M., Eds.; Springer: Dordrecht, The Netherlands, 1998; pp. 53–64. [Google Scholar]
  23. Guschina, I.A.; Harwood, J.L. Lipids and lipid metabolism in eukaryotic algae. Progress Lipid Res. 2006, 45, 160–186. [Google Scholar] [CrossRef]
  24. Meng, Y.; Jiang, J.; Wang, H.; Cao, X.; Xue, S.; Yang, Q.; Wang, W. The characteristics of TAG and EPA accumulation in Nannochloropsis oceanica IMET1 under different nitrogen supply regimes. Bioresour. Technol. 2015, 179, 483–489. [Google Scholar] [CrossRef]
  25. Sá, M.; Ferrer-Ledo, N.; Wijffels, R.; Crespo, J.G.; Barbosa, M.; Galinha, C.F. Monitoring of eicosapentaenoic acid (EPA) production in the microalgae Nannochloropsis oceanica. Algal Res. 2020, 45, 101766. [Google Scholar] [CrossRef]
  26. Schadler, T.; Caballero Cerbon, D.; de Oliveira, L.; Garbe, D.; Bruck, T.; Weuster-Botz, D. Production of lipids with Microchloropsis salina in open thin-layer cascade photobioreactors. Bioresour. Technol. 2019, 289, 121682. [Google Scholar] [CrossRef] [PubMed]
  27. Campos, H.; Boeing, W.J.; Dungan, B.N.; Schaub, T. Cultivating the marine microalga Nannochloropsis salina under various nitrogen sources: Effect on biovolume yields, lipid content and composition, and invasive organisms. Biomass Bioenergy 2014, 66, 301–307. [Google Scholar] [CrossRef]
  28. Thurn, A.-L.; Schobel, J.; Weuster-Botz, D. Photoautotrophic Production of Docosahexaenoic Acid- and Eicosapentaenoic Acid-Enriched Biomass by Co-Culturing Golden-Brown and Green Microalgae. Fermentation 2024, 10, 220. [Google Scholar] [CrossRef]
  29. Carvalho, A.P.; Meireles, L.A.; Malcata, F.X. Microalgal reactors: A review of enclosed system designs and performances. Biotechnol. Prog. 2006, 22, 1490–1506. [Google Scholar] [CrossRef]
  30. Pfaffinger, C.E.; Schöne, D.; Trunz, S.; Löwe, H.; Weuster-Botz, D. Model-based optimization of microalgae areal productivity in flat-plate gas-lift photobioreactors. Algal Res. 2016, 20, 153–163. [Google Scholar] [CrossRef]
  31. Wolf, L.; Cummings, T.; Müller, K.; Reppke, M.; Volkmar, M.; Weuster-Botz, D. Production of β-carotene with Dunaliella salina CCAP19/18 at physically simulated outdoor conditions. Eng. Life Sci. 2021, 21, 115–125. [Google Scholar] [CrossRef]
  32. Benemann, J. Microalgae for Biofuels and Animal Feeds. Energies 2013, 6, 5869–5886. [Google Scholar] [CrossRef]
  33. Setlík, I.; Sust, V.; Malek, I. Dual purpose open circulation units for large scale culture of algae in temperate zones. I. Basic design considerations and scheme of pilot plant. Algol. Stud. 1970, 1, 111–164. [Google Scholar]
  34. Doucha, J.; Lívanský, K. Outdoor open thin-layer microalgal photobioreactor: Potential productivity. J. Appl. Phycol. 2009, 21, 111–117. [Google Scholar] [CrossRef]
  35. Doucha, J.; Lívanský, K. Productivity, CO2/O2 exchange and hydraulics in outdoor open high density microalgal (Chlorella sp.) photobioreactors operated in a Middle and Southern European climate. J. Appl. Phycol. 2006, 18, 811–826. [Google Scholar] [CrossRef]
  36. Masojídek, J.; Kopecký, J.; Giannelli, L.; Torzillo, G. Productivity correlated to photobiochemical performance of Chlorella mass cultures grown outdoors in thin-layer cascades. J. Ind. Microbiol. Biotechnol. 2011, 38, 307–317. [Google Scholar] [CrossRef]
  37. Apel, A.C.; Pfaffinger, C.E.; Basedahl, N.; Mittwollen, N.; Göbel, J.; Sauter, J.; Brück, T.; Weuster-Botz, D. Open thin-layer cascade reactors for saline microalgae production evaluated in a physically simulated Mediterranean summer climate. Algal Res. 2017, 25, 381–390. [Google Scholar] [CrossRef]
  38. Pfaffinger, C.E.; Severin, T.S.; Apel, A.C.; Göbel, J.; Sauter, J.; Weuster-Botz, D. Light-dependent growth kinetics enable scale-up of well-mixed phototrophic bioprocesses in different types of photobioreactors. J. Biotechnol. 2019, 297, 41–48. [Google Scholar] [CrossRef]
  39. Schädler, T.; Neumann-Cip, A.-C.; Wieland, K.; Glöckler, D.; Haisch, C.; Brück, T.; Weuster-Botz, D. High-Density Microalgae Cultivation in Open Thin-Layer Cascade Photobioreactors with Water Recycling. Appl. Sci. 2020, 10, 3883. [Google Scholar] [CrossRef]
  40. Havel, J.; Franco-Lara, E.; Weuster-Botz, D. A parallel bubble column system for the cultivation of phototrophic microorganisms. Biotechnol. Lett. 2008, 30, 1197–1200. [Google Scholar] [CrossRef]
  41. Thurn, A.-L.; Stock, A.; Gerwald, S.; Weuster-Botz, D. Simultaneous photoautotrophic production of DHA and EPA by Tisochrysis lutea and Microchloropsis salina in co-culture. Bioresour. Bioprocess. 2022, 9, 130. [Google Scholar] [CrossRef]
  42. Hulatt, C.J.; Wijffels, R.H.; Bolla, S.; Kiron, V. Production of Fatty Acids and Protein by Nannochloropsis in Flat-Plate Photobioreactors. PLoS ONE 2017, 12, e0170440. [Google Scholar] [CrossRef]
  43. Ren, M.; Ogden, K. Cultivation of Nannochloropsis gaditana on mixtures of nitrogen sources. Environ. Progress Sustain. Energy 2014, 33, 551–555. [Google Scholar] [CrossRef]
  44. Sassano, C.E.N.; Carvalho, J.C.M.; Gioielli, L.A.; Sato, S.; Torre, P.; Converti, A. Kinetics and bioenergetics of Spirulina platensis cultivation by fed-batch addition of urea as nitrogen source. Appl. Biochem. Biotechnol. 2004, 112, 143–150. [Google Scholar] [CrossRef]
  45. Guerra, I.; Pereira, H.; Costa, M.; Silva, J.T.; Santos, T.; Varela, J.; Mateus, M.; Silva, J. Operation Regimes: A Comparison Based on Nannochloropsis oceanica Biomass and Lipid Productivity. Energies 2021, 14, 1542. [Google Scholar] [CrossRef]
  46. Zhu, B.; Sun, F.; Yang, M.; Lu, L.; Yang, G.; Pan, K. Large-scale biodiesel production using flue gas from coal-fired power plants with Nannochloropsis microalgal biomass in open raceway ponds. Bioresour. Technol. 2014, 174, 53–59. [Google Scholar] [CrossRef] [PubMed]
  47. Wan Razali, W.A.; Pandhal, J. Outdoor pilot-scale cultivation and techno economic assessment of a novel omega-3 eicosapentaenoic acid over-producing Nannochloropsis oculata strain. Bioresour. Technol. Rep. 2023, 24, 101682. [Google Scholar] [CrossRef]
Figure 1. Photographs of the photobioreactors used in this study: Left: Two parallel-operated closed flat-plate gas-lift photobioreactors with LED illumination. Right: Open thin-layer cascade photobioreactor with LED illumination (upper channel, flow reversal module, lower channel, and retention tank with the algae suspension continuously lifted from the retention tank to the upper channel).
Processes 13 01649 g001
Figure 4. Photoautotrophic batch processes with N. oceanica in flat-plate gas-lift photobioreactors applying dynamically simulated climate conditions of a repeated sunny summer day in eastern Australia (19 January 2018, Newcastle), varying the nitrogen source and concentration. The following nitrogen conditions were tested: Nitrate at a concentration of 1.8 g L−1 (), 3.6 g L−1 (), and urea at a concentration of 0.8 g L−1 (). The batch process with the lower nitrate concentration and the batch process using urea are equimolar to a nitrogen content of 400 mg L−1. (a) Cell dry weight concentration, (b) nitrate concentration, (c) EPA concentration, and (d) EPA content. The batch processes were operated with a working volume of 1.8 L and at pH 8.0. Error bars indicate the min-max values of two batch processes; the batch processes with an increased nitrate concentration and urea as a nitrogen source were conducted once.
Processes 13 01649 g004
Figure 5. Photoautotrophic batch processes with N. oceanica in 8 m2 open thin-layer cascade reactors applying a dynamic climate simulation of a repeated sunny summer day in eastern Australia (19 January 2018); the PPFD is indicated as a grey shaded area. Two different nitrogen sources were tested at varying concentrations: Nitrate at a concentration of 1.8 g L−1 () and 3.6 g L−1 (), and urea at a concentration of 0.8 g L−1 () and 2.4 g L−1 (). The phosphate, nutrient, and vitamin concentrations in the used f/2 media were increased at the same ratio as the nitrogen concentration. (a,b) Cell dry weight concentration, (c,d) nitrate concentration, (e,f) EPA concentration, and (g,h) EPA content of the biomass. All batch processes were conducted once.
Processes 13 01649 g005
Table 2. Technical differences between closed flat-plate gas-lift photobioreactors and open thin-layer cascade photobioreactors applied for the photoautotrophic cultivation of N. oceanica.
Flat-Plate Gas-Lift
Photobioreactor
Thin-Layer Cascade
Photobioreactor
Working volume
(VReactor, L)
1.855
(Illuminated) reactor surface (AReactor, m2)0.098
Surface-to-volume ratio
(AReactor VReactor−1, m−1)
50150
Fluid layer depth
(cm)
20.5
CO2 supplypH-dependent
Addition via aeration trough gassing pipe
pH-dependent
Addition through perforated hoses in the retention tank
Table 3. Results achieved in photoautotrophic batch process with N. oceanica using nitrate with a concentration of 1.8 g L−1 in flat-plate gas-lift photobioreactors compared to a thin-layer cascade reactor.
t = 11 dFlat-Plate Gas-Lift
Photobioreactor
Thin-Layer Cascade
Photobioreactor
CDW, g L−16.3 ± 0.011.7
EPA concentration, mg L−1360 ± 7671
EPA content, mg g−156 ± 057
EPA productivity, mg L−1, d−133.0 ± 0.665.7
Disclaimer/Publisher’s Note: The statements, opinions and data contained in all publications are solely those of the individual author(s) and contributor(s) and not of MDPI and/or the editor(s). MDPI and/or the editor(s) disclaim responsibility for any injury to people or property resulting from any ideas, methods, instructions or products referred to in the content.

