


Impact of Ultrasound Pretreatment and Temperature on Drying Kinetics and Quality Characteristics of Blood Orange Slices: Comparison with Different Drying Methods


Abstract
1. Introduction
2. Materials and Methods
2.1. Material
2.2. Methods
2.2.1. Drying Procedure
2.2.2. Mathematical Modeling
2.2.3. Total Energy Consumption
2.2.4. Methods of Analyses
Extraction Procedure
Determination of Bioactive Compounds
Individual Phenolic Compounds
Vitamin C
Color
2.2.5. Multivariate Exploratory Data Analysis by Principal Component Analysis (PCA)
2.2.6. Statistical Analysis
3. Results
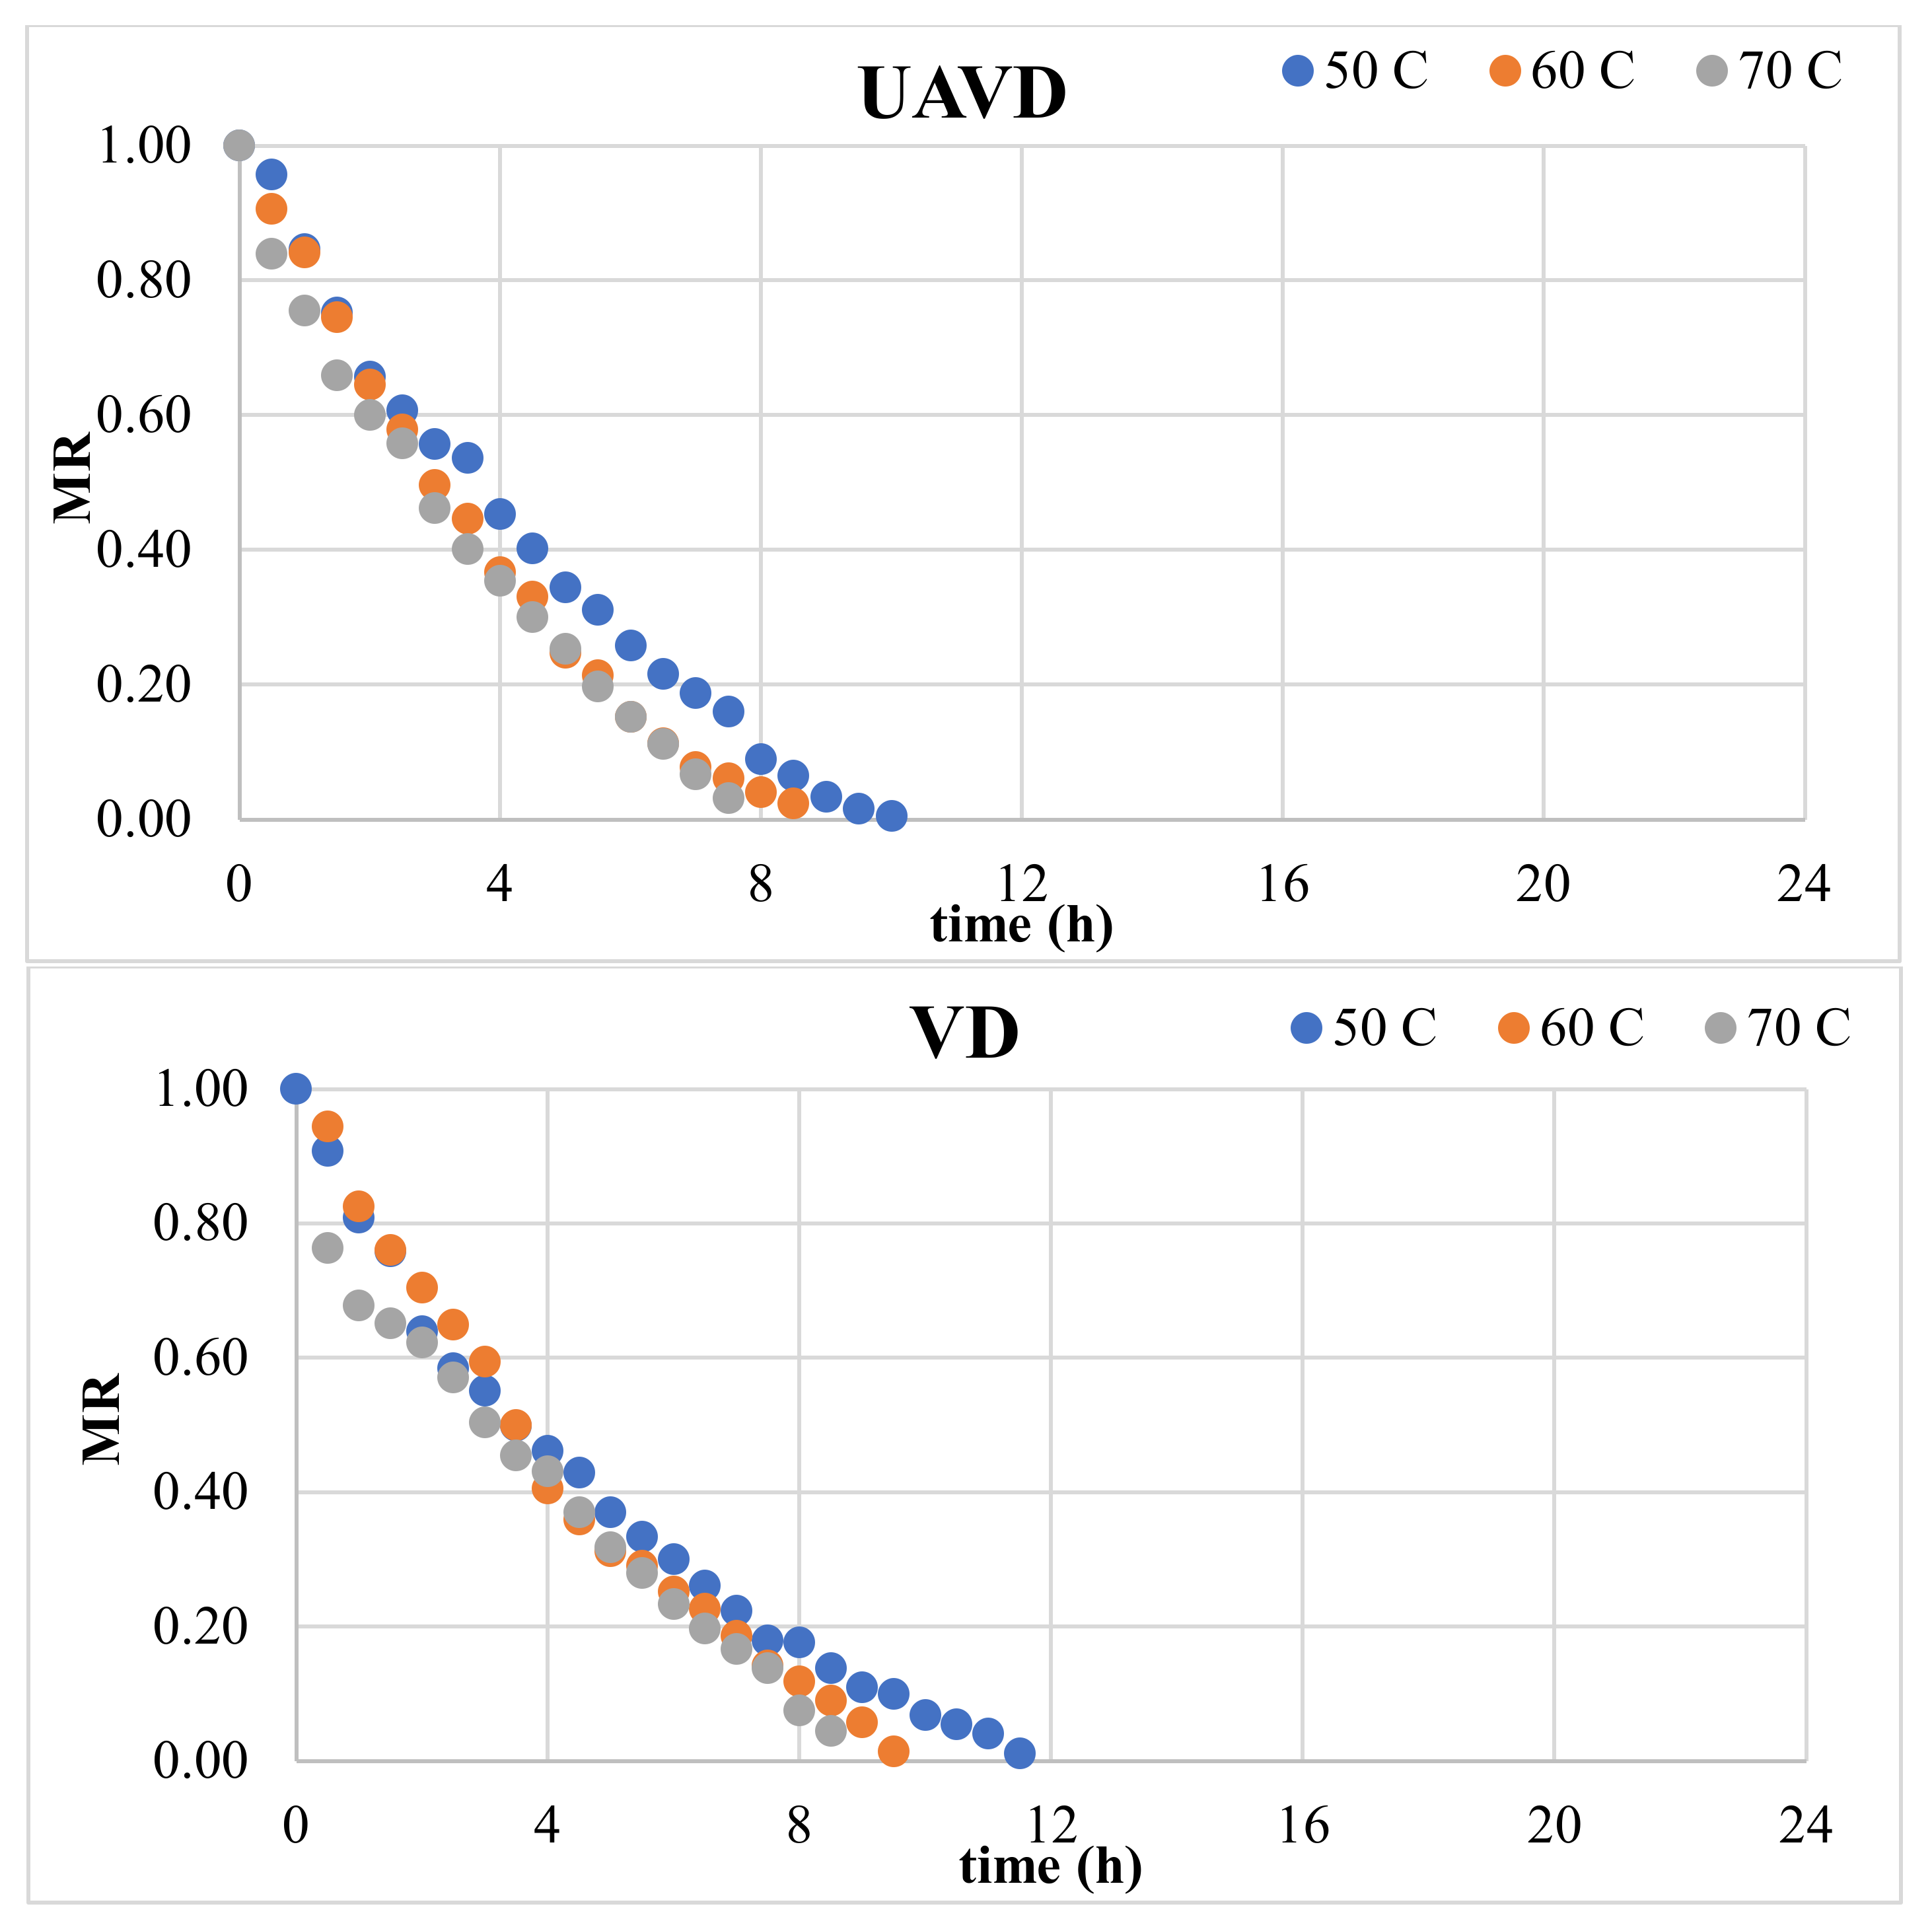
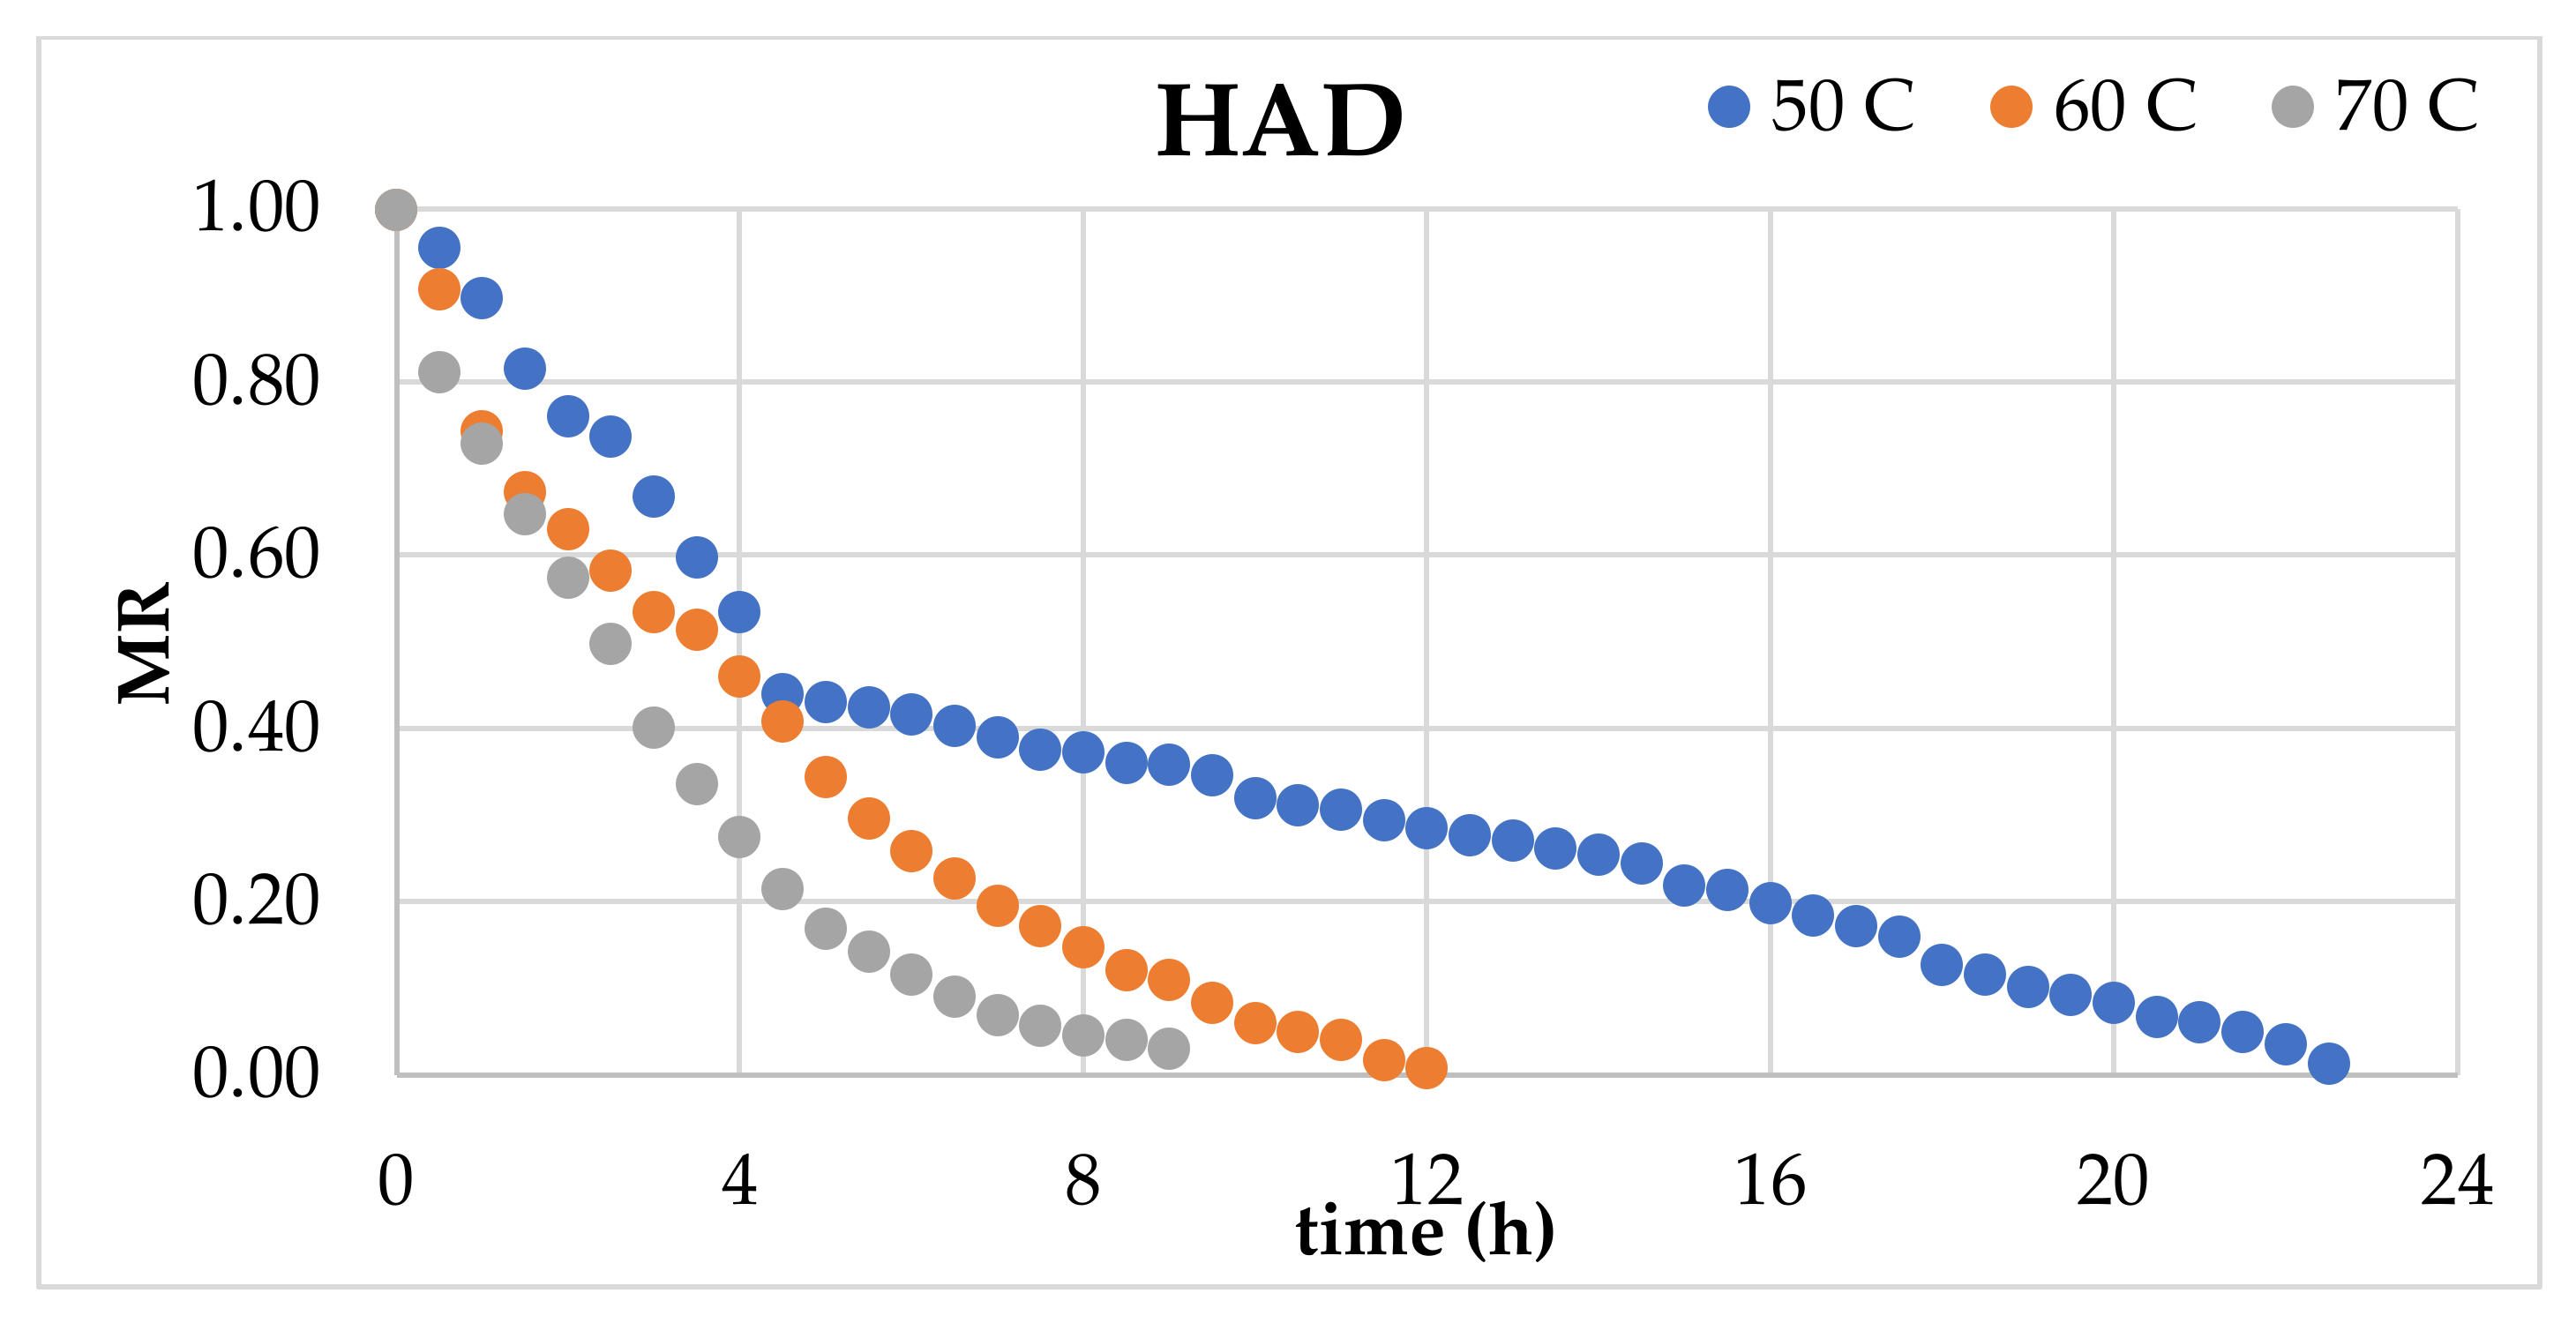
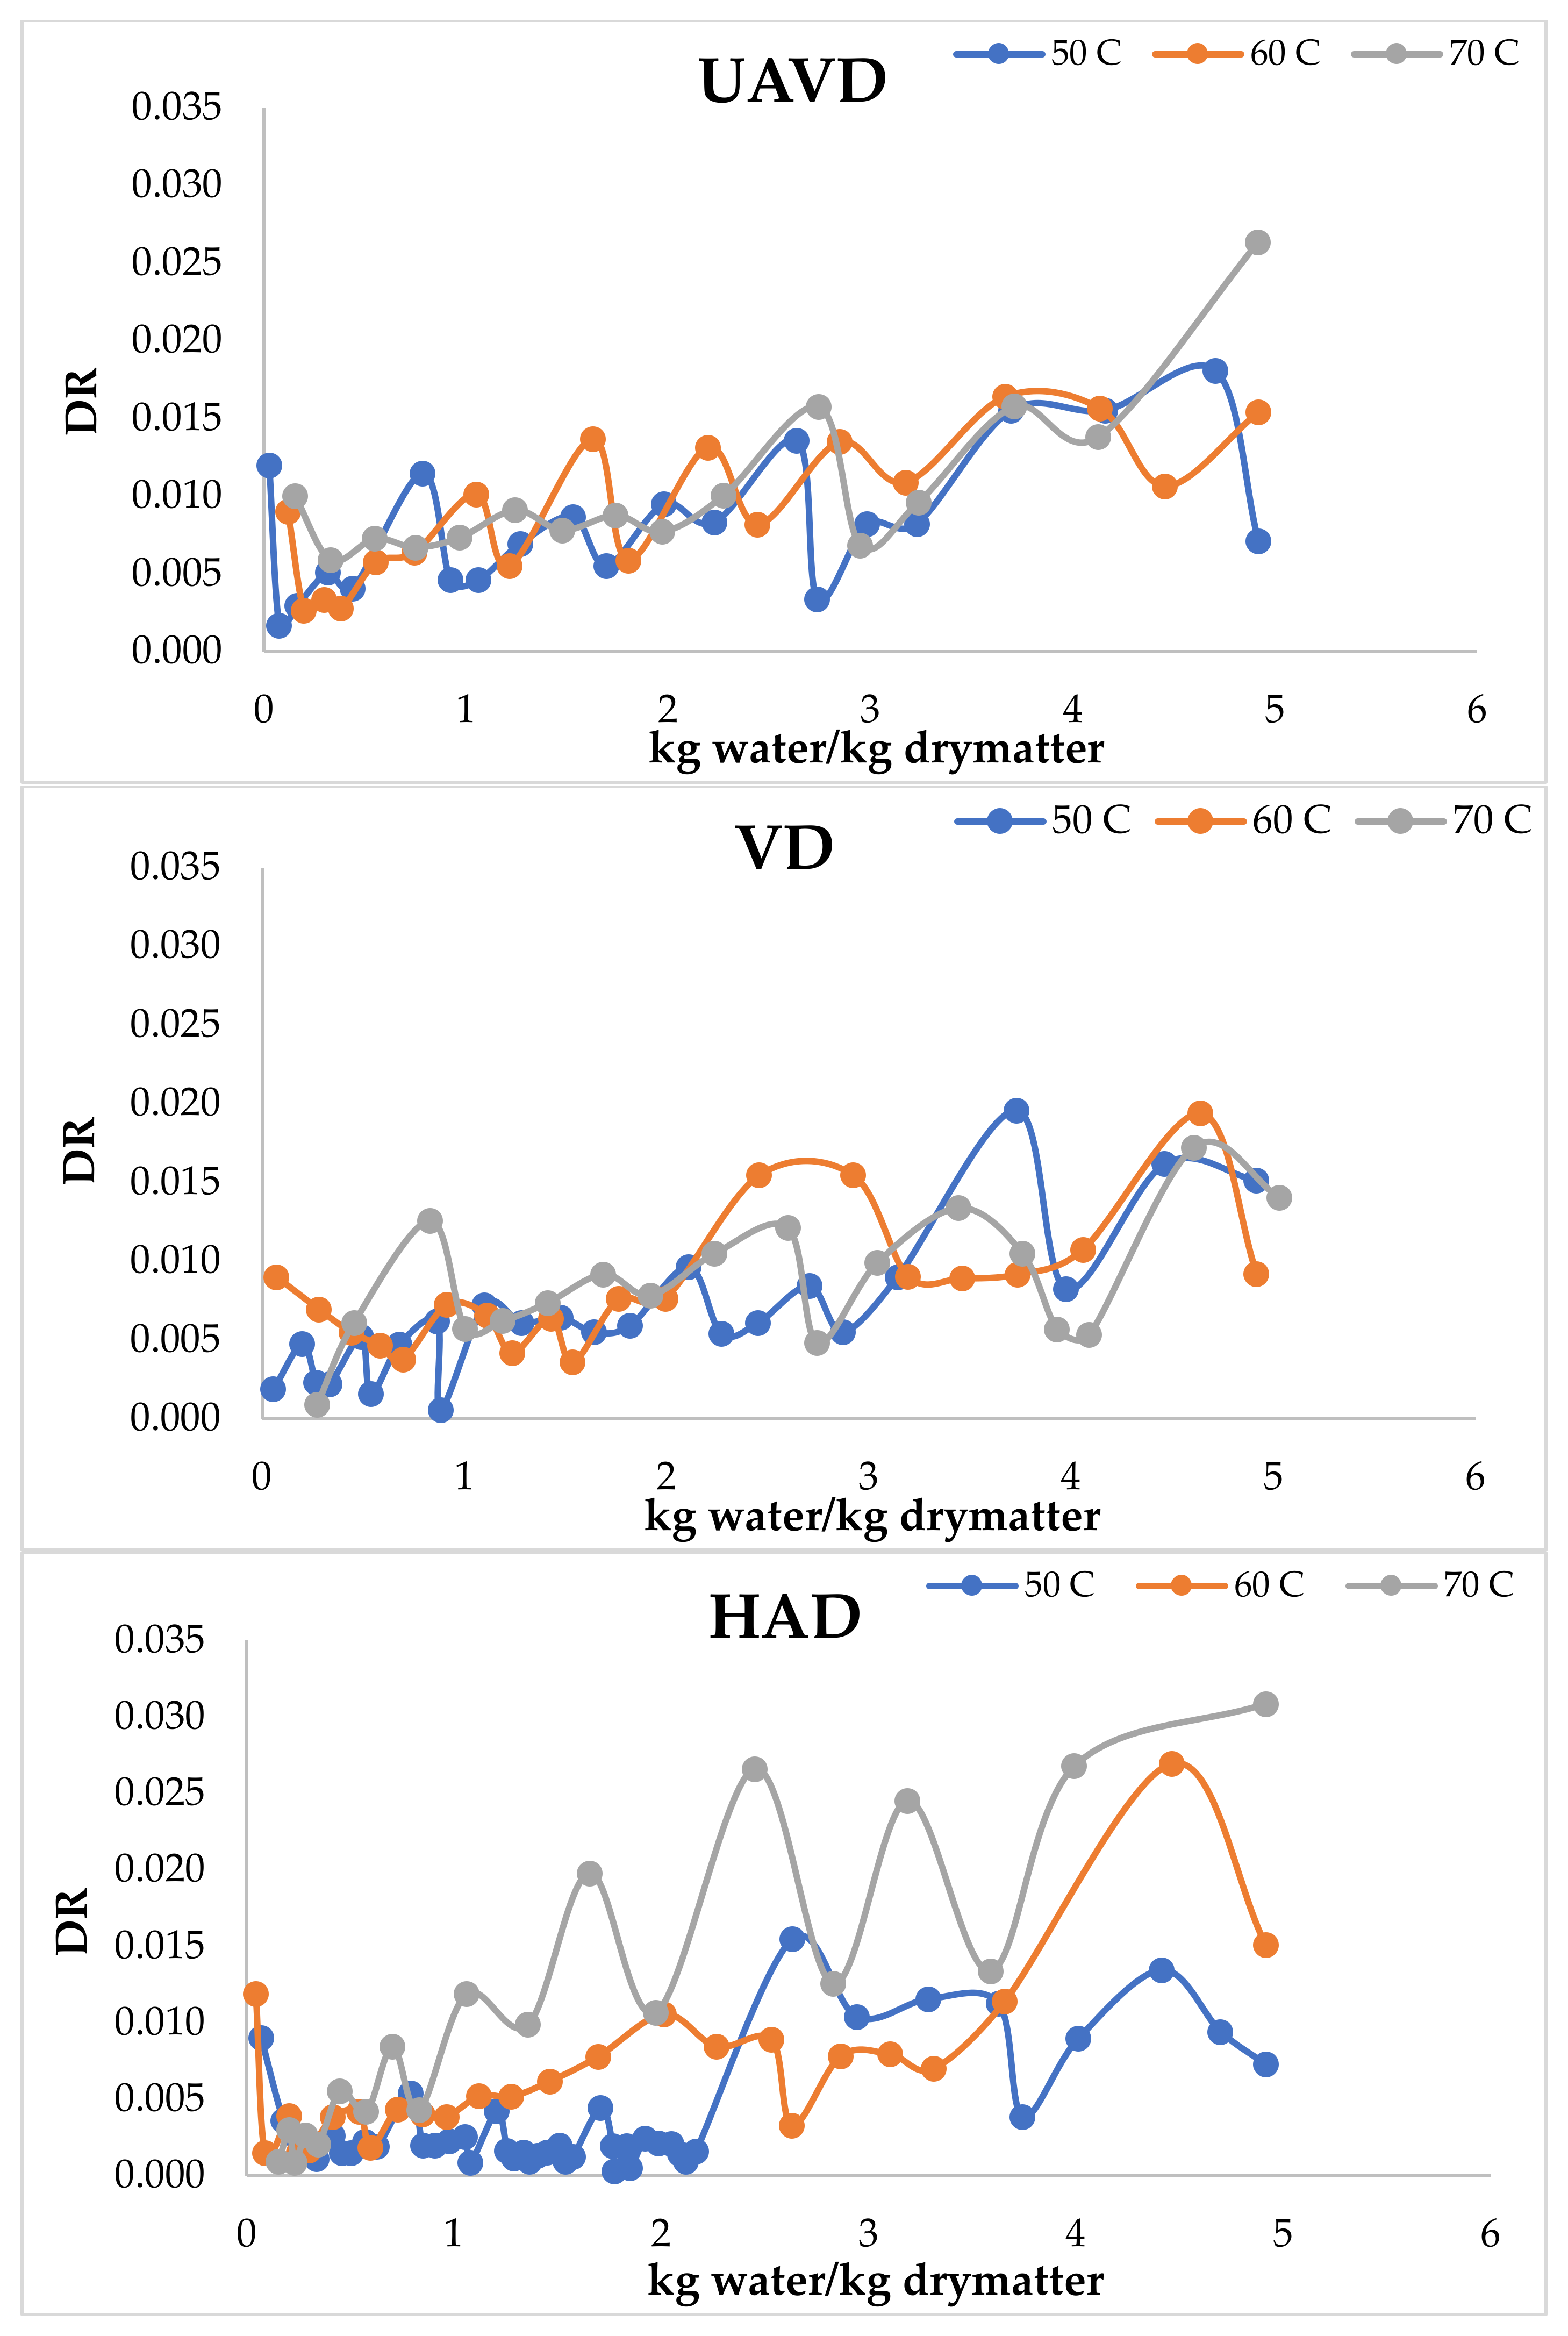
3.1. Drying Kinetics
3.2. Total Phenolic Content and Antioxidant Capacity
3.3. Vitamin C
3.4. Individual Phenolic Compounds
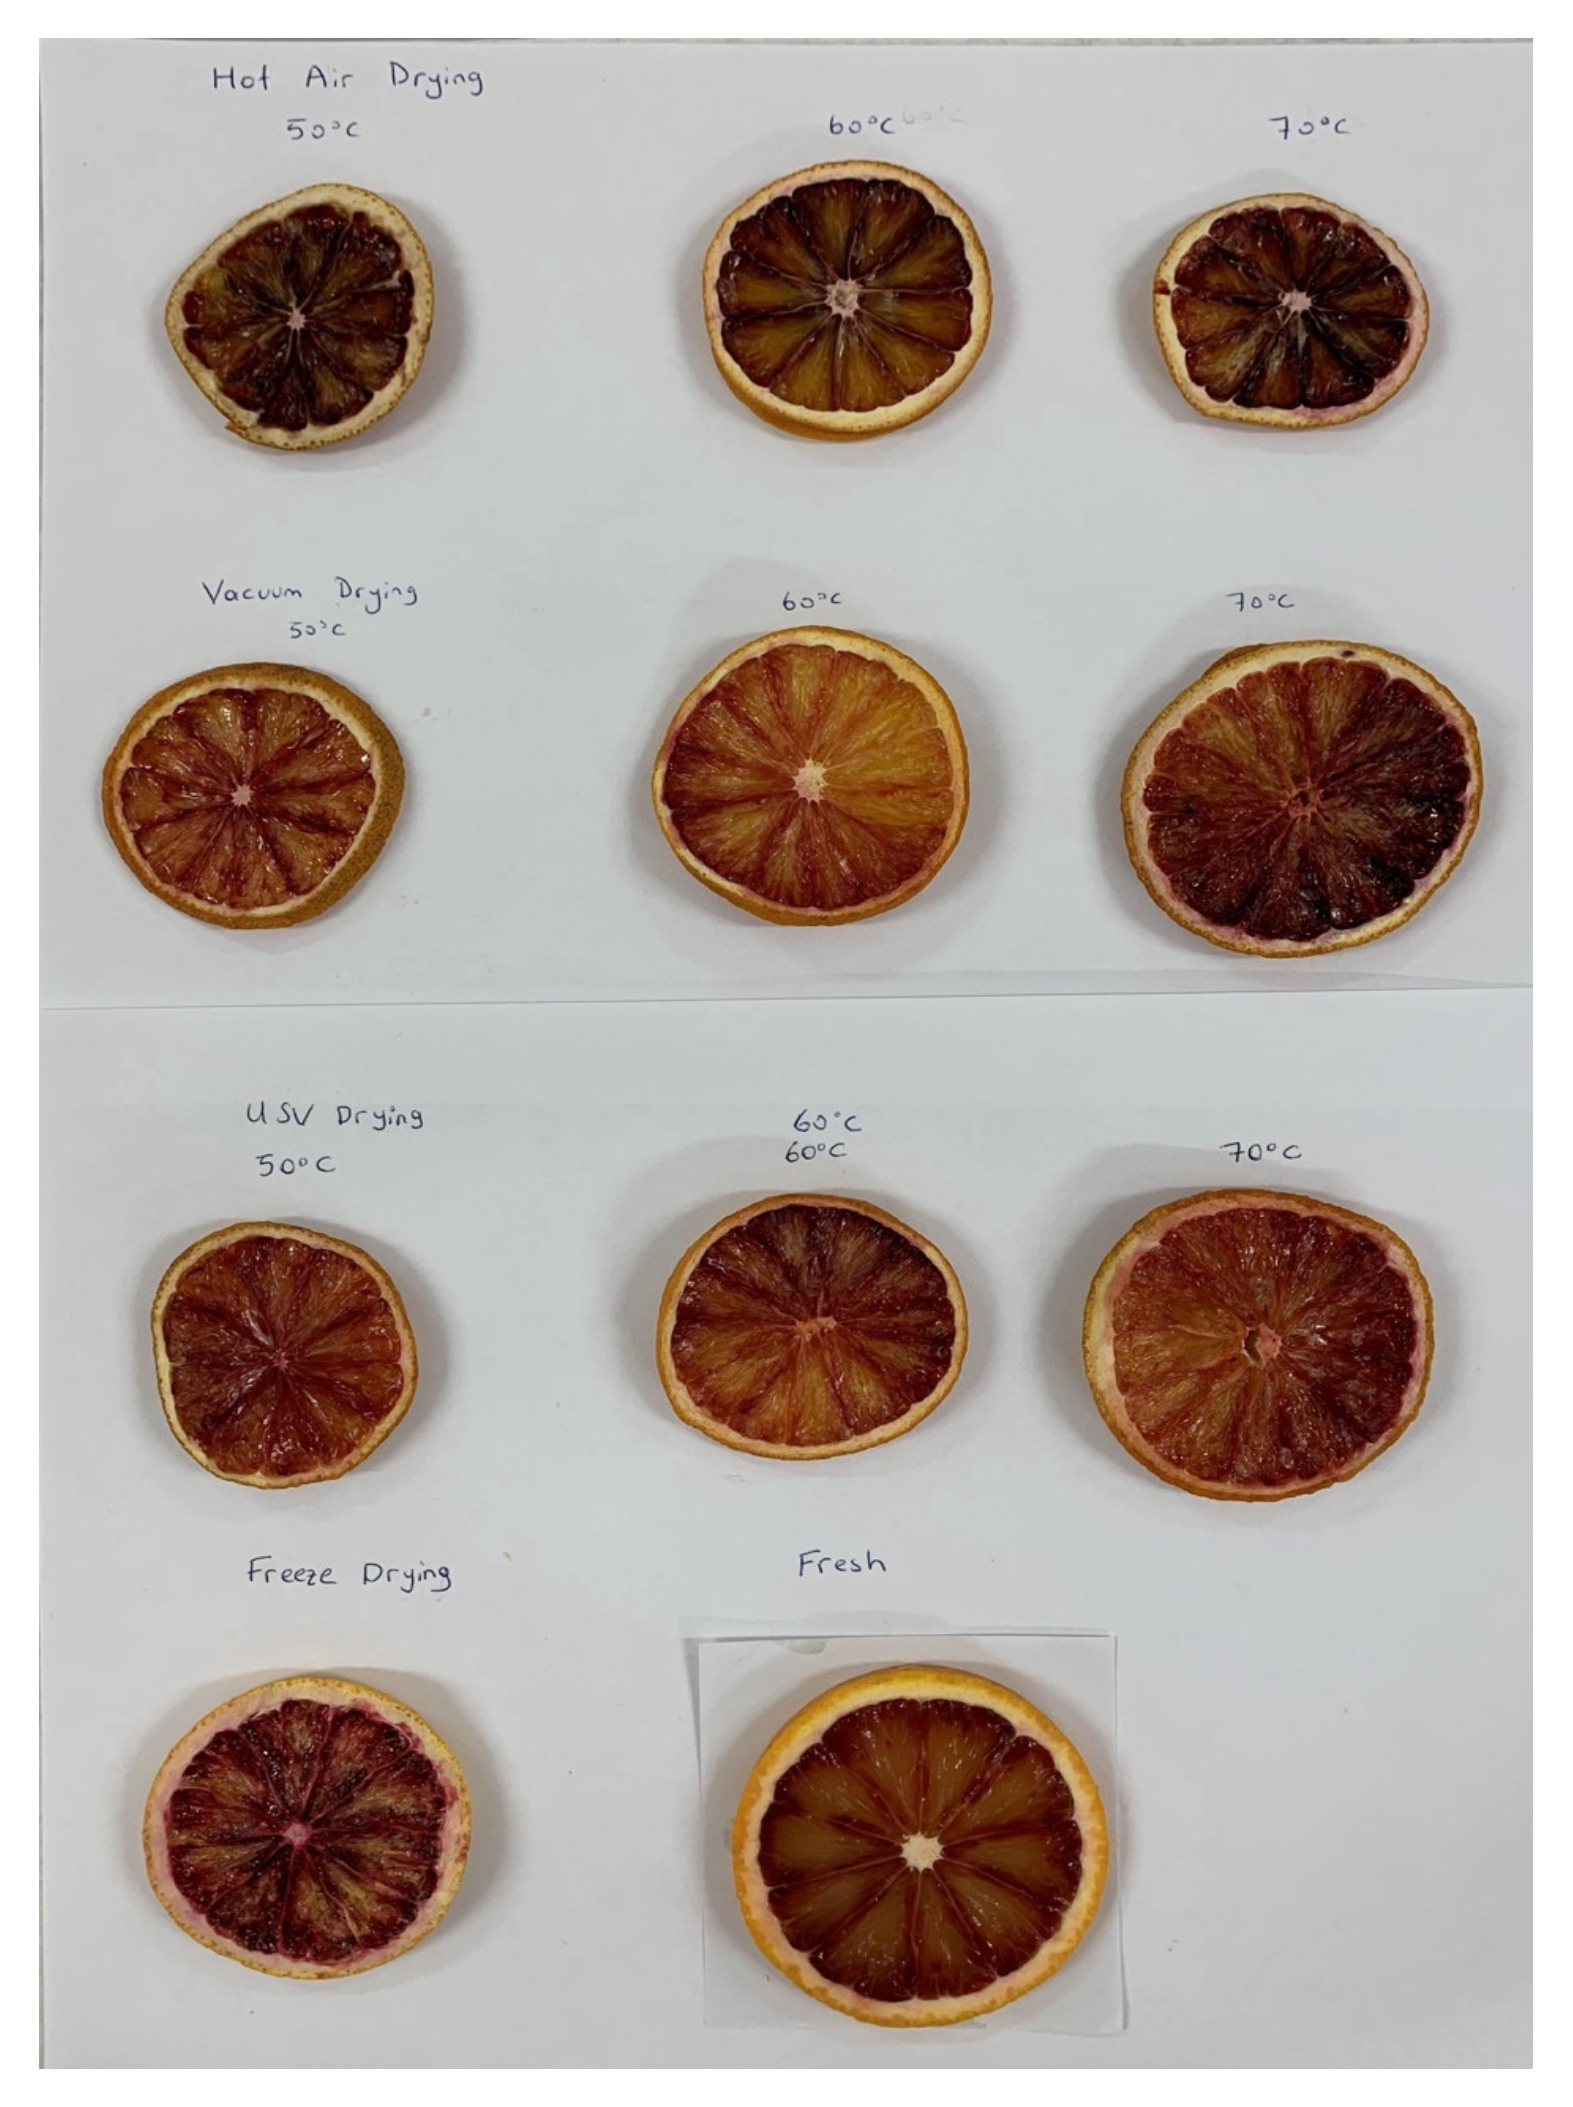
3.5. Color
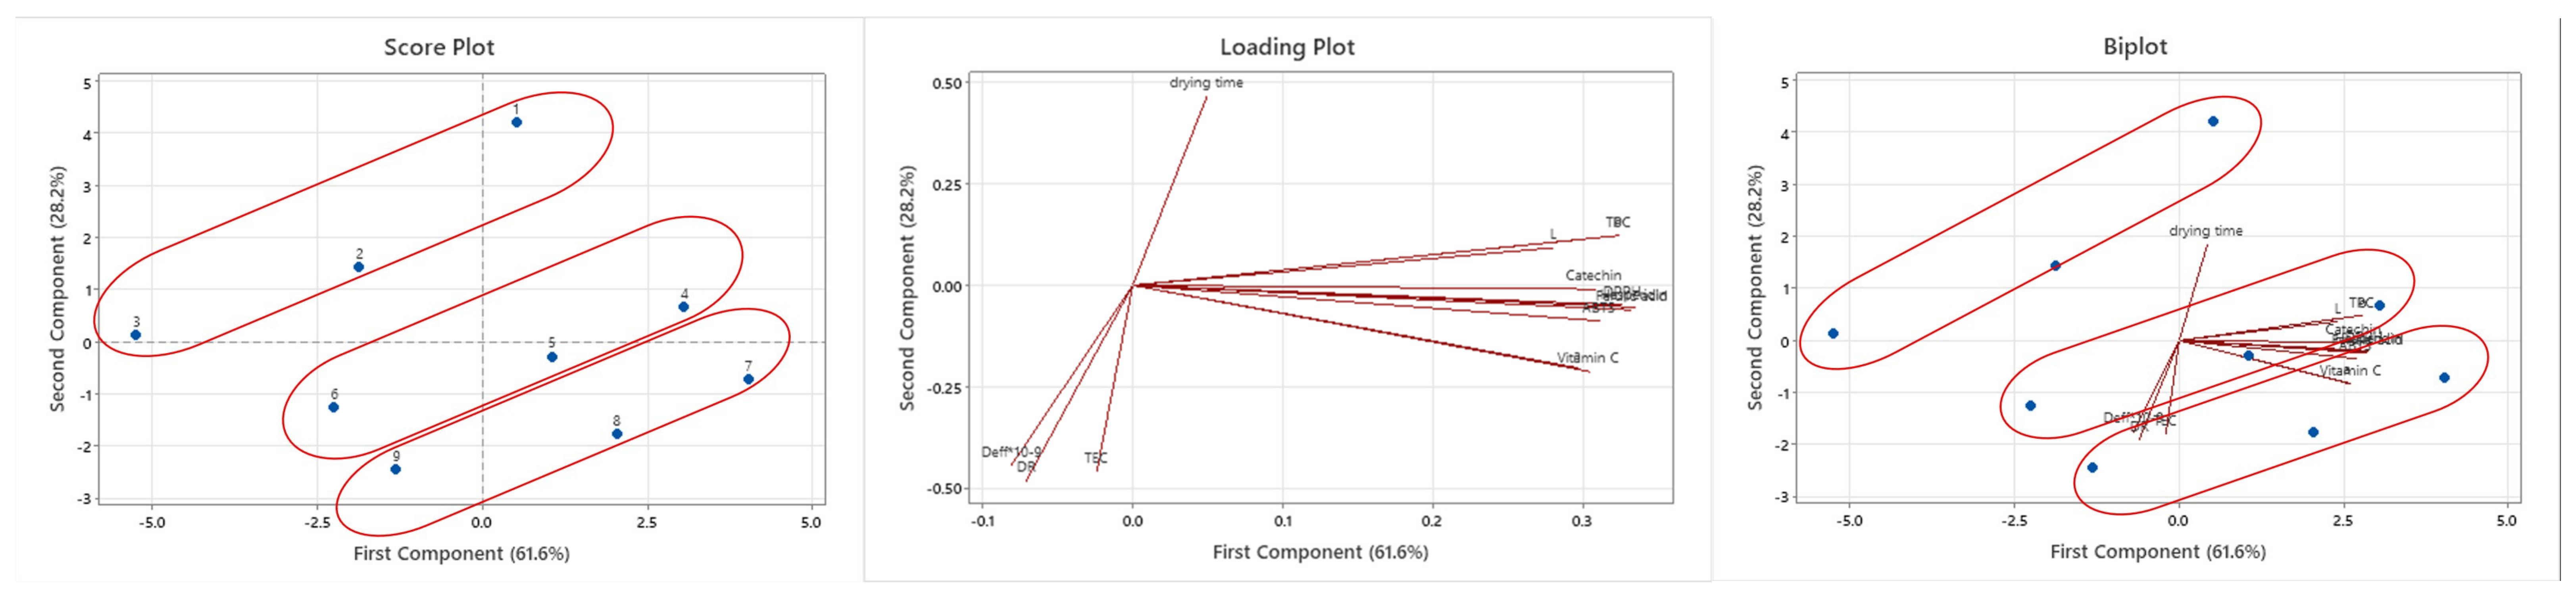
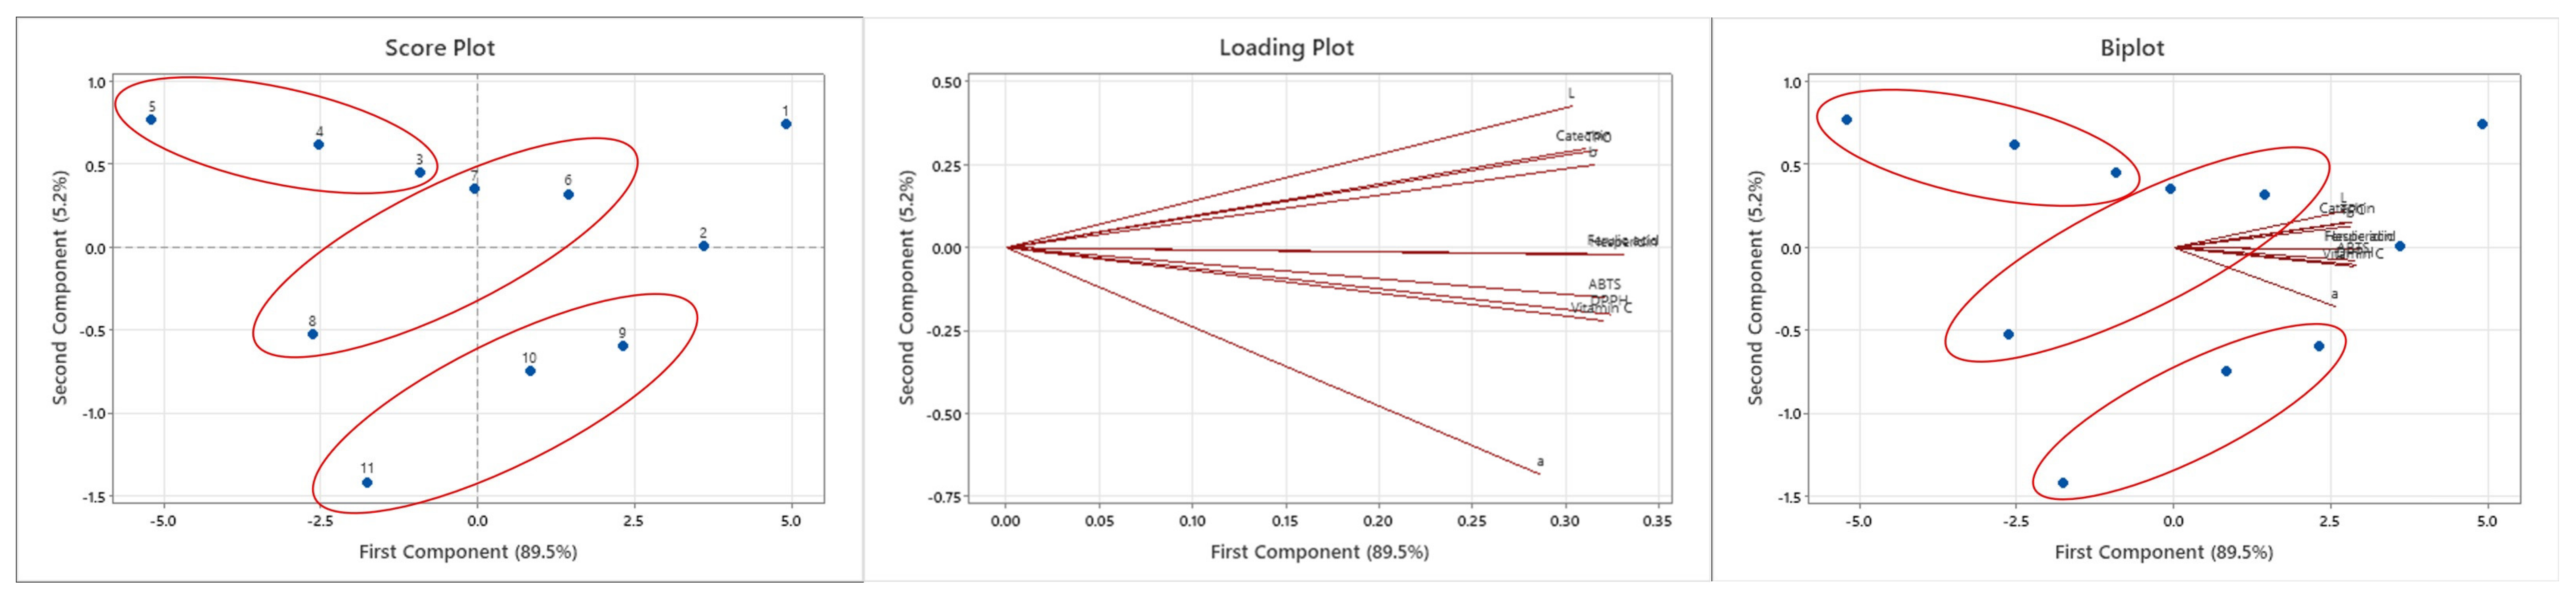
3.6. PCA
4. Conclusions
Author Contributions
Funding
Data Availability Statement
Conflicts of Interest
Abbreviations
| ABTS | 2,2′-azino-bis(3-ethylbenzothiazoline-6-sulfonic acid |
| Deff | Effective moisture diffusivity |
| DPPH | 2,2-diphenyl-1-picrylhydrazyl |
| DR | Drying rate |
| FD | Freeze-drying |
| HAD | Hot air drying |
| HPLC | High-performance liquid chromatography |
| Me | Equilibrium moisture content |
| Mt | Moisture content at time t |
| M0 | Initial moisture content |
| MR | Moisture ratio |
| MRprei | Predicted moisture ratio |
| MRexpi | Experimentally determined moisture ratio |
| RMSE | Root mean square error |
| TPC | Total phenolic content |
| UAVD | Ultrasound-assisted vacuum drying |
| VD | Vacuum drying |
References
- Lv, X.; Zhao, S.; Ning, Z.; Zeng, H.; Shu, Y.; Tao, O.; Xiao, C.; Lu, C.; Liu, Y. Citrus fruits as a treasure trove of active natural metabolites that potentially provide benefits for human health. Chem. Cent. J. 2015, 9, 68. [Google Scholar] [CrossRef] [PubMed]
- Gunduz, C.; Rezaei, M.; Quaglia, R.; Pironti, M. Culinary tourism: Exploring cultural diplomacy through gastronomy festivals in Turkey and Italy. Br. Food J. 2024, 126, 2621–2645. [Google Scholar] [CrossRef]
- Medda, S.; Fadda, A.; Mulas, M. Influence of climate change on metabolism and biological characteristics in perennial woody fruit crops in the Mediterranean environment. Horticulturae 2022, 8, 273. [Google Scholar] [CrossRef]
- Rapisarda, P.; Bellomo, S.E.; Intrigliolo, F. Anthocyanins in blood oranges: Composition and biological activity. Recent Res. Dev. Agric. Food Chem. 2001, 5, 217–230. [Google Scholar]
- Rapisarda, P.; Fabroni, S.; Peterek, S.; Russo, G.; Mock, H.P. Juice of new citrus hybrids (Citrus clementina Hort. ex Tan.× C. sinensis L. Osbeck) as a source of natural antioxidants. Food Chem. 2009, 117, 212–218. [Google Scholar] [CrossRef]
- Habibi, F.; Ramezanian, A.; Guillén, F.; Castillo, S.; Serrano, M.; Valero, D. Changes in Bioactive Compounds, Antioxidant Activity, and Nutritional Quality of Blood Orange Cultivars at Different Storage Temperatures. Antioxidants 2020, 9, 1016. [Google Scholar] [CrossRef]
- Abderrahim, K.A.; Remini, H.; Dahmoune, F.; Mouhoubi, K.; Berkani, F.; Abbou, A.; Aoun, O.; Dairi, S.; Belbahi, A.; Kadri, N.; et al. Influence of convective and microwave drying on Algerian blood orange slices: Drying kinetics and characteristics, modeling, and drying energetics. J. Food Process Eng. 2022, 45, e14176. [Google Scholar] [CrossRef]
- Hnin, K.K.; Zhang, M.; Ju, R.; Wang, B. A novel infrared pulse-spouted freeze drying on the drying kinetics, energy consumption and quality of edible rose flowers. LWT—Food Sci. Technol. 2021, 136, 110318. [Google Scholar] [CrossRef]
- Ashtiani, S.H.M.; Rafiee, M.; Mohebi Morad, M.; Martynenko, A. Cold plasma pretreatment improves the quality and nutritional value of ultrasound-assisted convective drying: The case of goldenberry. Dry. Technol. 2022, 40, 1639–1657. [Google Scholar] [CrossRef]
- Ashtiani, S.H.M.; Rafiee, M.; Morad, M.M.; Khojastehpour, M.; Khani, M.R.; Rohani, A.; Shokri, B.; Martynenko, A. Impact of gliding arc plasma pretreatment on drying efficiency and physicochemical properties of grape. Innov. Food Sci. Emerg. Technol. 2020, 63, 102381. [Google Scholar] [CrossRef]
- Reis, F.R. Vacuum Drying for Extending Food Shelf-Life; Springer: Berlin/Heidelberg, Germany, 2014. [Google Scholar]
- Tekin, Z.H.; Başlar, M.; Karasu, S.; Kilicli, M. Dehydration of green beans using ultrasound-assisted vacuum drying as a novel technique: Drying kinetics and quality parameters. J. Food Process. Preserv. 2017, 41, e13227. [Google Scholar] [CrossRef]
- Kayacan, S.; Sagdic, O.; Doymaz, I.; Karasu, S. The effect of different drying methods on total bioactive properties, individual phenolic compounds, rehydration ability, color, and microstructural characteristics of Asian pear. J. Food Process. Preserv. 2022, 46, e16682. [Google Scholar] [CrossRef]
- Baslar, M.; Kılıclı, M.; Toker, O.S.; Sagdıc, O.; Arici, M. Ultrasonic vacuum drying technique as a novel process for shortening the drying period for beef and chicken meats. Innov. Food Sci. Emerg. Technol. 2014, 26, 182–190. [Google Scholar] [CrossRef]
- Chen, Z.G.; Guo, X.Y.; Wu, T. A novel dehydration technique for carrot slices implementing ultrasound and vacuum drying methods. Ultrason. Sonochem. 2016, 30, 28–34. [Google Scholar] [CrossRef]
- da Silva, E.S.; Brandão, S.C.R.; da Silva, A.L.; da Silva, J.H.F.; Coêlho, A.C.D.; Azoubel, P.M. Ultrasound-assisted vacuum drying of nectarine. J. Food Eng. 2019, 246, 119–124. [Google Scholar] [CrossRef]
- Tekin Cakmak, Z.H.; Kayacan Cakmakoglu, S.; Avcı, E.; Sagdic, O.; Karasu, S. Ultrasound-assisted vacuum drying as alternative drying method to increase drying rate and bioactive compounds retention of raspberry. J. Food Process. Preserv. 2021, 45, e16044. [Google Scholar] [CrossRef]
- Tekin, Z.H.; Baslar, M. The effect of ultrasound-assisted vacuum drying on the drying rate and quality of red peppers. J. Therm. Anal. Calorim. 2018, 132, 1131–1143. [Google Scholar] [CrossRef]
- Baslar, M.; Kılıclı, M.; Yalınkılıc, B. Dehydration kinetics of salmon and trout fillets using ultrasonic vacuum drying as a novel technique. Ultrason. Sonochem. 2015, 27, 495–502. [Google Scholar] [CrossRef]
- Wang, X.; Xu, S.; Wu, Z.; Li, Y.; Wang, Y.; Wu, Z.; Zhu, G.; Yang, M. A novel ultrasound-assisted vacuum drying technique for improving drying efficiency and physicochemical properties of Schisandra chinensis extract powder. Food Sci. Nutr. 2022, 10, 49–59. [Google Scholar] [CrossRef]
- da Silva Júnior, E.V.; de Melo, L.L.; de Medeiros, R.A.B.; Barros, Z.M.P.; Azoubel, P.M. Influence of ultrasound and vacuum assisted drying on papaya quality parameters. LWT—Food Sci. Technol. 2018, 97, 317–322. [Google Scholar] [CrossRef]
- Gong, Y.; Fan, L.; Wang, L.; Li, J. Flos Sophorae Immaturus: Phytochemistry, bioactivities, and its potential applications. Food Rev. Int. 2023, 39, 3185–3203. [Google Scholar] [CrossRef]
- Habibi, F.; Ramezanian, A.; Guillén, F.; Serrano, M.; Valero, D. Blood oranges maintain bioactive compounds and nutritional quality by postharvest treatments with γ-aminobutyric acid, methyl jasmonate or methyl salicylate during cold storage. Food Chem. 2020, 306, 125634. [Google Scholar] [CrossRef] [PubMed]
- Kilic, A. Mathematical Modeling of Low Temperature High Velocity (LTHV) Drying in Foods. J. Food Process Eng. 2017, 40, e12378. [Google Scholar] [CrossRef]
- Henderson, S.; Pabis, S. Grain drying theory: IV. The effect of air flow rate on the drying index. J. Agric. Eng. Res. 1962, 7, 85–89. [Google Scholar]
- Lewis, W.K. The rate of drying of solid materials. Ind. Eng. Chem. 1921, 13, 427–432. [Google Scholar] [CrossRef]
- Yagcioglu, A. Drying characteristic of laurel leaves under different conditions. In Proceedings of the 7th International Congress on Agricultural Mechanization and Energy, Adana, Türkiye, 26–27 May 1999. [Google Scholar]
- Midilli, A.; Kucuk, H. Mathematical modeling of thin layer drying of pistachio by using solar energy. Energy Convers. Manag. 2003, 44, 1111–1122. [Google Scholar] [CrossRef]
- Toğrul, İ.T.; Pehlivan, D. Modelling of drying kinetics of single apricot. J. Food Eng. 2003, 58, 23–32. [Google Scholar] [CrossRef]
- Page, G.E. Factors Influencing the Maximum Rates of Air-Drying Shelled Corn in Thin Layers. Master’s Thesis, Purdue University, West Lafayette, Indiana, 1949. [Google Scholar]
- Süfer, Ö.; Sezer, S.; Demir, H. Thin layer mathematical modeling of convective, vacuum and microwave drying of intact and brined onion slices. J. Food Process. Preserv. 2017, 41, e13239. [Google Scholar] [CrossRef]
- Ertekin, C.; Yaldiz, O. Drying of eggplant and selection of a suitable thin layer drying model. J. Food Eng. 2004, 63, 349–359. [Google Scholar] [CrossRef]
- Wang, C.; Singh, R. A Single Layer Drying Equation for Rough Rice; ASAE Paper; ASAE: St. Joseph, MI, USA, 1978. [Google Scholar]
- Corzo, O.; Bracho, N.; Pereira, A.; Vásquez, A. Weibull distribution for modeling air drying of coroba slices. LWT—Food Sci. Technol. 2008, 41, 2023–2028. [Google Scholar] [CrossRef]
- Batu, H.S.; Kadakal, C. Drying characteristics and degradation kinetics in some parameters of goji berry (Lycium Barbarum L.) fruit during hot air drying. Ital. J. Food Sci. 2021, 33, 16–28. [Google Scholar] [CrossRef]
- Goztepe, B.; Kayacan, S.; Bozkurt, F.; Tomas, M.; Sagdic, O.; Karasu, S. Drying kinetics, total bioactive compounds, antioxidant activity, phenolic profile, lycopene and β-carotene content and color quality of Rosehip dehydrated by different methods. LWT—Food Sci. Technol. 2022, 153, 112476. [Google Scholar] [CrossRef]
- Singleton, V.L.; Rossi, J.A. Colorimetry of total phenolics with phosphomolybdic-phosphotungstic acid reagents. Am. J. Enol. Vitic. 1965, 16, 144–158. [Google Scholar] [CrossRef]
- Brand-Williams, W.; Cuvelier, M.E.; Berset, C.L.W.T. Use of a free radical method to evaluate antioxidant activity. LWT—Food Sci. Technol. 1995, 28, 25–30. [Google Scholar] [CrossRef]
- Arnao, M.B.; Cano, A.; Hernández-Ruiz, J.; Garcıa-Cánovas, F.; Acosta, M. Inhibition by L-ascorbic acid and other antioxidants of the 2, 2′-azino-bis (3-ethylbenzthiazoline-6-sulfonic acid) oxidation catalyzed by peroxidase: A new approach for determining total antioxidant status of foods. Anal. Biochem. 1996, 236, 255–261. [Google Scholar] [CrossRef]
- Turan, B.; Tekin-Cakmak, Z.H.; Kayacan Çakmakoglu, S.; Karasu, S.; Kasapoglu, M.Z.; Avci, E. Effect of different drying techniques on total bioactive compounds and individual phenolic composition in goji berries. Processes 2023, 11, 754. [Google Scholar] [CrossRef]
- Modica, G.; Legua, P.; La Malfa, S.; Gentile, A.; Continella, A. Qualitative Traits and Antioxidant Properties of Blood Oranges Are Affected by the Genotype and the Climatic Conditions. Foods 2024, 13, 3137. [Google Scholar] [CrossRef]
- Lever, J.; Krzywinski, M.; Altman, N. Points of significance: Principal component analysis. Nat. Methods 2017, 14, 641–642. [Google Scholar] [CrossRef]
- Akdaş, S.; Başlar, M. Dehydration and degradation kinetics of bioactive compounds for mandarin slices under vacuum and oven drying conditions. J. Food Process. Preserv. 2015, 39, 1098–1107. [Google Scholar] [CrossRef]
- Li, Y.; Wang, X.; Wu, Z.; Wan, N.; Yang, M. Dehydration of hawthorn fruit juices using ultrasound-assisted vacuum drying. Ultrason. Sonochem. 2020, 68, 105219. [Google Scholar] [CrossRef]
- Akcicek, A.; Avci, E.; Tekin-Cakmak, Z.H.; Kasapoglu, M.Z.; Sagdic, O.; Karasu, S. Influence of different drying techniques on the drying kinetics, total bioactive compounds, anthocyanin profile, color, and microstructural properties of blueberry fruit. ACS Omega 2023, 8, 41603–41611. [Google Scholar] [CrossRef] [PubMed]
- Liu, S.; Zhu, W.; Bai, X.; Taifei, Y.; Yan, J. Effect of ultrasonic energy density on moisture transfer during ultrasound enhanced vacuum drying of honey. J. Food Meas. Charact. 2019, 13, 559–570. [Google Scholar] [CrossRef]
- Tepe, T.K.; Tepe, B. The comparison of drying and rehydration characteristics of intermittent-microwave and hot-air dried-apple slices. Heat Mass Transf. 2020, 56, 3047–3057. [Google Scholar] [CrossRef]
- Huang, Y.W.; Chen, M.Q. Thin-layer isothermal drying kinetics of municipal sewage sludge based on two falling rate stages during hot-air-forced convection. J. Therm. Anal. Calorim. 2017, 129, 567–575. [Google Scholar] [CrossRef]
- Hunlun, C.; De Beer, D.; Sigge, G.O.; Van Wyk, J. Phenolic composition and total antioxidant capacity of South African frozen concentrated orange juice as affected by varietal, seasonal and regional differences. J. Sci. Food Agric. 2019, 99, 1029–1037. [Google Scholar] [CrossRef]
- Legua, P.; Modica, G.; Porras, I.; Conesa, A.; Continella, A. Bioactive compounds, antioxidant activity and fruit quality evaluation of eleven blood orange cultivars. J. Sci. Food Agric. 2022, 102, 2960–2971. [Google Scholar] [CrossRef]
- Chouaibi, M.; Snoussi, A.; Attouchi, S.; Ferrari, G. Influence of drying processes on bioactive compounds profiles, hydroxymethylfurfural, color parameters, and antioxidant activities of Tunisian eggplant (Solanum melongena L.). J. Food Process. Preserv. 2021, 45, e15460. [Google Scholar] [CrossRef]
- Cömert, E.D.; Gökmen, V. Evolution of food antioxidants as a core topic of food science for a century. Food Res. Int. 2018, 105, 76–93. [Google Scholar] [CrossRef]
- Ertekin, O.; Yaldiz, C. Thin layer solar drying of some different vegetables. Dry. Technol. 2001, 19, 583–596. [Google Scholar]
- Zhuo, Z.; Xi, W.; Hu, Y.; Nie, C.; Zhou, Z. Antioxidant activity of citrus fruits. Food Chem. 2016, 196, 885–896. [Google Scholar]
- Cebadera-Miranda, L.; Domínguez, L.; Dias, M.I.; Barros, L.; Ferreira, I.C.; Igual, M.; Martínez-Navarrete, N.; Fernández-Ruiz, V.; Morales, P.; Cámara, M. Sanguinello and Tarocco (Citrus sinensis [L.] Osbeck): Bioactive compounds and colour appearance of blood oranges. Food Chem. 2019, 270, 395–402. [Google Scholar] [CrossRef] [PubMed]
- Rapisarda, P.; Tomaino, A.; Lo Cascio, R.; Bonina, F.; De Pasquale, A.; Saija, A. Antioxidant effectiveness as influenced by phenolic content of fresh orange juices. J. Agric. Food Chem. 1999, 47, 4718–4723. [Google Scholar] [CrossRef]
- Ordóñez-Díaz, J.L.; Hervalejo, A.; Pereira-Caro, G.; Muñoz-Redondo, J.M.; Romero-Rodríguez, E.; Arenas-Arenas, F.J.; Moreno-Rojas, J.M. Effect of rootstock and harvesting period on the bioactive compounds and antioxidant activity of two Orange cultivars (‘Salustiana’ and‘Sanguinelli’) widely used in juice industry. Processes 2020, 8, 1212. [Google Scholar] [CrossRef]
- Hirsch, A.R.; Förch, K.; Neidhart, S.; Wolf, G.; Carle, R. Effects of thermal treatments and storage on pectin methylesterase and peroxidase activity in freshly squeezed orange juice. J. Sci. Food Agric. 2008, 56, 5691–5699. [Google Scholar] [CrossRef]
- Kumar, D.; Ladaniya, M.S.; Gurjar, M.; Kumar, S. Impact of drying methods on natural antioxidants, phenols and flavanones of immature dropped Citrus sinensis L. Osbeck fruits. Sci. Rep. 2022, 12, 6684. [Google Scholar] [CrossRef]
- Xue, P.; Zhang, G.; Zhang, J.; Ren, L. Synergism of ellagic acid in combination with radiotherapy and chemotherapy for cancer treatment. Phytomedicine 2022, 99, 153998. [Google Scholar] [CrossRef]
- Kammoun Bejar, A.; Kechaou, N.; Boudhrioua Mihoubi, N. Effect of microwave treatment on physical and functional properties of orange (Citrus sinensis) peel and leaves. J. Food Process. Technol. 2011, 2, 109–116. [Google Scholar] [CrossRef]
- Xiao, H.W.; Lin, H.; Yao, X.D.; Du, Z.L.; Lou, Z.; Gao, Z.J. Effects of different pretreatments on drying kinetics and quality of sweet potato bars undergoing air impingement drying. Int. J. Food Eng. 2009, 5. [Google Scholar] [CrossRef]
- Zhao, W.; Yang, R.; Wang, M.; Lu, R. Effects of pulsed electric fields on bioactive components, colour and flavour of green tea infusions. Int. J. Food Sci. Technol. 2009, 44, 312–321. [Google Scholar] [CrossRef]
- Bushra, S. Effect of drying techniques on the total phenolic contents and antioxidant activity of selected fruits. J. Med. Plants Res. 2012, 6, 161–167. [Google Scholar]
- Lim, Y.P.; Pang, S.F.; Yusoff, M.M.; Mudalip, S.K.A.; Gimbun, J. Correlation between the extraction yield of mangiferin to the antioxidant activity, total phenolic and total flavonoid content of Phaleria macrocarpa fruits. J. Appl. Res. Med. Aromat. Plants 2019, 14, 100224. [Google Scholar] [CrossRef]
- Mouhoubi, K.; Boulekbache-Makhlouf, L.; Mehaba, W.; Himed-Idir, H.; Madani, K. Convective and microwave drying of coriander leaves: Kinetics characteristics and modeling, phenolic contents, antioxidant activity, and principal component analysis. J. Food Process Eng. 2022, 45, e13932. [Google Scholar] [CrossRef]
- Zheng, W.; Wang, S.Y. Antioxidant activity and phenolic compounds in selected herbs. J. Agric. Food Chem. 2001, 49, 5165–5170. [Google Scholar] [CrossRef]
- Terpinc, P.; Čeh, B.; Ulrih, N.P.; Abramovič, H. Studies of the correlation between antioxidant properties and the total phenolic content of different oil cake extracts. Ind. Crops Prod. 2012, 39, 210–217. [Google Scholar] [CrossRef]

| Model | Mathematical Equation | Reference |
|---|---|---|
| Demir | y = a × exp(−k × x)n + c | [24] |
| Henderson and Pabis | y = a × exp(−k × x) | [25] |
| Lewis | y = exp(−k × x) | [26] |
| Logarithmic | y = a × exp(−k × x) + c | [27] |
| Midilli and Kucuk | y = a × exp(−k × (xn)) + b × t | [28] |
| Modified Page | y = exp(−((k × x)n)) | [29] |
| Page | y = exp(−k × (xn)) | [30] |
| Parabolic | y = a + b × x + c × x2 | [31] |
| Two-term exp | y = a × exp(−k × x) + (1 − a)*exp(−k × a × x) | [32] |
| Wang and Singh | y = 1 + a × x + b × x2 | [33] |
| Weibull | y = exp(−(xa/ba)) | [34] |
| Model | Parameters | HAD | VD | UAVD | ||||||
|---|---|---|---|---|---|---|---|---|---|---|
| 50 °C | 60 °C | 70 °C | 50 °C | 60 °C | 70 °C | 50 °C | 60 °C | 70 °C | ||
| Demir et al. [24] | a | 0.918 | 1.111 | 1.175 | 1.149 | 1.391 | 1.352 | 1.149 | 1.391 | 2.004 |
| k | 0.330 | −0.411 | −0.559 | −0.419 | −0.436 | −0.389 | −0.419 | −0.436 | −0.301 | |
| n | 0.396 | −0.403 | −0.480 | −0.372 | −0.358 | −0.392 | −0.372 | −0.358 | −0.304 | |
| c | 0.049 | −0.144 | −0.086 | −0.164 | −0.371 | −0.390 | −0.164 | −0.371 | −0.989 | |
| R2 | 0.983 | 0.997 | 0.998 | 0.999 | 0.999 | 0.998 | 0.999 | 0.999 | 0.999 | |
| RMSE | 0.0455 | 0.0212 | 0.0192 | 0.0165 | 0.0152 | 0.0161 | 0.0137 | 0.0195 | 0.0114 | |
| χ2 | 0.0023 | 0.0005 | 0.0005 | 0.0003 | 0.0003 | 0.0003 | 0.0002 | 0.0005 | 0.0002 | |
| Henderson and Pabis [25] | a | 0.943 | 1.006 | 1.015 | 1.027 | 1.078 | 1.013 | 1.027 | 1.078 | 1.087 |
| k | 0.112 | 0.229 | 0.330 | 0.221 | 0.286 | 0.286 | 0.221 | 0.286 | 0.272 | |
| R2 | 0.982 | 0.993 | 0.995 | 0.994 | 0.987 | 0.998 | 0.994 | 0.987 | 0.982 | |
| RMSE | 0.0466 | 0.0343 | 0.0286 | 0.0470 | 0.0489 | 0.0399 | 0.0314 | 0.0356 | 0.0576 | |
| χ2 | 0.0023 | 0.0013 | 0.0009 | 0.0025 | 0.0027 | 0.0018 | 0.0011 | 0.0014 | 0.0038 | |
| Lewis [26] | k | 0.120 | 0.227 | 0.325 | 0.215 | 0.265 | 0.282 | 0.215 | 0.265 | 0.248 |
| R2 | 0.979 | 0.993 | 0.995 | 0.993 | 0.983 | 0.990 | 0.993 | 0.983 | 0.976 | |
| RMSE | 0.0499 | 0.0344 | 0.0290 | 0.0532 | 0.0565 | 0.0402 | 0.0327 | 0.0448 | 0.0666 | |
| χ2 | 0.0025 | 0.0012 | 0.0009 | 0.0030 | 0.0034 | 0.0017 | 0.0011 | 0.0021 | 0.0047 | |
| Logarithmic [27] | a | 0.918 | 1.111 | 1.075 | 1.149 | 1.391 | 1.352 | 1.149 | 1.391 | 2.004 |
| k | 0.131 | 0.166 | 0.330 | 0.156 | 0.156 | 0.152 | 0.156 | 0.156 | 0.091 | |
| c | 0.049 | 0.144 | 0.186 | −0.164 | −0.371 | −0.390 | −0.164 | −0.371 | −0.989 | |
| R2 | 0.983 | 0.997 | 0.998 | 0.999 | 0.999 | 0.998 | 0.999 | 0.999 | 0.999 | |
| RMSE | 0.0455 | 0.0212 | 0.0192 | 0.0165 | 0.0152 | 0.0161 | 0.0137 | 0.0195 | 0.0114 | |
| χ2 | 0.0022 | 0.0005 | 0.0004 | 0.0003 | 0.0003 | 0.0003 | 0.0002 | 0.0005 | 0.0002 | |
| Midilli and Kucuk [28] | a | 0.959 | 1.035 | 1.314 | 0.966 | 0.969 | 4.663 | 0.966 | 0.969 | 0.968 |
| k | 0.177 | 0.191 | 0.238 | 0.149 | 0.135 | 0.054 | 0.149 | 0.135 | 0.108 | |
| n | 0.809 | 0.842 | 1.203 | 1.194 | 1.449 | 0.723 | 1.194 | 1.450 | 1.559 | |
| b | −0.00004 | 0.00003 | 0.708 | 0.0000004 | −0.000015 | 2.890 | 0.0000004 | −0.00001 | 0.00006 | |
| t | −0.00004 | 0.00003 | 0.446 | 0.0000004 | −0.000015 | −1.268 | 0.0000004 | −0.00001 | 0.00006 | |
| R2 | 0.986 | 0.998 | 0.998 | 0.996 | 0.998 | 1.000 | 0.996 | 0.998 | 0.997 | |
| RMSE | 0.0406 | 0.0299 | 0.0183 | 0.0314 | 0.0192 | 0.0313 | 0.0243 | 0.0176 | 0.0233 | |
| χ2 | 0.0018 | 0.0011 | 0.0005 | 0.0013 | 0.0005 | 0.0014 | 0.0007 | 0.0004 | 0.0008 | |
| Modified Page [29] | k | 0.123 | 0.224 | 0.319 | 0.211 | 0.259 | 0.279 | 0.211 | 0.259 | 0.247 |
| n | 0.845 | 1.083 | 1.127 | 1.131 | 1.374 | 1.140 | 1.131 | 1.374 | 1.464 | |
| R2 | 0.986 | 0.994 | 0.997 | 0.996 | 0.998 | 0.993 | 0.996 | 0.998 | 0.997 | |
| RMSE | 0.0411 | 0.0319 | 0.0222 | 0.0320 | 0.0213 | 0.0343 | 0.0256 | 0.0207 | 0.0255 | |
| χ2 | 0.0018 | 0.0011 | 0.0004 | 0.0011 | 0.0005 | 0.0013 | 0.0007 | 0.0005 | 0.0007 | |
| Page [30] | k | 0.170 | 0.198 | 0.276 | 0.172 | 0.186 | 0.233 | 0.172 | 0.156 | 0.129 |
| n | 0.845 | 1.083 | 1.127 | 1.131 | 1.374 | 1.140 | 1.131 | 1.374 | 1.464 | |
| R2 | 0.986 | 0.994 | 0.997 | 0.996 | 0.998 | 0.993 | 0.996 | 0.998 | 0.997 | |
| RMSE | 0.0411 | 0.0319 | 0.0222 | 0.0320 | 0.0213 | 0.0343 | 0.0256 | 0.0207 | 0.0255 | |
| χ2 | 0.0018 | 0.0011 | 0.0006 | 0.0011 | 0.0005 | 0.0013 | 0.0007 | 0.0005 | 0.0007 | |
| Parabolic [31] | a | 0.877 | 0.937 | 0.957 | 0.957 | 1.012 | 0.951 | 0.957 | 1.012 | 1.014 |
| c | 0.002 | 0.006 | 0.014 | 0.006 | 0.010 | 0.009 | 0.006 | 0.010 | −0.178 | |
| b | −0.072 | −0.148 | −0.224 | −0.146 | −0.198 | −0.186 | −0.146 | −0.198 | 0.006 | |
| R2 | 0.970 | 0.996 | 0.998 | 0.998 | 0.999 | 0.998 | 0.998 | 0.999 | 0.999 | |
| RMSE | 0.0598 | 0.0251 | 0.0163 | 0.0184 | 0.0106 | 0.0187 | 0.0191 | 0.0241 | 0.0104 | |
| χ2 | 0.0038 | 0.0004 | 0.0001 | 0.0004 | 0.0001 | 0.0004 | 0.0004 | 0.0007 | 0.0001 | |
| Two Term Exp [32] | a | 0.219 | 1.544 | 1.625 | 1.621 | 1.890 | 1.636 | 1.621 | 1.889 | 1.943 |
| k | 0.276 | 0.413 | 0.435 | 0.273 | 0.394 | 0.364 | 0.273 | 0.394 | 0.386 | |
| R2 | 0.988 | 0.994 | 0.997 | 0.996 | 0.997 | 0.993 | 0.996 | 0.997 | 0.995 | |
| RMSE | 0.2646 | 0.1535 | 0.0905 | 0.0341 | 0.0257 | 0.0332 | 0.0250 | 0.0217 | 0.0320 | |
| χ2 | 0.0016 | 0.0010 | 0.0005 | 0.0013 | 0.0007 | 0.0013 | 0.0007 | 0.0005 | 0.0012 | |
| Wang and Singh [33] | a | −0.094 | −0.169 | −0.242 | −0.160 | −0.193 | −0.212 | −0.160 | −0.193 | −0.171 |
| b | 0.002 | 0.007 | 0.015 | 0.007 | 0.009 | 0.011 | 0.007 | 0.009 | 0.005 | |
| R2 | 0.955 | 0.993 | 0.997 | 0.996 | 0.999 | 0.996 | 0.996 | 0.999 | 0.999 | |
| RMSE | 0.0735 | 0.0339 | 0.0227 | 0.0185 | 0.0115 | 0.0264 | 0.0246 | 0.0245 | 0.0117 | |
| χ2 | 0.0057 | 0.0012 | 0.0006 | 0.0004 | 0.0001 | 0.0008 | 0.0007 | 0.0007 | 0.0002 | |
| Weibull [34] | a | 0.845 | 1.083 | 1.127 | 1.131 | 1.374 | 1.140 | 1.131 | 1.374 | 1.464 |
| b | 8.114 | 4.456 | 3.138 | 4.732 | 4.865 | 3.585 | 4.733 | 3.865 | 4.042 | |
| R2 | 0.986 | 0.994 | 0.997 | 0.996 | 0.998 | 0.993 | 0.996 | 0.998 | 0.997 | |
| RMSE | 0.0411 | 0.0319 | 0.0222 | 0.0320 | 0.0213 | 0.0343 | 0.0256 | 0.0207 | 0.0255 | |
| χ2 | 0.0018 | 0.0011 | 0.0006 | 0.0011 | 0.0005 | 0.0013 | 0.0007 | 0.0005 | 0.0007 | |
| Drying Method | Temperature (°C) | Drying Time (h) | DR * (h−1) | Deff ** (m2/s) | Total Energy Consumption (kW·h) |
|---|---|---|---|---|---|
| HAD | 50 | 22.5 Aa | 0.044 | 9.08 × 10⁻¹⁰ | 0.163 |
| 60 | 12.0 Ab | 0.083 | 2.32 × 10⁻⁹ | 0.209 | |
| 70 | 9.0 Ac | 0.108 | 2.82 × 10⁻⁹ | 0.266 | |
| VD | 50 | 11.5 Ba | 0.082 | 2.60 × 10⁻⁹ | 0.196 |
| 60 | 9.5 Bb | 0.115 | 2.76 × 10⁻⁹ | 0.235 | |
| 70 | 8.5 Bc | 0.130 | 2.96 × 10⁻⁹ | 0.286 | |
| UAVD | 50 | 10.0 Ca | 0.104 | 2.20 × 10⁻⁹ | 0.298 |
| 60 | 8.5 Cb | 0.118 | 2.90 × 10⁻⁹ | 0.333 | |
| 70 | 7.5 Cc | 0.135 | 2.99 × 10⁻⁹ | 0.372 |
| TPC (mg GAE/100 g) | |||
| Fresh | 154.25 ± 4.65 A | 154.25 ± 4.65 A | 154.25 ± 4.65 A |
| FD | 131.27 ± 0.41 B | 131.27 ± 0.41 B | 131.27 ± 0.41 B |
| 50 °C | 60 °C | 70 °C | |
| HAD | 107.08 ± 0.27 Da | 87.99 ± 0.41 Db | 44.00 ± 1.90 Ec |
| VD | 122.24 ± 1.08 Ca | 112.36 ± 1.49 Cb | 59.70 ± 0.0.27 Dc |
| UAVD | 128.77 ± 0.95 Ba | 108.16 ± 1.08 Cb | 65.25 ± 2.03 Cc |
| DPPH (mg TE/100 g) | |||
| Fresh | 7380.01 ± 16.44 A | 7380.01 ± 16.44 A | 7380.01 ± 16.44 A |
| FD | 7339.09 ± 8.84 A | 7339.09 ± 8.84 A | 7339.09 ± 8.84 A |
| 50 °C | 60 °C | 70 °C | |
| HAD | 5083.67 ± 36.81 Da | 4705.49 ± 6.69 Db | 2249.00 ± 46.85 Dc |
| VD | 5990.63 ± 20.08 Ca | 5123.83 ± 36.81 Cb | 4434.40 ± 50.20 Cc |
| UAVD | 6907.63 ± 46.85 Ba | 5950.47 ± 66.69 Bb | 4926.37 ± 53.55 Bc |
| ABTS (mg TE/100 g) | |||
| Fresh | 242.67 ± 7.03 A | 242.67 ± 7.03 A | 242.67 ± 7.03 A |
| FD | 225.46 ± 0.35 B | 225.46 ± 0.35 B | 225.46 ± 0.35 B |
| 50 °C | 60 °C | 70 °C | |
| HAD | 162.93 ± 6.67 Ea | 139.74 ± 3.16 Eb | 118.31 ± 2.81 Ec |
| VD | 185.76 ± 0.70 Da | 153.80 ± 1.76 Db | 129.56 ± 1.41 Dc |
| UAVD | 218.08 ± 4.22 Ca | 192.79 ± 7.03 Cb | 169.60 ± 2.11 Cc |
| Vitamin C (mg/100 g) | |||
| Fresh | 55.32 ± 0.45 A | 55.32 ± 0.45 A | 55.32 ± 0.45 A |
| FD | 49.01 ± 0.21 B | 49.01 ± 0.21 B | 49.01 ± 0.21 B |
| 50 °C | 60 °C | 70 °C | |
| HAD | 36.19 ± 0.14 Da | 33.60 ± 0.35 Eb | 29.79 ± 0.18 Ec |
| VD | 44.81 ± 0.30 Ca | 41.40 ± 0.25 Db | 37.55 ± 0.29 Dc |
| UAVD | 46.10 ± 0.08 Ca | 44.82 ± 0.44 Ca | 41.63 ± 0.20 Cb |
| FRESH | FD | HAD | VD | UAVD | |||||||
|---|---|---|---|---|---|---|---|---|---|---|---|
| 50 °C | 60 °C | 70 °C | 50 °C | 60 °C | 70 °C | 50 °C | 60 °C | 70 °C | |||
| 4-Hydroxybenzoic acid | 698.384 | 679.661 | 617.872 | 530.046 | 415.985 | 665.501 | 548.873 | 449.317 | 687.720 | 563.045 | 464.280 |
| Gallic acid | 694.133 | 663.086 | 586.187 | 506.159 | 386.882 | 608.642 | 563.000 | 420.385 | 630.301 | 585.626 | 458.424 |
| Protocatechuic acid | 90.007 | 76.274 | 50.086 | 34.536 | 29.728 | 60.823 | 52.608 | 51.665 | 81.743 | 87.068 | 59.782 |
| Syringic acid | 419.783 | 313.852 | 151.958 | 127.316 | 73.126 | 135.800 | 122.398 | 118.860 | 137.515 | 112.840 | 111.849 |
| Caffeic acid | 773.416 | 741.618 | 645.529 | 566.257 | 412.475 | 665.606 | 537.631 | 402.346 | 696.803 | 545.505 | 405.051 |
| Chlorogenic acid | 874.063 | 828.764 | 807.190 | 629.639 | 469.726 | 824.394 | 719.540 | 570.502 | 887.985 | 733.310 | 588.280 |
| Ferulic acid | 2442.164 | 2307.669 | 1723.559 | 1586.942 | 1223.456 | 1927.890 | 1884.938 | 1645.212 | 2142.062 | 1922.387 | 1633.186 |
| o-coumaric acid | 315.635 | 300.019 | 236.401 | 200.192 | 114.675 | 276.441 | 227.648 | 130.081 | 272.344 | 231.669 | 143.211 |
| p-coumaric acid | 902.509 | 910.730 | 835.561 | 726.757 | 622.768 | 853.823 | 773.700 | 651.752 | 876.964 | 757.289 | 683.279 |
| Sinapic acid | 569.698 | 547.795 | 439.647 | 387.185 | 265.075 | 459.391 | 354.217 | 295.903 | 498.377 | 339.098 | 259.853 |
| Ellagic acid | 1137.644 | 1075.601 | 814.108 | 756.400 | 529.044 | 911.640 | 844.927 | 708.886 | 980.226 | 860.551 | 731.712 |
| Catechin | 1796.558 | 1407.770 | 1046.529 | 885.411 | 874.530 | 1264.428 | 1088.181 | 892.293 | 1279.250 | 1284.575 | 856.867 |
| Chrysin | 698.898 | 684.894 | 604.188 | 400.100 | 241.552 | 630.269 | 568.110 | 451.798 | 670.510 | 550.835 | 452.889 |
| Hesperidin | 12,201.82 | 11,766.77 | 8445.41 | 6978.38 | 5811.42 | 9832.24 | 9036.76 | 7814,85 | 10,710.31 | 9419.63 | 7757.89 |
| Quercetin | 265.783 | 219.296 | 182.930 | 146.665 | 127.057 | 152.290 | 125.304 | 108.828 | 178.698 | 134.023 | 106.376 |
| Rutin | 380.074 | 374.675 | 194.474 | 179.055 | 129.941 | 255.517 | 186.065 | 106.053 | 244.775 | 150.100 | 139.097 |
| FRESH | FD | HAD | VD | UAVD | |||||||
|---|---|---|---|---|---|---|---|---|---|---|---|
| 50 °C | 60 °C | 70 °C | 50 °C | 60 °C | 70 °C | 50 °C | 60 °C | 70 °C | |||
| L* | 54.07 ± 0.61 a | 52.70 ± 0.16 a | 44.48 ± 0.25 d | 43.20 ± 0.10 d | 40.44 ± 0.07 f | 49.75 ± 0.13 b | 47.57 ± 0.31 c | 42.51 ± 0.09 de | 46.73 ± 0.16 c | 43.42 ± 0.26 d | 42.14 ± 0.09 de |
| a* | 18.35 ± 0.14 ab | 19.38 ± 0.41 a | 14.80 ± 0.10 d | 12.46 ± 0.19 e | 9.90 ± 0.18 f | 17.64 ± 0.04 b | 16.34 ± 0.02 c | 14.97 ± 0.09 d | 19.35 ± 0.23 a | 18.72 ± 0.08 ab | 17.57 ± 0.31 b |
| b* | 16.11 ± 0.02 a | 15.38 ± 0.26 ab | 12.17 ± 0.15 c | 9.98 ± 0.54 d | 5.11 ± 0.12 f | 14.34 ± 0.28 b | 12.26 ± 0.15 c | 6.74 ± 0.20 ef | 14.14 ± 0.15 ab | 12.71 ± 0.18 c | 7.51 ± 0.12 e |
Disclaimer/Publisher’s Note: The statements, opinions and data contained in all publications are solely those of the individual author(s) and contributor(s) and not of MDPI and/or the editor(s). MDPI and/or the editor(s) disclaim responsibility for any injury to people or property resulting from any ideas, methods, instructions or products referred to in the content. |
© 2025 by the authors. Licensee MDPI, Basel, Switzerland. This article is an open access article distributed under the terms and conditions of the Creative Commons Attribution (CC BY) license (https://creativecommons.org/licenses/by/4.0/).
Share and Cite
Yilmaz, D.; Tekin-Cakmak, Z.H.; Karasu, S. Impact of Ultrasound Pretreatment and Temperature on Drying Kinetics and Quality Characteristics of Blood Orange Slices: Comparison with Different Drying Methods. Processes 2025, 13, 1596. https://doi.org/10.3390/pr13051596
Yilmaz D, Tekin-Cakmak ZH, Karasu S. Impact of Ultrasound Pretreatment and Temperature on Drying Kinetics and Quality Characteristics of Blood Orange Slices: Comparison with Different Drying Methods. Processes. 2025; 13(5):1596. https://doi.org/10.3390/pr13051596
Chicago/Turabian StyleYilmaz, Damla, Zeynep Hazal Tekin-Cakmak, and Salih Karasu. 2025. "Impact of Ultrasound Pretreatment and Temperature on Drying Kinetics and Quality Characteristics of Blood Orange Slices: Comparison with Different Drying Methods" Processes 13, no. 5: 1596. https://doi.org/10.3390/pr13051596
APA StyleYilmaz, D., Tekin-Cakmak, Z. H., & Karasu, S. (2025). Impact of Ultrasound Pretreatment and Temperature on Drying Kinetics and Quality Characteristics of Blood Orange Slices: Comparison with Different Drying Methods. Processes, 13(5), 1596. https://doi.org/10.3390/pr13051596