Abstract
An interpretable machine learning framework was constructed to predict the bandgap of silicon oxide materials used for electric furnace refractories. Among seven machine learning models compared, the AdaBoost ensemble model performed the best with an R2 of 0.80 and MAE of 0.5, indicating high accuracy. Breaking through the traditional limitation of directly correlating features such as the conduction-band minimum (CBM) and valence-band maximum (VBM), this study utilized SHapley Additive exPlanations (SHAP) analysis to uncover deeper relationships between critical features like ‘energy above hull’, ‘num of unique magnetic sites’, and ‘formation energy per atom ‘ with the bandgap. These features significantly influence the thermal stability and erosion resistance of the material. This research provides a theoretical basis for optimizing the performance of silicon oxide materials and green metallurgical processes, thereby promoting sustainable development in the steel industry.
1. Introduction
In modern metallurgical processes, electric arc furnace steelmaking stands out as a short-process method due to its advantages of low energy consumption and CO2 emissions, making it an important direction for green metallurgy. Silicon oxide materials play a crucial role in electric arc furnace steelmaking, being widely used in refractory materials, coating materials, and thermal insulation materials [1,2,3]. Silica bricks are a typical type of silicon oxide refractory material, characterized by high load-softening temperatures and excellent resistance to acidic slag erosion. Their performance directly affects the energy efficiency and operational stability of electric furnaces. The bandgap, as a core parameter of the electronic structure of silicon oxide materials, not only determines the light absorption properties and insulating strength of the materials but also has significant impacts on their thermal stability and resistance to thermal degradation [4,5]. Optimizing the bandgap of silicon oxide materials can significantly enhance their thermal stability and insulating properties, thereby reducing heat and electrical energy waste in electric arc furnace smelting and lowering CO2 emissions.
Current mainstream methods for bandgap research face significant challenges. Traditional experimental measurement approaches, while capable of obtaining highly accurate bandgap data, often encounter issues such as high experimental costs, lengthy periods, and limited applicability to complex systems or novel materials. Meanwhile, first-principles methods based on density functional theory (DFT) can provide an in-depth analysis of the electronic structure of materials. However, as the number of atoms increases, computational complexity grows exponentially, leading to a heavy reliance on supercomputing resources that limits their application in large-scale material database screening [6,7]. These limitations make traditional methods ill suited to meet the contemporary material development needs for a “rapid design-validation” loop.
In recent years, the application of machine learning techniques in materials science has provided new avenues for addressing these challenges [8,9,10]. Some scholars have employed machine learning methods to predict material bandgaps. Zhuo et al. [11] used a training set composed entirely of experimentally measured bandgaps and applied support vector regression to quantitatively predict the bandgaps of non-metals. They found that machine learning-predicted bandgaps were significantly closer to experimental reported values than those calculated using DFT. Li et al. [12] developed an ensemble learning bandgap prediction model with a coefficient of determination R2 = 0.84 using a random forest algorithm. They discovered a negative correlation between the total magnetization (“total magnetization”) feature of boron-containing materials and their bandgaps. Gok et al. [13] developed a random forest model to predict the bandgaps of various halide perovskites and simultaneously investigated the impact of different perovskite compositions on optoelectronic properties and photovoltaic performance, which was validated using the random forest model. The study demonstrated that the model exhibited excellent performance in predicting optical bandgaps.
Studies have shown that machine learning methods can rapidly establish quantitative relationship models between material structural features and properties by learning from and mining extensive experimental and computational data. These methods achieve efficient predictions at relatively low computational costs, making them particularly suitable for rapid performance screening and evaluation during the initial stages of large-scale material database construction and material discovery [14]. Despite the excellent performance of machine learning models in predictive capabilities, their “black box” nature limits their application and promotion in materials science. Although machine learning studies based on SHAP can offer a certain level of interpretability, they still have limitations in predicting the performance of specific material systems.
This study focuses on predicting the bandgap of silicon oxide materials used for electric furnace refractories by constructing an interpretable machine learning framework that decouples CBM/VBM features. By integrating SHAP analysis [15], this approach ensures good predictive performance of the machine learning model while making its decision-making process clear and interpretable, thereby meeting the needs of exploring physical significance and underlying mechanisms in materials science research. Unlike previous studies, we delve into the relationships between other critical features of silicon oxide materials and their bandgaps, providing more targeted and practically meaningful theoretical support for optimizing the performance of silicon oxide materials in electric furnace smelting, thus addressing the deficiencies of existing research in specific material applications. This research provides a theoretical foundation for optimizing the performance of silicon oxide materials in electric furnace smelting, thereby promoting the development of green metallurgical processes.
2. Model Building
Figure 1 illustrates the model development process for optimizing the performance of silicon oxide materials. Firstly, data are acquired from public datasets to establish a database for model training. Next, the data undergo analysis and preprocessing to ensure data quality and applicability. The dataset is then divided into training and testing sets. The model is trained using the training set, with optimal parameters explored during the training process. Model performance is enhanced through hyperparameter optimization, and the reliability and effectiveness of the model are validated. Finally, the model is interpreted to investigate key patterns influencing material performance, supporting material screening.
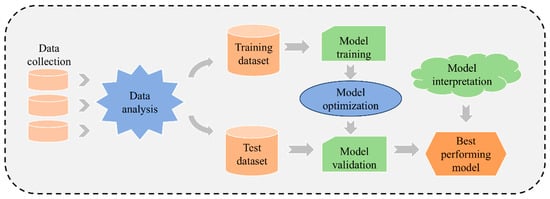
Figure 1.
Silicon oxide material bandgap prediction model development process.
2.1. Establish a Silicon Oxide Materials Database
A total of 8619 samples of silicon oxide materials were retrieved from the Materials Project [16,17] database and compiled into a dataset. The database includes 70 features such as “formula pretty”, “number of sites”, “number of elements”, “CBM”, “efermi”, “energy per atom”, and “band gap”. The “band gap” is the energy difference between the VBM and the CBM, which is the minimum energy required for an electron to transition from the valence band to the conduction band. The “band gap” is directly related to the VBM and CBM; if these values are known, the value of the “band gap” can be directly determined. However, to avoid the VBM and CBM features being overly prominent in importance, which could affect the exploration of relationships between other features and the bandgap, this study deliberately excluded these two features from the analysis. This data-filtering approach helps focus on uncovering physical characteristics that have direct or indirect effects on material performance in electric furnace smelting.
To meet the training requirements of machine learning models for predicting the performance of silicon oxide materials in electric arc furnace smelting, it is necessary to preprocess the raw data. The effectiveness of model training depends on the quantity and quality of the dataset. Given that a large number of missing values in the initial dataset could affect training outcomes, samples containing missing values were removed. The data from the Materials Project are mostly derived from DFT calculations, which are relatively accurate, but the precision of actual experimental measurements is limited. The extracted database includes both DFT calculation data and a portion of experimental data. To enhance the authenticity of the training data, we applied precision control measures to the entire database based on the measurement accuracy of each feature in experiments. Additionally, 1242 entries of obsolete or irrelevant data were removed from the dataset to ensure data quality, thereby enabling precise bandgap predictions and optimizing the performance of materials used in electric arc furnace smelting.
2.2. Feature Extraction for Silicon Oxide Material Data
Feature engineering is a crucial step in the development of machine learning models, enabling the extraction of generalizable and representative features that enhance the model’s generalization ability [18]. Proper feature selection can prevent overfitting and enhance the robustness and stability of the model. It should be noted that, due to the focus of this study being on a specific material system, feature selection was primarily based on physical interpretability rather than correlations among features, which deviates from mainstream feature-selection approaches. The initial silicon oxide material database contained numerous non-numeric columns with the data type “Object”. We attempted to re-encode these features, but found that doing so would lead to a significant increase in feature dimensionality and introduce noise; therefore, these features were removed (a total of 48). The ‘equilibrium reaction energy per atom’ feature was also removed due to its messy data type and numerous missing values. Columns such as ‘is gap direct’, ‘is magnetic’, and ‘is metal’ were re-encoded into numeric types and included in model training; however, they did not improve performance and were thus removed. Additionally, the ‘deprecated ‘ and ‘deprecation reasons’ features, which are irrelevant to model training, were also deleted. Pearson correlation coefficients were calculated for the remaining 13 features [19], and a heatmap of these coefficients was generated to illustrate the correlations between various features, as shown in Figure 2. This approach aims to precisely identify the key features affecting the performance of materials used in electric arc furnace smelting.
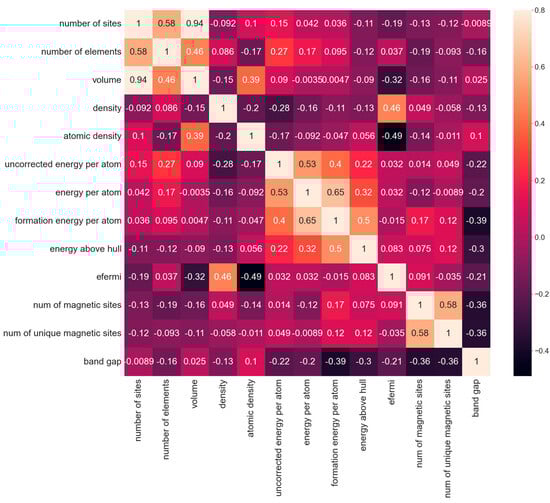
Figure 2.
Pearson correlation coefficient thermograms for 13 features of silicon oxide materials.
Some features span a wide range of values. To eliminate the differences in dimensions and magnitudes among data, and to improve the quality and comparability of the data, the Z-score method was used to standardize each feature. After data preprocessing and feature engineering, the dataset contains 5291 entries with a total of thirteen features. Descriptive statistics for the dataset are summarized in Table 1.

Table 1.
Descriptive statistics for the processed dataset.
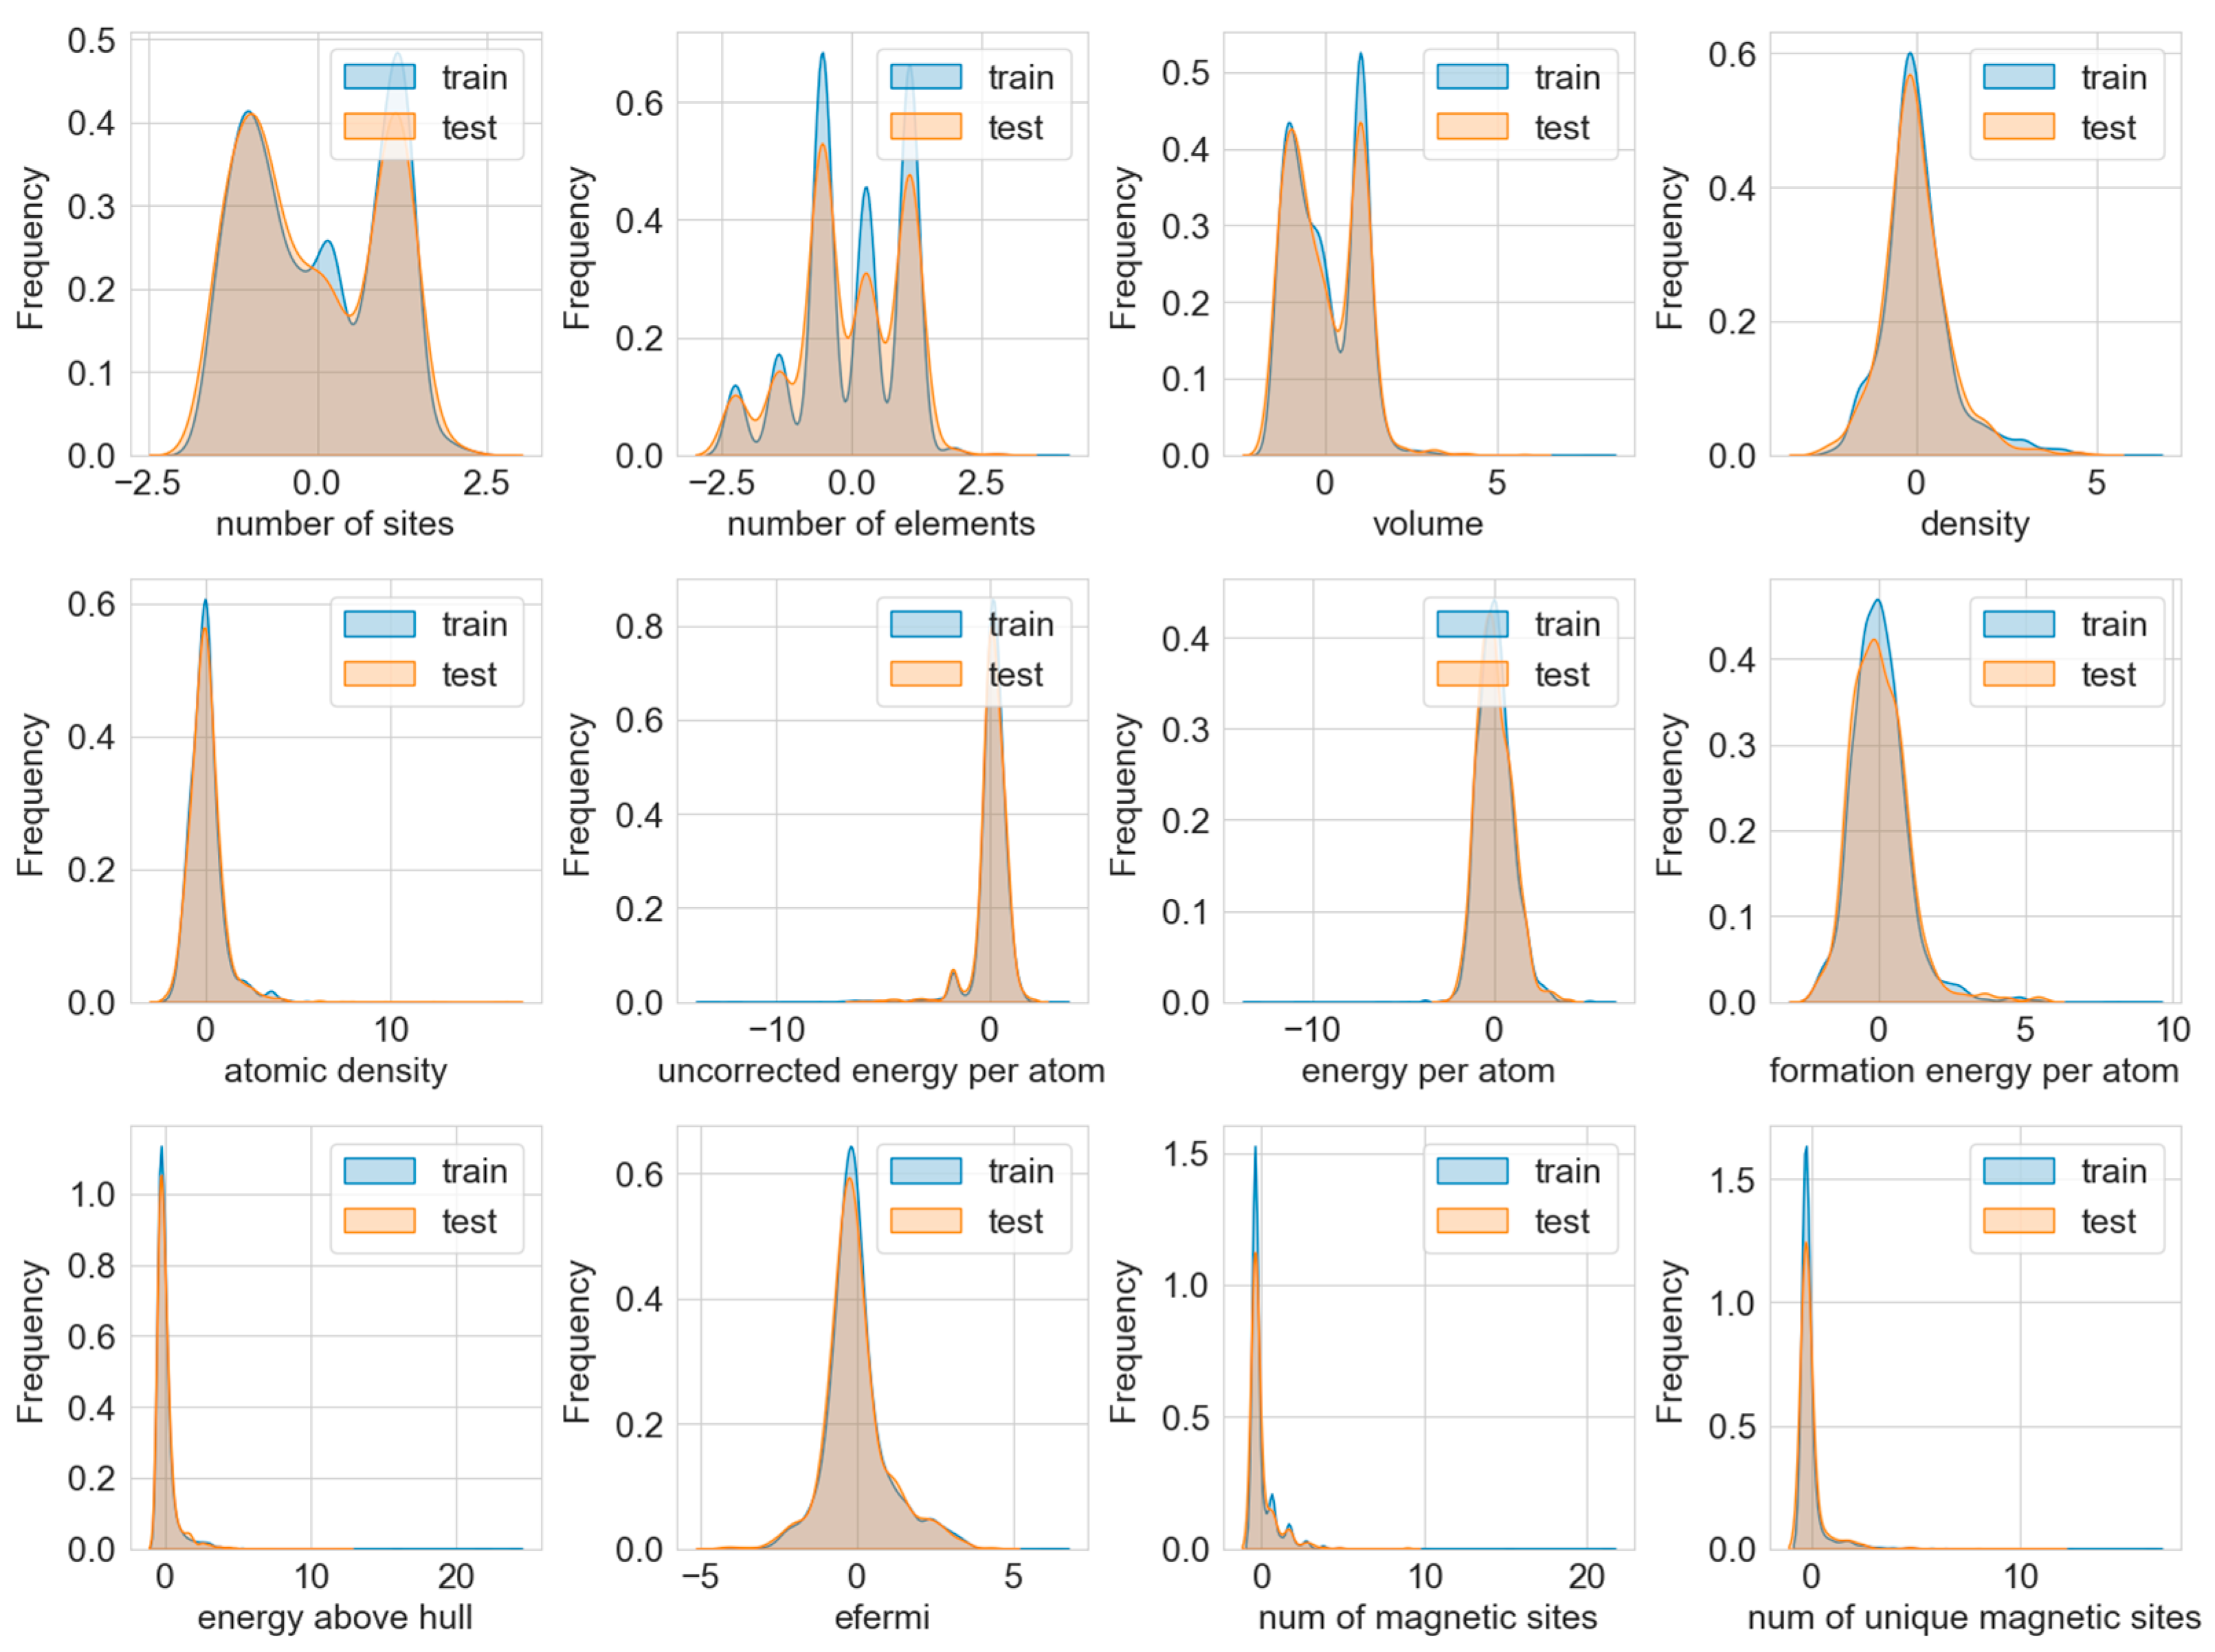
To ensure the objectivity and accuracy of model evaluation, we randomly divided the entire dataset into a training set and a test set at a ratio of 80% to 20%. The training set contains 4232 samples of silicon oxide materials, which were used for model training and optimization; the test set, comprising 1058 samples, was retained as the final test set for independently evaluating the model’s performance. Kernel density estimation plots were generated for both the training and test sets, as shown in Figure 3. The feature distributions of the training and test sets are roughly similar, indicating that the model’s training performance will not be affected by data distribution differences.
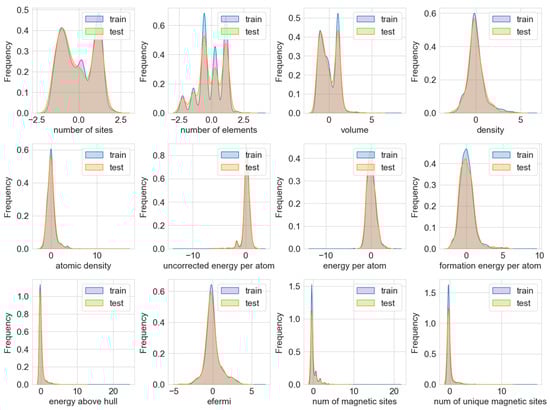
Figure 3.
Distribution of KDEs in training and test sets.
2.3. Hyperparameter Optimization: Exploring Optimal Model Parameters
Hyperparameter optimization [20] is a crucial step in machine learning model development. By tuning hyperparameters, one can find the combination that performs best on the training data, thereby improving the model’s predictive accuracy. Additionally, hyperparameter optimization enhances the model’s generalization ability. In this study, we performed Bayesian optimization on the model. Bayesian optimization is a hyperparameter optimization method based on Bayesian theory. It builds a surrogate model of the objective function and uses this model to select the next set of hyperparameters for evaluation, thereby efficiently finding the optimal hyperparameter combination that maximizes the objective function.
2.4. Cross-Validation: Model Performance Evaluation
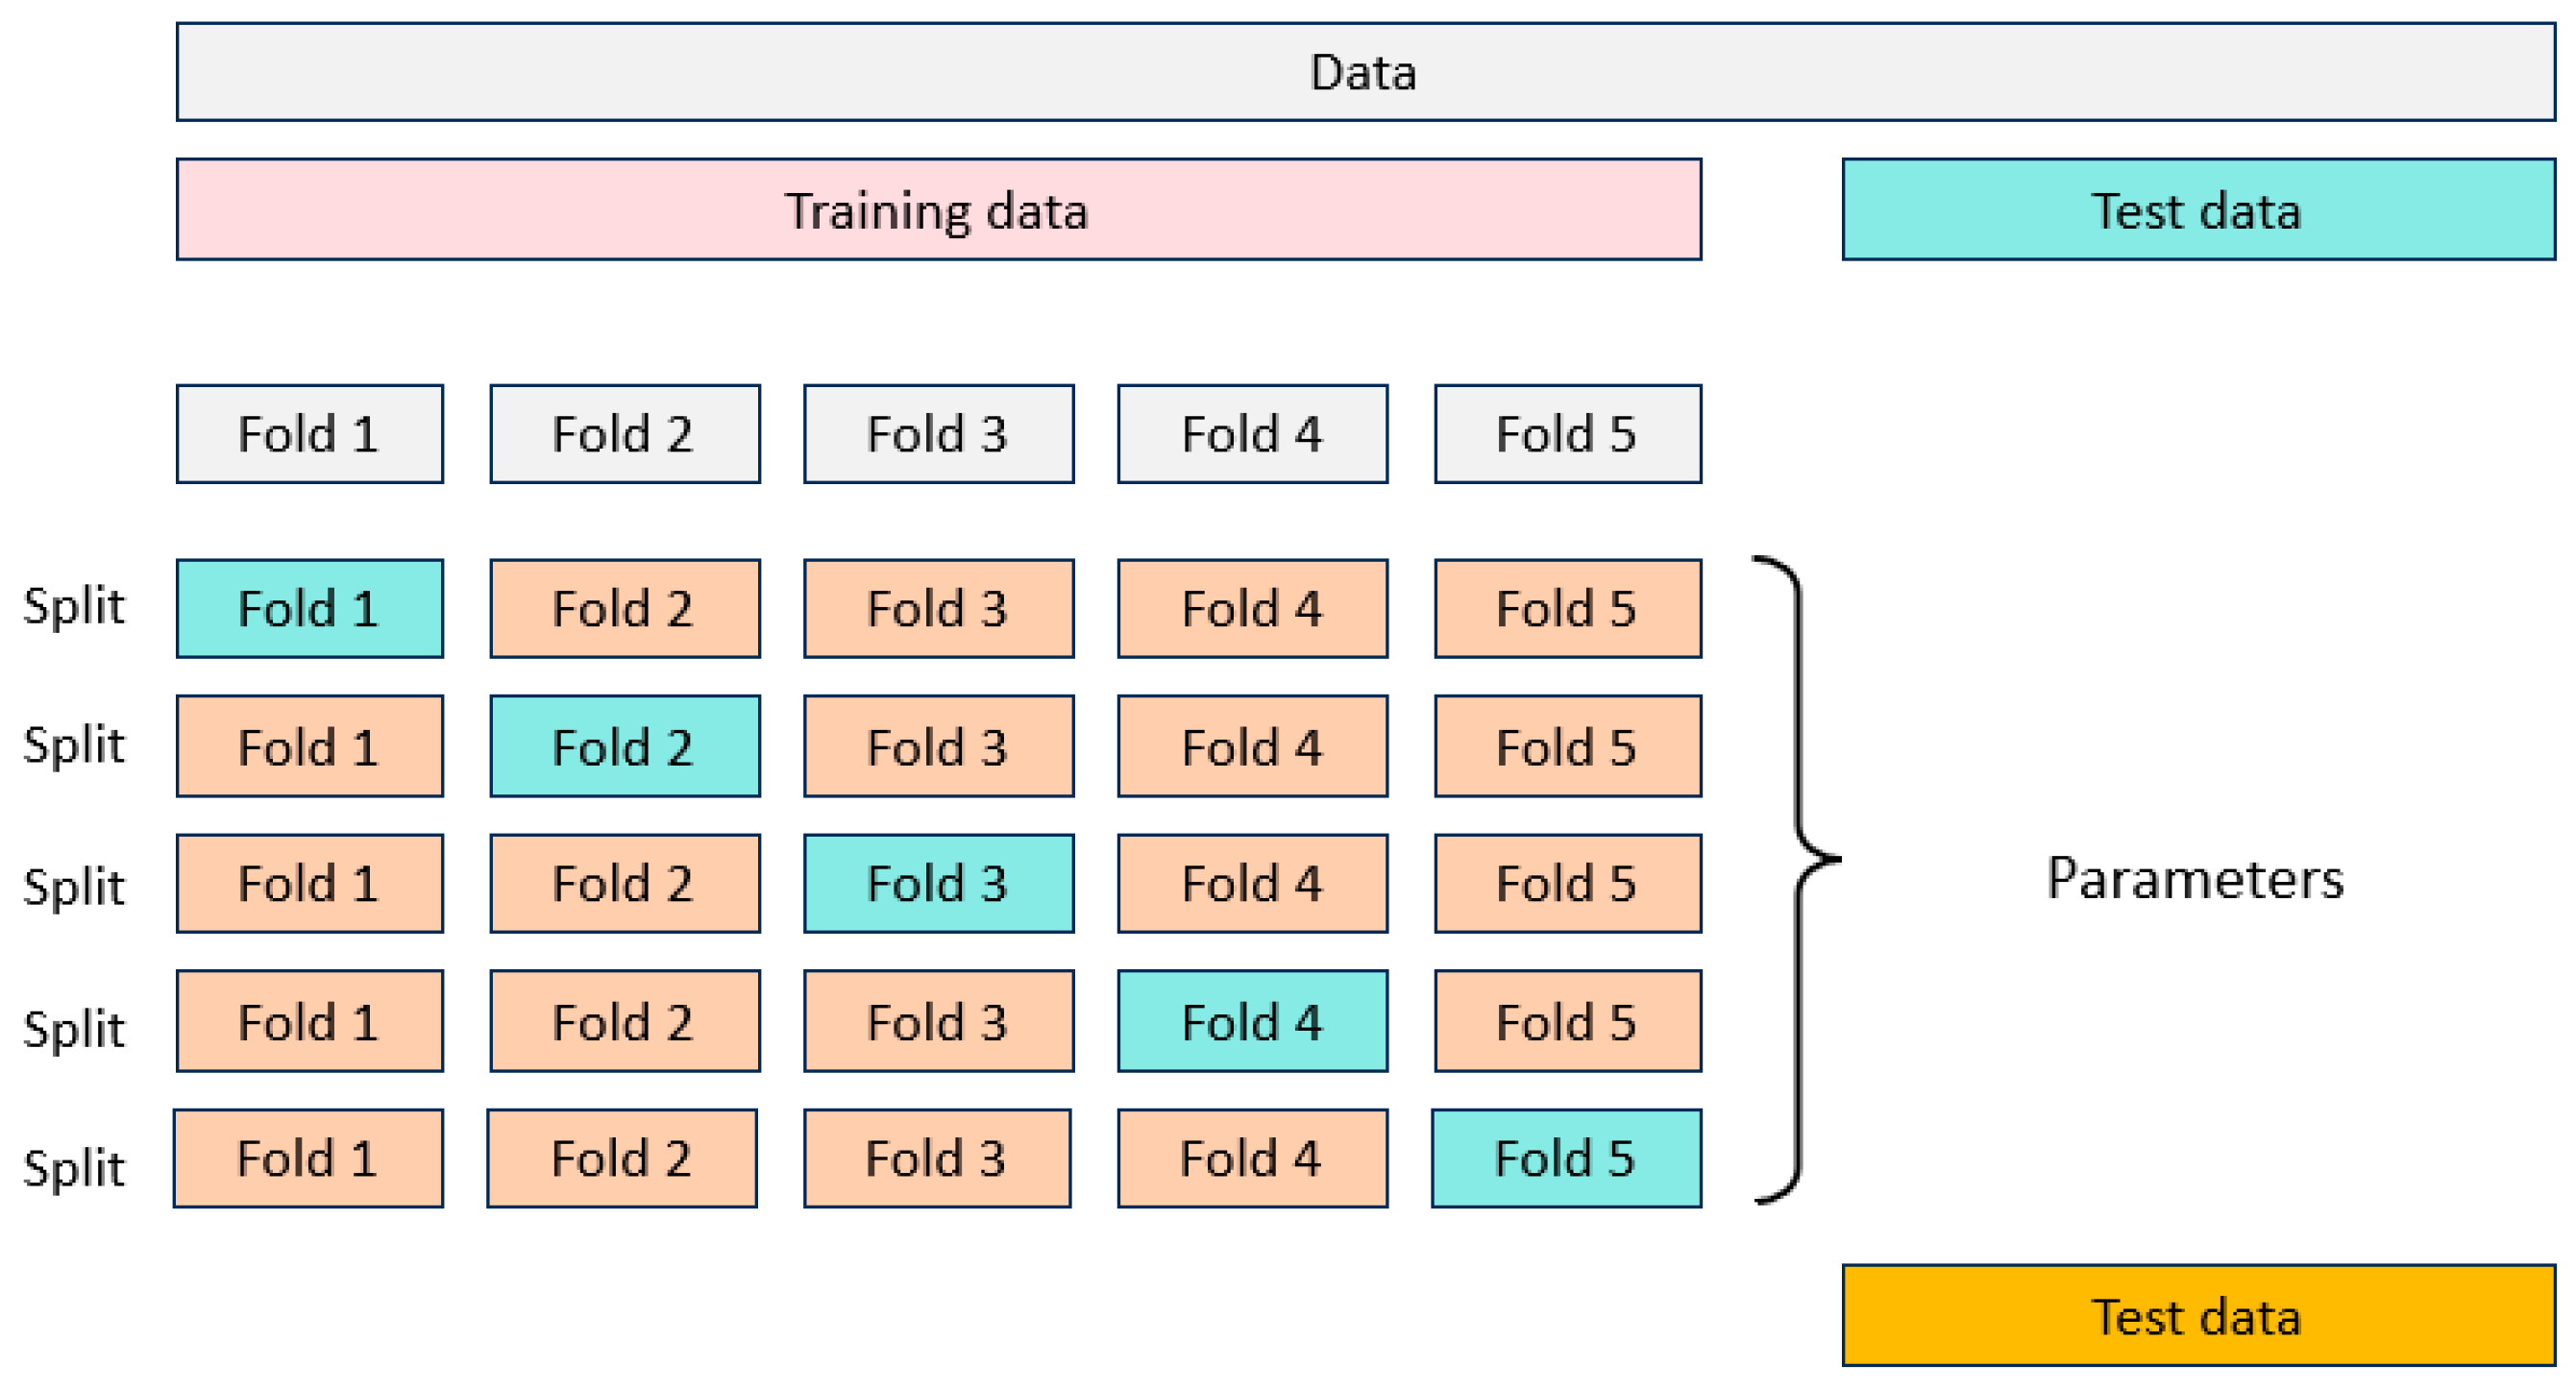
Cross-validation [21] is a statistical method used to assess generalization ability by repeatedly dividing the dataset and validating the model. The core idea is to systematically partition the dataset to evaluate the model’s generalization capability, with the primary goal of preventing overfitting and enhancing the predictive reliability on unseen data. During the hyperparameter optimization phase, five-fold cross-validation was used to adjust the hyperparameters of each model. Figure 4 illustrates the concept of five-fold cross-validation. The training set was evenly divided into five subsets, with one subset held out as a validation set each time while the remaining four were used for model training. Through this process, we evaluated and selected the best hyperparameter combinations. The average of the five validation results was used to reflect the overall performance of the model. It is particularly emphasized that the final reserved test set was not used during the entire hyperparameter optimization process, ensuring objectivity and independence in assessing model performance. By using five-fold cross-validation, we can obtain a robust estimate of model performance, effectively reducing the accidental effects caused by specific data-splitting methods, ensuring that the selected optimal parameters have broad applicability and reliability, and are insensitive to the foldings used in hyperparameter optimization.
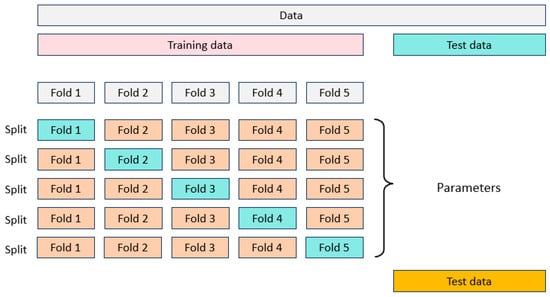
Figure 4.
Schematic diagram of five-fold cross-validation.
2.5. Model Evaluation Methodology
The performance of machine learning models is quantified and evaluated using the coefficient of determination (R2), Mean Absolute Error (MAE), and Mean Squared Error (MSE).
R2 is used to measure the model’s ability to explain variations in the data, with values typically ranging from 0 to 1. A higher value indicates a greater ability of the model to explain the variability in the data.
MAE is used to measure the average of the absolute differences between predicted values and actual values. The smaller the MAE, the closer the model’s predictions are to the true values, indicating better model performance.
MSE is used to measure the average of the squared differences between predicted values and actual values. The smaller the MSE, the closer the model’s predictions are to the true values, indicating better model performance.
where n is the number of samples, is the true value of the ith sample, is the predicted value of the ith sample, and is the average of all true values.
3. Results and Discussion
3.1. Hyperparameter Optimization and Cross-Validation Results of the Model
This study employs four boosting machine learning models and three traditional machine learning models to predict the bandgap of silicon oxide materials, including Adaptive Boosting (AdaBoost) [22], Gradient Boosting Regressor (GBR) [23], Extreme Gradient Boosting (XGB) [24], Light Gradient Boosting Machine (LightGBM) [25], decision tree [26], Support Vector Regression (SVR) [27], and random forest [28]. Bayesian optimization was performed on seven models, with some of the hyperparameter ranges for Bayesian hyperparameter optimization shown in Table 2. It was found that the performance of the four boosting models significantly improved after parameter optimization. Table 3 shows the optimal hyperparameters of the four boosting machine learning models after Bayesian tuning, based on which the trained models exhibit good performance. Hyperparameter tuning was also conducted for random forest, decision tree, and SVR, but the performance improvements were limited.
Table 2.
Hyperparameter ranges for Bayesian hyperparametric optimization.
Table 3.
Optimal hyperparameters for four boosting models.
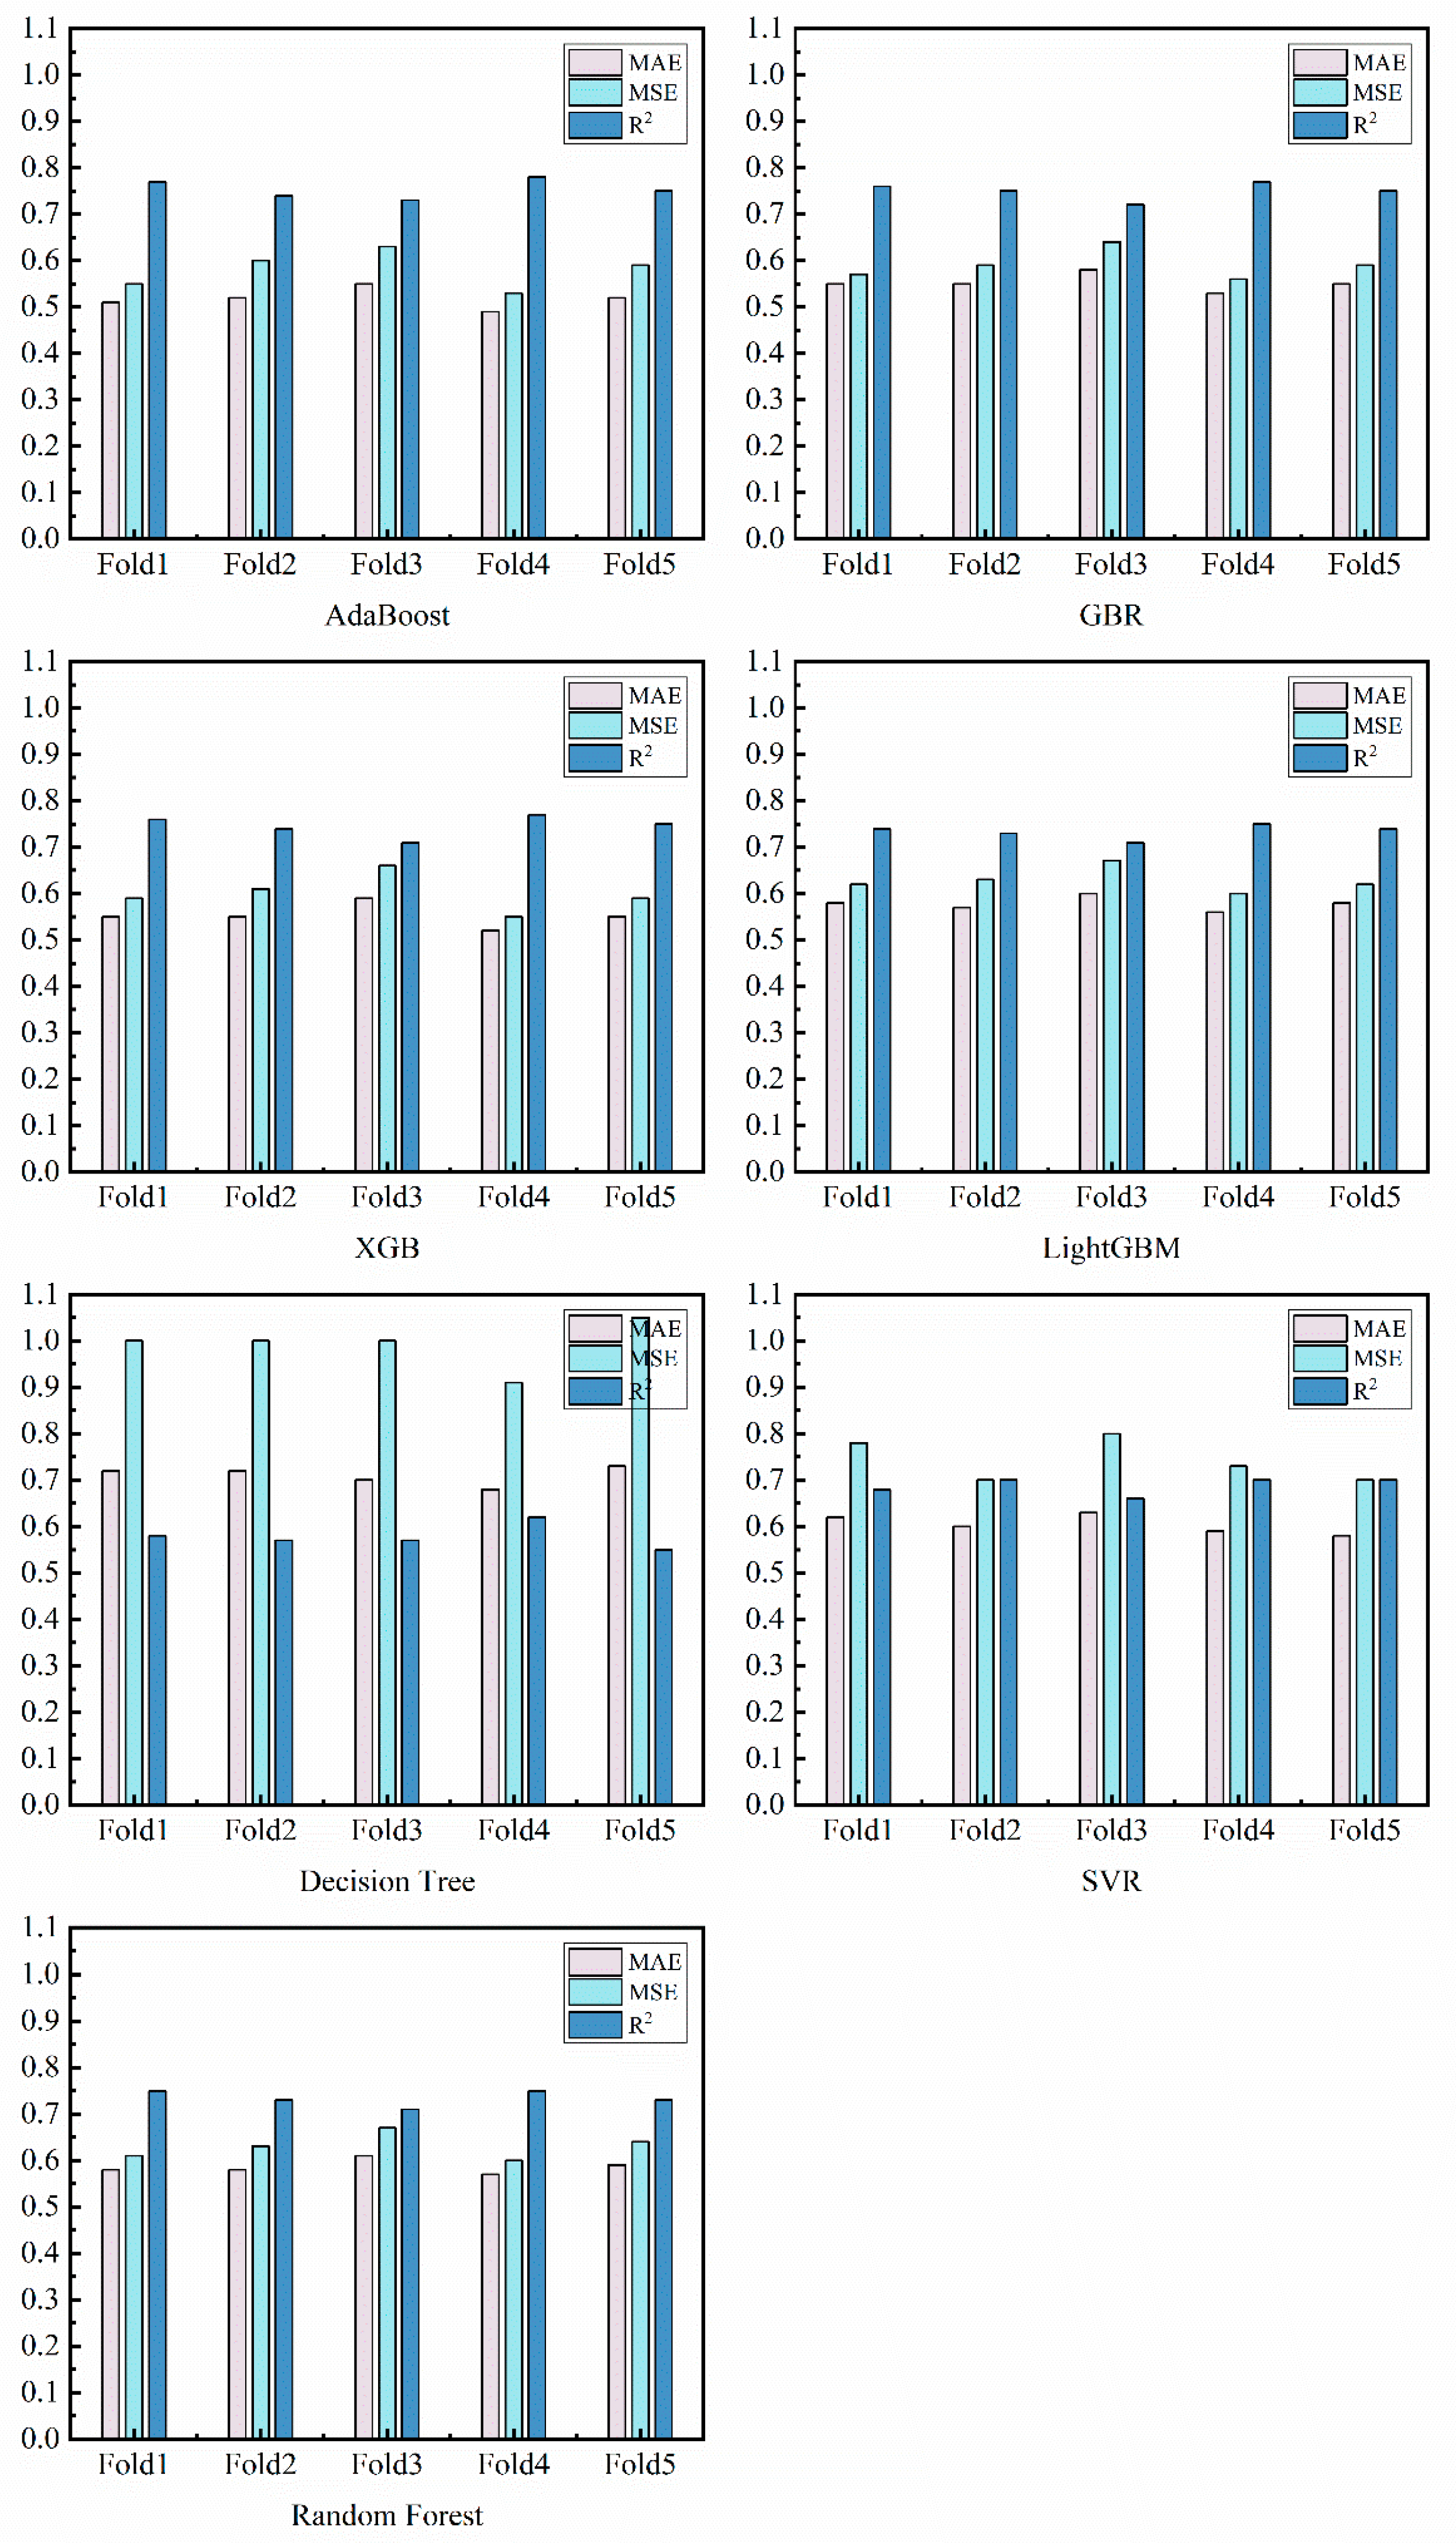
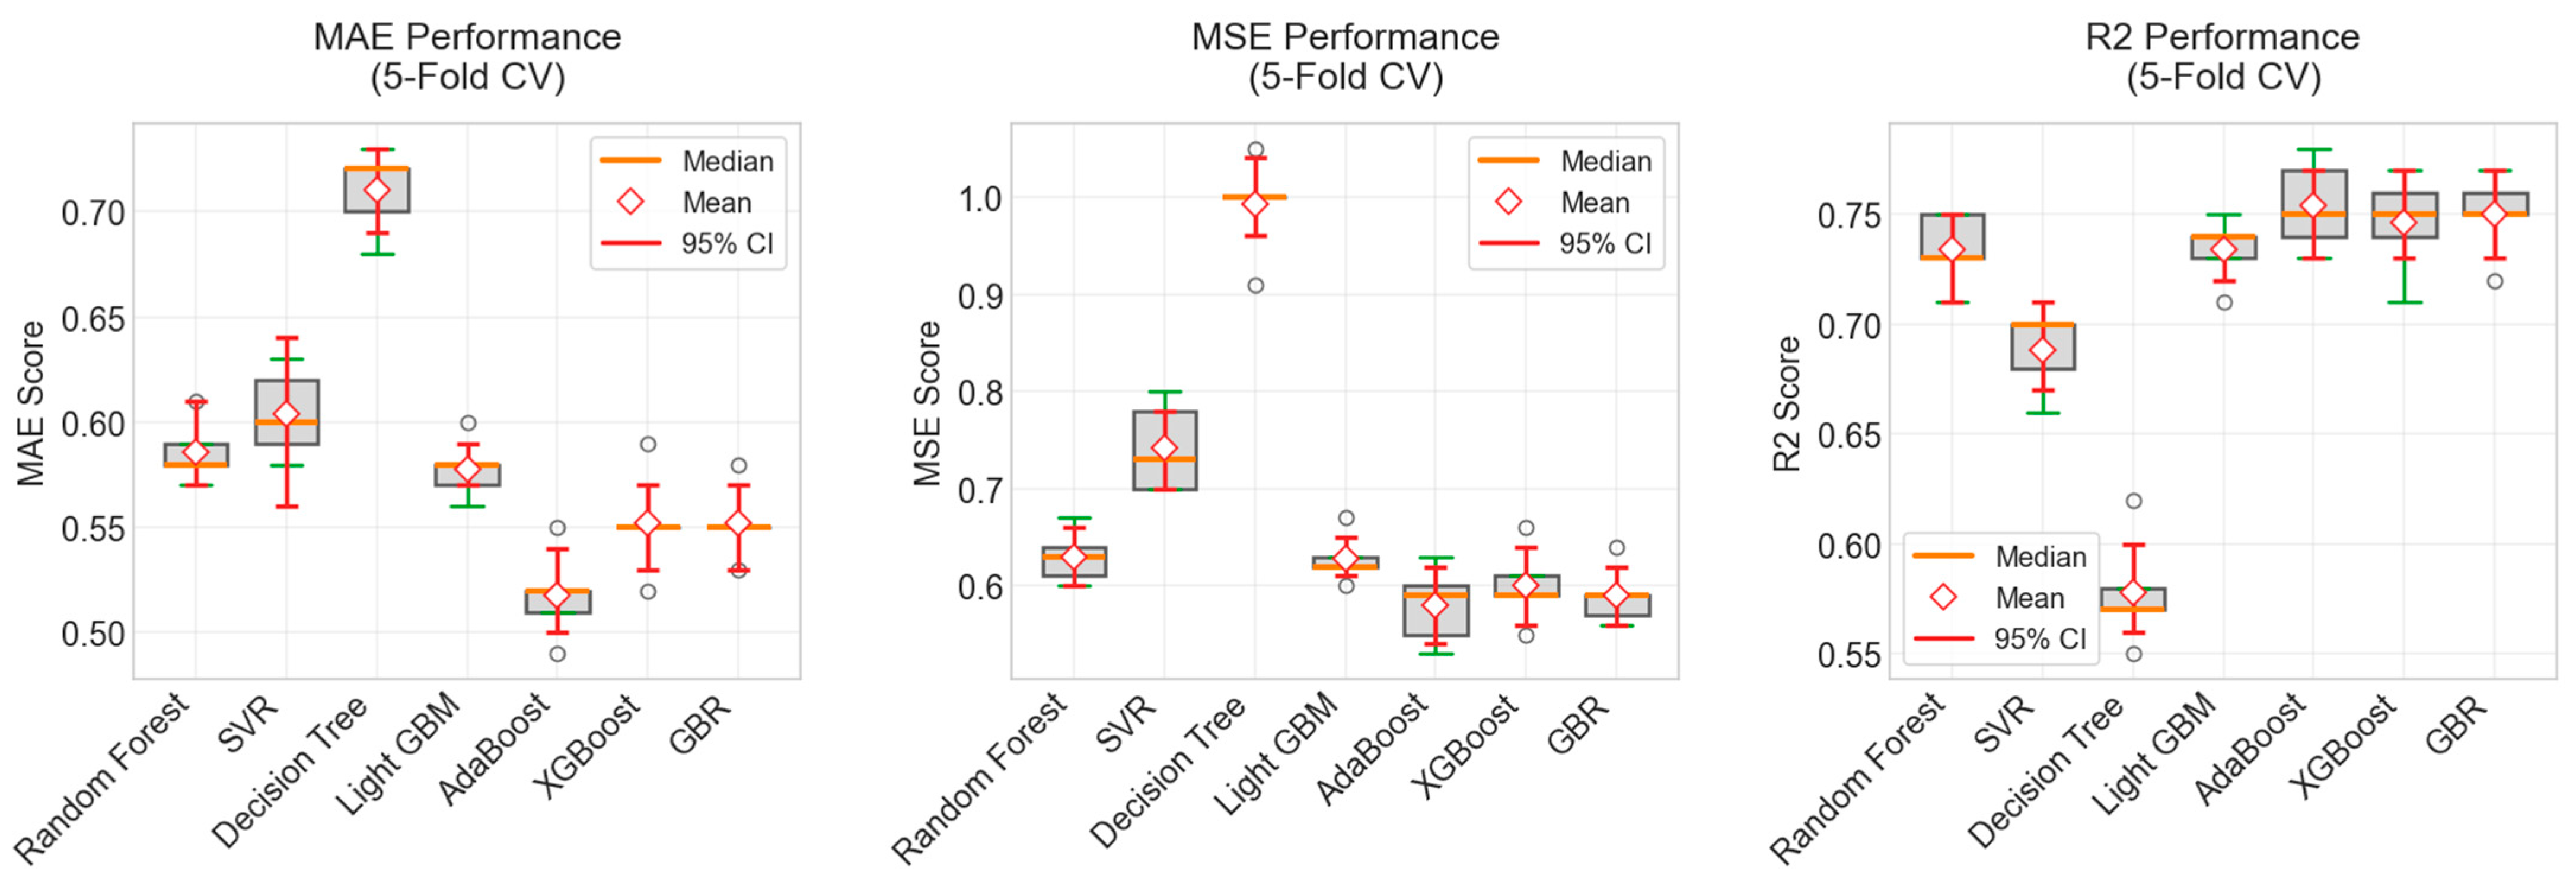
To effectively reduce the model training bias caused by random sampling of the training dataset, a five-fold cross-validation method was used to comprehensively evaluate the model’s performance. Figure 5 shows the cross-validation results of the trained machine learning models, including three error metrics: R2, MAE, and MSE. Figure 6 shows a box-and-line plot based on the cross-validation results of the machine learning model. Table 4 presents the average statistical results from the cross-validation. The cross-validation results indicate that the performance deviation in each fold is very limited, suggesting that the models are relatively stable.
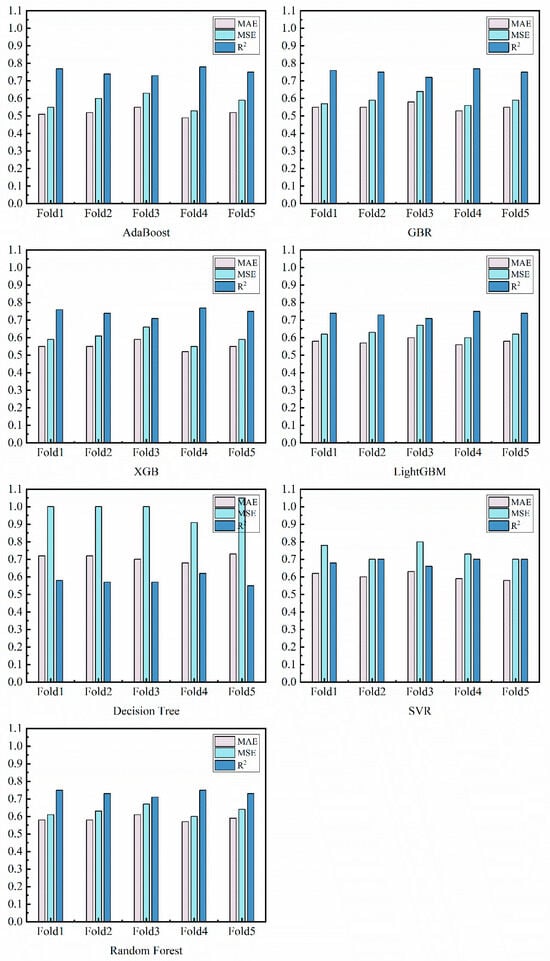
Figure 5.
Fifty-fold cross-validation plots for seven Bayesian-optimized machine learning models.
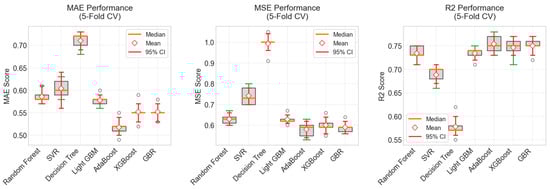
Figure 6.
Boxplot of five-fold cross-validation for machine learning approach (with R2, MAE, and MSE).
Table 4.
Mean statistics of four boosting machine learning methods for five-fold cross-validation.
3.2. Comparison of Model Performance
To evaluate the reliability of the models, their performance was tested using a test set. Figure 7 compares the performance of different models under their optimal hyperparameters. The results indicate that AdaBoost performed notably well, achieving the highest R2 (0.80) and the lowest MAE (0.5), with the smallest deviation between predicted and actual values, explaining 80% of the data variance. This finding suggests that during the practical material screening process, the AdaBoost model can rapidly predict the bandgap of numerous silicon oxide materials with high accuracy, assisting researchers in quickly identifying materials with potential application value, thereby significantly reducing the workload and costs associated with experimental verification. The decision tree model had the lowest R2 at only 0.62, indicating severe overfitting. AdaBoost, GBR, XGBoost, and LightGBM, which showed better prediction performance, are all ensemble models, demonstrating the effectiveness of ensemble learning in predicting the performance of complex materials. The strength of these models is not only reflected in their data processing capabilities but, more importantly, in their ability to quickly uncover associations between structural features and performance when dealing with complex material systems, providing guidance for the design of new materials.
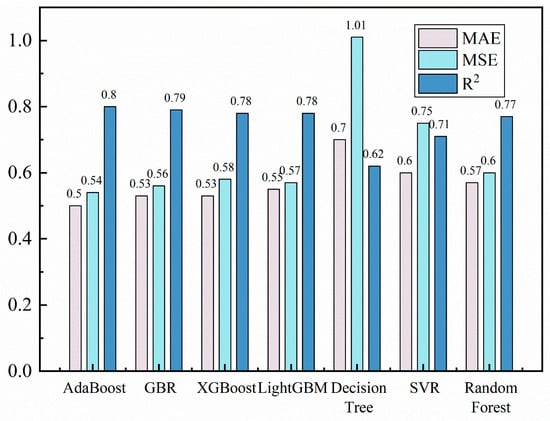
Figure 7.
Performance comparison of seven machine learning models in bandgap prediction (with R2, MAE, and MSE).
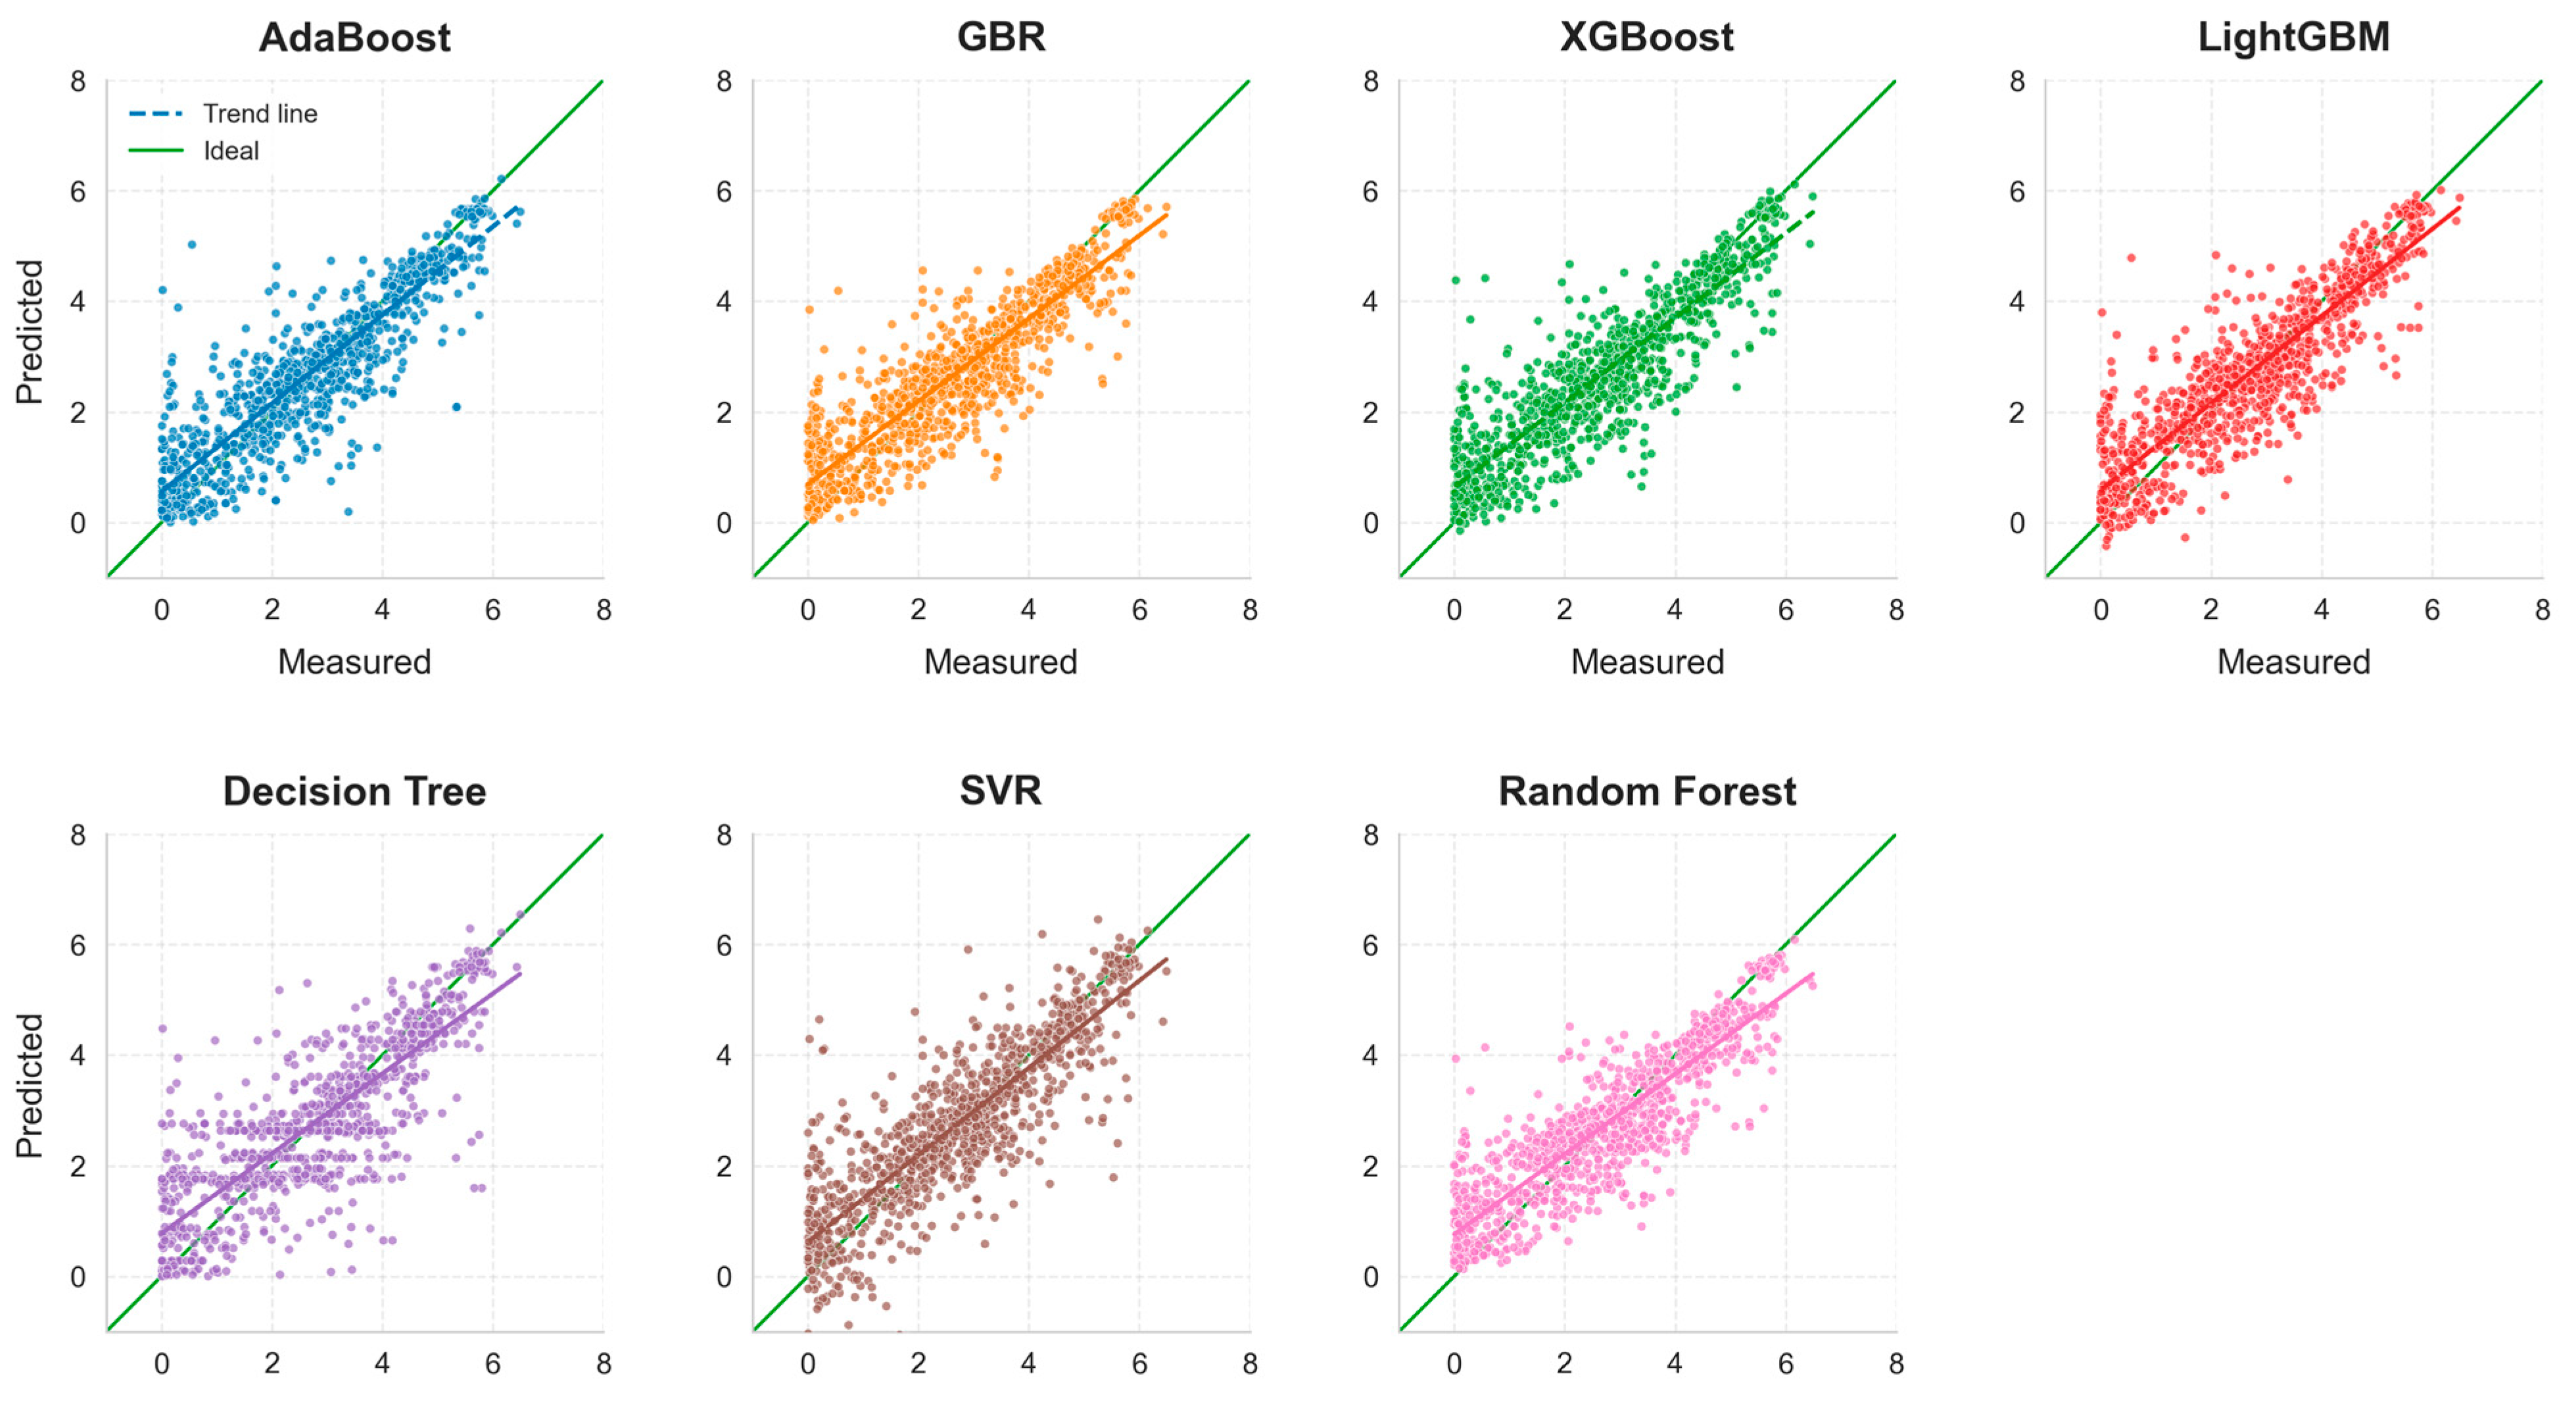
Figure 8 presents a comparison between the predicted values and the actual values for the seven machine learning models. As shown in the figure, ensemble learning models exhibit exceptional performance in predicting the bandgap of silicon oxide materials, significantly outperforming traditional methods in terms of prediction accuracy. However, as shown in Figure 8, all models exhibit significant errors, with data points on the corresponding curves being noticeably scattered. This is due to the bandgap of silicon oxide materials being influenced by a variety of factors, including microstructure, chemical composition, defect states, etc., which interact in complex ways, making bandgap prediction highly complex and uncertain. In this study, although algorithms and parameters were optimized and multiple models were compared and validated, there remains some error in the predictions. Possible reasons are as follows: first, the complexity and diversity of the data, covering various types of silicon oxide materials with significantly different physical and chemical properties, increasing the difficulty of model fitting and leading to scattered predictions; second, limitations in feature selection—although features highly correlated with the bandgap were selected, important features may still be overlooked due to limitations in the richness of the dataset, affecting prediction accuracy; third, models are based on certain assumptions and approximations that may deviate from reality. Nevertheless, these models still have certain applicability and value, as they can effectively capture trends in bandgap changes, show correlation with actual values, and provide references for bandgap variations. Moreover, the impact of features on the bandgap revealed through SHAP analysis aligns with physical explanations, providing new perspectives for understanding the bandgap characteristics of silicon oxide materials, aiding in identifying key influencing factors, and guiding material design and optimization.
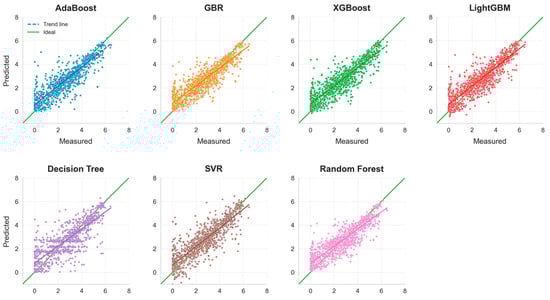
Figure 8.
Comparison of predicted and true values of seven machine learning methods on training and test sets. The green line in the subplot is the ideal reference line, which indicates that the predicted value is exactly the same as the actual value and is used as a benchmark comparison; the line in the subplot with the same color as the scatter point is the regression trend line, which indicates the overall trend between the predicted value and the actual value.
This study included decision tree and SVR as relatively weaker baseline models. Comparing them with these simple models highlights the significant advantages of ensemble learning models in the task of predicting the bandgap of silicon oxide materials. The research results show that the decision tree model achieved an R2 value of only 0.62, whereas the AdaBoost model reached an R2 value of up to 0.80. This stark contrast clearly demonstrates that simple models, due to their structural and algorithmic limitations, struggle to accurately capture the complex nonlinear relationships inherent in silicon oxide materials, thus failing to meet the requirements for precise bandgap prediction. The selection of models is therefore justified.
4. Resolution of Bandgap Regulators in Silicon Oxides Based on SHAP Analysis
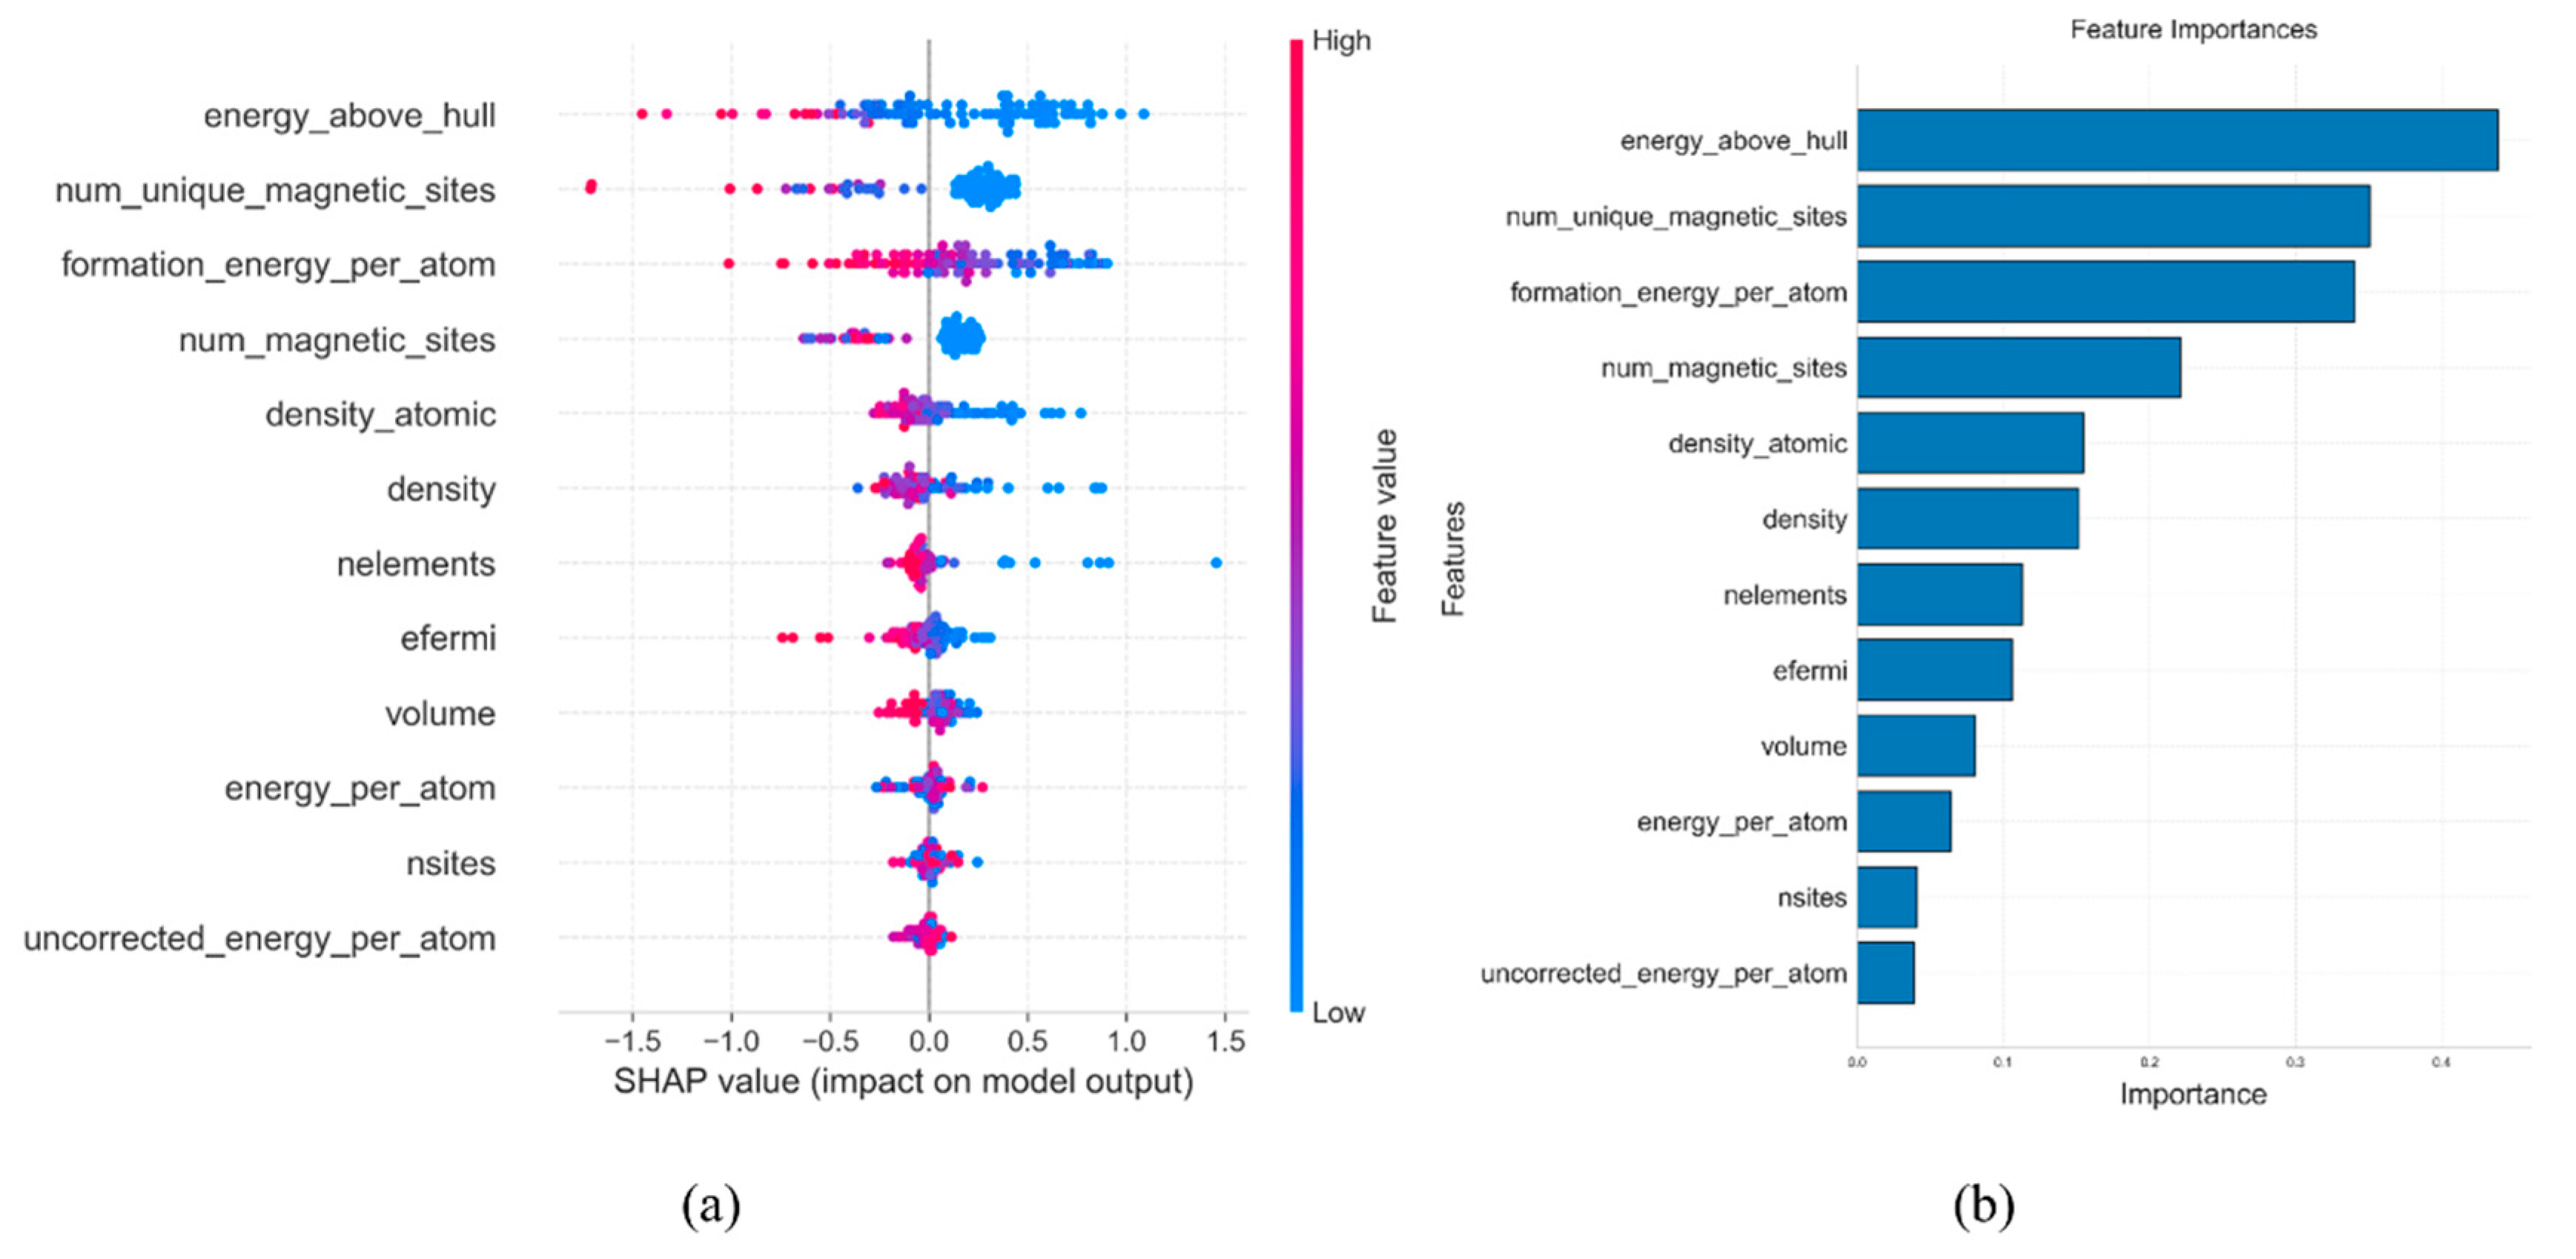
In machine learning models, SHAP values are used to explain the contribution of each feature to the prediction outcome. Figure 9a illustrates the contribution of various features to the model’s prediction results during the training of the AdaBoost model. The horizontal axis represents SHAP values, indicating the contribution of each feature to the prediction outcome. Positive values indicate a positive contribution when the feature value is high, while negative values indicate a negative contribution when the feature value is low. As shown in the figure, ‘energy above hull’ is the feature most closely related to the material bandgap. From the overall SHAP feature plot, it can be seen that there is a negative correlation between ‘energy above hull’ and the material bandgap; the smaller its value, the larger the material’s bandgap may be. Figure 9b is a feature importance plot used to assess the overall influence of features within the model. It can be seen from the plot that ‘energy above hull’ has the strongest overall influence in the model, with a feature importance value as high as 0.45.

Figure 9.
SHAP analysis plot (a) and feature importance plot (b) of AdaBoost model.
The ‘energy above hull’ is a feature that describes the thermodynamic stability of a material, representing the difference between the material’s energy and that of its most stable phase. The lower the value, the higher the thermodynamic stability of the material, indicating it is closer to its most stable phase. When silicon oxide materials have a low ‘energy above hull’ value, they exhibit higher thermodynamic stability, more regular crystal structures, and fewer defects. In a regular crystal structure, the distribution of electronic energy levels is clearer, with a distinct energy difference between the valence band and the conduction band, which facilitates the formation of a well-defined band structure, potentially leading to a larger bandgap. Conversely, by introducing defects into the material, band dispersion can occur, resulting in materials with smaller bandgaps.
The features ‘num of unique magnetic sites’ and ‘formation energy per atom’ also show strong correlations with the bandgap of silicon oxide materials, with feature importance values of 0.39 and 0.32, respectively. The ‘num of unique magnetic sites’ indicates the number of atoms or lattice sites with unique magnetic properties, commonly found in magnetically doped structures or those containing defects. Pure SiO2 lacks magnetic sites, and its bandgap is primarily determined by the strong ionic–covalent nature of the Si-O bond, making magnetic influences negligible. However, when magnetic elements are doped into silicon oxides or defects are present, magnetic sites can be introduced. These magnetic sites disrupt the original electronic-state distribution within the material, introducing impurity levels near the bandgap, which alter both the width and shape of the bandgap. The introduction of magnetic sites is often accompanied by an increase in material defects, which can become attack points for aggressive substances, accelerating material erosion. The ‘formation energy per atom’ represents the energy possessed by each atom during material formation, reflecting the energy changes during the material formation process. A low ‘formation energy per atom’ indicates that energy is reduced during material formation, leading to more stable atomic arrangements and facilitating the formation of stable chemical bonds, thus affecting the bandgap. It also impacts the electronic structure of the material, thereby directly influencing the bandgap. A low ‘formation energy per atom’ corresponds to optimal atomic arrangements and chemical bonds, resulting in a more rational distribution of electronic energy levels and an increased bandgap width; conversely, a high ‘formation energy per atom’ may lead to disordered atomic arrangements and altered electronic energy-level distributions, reducing the bandgap.
The features ’density’, ‘number of elements’, and ‘efermi’ show relatively low correlation with the bandgap of silicon oxide materials, with feature importance values all below 0.2, making their contributions during model training limited. Their feature importance is less than half that of the ‘energy above hull’ feature, thus having a smaller impact on the overall model performance. Density primarily reflects the compactness of the material, which can influence physical properties to some extent; however, its direct or indirect effect on the bandgap is relatively minor. The ‘number of elements’ indicates the number of different elements in the material. Although the types of elements can affect material properties, this feature shows weak correlation with the bandgap within the silicon oxide system. The ‘efermi’ represents the Fermi level of the material, which typically has a significant impact on electrical properties in semiconductors or metals. However, in insulators or wide-bandgap materials like silicon oxides, its direct connection to the bandgap is weaker.
Through SHAP analysis, we can gain a deep understanding of the features and logic behind model predictions, explaining the hidden relationships between features. Moreover, a thorough interpretation of the model can also uncover other features related to the bandgap and their interactions, providing additional insights and directions for experimental research. This helps researchers more comprehensively understand the determinants of material performance, leading to more efficient material development and promoting the advancement of green metallurgical processes.
5. Conclusions
This study constructs an interpretable machine learning framework, achieving a high-precision prediction and physical mechanism analysis of silicon oxide material properties without relying on the conduction-band minimum (CBM) or valence-band maximum (VBM) features. The main conclusions are as follows:
- The ensemble learning model achieves high-precision predictions even after excluding the dependence on CBM/VBM features, and it improves performance by more than 25% compared to traditional methods. Additionally, through ensemble strategies, it significantly reduces noise interference on prediction stability while retaining 80% of the data variance explanation rate. This feature decoupling modeling approach breaks the traditional band theory’s reliance on directly correlated features.
- Among the seven machine learning models compared, the AdaBoost model demonstrated remarkable accuracy in predicting the bandgap of silicon oxide materials, achieving the highest R2 value (0.80) and the lowest MAE (0.5).
- Through SHAP explainability analysis, a physical linkage between material features and prediction outcomes was successfully established, revealing that the model’s decision-making mechanism aligns with the principles of condensed matter physics. Among these features, ‘energy above hull’, as a thermodynamic stability indicator, has a feature importance value as high as 0.45, making it a core regulatory factor in the predictive model. SHAP analysis also uncovered relationships between key features such as ‘energy above hull’, ‘num of unique magnetic sites’, and ‘formation energy per atom’, and the bandgap. Optimizing these features can significantly enhance the thermal stability and erosion resistance of refractory materials, thereby reducing heat and electrical energy waste during electric furnace smelting processes and lowering CO2 emissions.
Optimizing the bandgap of silicon oxide materials can extend their service life in high-temperature environments, reduce the frequency of material replacements, and lower maintenance costs. Additionally, bandgap optimization supports energy efficiency improvements and energy savings in electric furnace smelting processes, providing critical theoretical support and technical guidance for green metallurgical processes. This study not only offers new methodologies for optimizing the performance of silicon oxide materials but also provides scientific bases for material selection and process improvements in metallurgy, promoting sustainable development in the steel industry.
In the future, with the accumulation of more high-quality data and continuous advancements in machine learning technology, this approach is expected to play a greater role in broader material systems and performance predictions, providing stronger support for optimizing green metallurgical processes and helping to address key scientific and technological challenges in the metallurgical industry.
Author Contributions
X.Z. (Xin Zhao): writing—review and editing, writing—original draft, validation, methodology, funding acquisition and investigation; Y.W.: writing—review and editing, methodology, and investigation; J.Y.: methodology, investigation, and formal analysis; X.Z. (Xuan Zhao): validation, supervision, and project administration; Y.H.: writing—review and editing, methodology. All authors have read and agreed to the published version of the manuscript.
Funding
This research was supported by Xingtai municipal science and technology plan self-funded project (No. 2024ZC025) and Scientific Research Program of Higher Education Institutions in Hebei Province (No. QN2025198).
Data Availability Statement
The data used for the study were obtained from https://legacy.materialsproject.org/ (accessed on 26 February 2025).
Conflicts of Interest
The authors declare no conflicts of interest.
References
- Zharmenov, A.; Yefremova, S.; Satbaev, B.; Shalabaev, N.; Satbaev, S.; Yermishin, S.; Kablanbekov, A. Production of refractory materials using a renewable source of silicon dioxide. Minerals 2022, 12, 1010. [Google Scholar] [CrossRef]
- Sadik, C.; El Amrani, I.E.; Albizane, A. Recent advances in silica-alumina refractory: A review. J. Asian Ceram. Soc. 2014, 2, 83–96. [Google Scholar] [CrossRef]
- Liu, B.; Sun, J.; Guo, L.; Shi, H.; Feng, G.; Feldmann, L.; Yin, X.; Riedel, R.; Fu, Q.; Li, H. Materials design of silicon based ceramic coatings for high temperature oxidation protection. Mater. Sci. Eng. R Rep. 2025, 163, 100936. [Google Scholar] [CrossRef]
- Matsumoto, Y.; Melendez, F.; Asomoza, R. Plasma CVD deposited p-type silicon oxide wide-bandgap material for solar cells. Sol. Energy Mater. Sol. Cells 1998, 52, 251–260. [Google Scholar] [CrossRef]
- Tao, J.; Yan, Z.; Yang, J.; Li, J.; Lin, Y.; Huang, Z. Boosting the cell performance of the SiOx@ C anode material via rational design of a Si-valence gradient. Carbon Energy 2022, 4, 129–141. [Google Scholar] [CrossRef]
- Dinic, F.; Neporozhnii, I.; Voznyy, O. Machine learning models for the discovery of direct band gap materials for light emission and photovoltaics. Comput. Mater. Sci. 2024, 231, 112580. [Google Scholar] [CrossRef]
- Morelock, R.J.; Bare, Z.J.L.; Musgrave, C.B. Bond-valence parameterization for the accurate description of DFT energetics. J. Chem. Theory Comput. 2022, 18, 3257–3267. [Google Scholar] [CrossRef]
- Lee, J.; Seko, A.; Shitara, K.; Nakayama, K.; Tanaka, I. Prediction model of band gap for inorganic compounds by combination of density functional theory calculations and machine learning techniques. Phys. Rev. B 2016, 93, 115104. [Google Scholar] [CrossRef]
- Mattur, M.N.; Nagappan, N.; Rath, S.; Thomas, T. Prediction of nature of band gap of perovskite oxides (ABO3) using a machine learning approach. J. Mater. 2022, 8, 937–948. [Google Scholar]
- Lin, C.M.; Khatri, A.; Yan, D.; Chen, C.C. Machine Learning and First-Principle Predictions of Materials with Low Lattice Thermal Conductivity. Materials 2024, 17, 5372. [Google Scholar] [CrossRef]
- Zhuo, Y.; Tehrani, A.M.; Brgoch, J. Predicting the band gaps of inorganic solids by machine learning. J. Phys. Chem. Lett. 2018, 9, 1668–1673. [Google Scholar] [CrossRef]
- Li, J.; Song, Q.; Liu, Z.; Wang, D. Machine Learning for Predicting Band Gap in Boron-containing Materials. Acta Chim. Sin. 2024, 82, 387. [Google Scholar] [CrossRef]
- Gok, E.C.; Yildirim, M.O.; Haris, M.P.U.; Eren, E.; Pegu, M.; Hemasiri, N.H.; Huang, P.; Kazim, S.; Oksuz, A.U.; Ahmad, S. Predicting perovskite bandgap and solar cell performance with machine learning. Sol. RRL 2022, 6, 2100927. [Google Scholar] [CrossRef]
- Olsthoorn, B.; Geilhufe, R.M.; Borysov, S.S.; Balatsky, A.V. Band gap prediction for large organic crystal structures with machine learning. Adv. Quantum Technol. 2019, 2, 1900023. [Google Scholar] [CrossRef]
- Lundberg, S.; Lee, S. A unified approach to interpreting model predictions. Adv. Neural Inf. Process. Syst. 2017, 30. [Google Scholar] [CrossRef]
- Jain, A.; Ong, S.P.; Hautier, G.; Chen, W.; Richards, W.D.; Dacek, S.; Cholia, S.; Gunter, D.; Skinner, D.; Ceder, G.; et al. Commentary: The Materials Project: A materials genome approach to accelerating materials innovation. APL Mater. 2013, 1, 011002. [Google Scholar] [CrossRef]
- Jain, A.; Montoya, J.; Dwaraknath, S.; Zimmermannk, N.E.R.; Dagdelen, J.; Horton, M.; Huck, P.; Winston, D.; Cholia, S.; Ong, S.P.; et al. The materials project: Accelerating materials design through theory-driven data and tools. Handb. Mater. Model. Methods Theory Model. 2020, 2020, 1751–1784. [Google Scholar]
- Nargesian, F.; Samulowitz, H.; Khurana, U.; Khalil, E.B.; Turaga, D. Learning Feature Engineering for Classification. Proc. Ijcai 2017, 17, 2529–2535. [Google Scholar]
- Zhi, C.; Wang, S.; Sun, S.; Li, C.; Li, Z.; Wan, Z.; Wang, H.; Li, Z.; Liu, Z. Machine-learning-assisted screening of interface passivation materials for perovskite solar cells. ACS Energy Lett. 2023, 8, 1424–1433. [Google Scholar] [CrossRef]
- Yu, T.; Zhu, H. Hyper-parameter optimization: A review of algorithms and applications. arXiv 2020, arXiv:2003.05689. [Google Scholar]
- Browne, M.W. Cross-validation methods. J. Math. Psychol. 2000, 44, 108–132. [Google Scholar] [CrossRef] [PubMed]
- Freund, Y.; Schapire, R.E. A decision-theoretic generalization of on-line learning and an application to boosting. J. Comput. Syst. Sci. 1997, 55, 119–139. [Google Scholar] [CrossRef]
- Friedman, J.H. Greedy function approximation: A gradient boosting machine. Ann. Stat. 2001, 2001, 1189–1232. [Google Scholar] [CrossRef]
- Chen, T.; Guestrin, C. Xgboost: A scalable tree boosting system. In Proceedings of the 22nd ACM Sigkdd International Conference on Knowledge Discovery and Data Mining, San Francisco, CA, USA, 13–17 August 2016. [Google Scholar]
- Ke, G.; Meng, Q.; Finley, T.; Wang, T.; Chen, W.; Ma, W.; Ye, Q.; Liu, T. Lightgbm: A highly efficient gradient boosting decision tree. Adv. Neural Inf. Process. Syst. 2017, 30, 3146–3154. [Google Scholar]
- Quinlan, J.R. Induction of decision trees. Mach. Learn. 1986, 1, 81–106. [Google Scholar] [CrossRef]
- Smola, A.J.; Schölkopf, B. A tutorial on support vector regression. Stat. Comput. 2004, 14, 199–222. [Google Scholar] [CrossRef]
- Breiman, L. Random forests. Mach. Learn. 2001, 45, 5–32. [Google Scholar] [CrossRef]


Disclaimer/Publisher’s Note: The statements, opinions and data contained in all publications are solely those of the individual author(s) and contributor(s) and not of MDPI and/or the editor(s). MDPI and/or the editor(s) disclaim responsibility for any injury to people or property resulting from any ideas, methods, instructions or products referred to in the content. |
© 2025 by the authors. Licensee MDPI, Basel, Switzerland. This article is an open access article distributed under the terms and conditions of the Creative Commons Attribution (CC BY) license (https://creativecommons.org/licenses/by/4.0/).