Abstract
In the context of intelligent manufacturing, equipment fault early-warning technology has become a critical support for ensuring the continuity and safety of industrial production. However, with the increasing complexity of modern industrial equipment structures and the growing coupling of operational states, traditional fault warning models face significant challenges in feature recognition accuracy and adaptability. To address these issues, this study proposes a hybrid fault early-warning framework that integrates an improved bees algorithm (IBA) with a categorical boosting (CatBoost) model and kernel density estimation (KDE). The proposed framework first develops the IBA by integrating Latin Hypercube Sampling, a multi-perturbation neighborhood search strategy, and a dynamic scout bee adjustment strategy, which effectively overcomes the conventional bees algorithm (BA)’s tendency to fall into local optima. The IBA is then employed to achieve global optimization of CatBoost’s key hyperparameters. The optimized CatBoost model is subsequently used to predict equipment operational data. Finally, the KDE method is applied to the prediction residuals to determine fault thresholds. An empirical study on a deflection fault in the valve position sensor connecting rod of the mineral oil system in a gas compressor station shows that the proposed method can issue early-warning signals two hours in advance and outperforms existing advanced algorithms in key indicators such as root mean square error (RMSE), coefficient of determination (R2) and mean absolute percentage error (MAPE). Furthermore, ablation experiments verify the effectiveness of the strategies in IBA and their contribution to CatBoost hyperparameter optimization. The proposed method significantly improves the accuracy and reliability of fault prediction in complex industrial environments.
1. Introduction
In the current era, smart manufacturing has become a key driver of modern industrial development [1,2,3,4,5]. In this context, equipment reliability and operational continuity are critical determinants of production efficiency, product quality, and economic performance. Unplanned downtime not only reduces overall productivity and increases maintenance costs but also poses significant safety risks, potentially leading to severe economic and social consequences. Thus, developing efficient and reliable fault early-warning technologies has emerged as a crucial research priority for ensuring stable industrial operations.
Traditional fault early-warning methods primarily rely on statistical analysis and physics-based models. Although these approaches are intuitive and structurally transparent, they face notable limitations when handling the complex, high-dimensional data prevalent in modern industries [6,7]. Specifically, conventional techniques often fail to extract deep-level features or detect latent trends from multivariate, noisy industrial datasets, resulting in inaccurate fault identification and delayed warnings. Consequently, the effectiveness and real-world applicability of such models are significantly diminished.
In recent years, the rapid advancement of computational power and the rise of industrial big data have positioned next-generation machine-learning algorithms, especially ensemble learning, as a leading solution for industrial fault early warning [7,8]. Among these, gradient boosting-based algorithms have demonstrated superior prediction accuracy, robustness, and efficiency in practical applications, owing to their automatic feature interaction capabilities and resistance to overfitting [7,8,9,10]. These methods excel at capturing complex patterns and latent relationships within industrial data through data-driven learning, significantly reducing false alarms and missed detections compared to traditional threshold-based approaches.
Within the ensemble learning landscape, the CatBoost algorithm stands out with its ordered gradient boosting scheme and symmetric tree mechanism, offering substantial advantages for modeling of complex industrial data. By employing these techniques, CatBoost mitigates common issues such as overfitting and computational inefficiency that are often encountered in traditional gradient boosting models, thereby enhancing both prediction accuracy and stability [11,12]. The ordered boosting approach, in particular, helps prevent prediction shifts during training and improves generalization, which is especially beneficial for making robust predictions on unseen industrial data, regardless of the feature types used. Meanwhile, the symmetric tree structure contributes to faster inference, a crucial requirement for real-time applications. However, research on CatBoost’s application to industrial equipment fault early warning remains limited, warranting more comprehensive and systematic investigation.
Meanwhile, the predictive performance of CatBoost heavily depends on the proper configuration of hyperparameters [13]. Suboptimal hyperparameter selection may result in noise sensitivity or underfitting, substantially compromising the accuracy and stability of fault early-warning systems. Conventional hyperparameter optimization methods like grid search and random search often require exhaustive exploration of large parameter spaces, leading to high computational costs and susceptibility to local optima [13]. These challenges are further exacerbated by the characteristic sparsity, class imbalance, and high-dimensional complexity of industrial fault data.
To address these limitations, metaheuristic algorithms [14,15] have become prominent solutions for machine-learning hyperparameter optimization. These biologically-inspired algorithms demonstrate superior global optimization capabilities through evolutionary mechanisms or swarm intelligence principles. Among various metaheuristic approaches, the bees algorithm (BA) has gained particular attention for hyperparameter optimization due to its effective swarm collaboration mechanism and balanced exploration-exploitation trade-off [16,17,18]. BA employs multiple neighborhood search strategies, utilizing optimal scout bees, better scout bees, and random scout bees to achieve comprehensive global exploration in complex parameter spaces [16,17,18]. This characteristic makes BA especially suitable for optimizing CatBoost hyperparameter combinations. However, BA still suffers from issues such as limited random population initialization, fixed neighborhood search strategies, and a lack of adaptability in scout bee role allocation. These shortcomings often lead to premature convergence or inadequate search efficiency when handling dynamic, heterogeneous parameter spaces in real-world industrial scenarios.
Currently, addressing the shortcomings of the standard BA, although various improved variants have been proposed and have achieved substantial progress, as pointed out by Hussein et al. [19] in their comprehensive review of BA, due to the “No Free Lunch” theorem [20], no single algorithm can achieve optimality under all conditions. Therefore, a broad space for exploration still exists in the utilization and improvement of standard BA. To this end, this study proposes an IBA. This algorithm integrates Latin Hypercube Sampling, a multi-perturbation neighborhood search strategy, and a dynamic scout bee adjustment mechanism. It aims to significantly enhance BA’s search capability in complex optimization problems, thereby achieving efficient global optimization of the CatBoost hyperparameters.
Compared to other BA variants, IBA is distinguished by several key aspects. Firstly, to the best of our knowledge, the application of Latin hypercube sampling for the population initialization of BA represents a novel exploration in this paper. Secondly, its neighborhood search mechanism also exhibits crucial differences. It explicitly considers the inherent characteristics of each dimension to adjust the scaling of the neighborhood radius. This approach contrasts with many BA variants that apply a uniform neighborhood coefficient to all dimensions, aiming to provide more refined search control. Furthermore, the algorithm also introduces a dynamic mechanism for managing scout bee roles, combining iteration state and stagnation detection.
To further validate the effectiveness of the proposed method, this study takes the mineral oil system of a compressor in a gas compression station as a real-world case study, collecting multi-source sensor data, including pressure differences, temperatures, and pressures. Based on prediction residuals, a fault early-warning model is constructed using KED to determine warning thresholds. The experimental results demonstrate that the IBA-CatBoost-KDE-based fault early-warning model outperforms the existing state-of-the-art methods in key performance metrics such as prediction accuracy, confirming the practical potential and technical superiority of the proposed approach.
In summary, the main contributions of this study include the following:
- (1)
- Addressing the shortcomings of BA, an IBA incorporating multiple strategies is proposed, significantly improving BA’s search capability and practical performance.
- (2)
- First successful implementation of BA-family algorithms for CatBoost hyperparameter optimization, effectively solving local optima challenges.
- (3)
- Developing an IBA-CatBoost-KDE hybrid intelligent framework for fault early warning, which synergistically integrates metaheuristic optimization (IBA), ensemble learning (CatBoost), and statistical estimation (KDE) to enable accurate state monitoring and proactive fault detection in complex industrial equipment.
The remainder of this paper is organized as follows: Section 2 reviews related work in fault early warning. Section 3 details the design of IBA, the core features of CatBoost, and its hyperparameter optimization process. Section 4 tests and validates the proposed method using real industrial equipment data. Section 5 compares IBA-CatBoost with other early-warning algorithms to demonstrate its advantages and conducts ablation experiments to verify the effectiveness of each component. Section 6 concludes the paper, discusses limitations, and outlines future research directions.
2. Literature Review
Fault early-warning technology, as a core component of predictive maintenance, has garnered significant attention in recent years. For instance, Tian et al. [6] developed a predictive model by integrating a bidirectional long short-term memory (BiLSTM) network with a prey–predator optimization algorithm, demonstrating its efficacy through experiments on a condensate pump. Li et al. [7] introduced a fault early-warning approach (SAOA-LightGBM) that combines an arithmetic optimization algorithm, simulated annealing, and LightGBM, showing a suitable performance in multi-class fault condition testing for pump systems. Gao et al. [21] engineered a dynamic model based on a wavelet packet decomposition and graph theory for industrial equipment fault detection, achieving early fault identification with experimental validation. Wang et al. [22] presented a prediction methodology that merges a gated recurrent unit (GRU) with an ant lion optimization algorithm to enhance fault warning accuracy.
Su et al. [23] crafted a model incorporating principal component analysis (PCA), a convolutional neural network, and BiLSTM for multi-parameter fault warning in marine diesel engines. Tan et al. [24] refined a social engineering optimization algorithm and integrated it with a backpropagation (BP) neural network for fault warning in hydro turbines, yielding improvements in prediction performance. Yang et al. [25] harnessed distributed optical fiber sensor signals in conjunction with machine-learning algorithms to establish a detection and identification model for damage events in oil and gas pipelines, enabling real-time fault monitoring. Liu et al. [26] proposed a hybrid model combining a random walk strategy, an equilibrium optimization algorithm, and an adaptive learning BP neural network to enhance fault detection and warning capabilities in manufacturing environments. Zhang et al. [15] employed a PSO algorithm featuring nonlinear decreasing inertia weights and exponential learning factors to optimize a deep belief network for fault warning in wind turbines. Using a dynamic cuckoo search algorithm (CSO) to optimize the structural parameters of a BP neural network, Zhang et al. [27] developed CSO-BP for fault detection and early warning in modern industrial equipment, enhancing prediction accuracy and convergence speed.
Pi et al. [28] applied an improved sand cat swarm optimization algorithm to refine BP neural network parameters, strengthening the model’s predictive capability and application performance. Cheng et al. [29] developed an early-warning model for turbine intermediate-stage magnetic flux faults by optimizing a GRU network with a human evolutionary optimization algorithm. Ji et al. [30] integrated a coati optimization algorithm with a BiLSTM network, validating their warning model through a case study on induced draft fan overload issues. Chen et al. [14] optimized a BP neural network using a genetic algorithm for fault warning in wind turbine pitch systems, achieving improvements in model prediction performance.
The literature analysis reveals that while machine learning has become predominant in fault early-warning research, the application of CatBoost in this domain remains largely unexplored despite its demonstrated advantages in handling categorical features and strong generalization capabilities. Concurrently, metaheuristic optimization algorithms have emerged as a dominant paradigm for improving warning model performance. However, as established by the “No Free Lunch Theorem” [20], no optimization algorithm can universally outperform all others across every problem domain.
Therefore, this study improves upon BA and applies it to optimize CatBoost hyperparameters, aiming to construct a novel hybrid fault early-warning model that enhances prediction accuracy and warning effectiveness. Furthermore, while other research also successfully combines metaheuristic algorithms with machine-learning models for similar tasks, such as SAOA-LightGBM [7] and DCS-BP [27], the IBA-CatBoost approach proposed in this study exhibits fundamental differences in both the optimization strategy and the underlying prediction model. Specifically, the IBA, based on the social division of labor principle of the BA, introduces unique enhancement mechanisms like dimension-adaptive neighborhood search and dynamic scout bee role adjustment based on the search stagnation state. This contrasts significantly with other metaheuristic algorithms, such as the inherent balance of exploration and exploitation driven by mathematical operators in SAOA, and the distinct global search using Levy flight combined with host nest discovery/abandonment strategies unique to DCS. Compared to the mechanisms employed by SAOA and DCS, IBA’s refined, dimension-specific search control and adaptive role management offer a unique optimization dynamic. Moreover, the selection of CatBoost as the base model is deliberate, aiming to leverage its inherent advantages for the robust and efficient modeling of data. Its ordered boosting mechanism is particularly effective at combating overfitting and handling prediction shifts during training, contributing to improved generalization even when dealing primarily with numerical features. Furthermore, its symmetric tree structure optimizes the training and inference processes, leading to higher computational efficiency. This contrasts with LightGBM’s leaf-wise growth strategy and gradient-based sampling techniques, which can sometimes be more prone to overfitting, and is fundamentally different from the connectionist learning paradigm of BP neural networks, which may require more data preprocessing and offer less interpretability for tabular structures. Thus, the synergy between the specifically enhanced IBA and the advantageous characteristics of the CatBoost model constitutes a novel and promising combination for robust and accurate hyperparameter optimization in the current scenario.
3. Proposed Hybrid Method
This section first details the CatBoost model and its unique advantages in industrial data modeling (Section 3.1). Subsequently, improvements are made to address the shortcomings of the BA, proposing the IBA (Section 3.2). By integrating CatBoost and IBA, an efficient hyperparameter tuning process is designed (Section 3.3).
3.1. CatBoost
CatBoost is an enhanced machine-learning algorithm based on gradient boosting decision trees. Compared to traditional gradient boosting decision trees, its key features and advantages are manifested in the following aspects [12]:
- (1)
- Enhanced gradient boosting implementation
CatBoost employs a specific strategy known as ordered boosting. This technique helps to combat the prediction shift or target leakage inherent in standard gradient boosting algorithms. By using models trained on preceding samples to estimate gradients for subsequent samples, it leads to more robust models less prone to overfitting, which is crucial for potentially noisy industrial datasets. Concurrently, it utilizes an unbiased gradient estimation mechanism, carefully managing how training data are used, to ensure more accurate gradient computations, contributing to improved model accuracy and stability. Furthermore, CatBoost typically grows symmetric trees, where the same splitting criterion is used across an entire level of the tree. This structure can act as a form of regularization, preventing overly complex trees, and often speeds up prediction time.
- (2)
- Statistical estimation with priors
A significant advantage of CatBoost, although not the primary focus of our current case study’s features, is its native and efficient handling of categorical variables. It integrates sophisticated encoding strategies directly into the training process, such as the one based on target statistics with priors shown below:
where is the unbiased estimate for the kth category, is the indicator function (1 if the condition is met, otherwise 0), is often the global label mean or other prior information, and controls the influence strength of the prior term on the final encoding result.
This built-in handling eliminates the need for cumbersome preprocessing methods like one-hot encoding, simplifying the modeling pipeline and often improving performance on datasets with high-cardinality categorical features, which are also common in other industrial scenarios.
- (3)
- Overall suitability for industrial applications
Taken together, CatBoost’s strong resistance to overfitting, improved gradient accuracy, and robust performance make it a compelling candidate for modeling complex industrial processes, even those primarily characterized by numerical sensor data such as pressure and temperature. Its ability to handle potential noise and deliver stable predictions is highly valuable in industrial settings. Moreover, its built-in capabilities for categorical data provide flexibility for extending the model to broader industrial datasets that may include such features in the future.
3.2. Proposed IBA
3.2.1. Bees Algorithm
BA, first proposed by Pham et al. [31], simulates the collaborative foraging and scouting behavior of bees to efficiently search the solution space and find optimal solutions. The basic BA workflow includes population initialization, fitness evaluation, neighborhood search, and global search. The specific steps are as follows:
- (1)
- Population initialization
The first step of BA is to initialize the scout bees. All scout bees are randomly distributed within the feasible solution space of the optimization problem. The position of each bee is represented by a vector, initialized as follows:
where , and are the lower and upper bounds of the dimension, and denotes a uniform random number within the interval.
- (2)
- Fitness evaluation
After initialization, BA enters the main iterative loop. In each iteration, the fitness of the scout bees’ solutions is evaluated (calculated as the reciprocal of the objective function value), and the solutions are sorted in descending order of fitness. The top solutions are classified as optimal scouts, the next as better scouts, and the remaining as random scouts. Subsequently, forager bees are assigned to the optimal scouts, and forager bees are allocated to the better scouts, preparing for the subsequent neighborhood search.
- (3)
- Neighborhood search
After identifying optimal and better scouts, the algorithm enters the neighborhood search phase, simulating the behavior of scout bees leading forager bees to intensively exploit around food sources. The position of forager bees is generated as follows:
where is the position of the scout bee in the dimension, is a uniformly distributed random number in [0, 1], and is the neighborhood search radius (a preset parameter).
The algorithm implements a greedy selection mechanism as follows: When a forager bee discovers a solution with superior fitness compared to its associated scout bee, the scout bee’s position is updated with the forager’s solution. Conversely, if the forager’s solution fails to improve upon the scout bee’s current position, the original scout bee is maintained in the population. Each instance where no fitness improvement occurs is recorded as a stagnation event. To optimize computational resource allocation, the algorithm enforces a constraint permitting only one scout bee to persist within each neighborhood patch during any given iteration.
- (4)
- Global search
In the global search phase, random scout bees are redistributed by generating new positions randomly in the solution space. This step aims to escape local optima and explore potential new high-quality solutions. If a random scout bee finds a better solution, it will participate in neighborhood search in subsequent iterations.
- (5)
- Formation of new scout generation
After neighborhood and global searches, all scout bees are merged to form a new generation of scouts, including improved neighborhood scouts and new random scouts from global search. Before the next iteration, fitness evaluation and classification are repeated until termination conditions are met.
3.2.2. Improved Bees Algorithm
Although BA is simple to implement and performs well, it has limitations such as an uneven initial population distribution, limited local exploitation in neighborhood search, and fixed scout roles. To address these shortcomings, this study proposes targeted improvements to enhance algorithm performance. The specific improvements are as follows:
- (1)
- Latin hypercube sampling for population initialization
BA uses random initialization to generate scout bee positions, which may lead to uneven initial solution distributions and affect search efficiency. IBA introduces Latin hypercube sampling to ensure diversity and uniformity of initial solutions. The process is as follows:
For each dimension of the solution space , divide it into (population size) sub-intervals with width
Then, generate a random permutation sequence for each dimension , satisfying
The position of each individual in dimension is calculated as follows:
where is a uniform random offset within the dth sub-interval.
- (2)
- Multi-perturbation neighborhood search strategy
BA uses a fixed search radius for neighborhood search, making it difficult to balance global exploration and local exploitation. IBA introduces dynamic neighborhood adjustment and dimension-wise hybrid perturbation to balance these capabilities. The steps are as follows:
First, the neighborhood radius is reduced cosine-wise with iterations to ensure broad exploration early and precise convergence later:
where is the neighborhood radius at iteration in the dth dimension, is an initial coefficient, and is the maximum number of iterations.
Next, dimension-wise hybrid perturbation is applied. For each scout bee , another random candidate scout bee is selected, and the perturbation weight and direction for each dimension are calculated:
where is the perturbation weight for dimension , and are the positions of the current and candidate scout bees in dimension , and is the normalized scaling factor for dimension.
Finally, hybrid random noise and directional guidance generate new solutions:
where is the sign function (1 if , −1 if , 0 if equal).
- (3)
- Dynamic scout bee adjustment strategy
In BA, the numbers of optimal and better scouts are fixed, which may lead to premature convergence or slow convergence. IBA dynamically adjusts these numbers based on iteration progress and stagnation detection:
where and are the numbers of optimal and better scouts at iteration , and are growth coefficients, and are the allowed maximum limits for optimal and better scout bees, and and are their corresponding initial values.
Finally, we implement a stagnation response mechanism: If no better solution is found after SC consecutive iterations, the algorithm temporarily increases the proportion of random scout bees while reducing the number of optimal and better scout bees from the current iteration. The adjustment follows Equations (12) and (13):
where is a decay factor.
It should be noted that the stagnation counter is reset to 0 whenever a better solution is found.
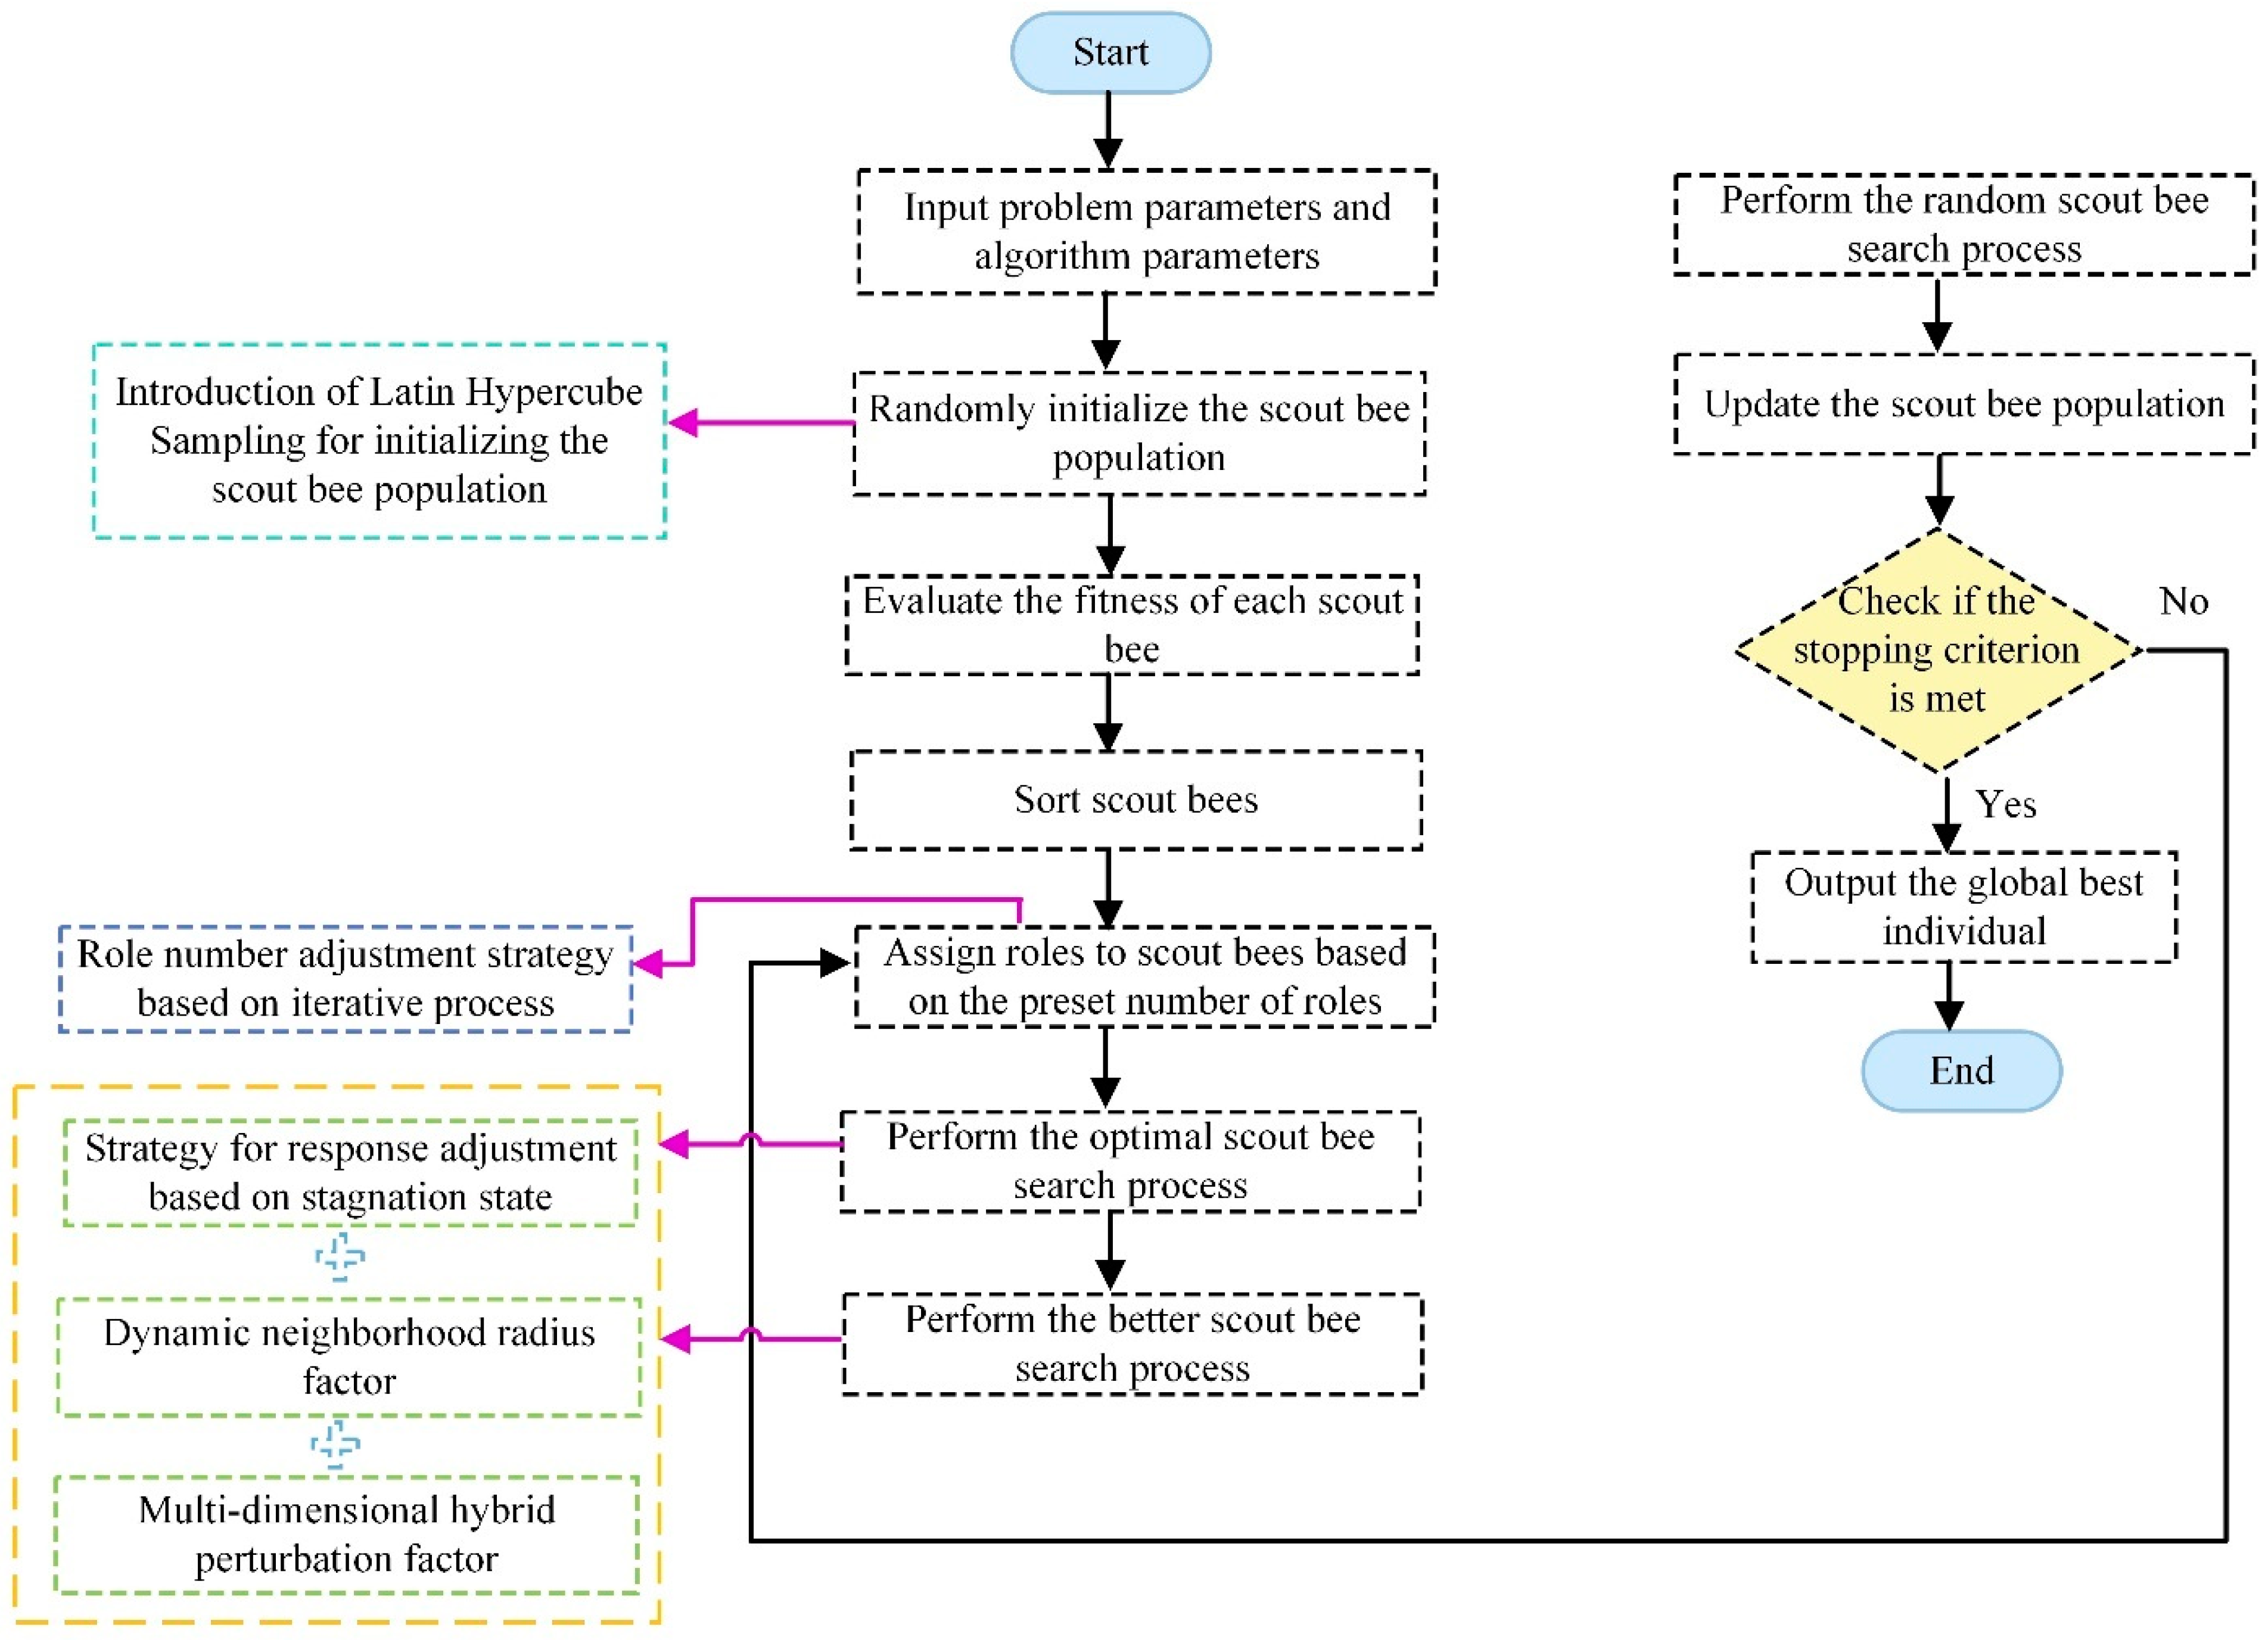
Finally, Figure 1 further illustrates the improvements in IBA.
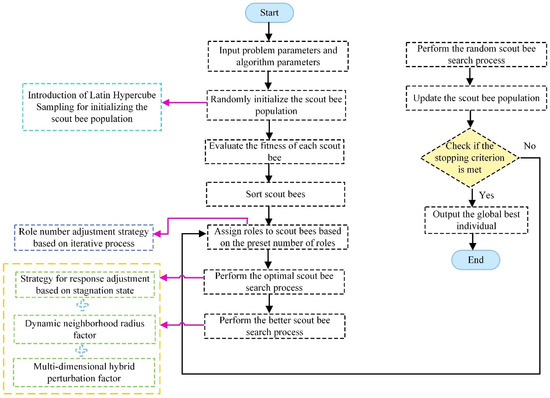
Figure 1.
Key improvements in IBA.
3.3. IBA-Based CatBoost Hyperparameter Tuning Process
Using RMSE [32] as the evaluation metric, a 5-fold cross-validation approach is utilized. Specifically, 5-fold cross-validation is performed on the training set. For each set of candidate hyperparameters, its average RMSE across the 5 validation folds is calculated, and this average RMSE serves as the basis for evaluating the quality of the hyperparameter combination. Subsequently, IBA optimizes the key hyperparameters of the CatBoost algorithm, including the number of trees (), learning rate (), tree depth (), and regularization strength (). Among these, the parameter controls the overall model complexity, the parameter directly affects the model’s convergence speed and stability, the parameter determines the model’s ability to capture deep feature interactions, and the parameter effectively suppresses model overfitting by introducing a regularization mechanism. The specific steps are as follows:
Step 1: Set the range of CatBoost hyperparameters and configure IBA.
Step 2: Define the fitness function for the algorithm.
Step 3: Initialize the scout bee population using Latin Hypercube Sampling.
Step 4: Calculate the number of scout bees in different roles for the current iteration and assign roles.
Step 5: Execute the optimal scout bee search process using the multi-perturbation neighborhood search strategy.
Step 6: Execute the better scout bee search process using the multi-perturbation neighborhood search strategy.
Step 7: Perform the global search process for random scout bees.
Step 8: Update the scout bee population.
Step 9: Check if has been reached. If yes, output the best individual (i.e., the optimal CatBoost hyperparameter combination); otherwise, return to Step 4.
The pseudocode for the execution process is shown in Algorithm 1:
| Algorithm 1: IBA for CatBoost hyperparameter optimization |
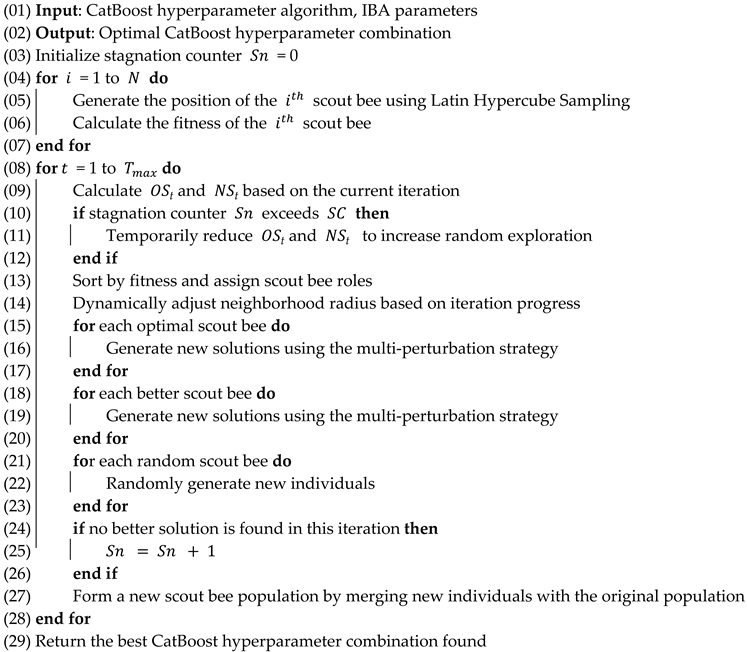 |
4. Case Study
To validate the effectiveness of the proposed method, this section analyzes the connecting rod misalignment fault in the valve position sensor of a locator valve within the mineral oil system of a compressor at a gas compressor station.
Through analysis, the key output measurement point for this fault is determined to be the mineral oil header temperature, with 16 correlated preliminary input measurement points selected: mineral oil tank pressure B, compressor No.1 bearing temperature A, compressor main thrust bearing temperature A, compressor No.1 bearing temperature B, compressor No.2 bearing temperature A, compressor main thrust bearing temperature B, mineral oil pump outlet pressure, mineral oil tank pressure A, compressor auxiliary thrust bearing temperature A, compressor No.2 bearing temperature B, mineral oil header pressure B, mineral oil header pressure A, mineral oil tank temperature, mineral oil duplex filter differential pressure, ambient temperature, and mineral oil cooler outlet temperature.
To comprehensively evaluate the equipment operating status, this study collected continuous monitoring data from 1 June to 15 June 2024 (15 consecutive days) with a 5 min sampling interval.
Then, in order to ensure the reliability and accuracy of the model, the raw monitoring data underwent a strict quality control and preprocessing process before being used for modeling. This process aims to identify and handle anomalies, missing values, and invalid data segments within the data, thereby providing reliable foundational data. This process first includes anomaly detection and handling for the time series data of each measurement point. We employ box plot analysis to identify potential outlier readings and process them by replacing the detected anomalies with the average value of data points at a few preceding and succeeding time points for that measurement point, to eliminate the impact of noise or erroneous data. Secondly, based on monitoring system logs, we identify and thoroughly remove invalid data segments resulting from reasons such as equipment downtime, sensor failures, communication interruptions, or maintenance. Furthermore, after removing anomalies and invalid data segments, for any potential small amount of random missing values in the remaining data, we employ linear interpolation for imputation to ensure the integrity of the data sequence. Through this series of strict preprocessing steps, we ultimately obtain 4228 valid and high-quality data points, laying a solid foundation for subsequent model training and evaluation. The normal condition of the locator valve’s connecting rod is shown in Figure 2.
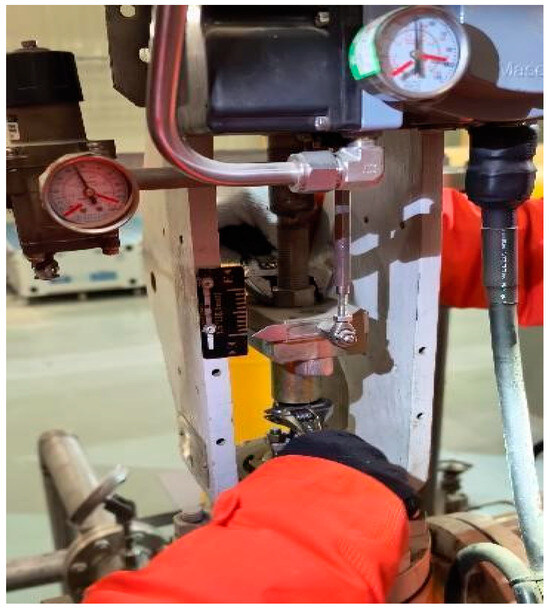
Figure 2.
Normal state of the valve position sensor connecting rod.
Following the data collection, this section first conducts preliminary analysis and dimensionality reduction on the acquired data to select the most representative key measurement points, providing high-quality feature inputs for model construction (Section 4.1). Based on the reduced-dimension data, we build and optimize the IBA-CatBoost model (Section 4.2), while utilizing prediction residual analysis and kernel density estimation techniques to determine reliable fault warning thresholds (Section 4.3). Finally, the practical effectiveness of the proposed warning method is verified through fault case validation (Section 4.4).
4.1. Data Dimensionality Reduction
Given the large number of input measurement points, direct modeling would lead to high computational complexity and the curse of dimensionality, thereby affecting model training efficiency and prediction accuracy. Therefore, we employ Spearman’s rank correlation coefficient for dimensionality reduction screening of the input measurement points. This method is particularly suitable for measuring monotonic correlations between variables and maintains a good correlation identification capability even when nonlinear relationships exist. The calculation formula for Spearman’s correlation coefficient is as follows [33]:
where represents the rank difference between two variables, and is the sample size.
Subsequently, we calculate Spearman’s rank correlation coefficients between each of the 16 input measurement points and the output measurement point. To ensure significant correlation between the selected variables and the target variable, we set a screening threshold of 0.9. The calculation results are presented in Table 1.

Table 1.
Key measurement points selected by spearman rank correlation coefficient.
Through Spearman’s rank correlation analysis, we effectively reduce the input features from 16 to 5 key measurement points. The screened feature set not only achieves a 68.75% reduction in dimensionality but also maintains a strong correlation with the target variable (average 0.936). This significantly alleviates the computational burden caused by high-dimensional data while ensuring information integrity, providing an excellent feature input foundation for subsequent IBA-CatBoost model training.
4.2. Warning Model Construction
After completing the dimensionality reduction screening of input measurement points, we proceed with the construction of the fault warning model based on the five selected key measurement points. First, the collected 4228 valid data points are divided into training and test sets at an 8:2 ratio. The training set is used for model training and parameter optimization, while the test set is used for model performance verification and effectiveness evaluation.
The CatBoost model adopts the default symmetric tree growth strategy. To determine the hyperparameter configuration range for IBA, based on preliminary experiments, we first define three reference levels for each parameter as shown in Table 2.
Table 2.
Parameters and their reference levels for IBA.
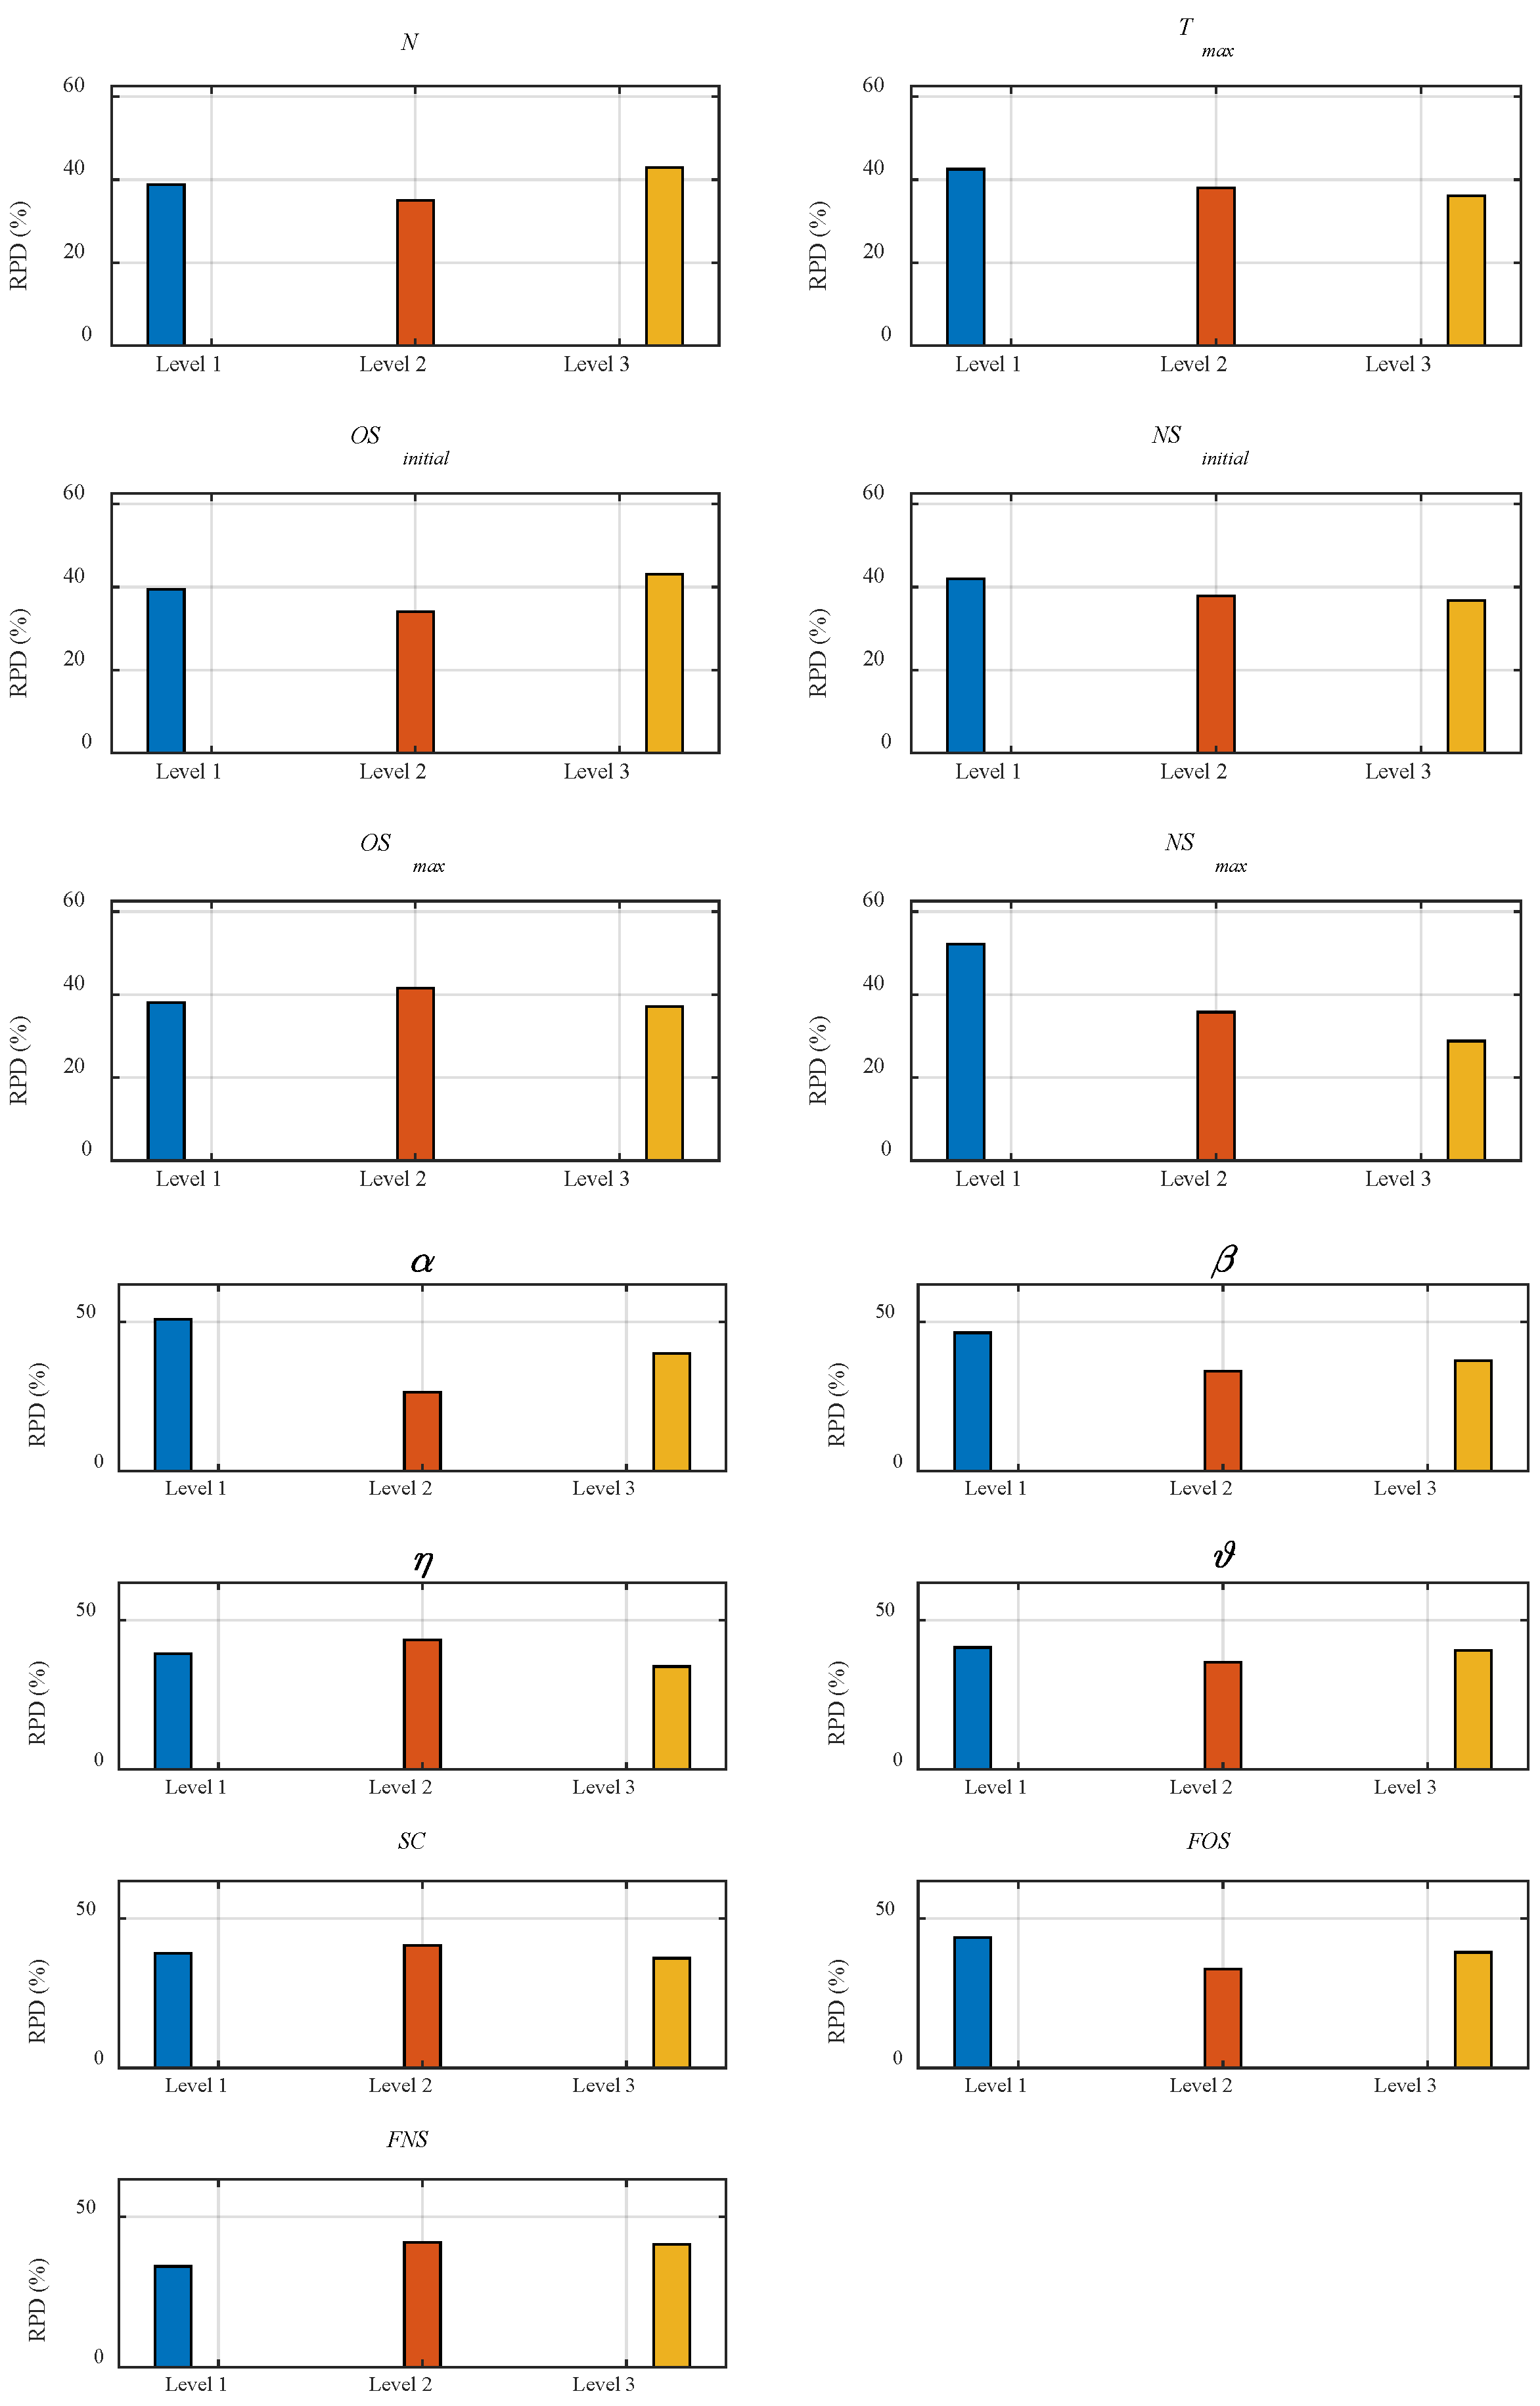
Considering the number of parameters, we use the Taguchi experimental method for parameter calibration. Following the recommendations of the Taguchi method, we select the L27 orthogonal array. Finally, we use the Relative Percentage Deviation (RPD) to normalize them. The formula for calculating RPD is given by
where is the minimum RMSE across all experiments, is the RMSE in the experiment, and is the experiment index.
Afterward, we determine the IBA parameter configuration by calculating the average RPD for each value of each parameter set, as shown in Figure 3. The lower the average RPD, the better the algorithm performance under that parameter level.
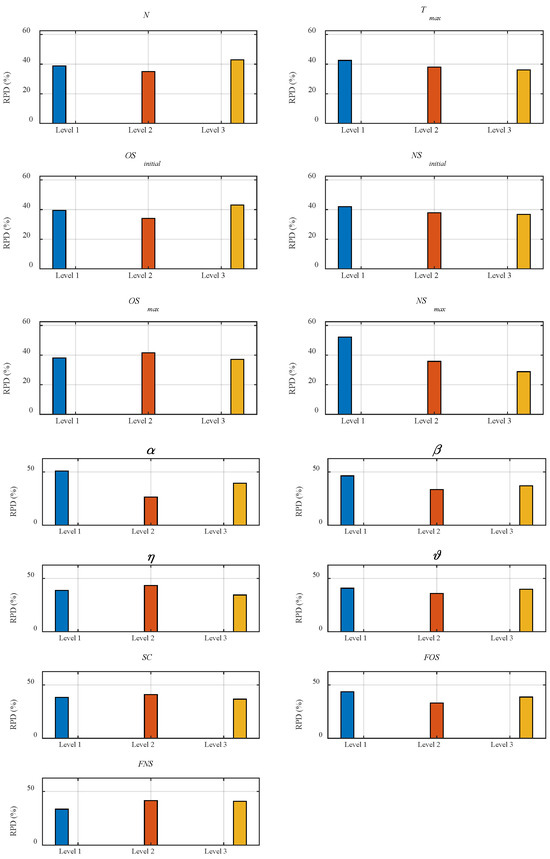
Figure 3.
IBA parameter calibration results.
Finally, the IBA parameters and CatBoost hyperparameter optimization ranges are set as shown in Table 3.
Table 3.
Parameter settings of IBA-CatBoost.
After completing model training, we use test set data for prediction validation. The prediction results on the test set are shown in Figure 4.
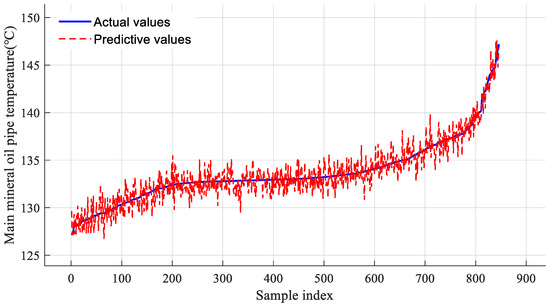
Figure 4.
Comparison of predicted and actual values on the test set by IBA-CatBoost model.
As seen from Figure 4, the predicted values show high consistency with the actual values in terms of variation trends. The model accurately reflects the dynamic change process of mineral oil header temperature.
4.3. Warning Threshold Determination
The mineral oil main header temperature prediction model based on IBA-CatBoost can obtain residual sequences between predicted and actual values in the test set. Since residual distribution effectively reflects equipment operating status, it serves as a critical basis for determining fault warning thresholds.
To model the actual distribution of IBA-CatBoost prediction residuals, we employ KDE to fit the probability density function. As a non-parametric method, KDE demonstrates significant value in fault warning and health assessment research. Assuming the prediction residuals follow a certain probability density distribution, the KDE function is expressed as follows [34]:
where is estimated probability density function, is the sample size, is the bandwidth parameter, is the point at which to estimate density, is the observation or sample point, and is the kernel function.
The bandwidth parameter is calculated as follows:
where is the sample standard deviation.
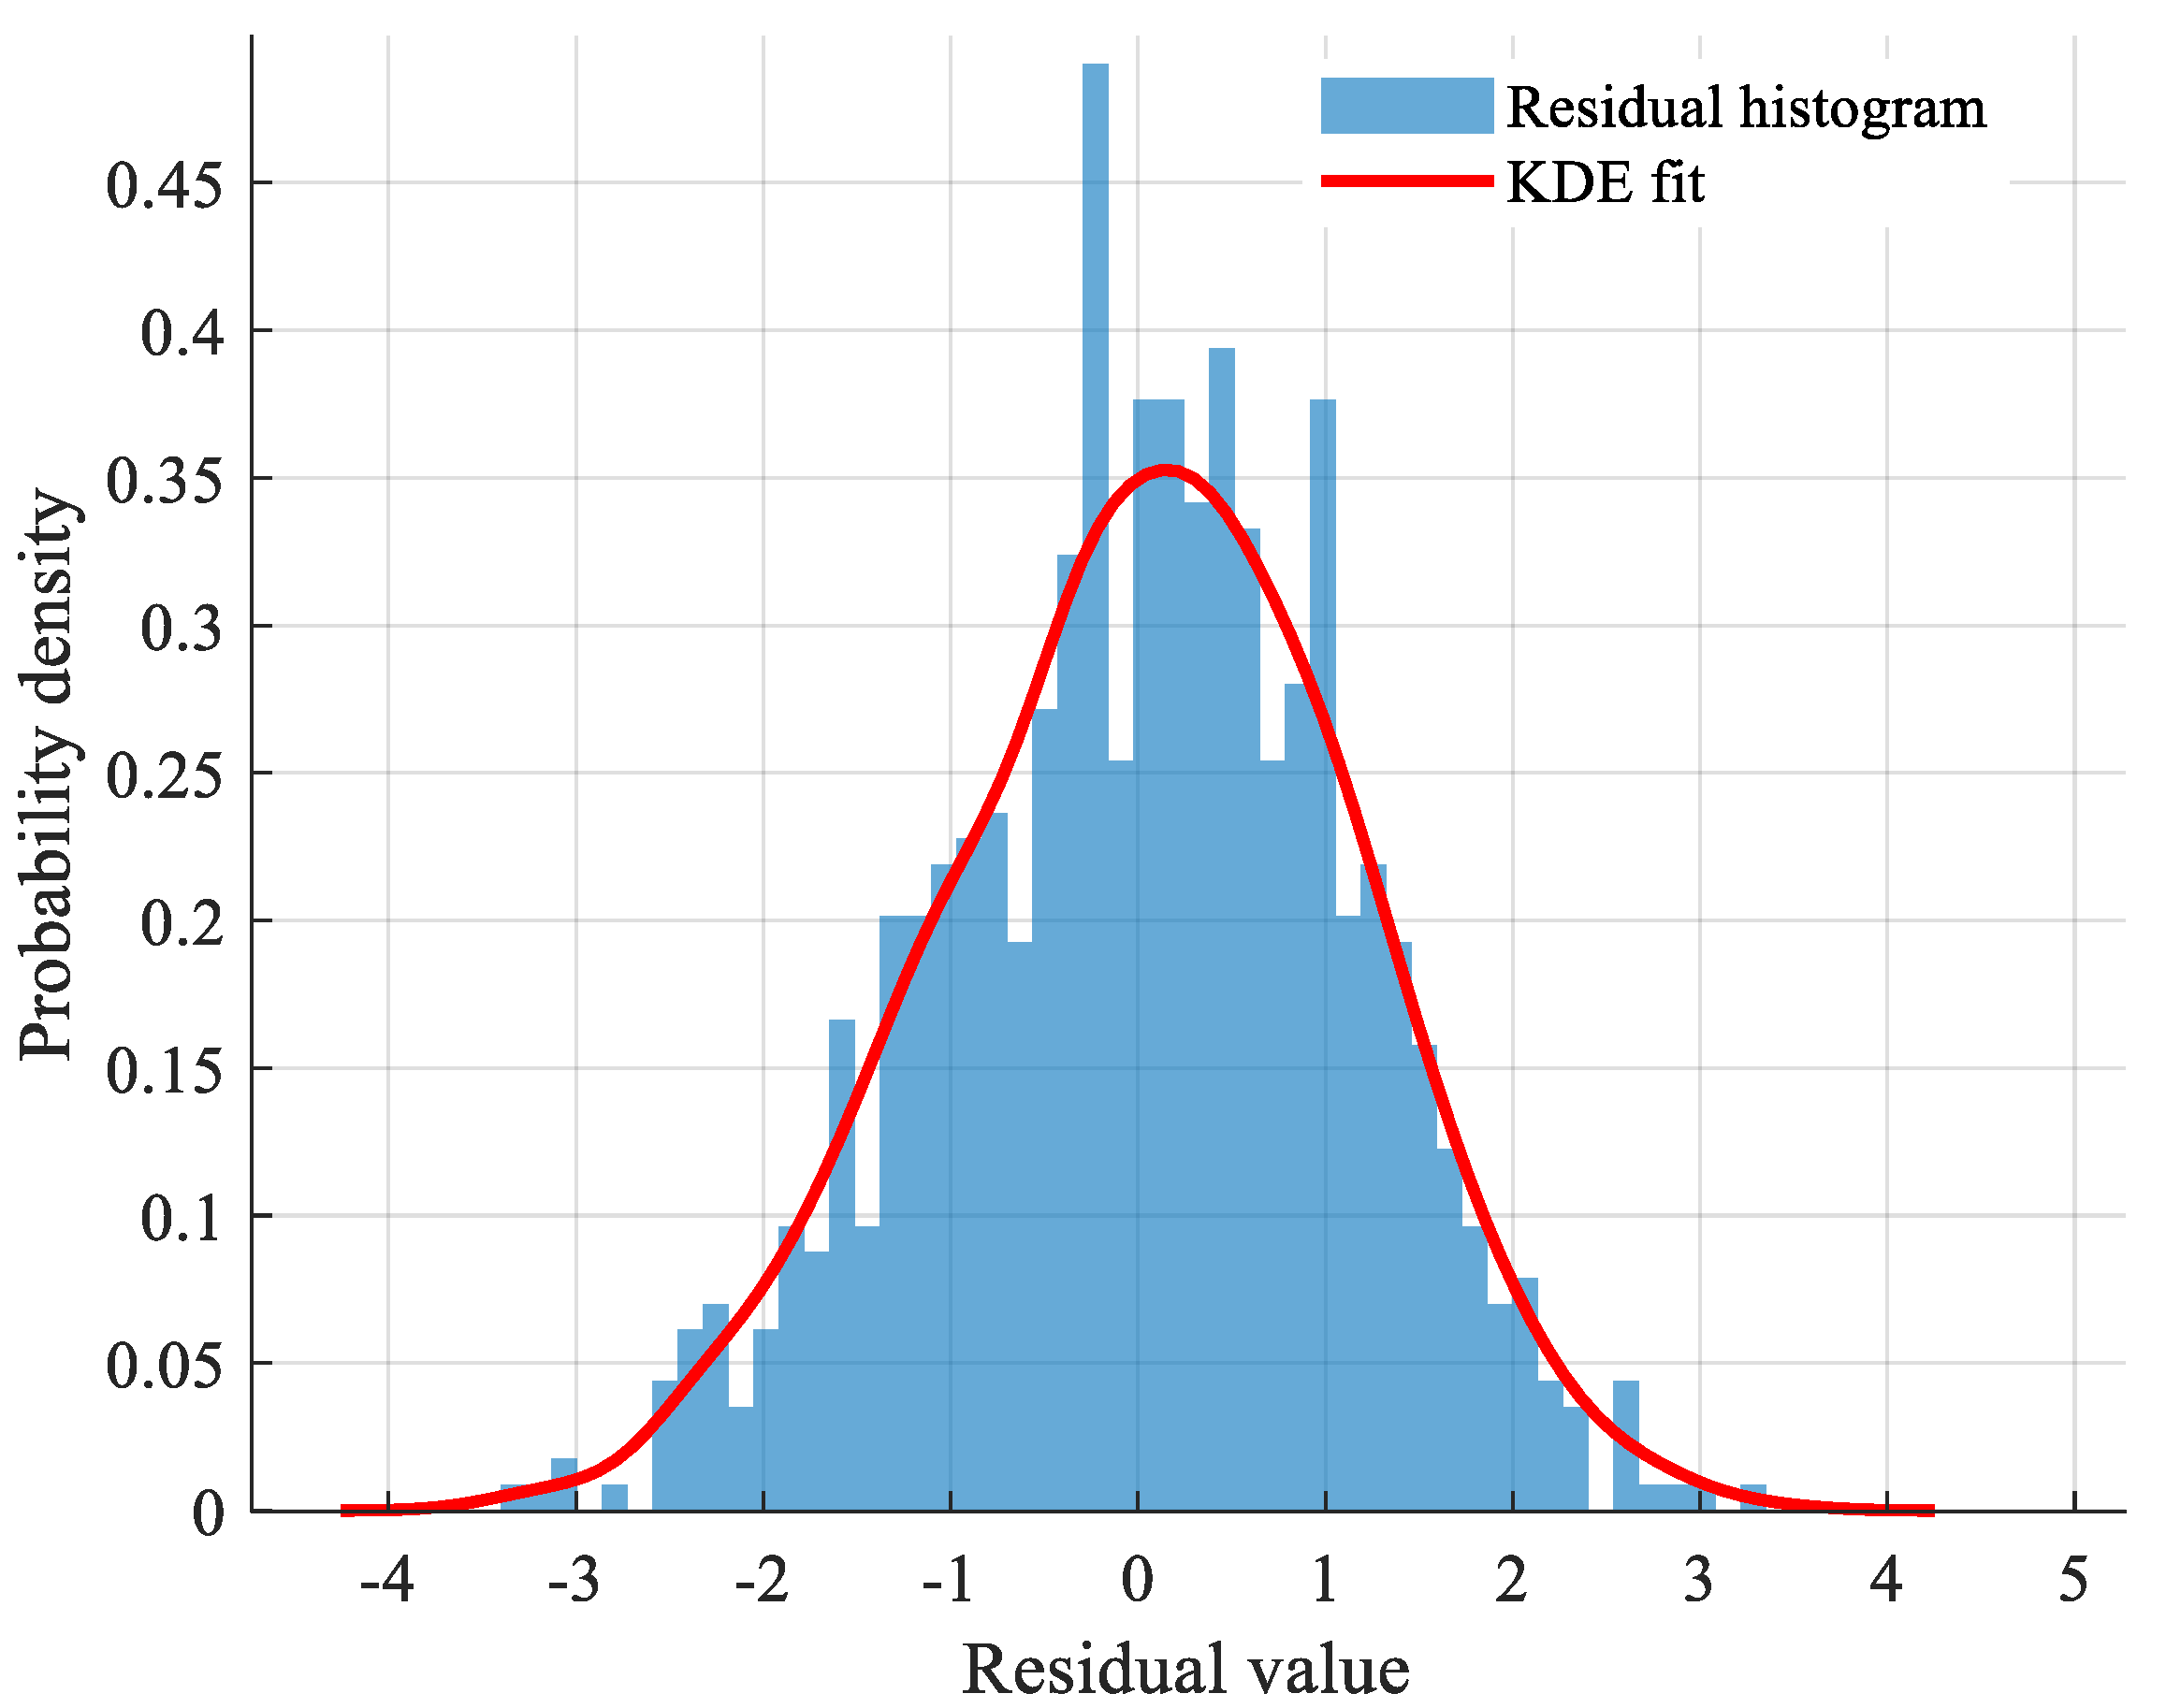
The residual distribution of the mineral oil header temperature prediction set from the IBA-CatBoost model is fitted using the KDE method, with the fitted probability density curve shown in Figure 5.

Figure 5.
KDE-fitted residual probability density distribution.
As can be seen from the results, except for a few points located outside the interval [−3, 3], the majority of residuals are distributed within [−3, 3]. Furthermore, the KDE-fitted residual probability density curve appears smooth and nearly symmetric about = 0, suggesting the distribution can be reasonably approximated as normal.
Based on this observation, we employ the criterion to determine the fault warning threshold. This criterion indicates that when residuals follow a normal distribution, approximately 99.73% of the data points will fall within the interval . Residuals exceeding this range can be considered as low-probability events and thus identified as potential abnormal states.
The calculation yields a residual mean and residual standard deviation , thus determining the fault warning threshold range as .
Moreover, considering that even during normal equipment operation, a very small number of residuals may exceed this range, we introduce a sliding window method [30] to avoid false alarms. By setting an appropriate window width, we conduct localized analysis of anomaly points, enhancing the robustness and accuracy of the warning system.
4.4. Warning Case Study
To validate the effectiveness of the constructed fault warning model, this study examines a deflection fault in the valve position sensor connecting rod of the mineral oil system in a gas compressor station, which occurs at 17:00 on 11 December 2024, as shown in Figure 6. This fault triggers a chain reaction in the control system: First, mechanical misalignment of the connecting rod causes significant deviation between the sensor signal and actual valve position, resulting in erroneous feedback to the control system. Second, this deviation induces sustained oscillations in the control loop, not only reducing regulation accuracy but also accelerating mechanical wear of the actuator. More critically, prolonged operation under this condition leads to valve sticking or operational failure, posing safety risks during emergency scenarios. Additionally, system energy consumption increases substantially due to continuous corrective actions by the control loop.
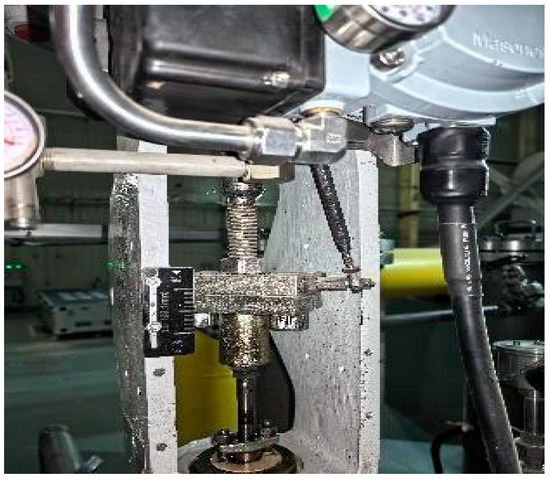
Figure 6.
Schematic diagram of the locator valve position sensor connecting rod tilt fault.
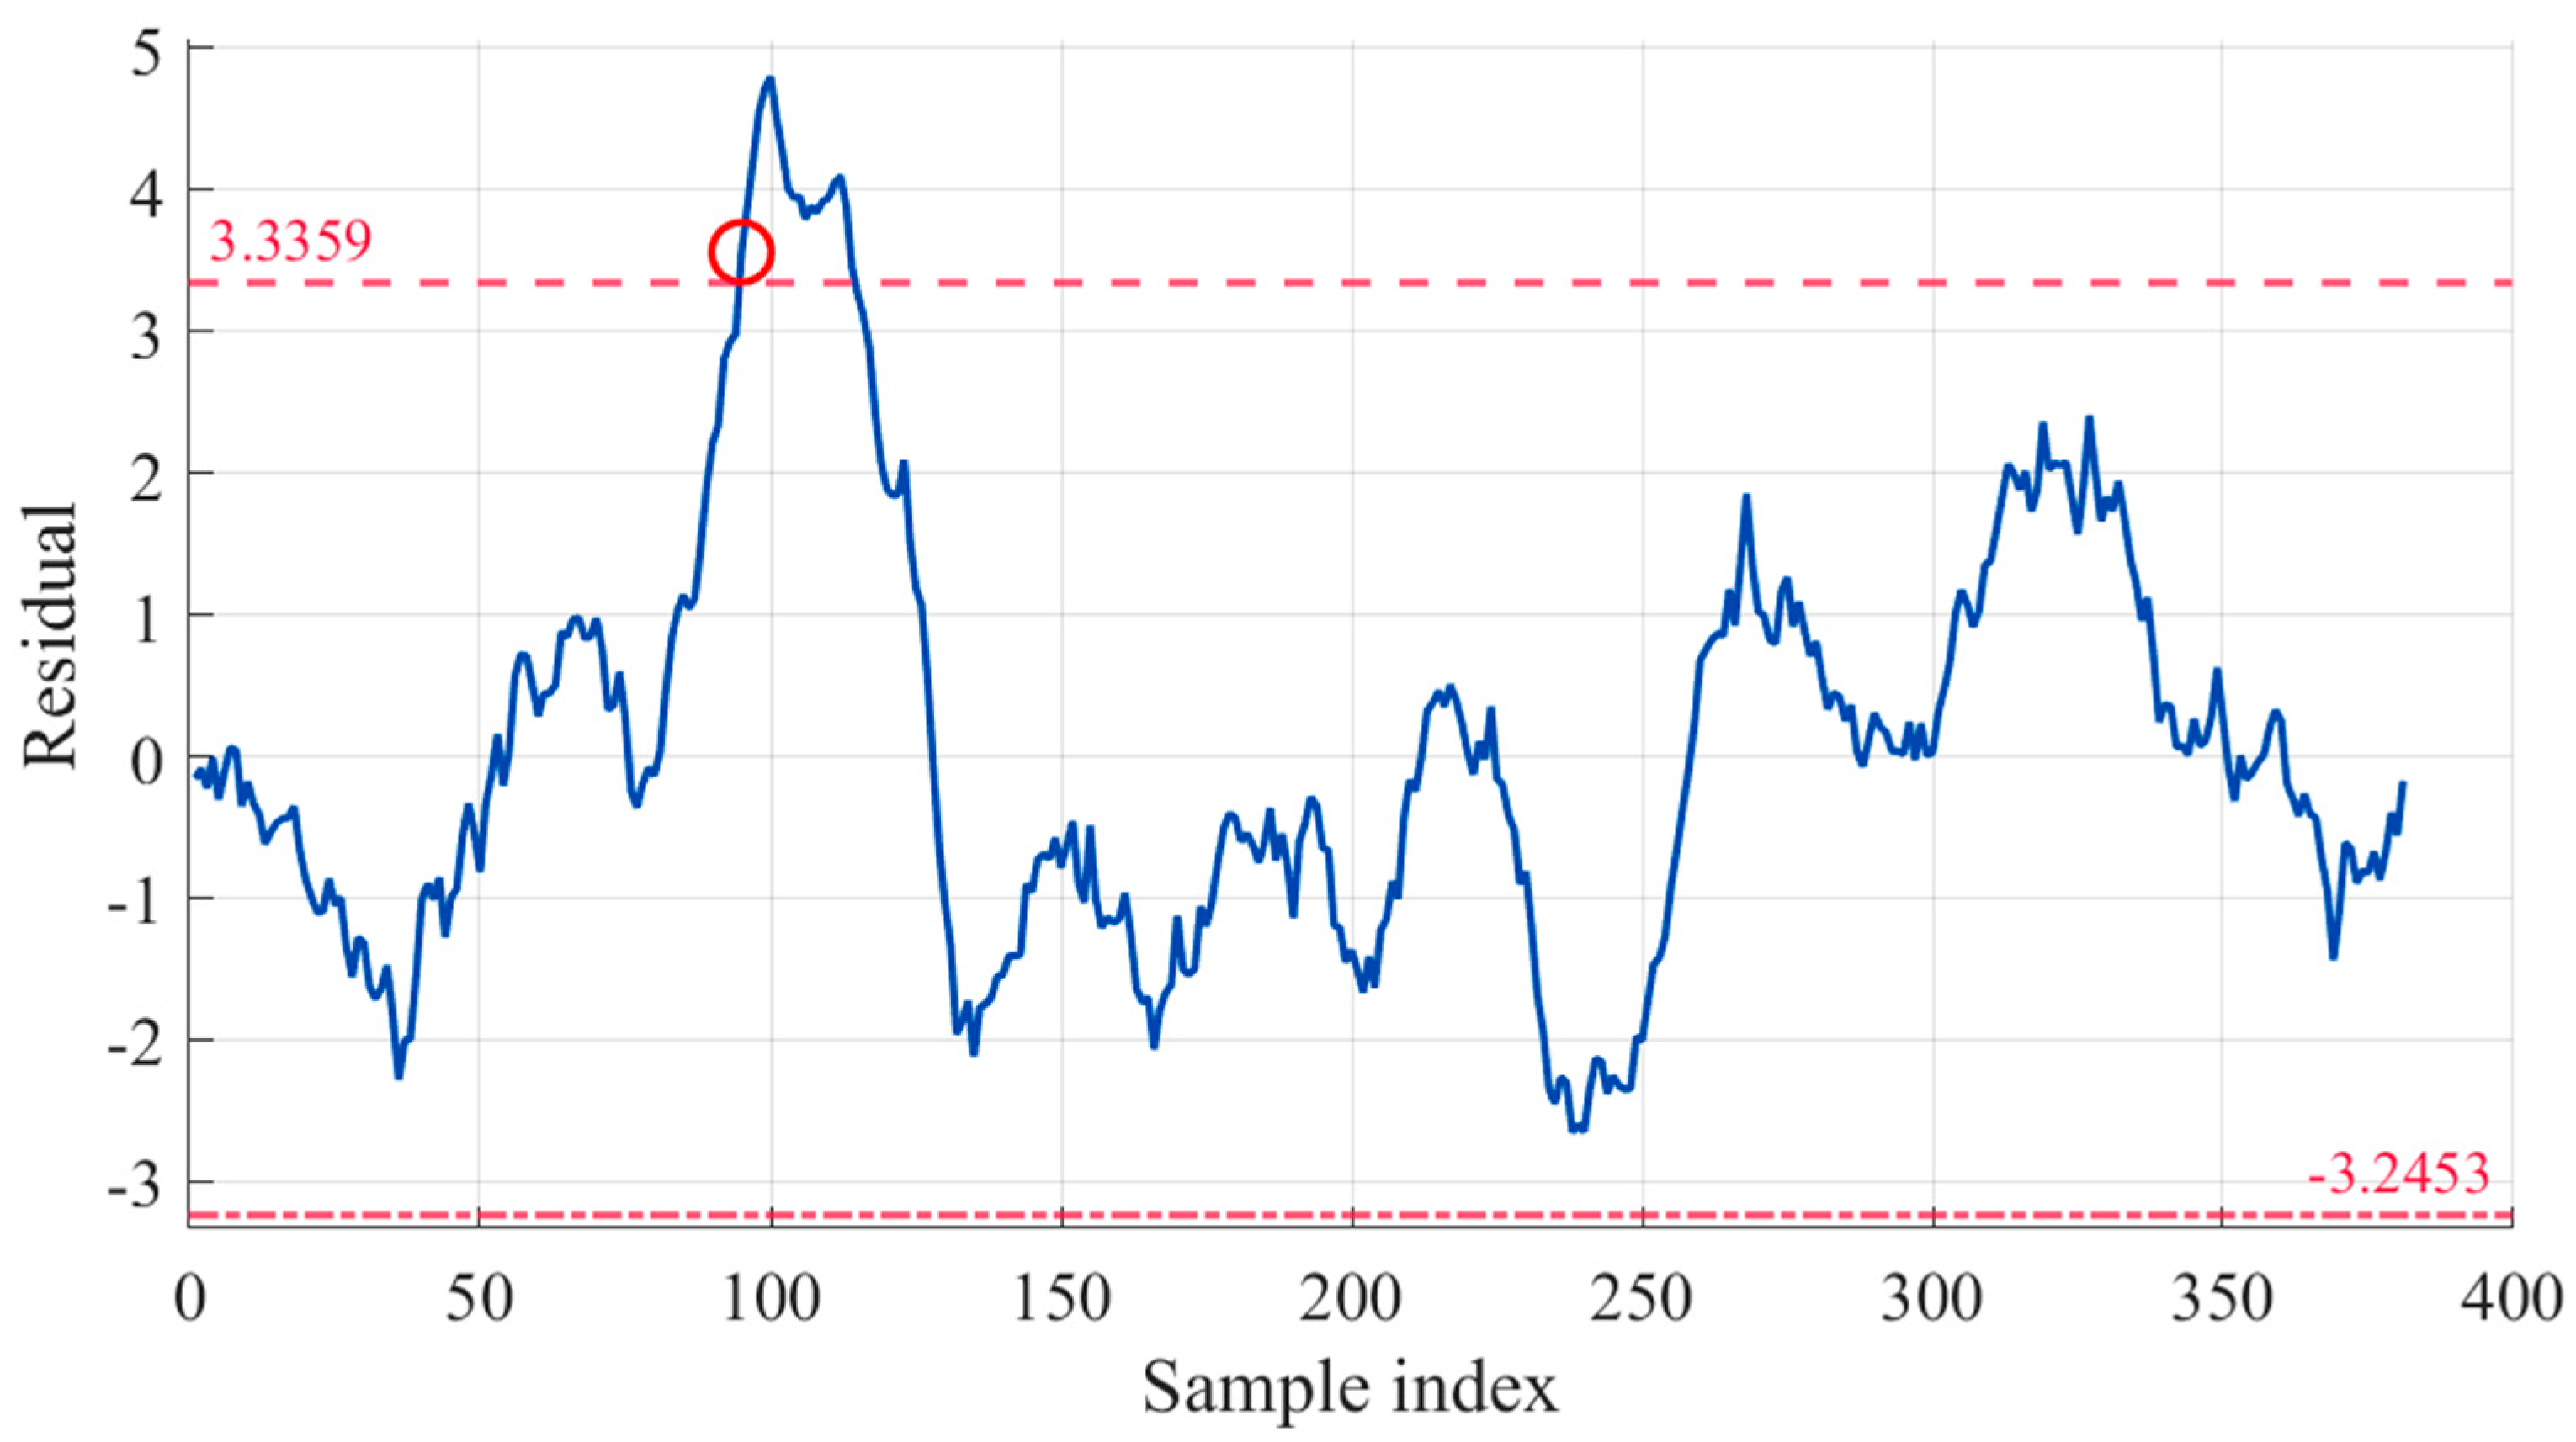
For this progressively developing fault, we collect 400 sets of operational data before and after the fault occurrence. Using the IBA-CatBoost prediction model with a sliding window step of 1 and window width of 20, we obtain the smoothed prediction residual curve shown in Figure 7. The selection of the 20-point window width is based on an empirical tuning process conducted during the model development phase. This process involved evaluating different window sizes to identify a value that effectively balances the need to capture sufficient temporal dependencies inherent in the progressive fault data with the practical constraint of maintaining computational efficiency. Furthermore, this chosen window size is consistent with configurations successfully utilized in several relevant studies in the field of fault warning, providing additional empirical support for its appropriateness [30].
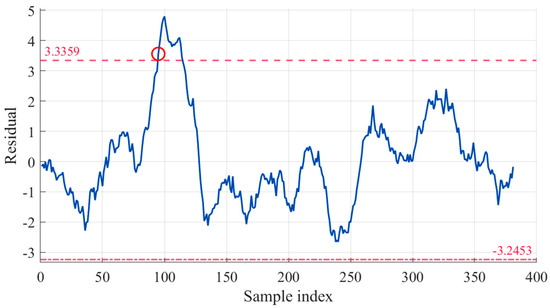
Figure 7.
Prediction residual curve before and after fault occurrence.
The analysis demonstrates that IBA-CatBoost detects abnormal trends starting at the 76th sample point, with the residual exceeding the warning threshold at the 95th sample point—triggering an alarm approximately 2 h earlier than the actual fault alert. This result conclusively verifies IBA-CatBoost’s effectiveness in early fault warning.
5. Algorithm Performance Analysis
In this section, we first conduct comparative experiments between IBA-CatBoost and other advanced methods to analyze its performance (Section 5.1), followed by ablation experiments to further demonstrate the effectiveness of each component in IBA-CatBoost (Section 5.2).
5.1. Comparison with Other Advanced Warning Algorithms
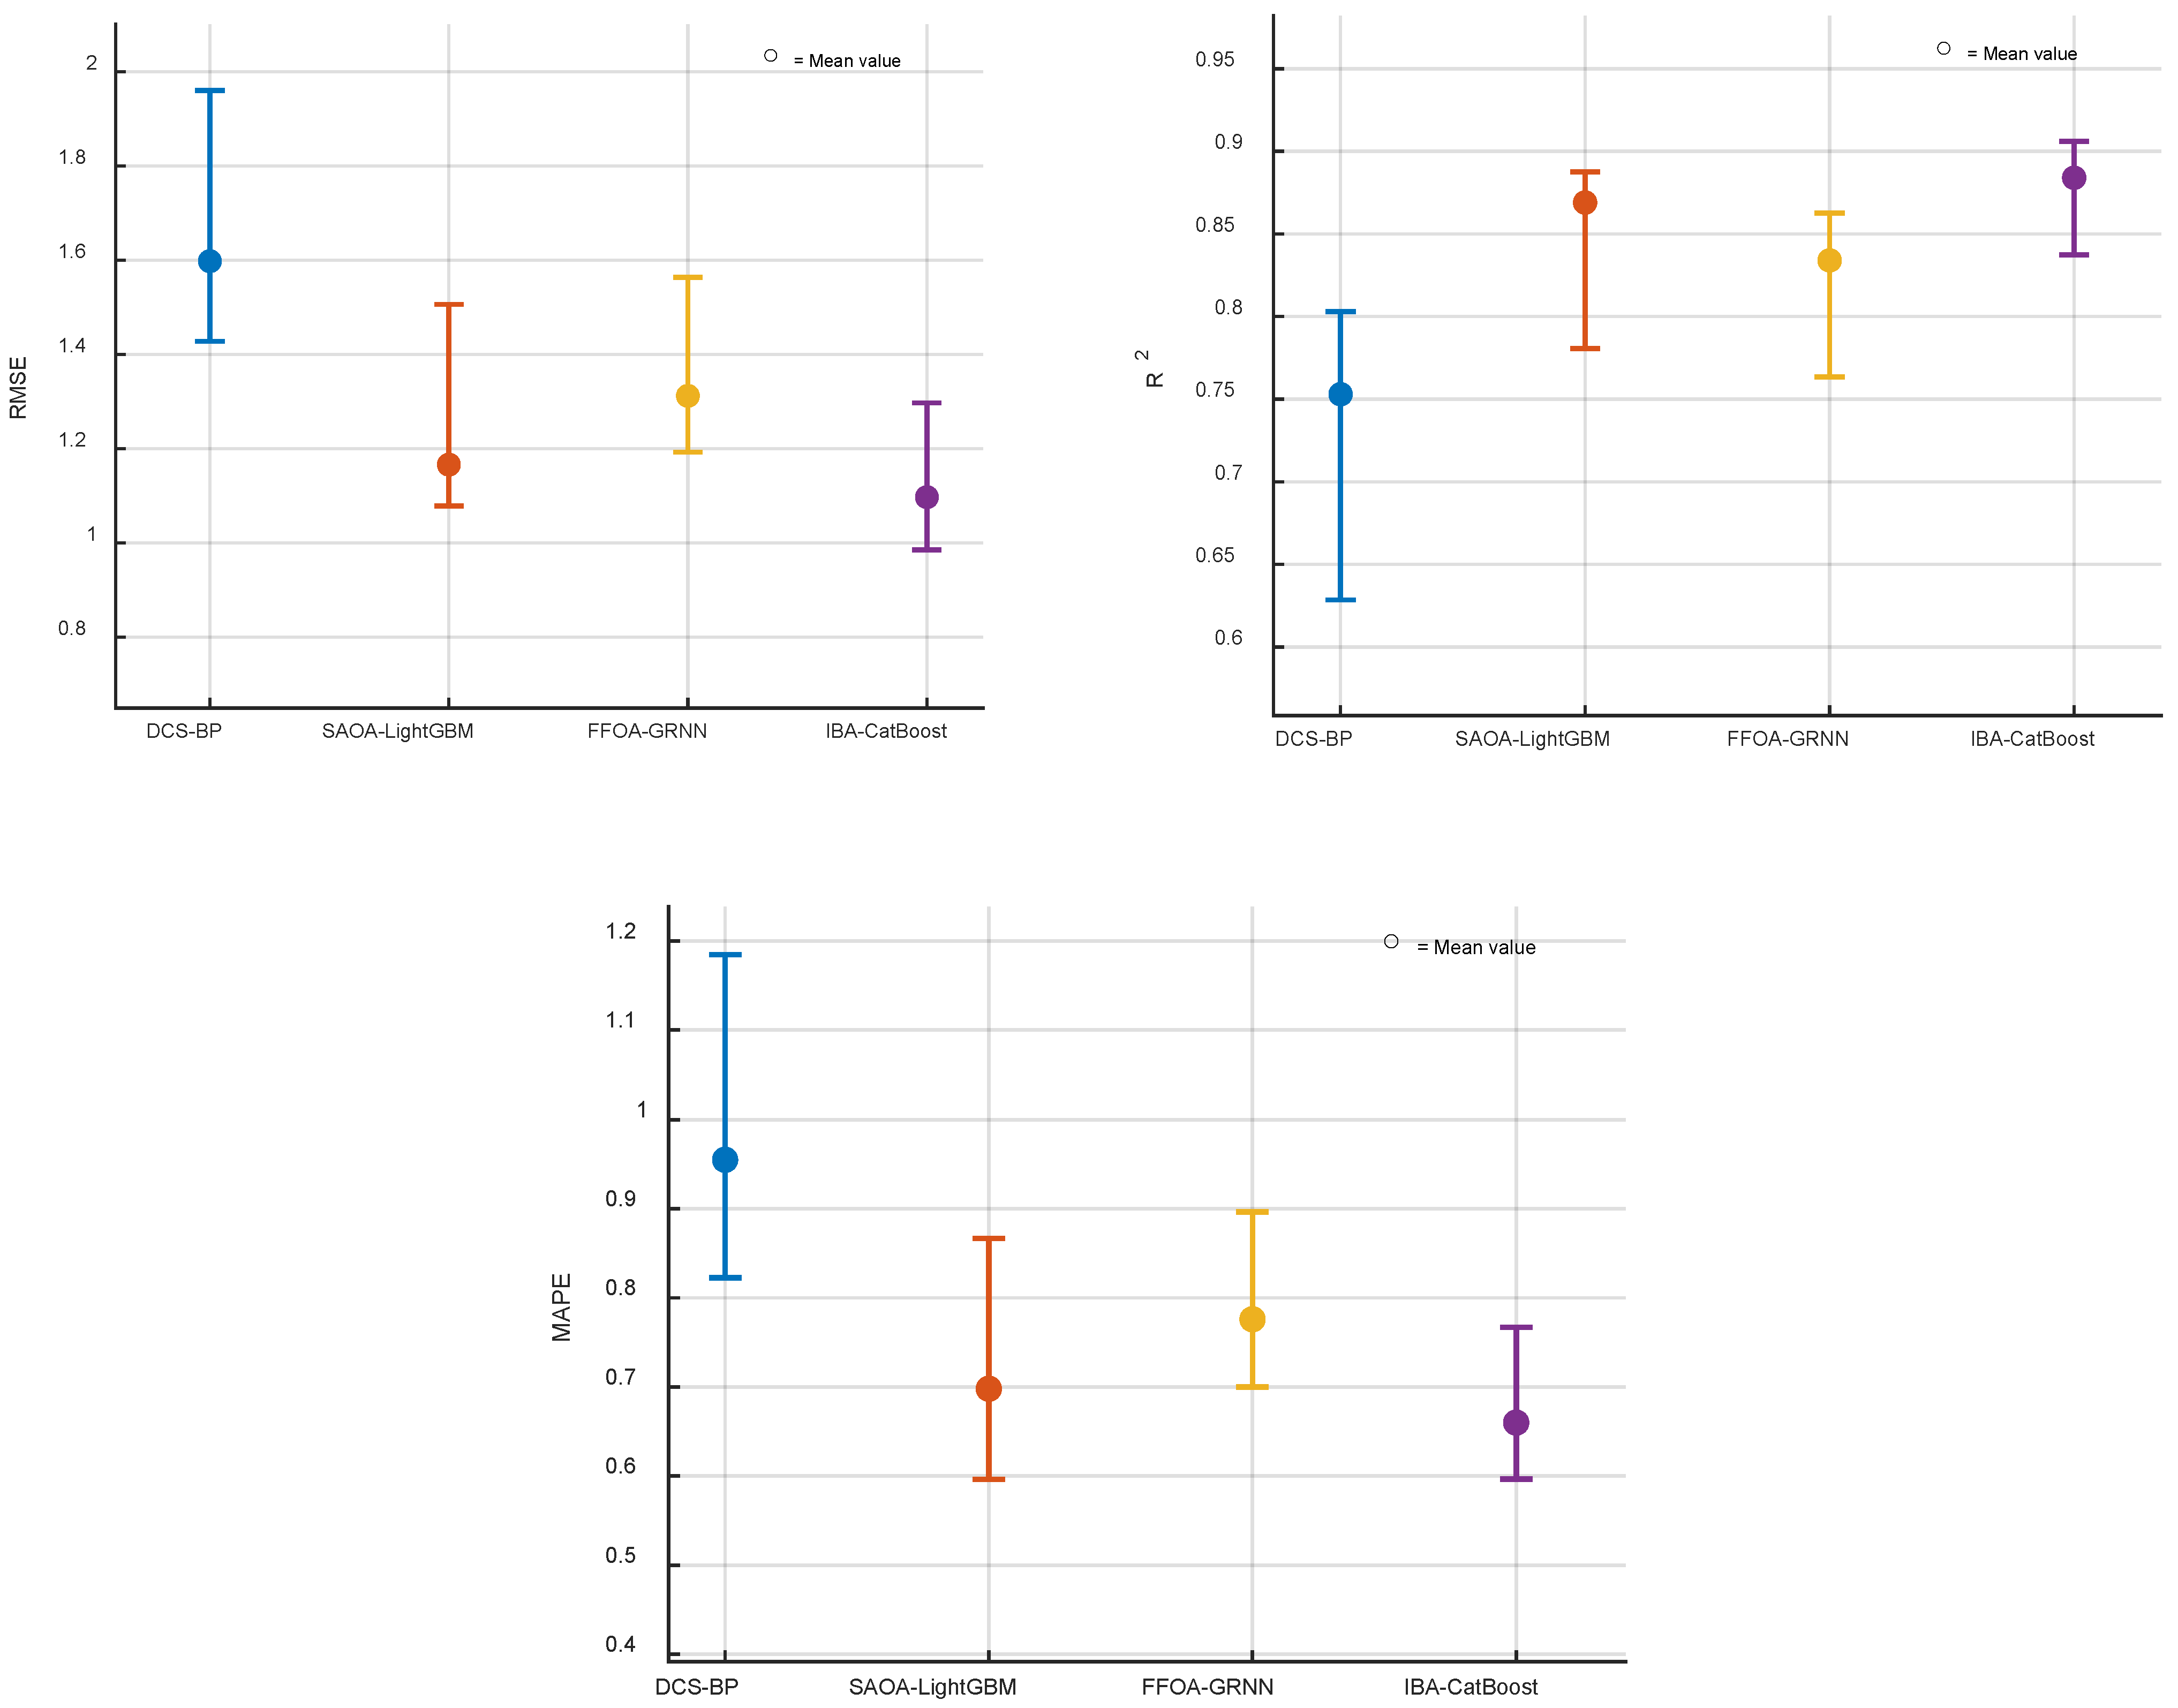
To evaluate the effectiveness of IBA-CatBoost, we conduct a comparative analysis with SAOA-LightGBM [4], FFOA-GRNN [35], and DCS-BP [22] based on the case study presented in Section 4. The evaluation employs three key metrics: RMSE, R2, and MAPE. All algorithms are configured according to their respective literature recommendations. For each experimental run, the training and test sets are randomly partitioned. Ten independent repeated trials are conducted, with results averaged to mitigate random variability and ensure reliability. The comprehensive comparison is presented in Table 4, while Figure 8 illustrates the statistical outcomes.
Table 4.
Performance metrics comparison of IBA-CatBoost with other advanced algorithms.
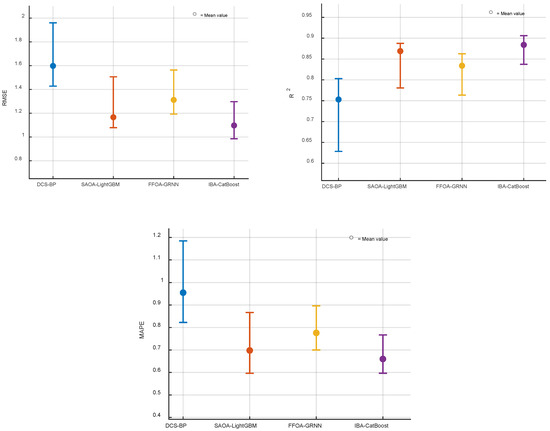
Figure 8.
Performance comparison of IBA-CatBoost with other advanced algorithms.
The experimental results demonstrate IBA-CatBoost’s superior performance across all evaluation metrics. In terms of prediction accuracy, IBA-CatBoost achieves an RMSE of 1.097, representing a 5.9% improvement over the second-best SAOA-LightGBM and a substantial 31.4% enhancement compared to DCS-BP. Regarding model fitting capability, the algorithm attains an R2 value of 0.884, outperforming SAOA-LightGBM by 1.7%, FFOA-GRNN by 6.0%, and DCS-BP by 17.4%. Notably, in the MAPE metric, IBA-CatBoost achieves a value of 0.660, reducing errors by 5.4% compared to SAOA-LightGBM, 15.0% compared to FFOA-GRNN, and 30.9% compared to DCS-BP, fully demonstrating its advantage in relative error control. The experimental results fully validate the superiority and reliability of IBA-CatBoost in fault warning tasks.
5.2. Ablation Experiment
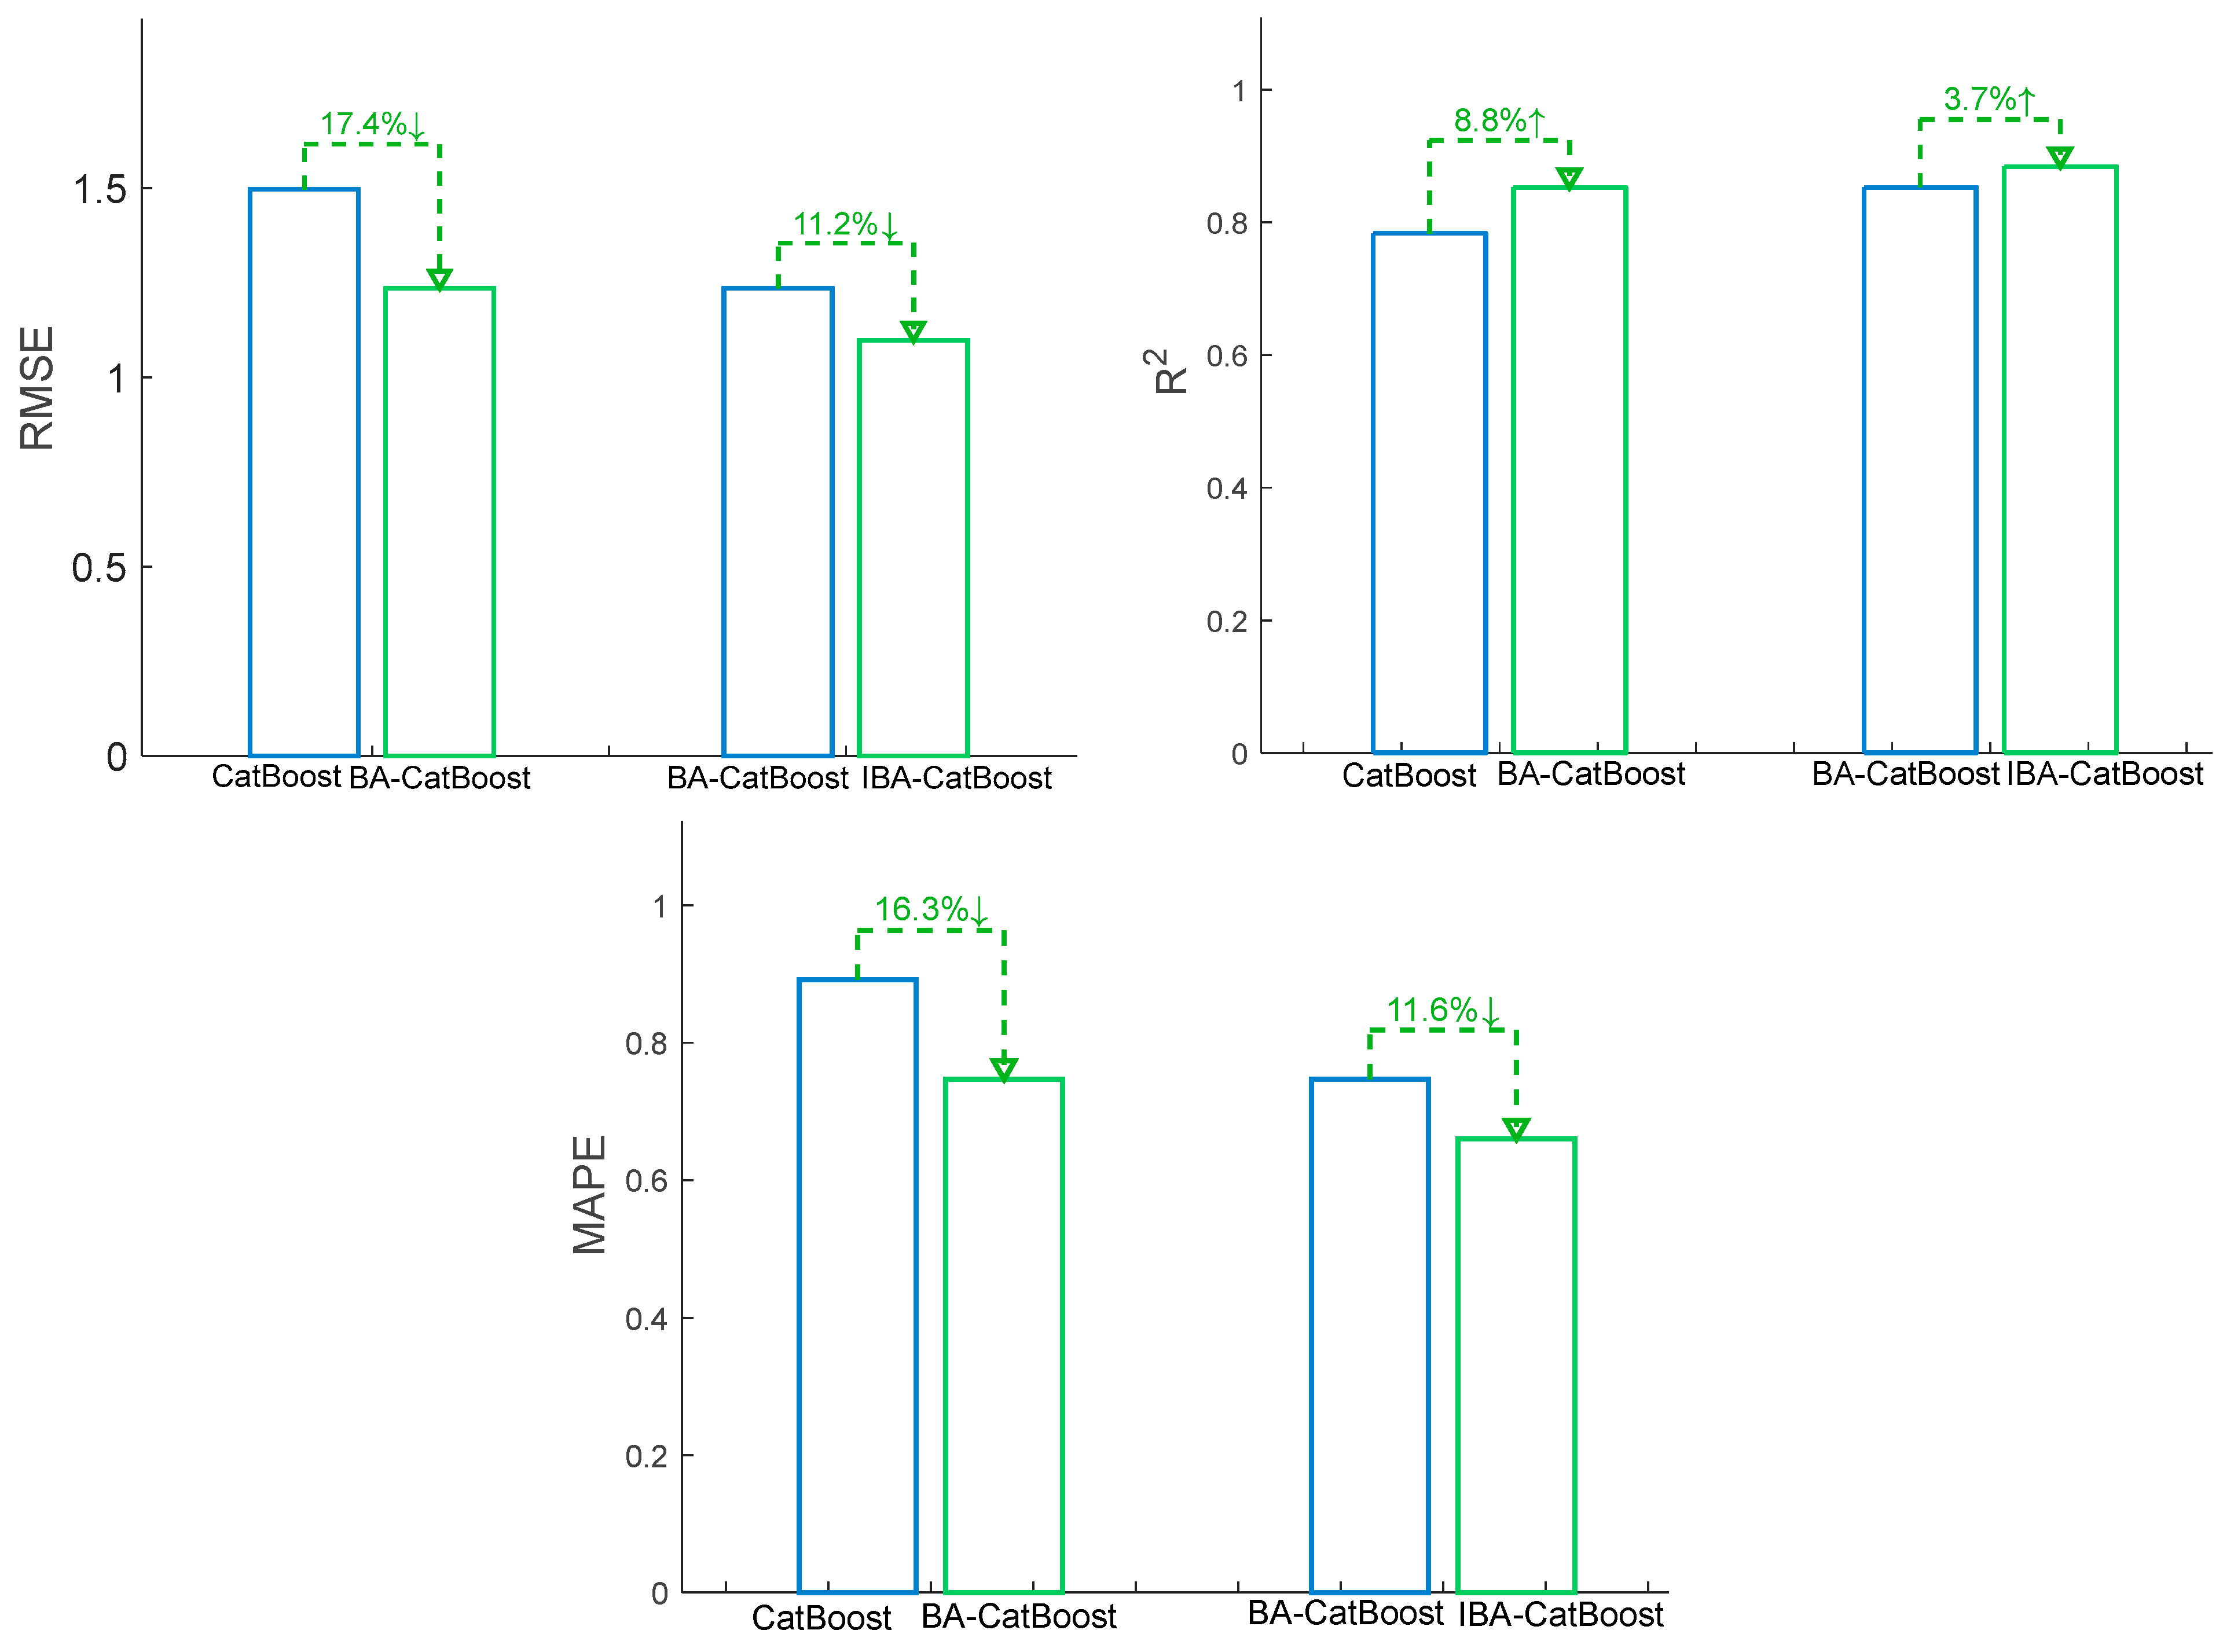
To systematically evaluate the optimization effect of the IBA on the CatBoost model, we conduct a comprehensive comparative analysis among three algorithmic variants: (1) the baseline CatBoost, (2) BA-CatBoost, and (3) IBA-CatBoost. Each algorithm configuration undergoes ten independent runs to ensure statistical reliability, with performance metrics calculated as mean values. The detailed comparative results are presented in Table 5 and visualized in Figure 9.
Table 5.
Ablation study results.
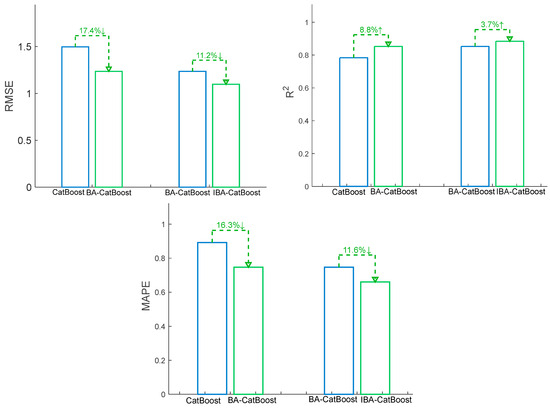
Figure 9.
Ablation study comparison.
The results show that BA-CatBoost significantly reduces prediction error and relative error compared to CatBoost, with RMSE decreasing from 1.496 to 1.235, MAPE decreasing from 0.892 to 0.747, and R2 increasing from 0.784 to 0.853, indicating that BA-CatBoost can better fit the data. On this basis, IBA-CatBoost further improves model performance, reducing RMSE to 1.097, MAPE to 0.660, and increasing R2 to 0.884, proving that the introduction of IBA significantly enhances prediction accuracy. Overall, these results fully demonstrate that the improvement strategies in IBA are effective. Additionally, by applying IBA to optimize CatBoost’s hyperparameters, its performance is significantly improved.
6. Conclusions and Future Work
This study proposes an intelligent fault warning method that integrates IBA, CatBoost, and KDE. First, by introducing a Latin hypercube sampling initialization strategy, a multi-disturbance neighborhood search mechanism, and a dynamic scout bee quantity adjustment strategy, the IBA significantly improves the performance of the BA. Subsequently, the IBA optimizes hyperparameters for the CatBoost model, effectively overcoming local optimization problems in the parameter tuning process. Meanwhile, KDE analyzes the distribution of prediction residuals and establishes warning thresholds based on data characteristics.
In actual tests on a mineral oil system in a gas compressor station, this method performs excellently, accurately warning of equipment faults 2 h in advance. Comparative experiments show that the proposed method’s key performance metrics outperform those of existing advanced algorithms. Furthermore, ablation experiments fully validate the effectiveness of each component, highlighting the method’s practical value and reliability in engineering applications.
However, this study presents several limitations: First, the current model primarily focuses on fault warning for a single equipment type, and its generalization capability for different industrial equipment requires further verification. Second, the fault warning threshold relies on the empirical 3σ criterion and lacks a more refined adaptive adjustment mechanism. Third, although inherent data imperfections are addressed through preprocessing, a systematic evaluation of the model’s robustness under varying levels of artificial noise and missing data is not conducted. Future research will therefore focus on extending this work in several key areas: (1) It will investigate online adaptive optimization algorithms to enable dynamic parameter adjustments for changing equipment states, potentially enhancing adaptability across different equipment types or aging processes. (2) It will develop a more intelligent adaptive threshold mechanism to improve the warning system’s robustness and accuracy beyond the empirical 3σ criterion. (3) It will validate the proposed IBA-CatBoost approach using more diverse and publicly available benchmark datasets to comprehensively assess its generalization capability. (4) It will conduct comprehensive and rigorous robustness testing under varying levels of artificial noise and missing data to quantify the model’s resilience to data imperfections. These improvements would further enhance the method’s applicability and reliability in complex and varied industrial environments.
Author Contributions
Conceptualization, K.L.; data curation, K.L. and J.H.; formal analysis, G.W.; investigation, J.H.; resources, G.W.; visualization, G.W.; writing—original draft, K.L.; writing—review and editing, D.M. All authors have read and agreed to the published version of the manuscript.
Funding
The authors declare that no funds, grants, or other support were received during the preparation of this manuscript.
Data Availability Statement
The original contributions presented in the study are included in the article, further inquiries can be directed to the corresponding author.
Conflicts of Interest
Author Kuirong Liu and Guanlin Wang were employed by the Western Pipeline Co., Ltd of China Oil and Gas Pipeline Network Corporation. The remaining authors declare that the research was conducted in the absence of any commercial or financial relationships that could be construed as a potential conflict of interest.
References
- Aldrini, J.; Chihi, I.; Sidhom, L. Fault diagnosis and self-healing for smart manufacturing: A review. J. Intell. Manuf. 2024, 35, 2441–2473. [Google Scholar] [CrossRef]
- Neupane, D.; Kim, Y.; Seok, J.; Hong, J. CNN-based fault detection for smart manufacturing. Appl. Sci. 2021, 11, 11732. [Google Scholar] [CrossRef]
- Soori, M.; Arezoo, B.; Dastres, R. Digital twin for smart manufacturing, A review. Sustain. Manuf. Serv. Econ. 2023, 2, 100017. [Google Scholar] [CrossRef]
- Pimenov, D.Y.; da Silva, L.R.; Ercetin, A.; Der, O.; Mikolajczyk, T.; Giasin, K. State-of-the-art review of applications of image processing techniques for tool condition monitoring on conventional machining processes. Int. J. Adv. Manuf. Technol. 2024, 130, 57–85. [Google Scholar] [CrossRef]
- Basar, G.; Der, O. Multi-objective optimization of process parameters for laser cutting polyethylene using fuzzy AHP-based MCDM methods. Proc. Inst. Mech. Eng. Part E J. Process Mech. Eng. 2025, 09544089251319202. [Google Scholar] [CrossRef]
- Tian, J.; Zhang, X.; Zheng, S.; Liu, Z.; Zhan, C. Synergising an Advanced Optimisation Technique with Deep Learning: A Novel Method in Fault Warning Systems. Mathematics 2024, 12, 1301. [Google Scholar] [CrossRef]
- Li, S.; Jin, N.; Dogani, A.; Yang, Y.; Zhang, M.; Gu, X. Enhancing LightGBM for industrial fault warning: An innovative hybrid algorithm. Processes 2024, 12, 221. [Google Scholar] [CrossRef]
- Meng, Y.; Wu, X.; Oladejo, J.; Dong, X.; Zhang, Z.; Deng, J.; Yan, Y.; Zhao, H.; Lester, E.; Wu, T.; et al. Application of machine learning in industrial boilers: Fault detection, diagnosis, and prognosis. ChemBioEng Rev. 2021, 8, 535–544. [Google Scholar] [CrossRef]
- Tang, M.; Tao, Z.; Qiu, J.; Li, J.; Wang, M.; Wang, H.; Rao, C. Temperature rise of high-speed bearing in gearbox of 5 MW wind turbine based on Bayesian-LightGBM and improved PSO-SVM troubleshooting. Meas. Control. 2024, 00202940241280051. [Google Scholar] [CrossRef]
- Allal, Z.; Noura, H.N.; Vernier, F.; Salman, O.; Chahine, K. Wind turbine fault detection and identification using a two-tier machine learning framework. Intell. Syst. Appl. 2024, 22, 200372. [Google Scholar] [CrossRef]
- Elshaarawy, M.K. Metaheuristic-driven CatBoost model for accurate seepage loss prediction in lined canals. Multiscale Multidiscip. Model. Exp. Des. 2025, 8, 235. [Google Scholar] [CrossRef]
- Ogar, V.N.; Hussain, S.; Gamage, K.A. Transmission line fault classification of multi-dataset using catboost classifier. Signals 2022, 3, 468–482. [Google Scholar] [CrossRef]
- Hossain, R.; Timmer, D. Machine learning model optimization with hyper parameter tuning approach. Glob. J. Comput. Sci. Technol. D Neural Artif. Intell. 2021, 21, 31. [Google Scholar]
- Chen, S.; Ma, Y.; Ma, L. Fault early warning of pitch system of wind turbine based on GA-BP neural network model. In E3S Web of Conferences; EDP Sciences: Les Ulis, France, 2020; Volume 194, p. 03005. [Google Scholar]
- Zhang, Z.; Wang, S.; Wang, P.; Jiang, P.; Zhou, H. Research on Fault Early Warning of Wind Turbine Based on IPSO-DBN. Energies 2022, 15, 9072. [Google Scholar] [CrossRef]
- Alamri, N.M.H.; Packianather, M.; Bigot, S. Optimizing the parameters of long short-term memory networks using the bees algorithm. Appl. Sci. 2023, 13, 2536. [Google Scholar] [CrossRef]
- Kumar, A.; Kumar, S.; Gupta, N.; Theinnoi, N.; Pham, D.T. Bees Algorithm for hyperparameter search with deep learning to estimate the remaining useful life of ball bearings. In Intelligent Engineering Optimisation with the Bees Algorithm; Springer Nature: Cham, Switzerland, 2024; pp. 233–251. [Google Scholar]
- Zeybek, S.; Pham, D.T.; Koç, E.; Seçer, A. An improved bees algorithm for training deep recurrent networks for sentiment classification. Symmetry 2021, 13, 1347. [Google Scholar] [CrossRef]
- Hussein, W.A.; Sahran, S.; Sheikh Abdullah, S.N.H. The variants of the Bees Algorithm (BA): A survey. Artif. Intell. Rev. 2017, 47, 67–121. [Google Scholar] [CrossRef]
- Wolpert, D.H.; Macready, W.G. No free lunch theorems for optimization. IEEE Trans. Evol. Comput. 1997, 1, 67–82. [Google Scholar] [CrossRef]
- Gao, D.; Wang, Y.; Zheng, X.; Yang, Q. A fault warning method for electric vehicle charging process based on adaptive deep belief network. World Electr. Veh. J. 2021, 12, 265. [Google Scholar] [CrossRef]
- Wang, Y.; Sun, W.; Liu, H.; Wang, S.; Zhou, Q. Study on Gearbox Fault Warning Based on the Improved M-IALO-GRU Model. Appl. Sci. 2025, 15, 3175. [Google Scholar] [CrossRef]
- Su, Y.; Gan, H.; Ji, Z. Research on multi-parameter fault early warning for marine diesel engine based on PCA-CNN-BiLSTM. J. Mar. Sci. Eng. 2024, 12, 965. [Google Scholar] [CrossRef]
- Tan, Y.; Zhan, C.; Pi, Y.; Zhang, C.; Song, J.; Chen, Y.; Golmohammadi, A.M. A hybrid algorithm based on social engineering and artificial neural network for fault warning detection in hydraulic turbines. Mathematics 2023, 11, 2274. [Google Scholar] [CrossRef]
- Yang, Y.; Li, Y.; Zhang, H. Pipeline safety early warning method for distributed signal using bilinear CNN and LightGBM. In Proceedings of the ICASSP 2021-2021 IEEE International Conference on Acoustics, Speech and Signal Processing (ICASSP), Toronto, ON, Canada, 6–11 June 2021; IEEE: Piscataway, NJ, USA, 2021; pp. 4110–4114. [Google Scholar]
- Liu, J.; Zhan, C.; Wang, H.; Zhang, X.; Liang, X.; Zheng, S.; Meng, Z.; Zhou, G. Developing a hybrid algorithm based on an equilibrium optimizer and an improved backpropagation neural network for fault warning. Processes 2023, 11, 1813. [Google Scholar] [CrossRef]
- Zhang, W.; Han, G.; Wang, J.; Liu, Y. A BP neural network prediction model based on dynamic cuckoo search optimization algorithm for industrial equipment fault prediction. IEEE Access 2019, 7, 11736–11746. [Google Scholar] [CrossRef]
- Pi, Y.; Tan, Y.; Golmohammadi, A.M.; Guo, Y.; Xiao, Y.; Chen, Y. A fault warning approach using an enhanced sand cat swarm optimization algorithm and a generalized neural network. Processes 2023, 11, 2543. [Google Scholar] [CrossRef]
- Cheng, M.; Zhang, Q.; Cao, Y. An Early Warning Model for Turbine Intermediate-Stage Flux Failure Based on an Improved HEOA Algorithm Optimizing DMSE-GRU Model. Energies 2024, 17, 3629. [Google Scholar] [CrossRef]
- Ji, K.; Dogani, A.; Jin, N.; Zhang, X. Integrating improved Coati Optimization Algorithm and bidirectional long short-term memory network for advanced fault warning in industrial systems. Processes 2024, 12, 479. [Google Scholar] [CrossRef]
- Pham, D.T.; Ghanbarzadeh, A.; Koç, E.; Otri, S.; Rahim, S.; Zaidi, M. The bees algorithm—A novel tool for complex optimisation problems. In Intelligent Production Machines and Systems; Elsevier Science Ltd.: Amsterdam, The Netherlands, 2006; pp. 454–459. [Google Scholar]
- Hodson, T.O. Root mean square error (RMSE) or mean absolute error (MAE): When to use them or not. Geosci. Model Dev. Discuss. 2022, 15, 5481–5487. [Google Scholar] [CrossRef]
- Ali Abd Al-Hameed, K. Spearman’s correlation coefficient in statistical analysis. Int. J. Nonlinear Anal. Appl. 2022, 13, 3249–3255. [Google Scholar]
- Cao, S.; Diao, Y.; Wang, J.; Liu, Y.; Raimondi, A.; Wang, J. KDE-based rainfall event separation and characterization. Water 2023, 15, 580. [Google Scholar] [CrossRef]
- Lin, J.; Sheng, G.; Yan, Y.; Dai, J.; Jiang, X. Prediction of dissolved gas concentrations in transformer oil based on the KPCA-FFOA-GRNN model. Energies 2018, 11, 225. [Google Scholar] [CrossRef]


Disclaimer/Publisher’s Note: The statements, opinions and data contained in all publications are solely those of the individual author(s) and contributor(s) and not of MDPI and/or the editor(s). MDPI and/or the editor(s) disclaim responsibility for any injury to people or property resulting from any ideas, methods, instructions or products referred to in the content. |
© 2025 by the authors. Licensee MDPI, Basel, Switzerland. This article is an open access article distributed under the terms and conditions of the Creative Commons Attribution (CC BY) license (https://creativecommons.org/licenses/by/4.0/).