Abstract
This study presents the fabrication of a samarium-doped Ti/Sb-SnO2/PbO2 electrode and investigates its applications in polluted water treatment and energy conversion. Physicochemical properties were characterized by scanning electron microscopy with energy-dispersive X-ray spectroscopy, X-ray powder diffraction analysis, and Raman spectroscopy. The Ti/Sb-SnO2/Sm-PbO2 electrode showed 2.5 times higher oxygen evolution potential activity than the Ti/Sb-SnO2/PbO2 electrode. Density Functional Theory was used to conduct first-principles calculations, and the obtained results indicated that Sm doping enhances the production of reactive oxygen species. The application of the Ti/Sb-SnO2/Sm-PbO2 electrode in carbendazim (CBZ) removal was investigated, since CBZ is a fungicide whose presence in the environment, including food, water, and soil, poses a threat. After 60 min of the treatment under optimized working parameters, the degradation rate of CBZ reached 94.2% in the presence of 7.2 g/L Na2SO4 with an applied current density of 10 mA/cm2 in an acidic medium (pH 4). Of the four investigated parameters, the current density had the most significant influence on the degradation process. At the same time, the initial pH value of the solution was shown to have the least impact on degradation efficiency. These results imply a potential use of the proposed treatment for CBZ removal from wastewater.
1. Introduction
Carbendazim (CBZ) is a systemic fungicide that is widely used in agriculture to control fungal diseases in crops. In addition to this use, CBZ is applicable in preserving tennis and golf courses by discouraging the accumulation of worms. CBZ also acts as a biocide, such as acting as a preservative in building materials in the construction industry [1]. CBZ disrupts the polymerization of microtubules in cells, and thus prevents their assembly. Therefore, impaired segregation of chromosomes occurs during cell division [2]. This mode of action has been observed not only in fungal cells, but also in mammalian cells, which is of great concern for human health. In humans, CBZ interferes with the formation of microtubules by acting on human ovarian cells. This leads to increased estrogen production, increasing the activity of the enzyme involved in its synthesis [1]. The effects of CBZ on other species have also been observed. Due to its frequent use, the negative effects of CBZ manifest in humans, aquatic organisms, invertebrates, and soil microbes [2]. CBZ exerts its toxicity by promoting the generation of reactive oxygen species (ROS), while simultaneously inhibiting the activity of antioxidant enzymes. As a result of the action of this pesticide in organisms of the above-mentioned species, various disorders and diseases may occur, such as cancer, embryotoxicity, apoptosis, disruption of hematological functions, teratogenicity, hepatocellular dysfunction, endocrine-disrupting effects, mitotic spindle abnormalities, infertility, and mutagenic effects [2]. Exposure to this fungicide has been associated with DNA damage in Daphnia magna and changes in locomotor activity in zebrafish [1].
Nutrition is considered the primary source of exposure to CBZ in humans, since CBZ is frequently found in fruits and vegetables. Due to concerns about the widespread use of CBZ and its negative effects on humans, Wang et al. (2020) reviewed the extraction and detection methods of this fungicide in various types of food, such as fruits, vegetables, jam, baby food, wine, honey, fish, and oil [3].
However, wastewater and surface water are considered some of the most common sources of this pesticide, given its application and the potential for migration from its source, especially during rainy periods [1]. The half-life of CBZ can range from 3 days to 12 months, depending on the environmental conditions. While the half-life of CBZ is about a hundred days in soil and water, it is only several days in plants [4]. Several countries (Spain, Serbia, Greece, Switzerland, Chile, and Germany) have expressed concern about detecting CBZ in surface water and wastewater, due to the risk of adverse environmental and human health effects. Merel and collaborators observed a correlation between the presence of CBZ and pharmaceutical products, indicating the influence of household wastewater on the presence of CBZ in surface water. Another source of CBZ in household wastewater is considered to be materials such as textiles and paper, confirmed by the analysis of river samples near a paper production site [1].
Given its high toxicity, extensive use, and persistence in the environment, the maximum permitted limits of this fungicide are restricted in most countries. In contrast, in some countries, the use of CBZ is prohibited [3]. Due to its negative effect on human health, the maximum allowed concentrations according to the European regulation of CBZ have been reduced in recent years. Considering this, the maximum allowed concentration for most fruits and vegetables usually does not exceed 1 mg/kg. At the same time, only some species, such as okra (Abelmoschus esculentus), have a limit of 2 mg/kg [5]. In other countries, like the United States and Australia, CBZ is banned. However, it is still used in many countries, such as India and China [6].
In light of the facts stated above, optimizing the appropriate CBZ removal process is of great importance, considering that conventional methods are not the most effective choice [7,8,9,10]. Additionally, during the degradation of CBZ by biological processes, there is a possibility of forming degradation products, which, in most cases, are more toxic than CBZ itself [11]. Advanced oxidation processes (AOPs) have been studied, and anodic oxidation has proven to be the most common method of choice, due to its easy operation, high efficiency, and environmental compatibility [9,12,13,14,15]. In AOPs, highly reactive hydroxyl radicals are produced, which non-selectively react with most organic substances and successfully degrade them, despite their persistence [16]. The application of Fenton-based AOPs for the degradation of CBZ has also shown a high level of degradation of this pesticide. Photo-Fenton processes are more effective than the classic Fenton reagent (solar-irradiated and artificially irradiated). However, sludge formation with iron ions and other contaminants, as well as the energy consumption during this process, represent its disadvantages [17].
Considering the significant role of anode materials in electrochemical oxidation and their direct influence on the degradation rate, studies have examined different electrodes and their degradation efficiency. Electrodes whose properties have been evaluated in AOPs are Pt, boron-doped diamond electrode (BDD), PbO2, and tin dioxide [15,18,19]. PbO2 is the most suitable electrode for this process because of its low price, good electrical conductivity, and high oxygen evolution potential (OER). To improve the properties of PbO2 electrodes, it is possible to prepare the electrodes using different materials, such as using titanium as a matrix. Doping materials with different metals, metal oxides, and other structures, forming composites, and incorporating materials “one into another” significantly enhance the initial material’s properties—optical, magnetic, electrocatalytic, and photocatalytic [20,21,22,23,24]. Due to their poor catalyst activity and easy exfoliation, it is necessary to further improve the characteristics of PbO2 electrodes by modifying their active layer. This can be achieved by building an interlayer or doping the active layer with materials such as nanomaterials, transition metals, and rare earth metals. In recent years, rare earth metals have been used to enhance electrodes’ properties by increasing the production of hydroxyl radicals and the reaction active area [3,6,25]. The application of rare earth metals, such as samarium, has achieved very good results in improving the performance of various electrode materials, resulting in significant improvements in the applications of these materials in lithium-ion batteries, solar cells, oxygen evolution reactions, luminescent materials, and other applications [26,27,28,29,30,31].
The OER presents the charging process of metal–air batteries (MABs) and unitized regenerative fuel cells (URFCs) [32,33,34,35,36,37,38]. The performance of these green energy devices depends, in part, on the OER activity of the electrocatalyst. As benchmark OER electrocatalysts, IrO2 and RuO2 are characterized by poor OER stability, a high price, and scarcity, limiting their application. Because of this, it is important to find appropriate OER electrocatalysts with high activity, good stability, easy synthesis, and low prices [26,27,28,29,30,31,32].
The main goal of this work is to present an alternative method, with higher efficiency, for the purification of polluted wastewater, and to offer an alternative material for OER electrocatalysis, supported by a fundamental explanation of the mechanism of action of the material. This paper adopted anodic oxidation (AO) to treat an aqueous CBZ solution. Operational parameters were optimized, such as the initial pH, applied current density, concentration of supporting electrolytes, and initial pollutant concentration. High-performance liquid chromatography (HPLC) was used as an analytical technique to monitor the concentration of CBZ remaining in solution during the electrochemical oxidation. OER capabilities were examined, and the mechanism of the material’s operation was explained using Density Functional Theory.
2. Materials and Methods
The CBZ standard was procured in solid form from Sigma Aldrich (PESTANAL, analytical standards; Saint Louis, MO, USA), while anhydrous sodium sulfate was sourced from Lach:ner (Neratovice, Czech Republic). Sodium hydroxide and sulfuric acid, which were used to adjust the pH value, were also acquired from Sigma Aldrich (Saint Louis, MO, USA). All the solutions were prepared with deionized water. Methanol (HPLC-grade) was obtained from Sigma Aldrich (PESTANAL, analytical standards; Saint Louis, MO, USA), as well as lead (II) nitrate, antimony (III) chloride, tin (IV) oxide, samarium (III) nitrate, oxalic acid, and isopropyl alcohol are from Sigma Aldrich (PESTANAL, analytical standards; Saint Louis, MO, USA), used for the electrode preparation.
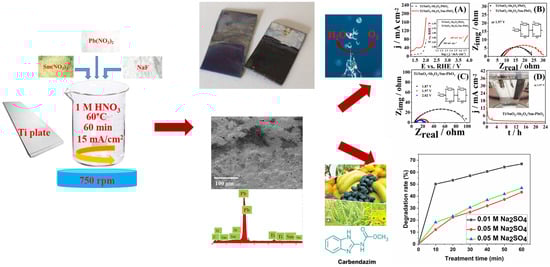
This study involved the use of Sm-PbO2-based electrodes for the decomposition of CBZ. These electrodes comprised a Ti substrate with an Sb-SnO2 intermediate layer and a PbO2 active layer, with Sm added to improve the characteristics of the electrode. A simplified anodization procedure was used to prepare these electrodes. For the preparation of titanium plates (W = 20 mm, L =40 mm, T = 1 mm), the altered procedure detailed by Duan and colleagues was used [39]. The plates were carefully cleaned through ultrasonic treatment, at room temperature, using acetone and deionized water for 10 min each. After the drying process, the plates underwent a two-hour boiling treatment in 15% oxalic acid, and were thoroughly washed using deionized water. During boiling, the plates were vertically positioned between two beakers containing the oxalic acid solution. The etching solution, needed to prepare the intermediate layer and ensure electrode stability, was prepared by adding 1 g of SbCl3 and 4.3 g of SnO2 to a mixture of i-PrOH (25 mL) and concentrated HCl (25 mL). The plates were immersed in the etching solution and underwent an initial drying process for 10 min at a temperature of 120 °C, followed by a baking stage that lasted for 10 min at 500 °C. The same procedure was carried out two more times, with a difference in the duration of the last baking stage (60 min instead of 10 min). Ultimately, the active layer was produced through the electrodeposition method, using a solution comprising 165.6 g/L of Pb(NO3)2, 33.6 g/L Sm(NO3)3, and 63 g/L HNO3. The 60 min-long process involved Ti plates with an Sb-SnO2 layer being immersed into this solution (30 mm x 20 mm area) at 60 °C, with a magnetic stirring set at 750 rpm, and a current density of 15 mA/cm2. The prepared electrodes were applied for the optimization of CBZ degradation without any additional alteration (Scheme 1).
Scheme 1.
Synthesis procedure of Ti/Sb-SnO2/Sm-PbO2 electrocatalyst and its applications.
The Raman spectra of constructed electrodes were obtained on a DXR Raman microscope (Thermo Scientific, Waltham, MA, USA), using a diode-pumped solid-state laser with an excitation wavelength of 532 nm. The samples were recorded using a laser power of 10.0 mW on the sample, an exposure time of 10 s, 10 exposures per spectrum, a grating with 900 lines/mm, and a 50 μm pinhole spectrograph aperture. The spectra of both electrodes were obtained as an average of 10 measurements from different spots on the sample.
The structure and phase composition of Ti/Sb-SnO2/PbO2 and Ti/Sb-SnO2/Sm-PbO2 were investigated by a Rigaku Optima IV powder diffractometer (Rigaku, Japan) in the range of 2θ angles from 5° to 70°, at a survey rate of 2° min−1. The radiation from a CuKα copper tube (λ = 1.541 Å), at an accelerating voltage of 40 kV, was used for this investigation. A scanning electron microscope Phenom™ ProX Desktop SEM (ThermoFisher Scientific™, Waltham, MA, USA) was used for scanning electron microscopy with an integrated energy-dispersive X-ray spectroscopy detector for the examination of the surface morphology and atomic composition of the Ti/Sb-SnO2/PbO2 and Ti/-SbSnO2/Sm-PbO2 samples.
X-ray photoelectron spectroscopy analysis was performed using SPECS Systems, with an XP50M X-ray source for a Focus 500 X-ray monochromator and a PHOIBOS 100/150 analyzer, using an AlKα (1486.74 eV) anode at 12.5 kV and 16 mA as a source. Survey spectra (1000–0 eV binding energy) were recorded with a constant pass energy of 40 eV, a step size 0.5 eV, and a dwell time of 0.2 s in the FAT mode. Detailed spectra of Pb 4f, O 1s, and Sm 3d peaks were recorded using a constant pass energy of 20 eV, a step size of 0.1 eV, and a dwell time of 2 s in the FAT mode. During measurements, the pressure in the chamber was 9 × 10⁻⁹ mbar.
OER investigation was performed with an Ivium V01107 Potentiostat/Galvanostat, using a glass cell with a volume of 40 cm3, with a saturated calomel electrode (SCE) as a reference and a graphite rod as the counter-electrode. All potentials related to the OER investigation are presented relative to the reversible hydrogen electrode (RHE) by the following equation: ERHE = ESCE + 0.242 V + 0.059 · pH solution. Linear sweep voltammetry (LSV) measurements were recorded in 1 M KOH, in the potential range from 1.2 to 2.05 V, at a scan rate of 20 mV s−1. Electrochemical impedance spectroscopy (EIS) was performed at different potentials in the frequency range of 100 kHz to 0.1 Hz, with a 5 mV amplitude. Finally, the stability of the electrode was recorded by chronoamperometry at the ARBIN instrument at 1.97 V for 24 h.
The concentration of lead in the test solution obtained after the stability test was measured using inductively coupled plasma optical emission spectrometry (ICP-OES) on a Thermo Scientific iCAP 6500 Duo ICP instrument (Thermo Fisher Scientific, Cambridge, UK). Calibration standard solutions were prepared from three certified standards. Quantification was performed in triplicate on emission lines with minimal spectral interference. The relative standard deviation was RSD < 3%, with calibration curve correlation coefficients > 0.99.
The first-principles calculations presented herein were derived within the Density Functional Theory [40,41] framework. All relevant properties of the (solid-state) materials used in this study were calculated using the Amsterdam Density Functional (ADF) [42] periodic DFT code, BAND [43,44] (Version 2024.1). The computational analyses of all investigated bulk materials were executed utilizing the PBE sol [45,46] density functional approximation in conjunction with the polarized triple-ζ (TZP) [47] basis set, with a small frozen core and good numerical quality. All other calculations were carried out using the dispersion-corrected PBE-D [35] functional. During all conducted calculations, relativistic effects were included for both core and valence electrons through the spin–orbit formalism [48]. All calculations of periodic Energy Decomposition Analysis (pEDA) [42,49] combined with natural orbitals for chemical valency (NOCV) [50,51] were performed with k-space sampling restricted to the Γ point. During the modeling of the adsorption process, the surface of the material and H2O molecules were considered and modeled as interactive fragments.
For electrochemical AO performance, an initial aqueous solution of CBZ was made, aided by an ultrasonic bath and a few drops of concentrated sulfuric acid. Since the experiment aimed to optimize the AO operation parameters, different CBZ aqueous solutions were prepared with varying pH values and concentrations of analyte and electrolyte at different current densities. To test the effect of pH value on the efficiency of degradation, the pH value of the solution was set to 2, 4, 6, and 8. After that, the influence of currents at 10, 20, and 40 m A cm−2 was examined. This was followed by preparing solutions with different supporting electrolyte concentrations (0.01, 0.05, and 0.1 M Na2SO4). Finally, in the last phase of this study, different initial amounts of CBZ were considered (25, 50, 100, and 190 mg L−1). The counter-electrode was titanium, while the working electrode was Ti/Sb-SnO2/Sm-PbO2; the electrodes were kept at a constant distance (2 cm) using a holder. A PeakTech P6070 Digital Laboratory Power Supply (PeakTech, Germany) was used as the power source. For mixing 50 mL of the prepared solutions, a magnetic stirrer was used. Each solution underwent a one-hour-long electrolysis process, and every ten minutes, 1 mL of the solution was sampled for CBZ concentration monitoring.
Previously prepared samples were analyzed using high-performance liquid chromatography with a diode-array detector (HPLC-DAD, DionexUltiMate 3000, Thermo Fisher). Before HPLC-DAD analysis, the samples were filtered through a 0,45 µm syringe filter (PTFE). Chromatographic separation was performed on a Hypersil Gold aQ (Thermo Fisher Scientific) analytical column, with a 4.6 × 150 mm × 3.0 µm particle size. The flow rate was 0.4 mL min−1, and the injection volume was 5 µL. Mobile phase (A) consisted of methanol, while water was used as mobile phase (B), with a ratio of 45:55 (v/v). The column temperature was 25 °C, while the detection wavelength was 280 nm. The retention time of the analyzed analyte was around 5.4 min. To determine the concentration of CBZ in the samples, a calibration curve was prepared by measuring several concentrations and creating a linear line (Scheme 1).
3. Results
3.1. Characterization of Ti/Sb-SnO2/Sm-PbO2 Electrocatalyst
The features visible at 613, 512, and 395 cm−1 in the Raman spectra of Ti/Sb-SnO2/PbO2 and Ti/Sb-SnO2/Sm-PbO2 (Figure 1A) are indicative of β-PbO2 [52]. In addition to this, the Raman spectrum of Ti/Sb-SnO2/Sm-PbO2 contains a band at 138 cm−1 related to the anatase phase of TiO2 [53].
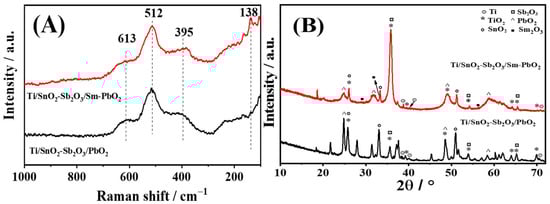
Figure 1.
Raman spectra (A) and XRD patterns of Ti/Sb-SnO2/PbO2 and Ti/Sb-SnO2/Sm-PbO2 samples (B).
Figure 1B presents the XRD analysis of the Ti/Sb-SnO2/PbO2 and Ti/Sb-SnO2/Sm-PbO2 samples. The presence of Ti and anatase TiO2 in both synthesized samples is confirmed by the diffraction peaks obtained at 38.77°, 40.19°, and 70.60°, corresponding to reflections from the (002), (101), and (103) Ti planes [54], and the peaks obtained at 26.00°, 38.86°, 48.99°, 54.31°, 64.14°, and 69.99°, which correspond to reflections from the (101), (004), (200), (105), (118), and (116) anatase TiO2 planes (JCPDS 84-1286) [54]. Diffraction peaks of both samples are found at 24.86°, 31.79°, 49.08°, and 58.77°, indicating reflections from the (110), (101), (211), and (310) β-PbO2 planes [54,55,56,57,58,59,60]. Reflections from the (110), (101), and (211) SnO2 planes are confirmed by the presence of diffraction peaks at 26.01°, 33.32°, and 51.24°, respectively, for both samples [59,60]. Also, the obtained diffraction peaks of both the Ti/Sb-SnO2/PbO2 and Ti/Sb-SnO2/Sm-PbO2 samples at 35.85° and 54.23° correspond to reflections from the Sb2O3 (331) and (622) planes, which were indexed to the standard value of Sb2O3 (ASTM D2350-90) [59]. Low-intensity peaks were found at 28.87°, 33.09°, and 56.27°, indicating reflections from the (222), (400), and (622) Sm2O3 planes [58,61,62]. The low intensity of these peaks could be a consequence of the low amount of Sm2O3 in the Ti/Sb-SnO2/Sm-PbO2 sample.
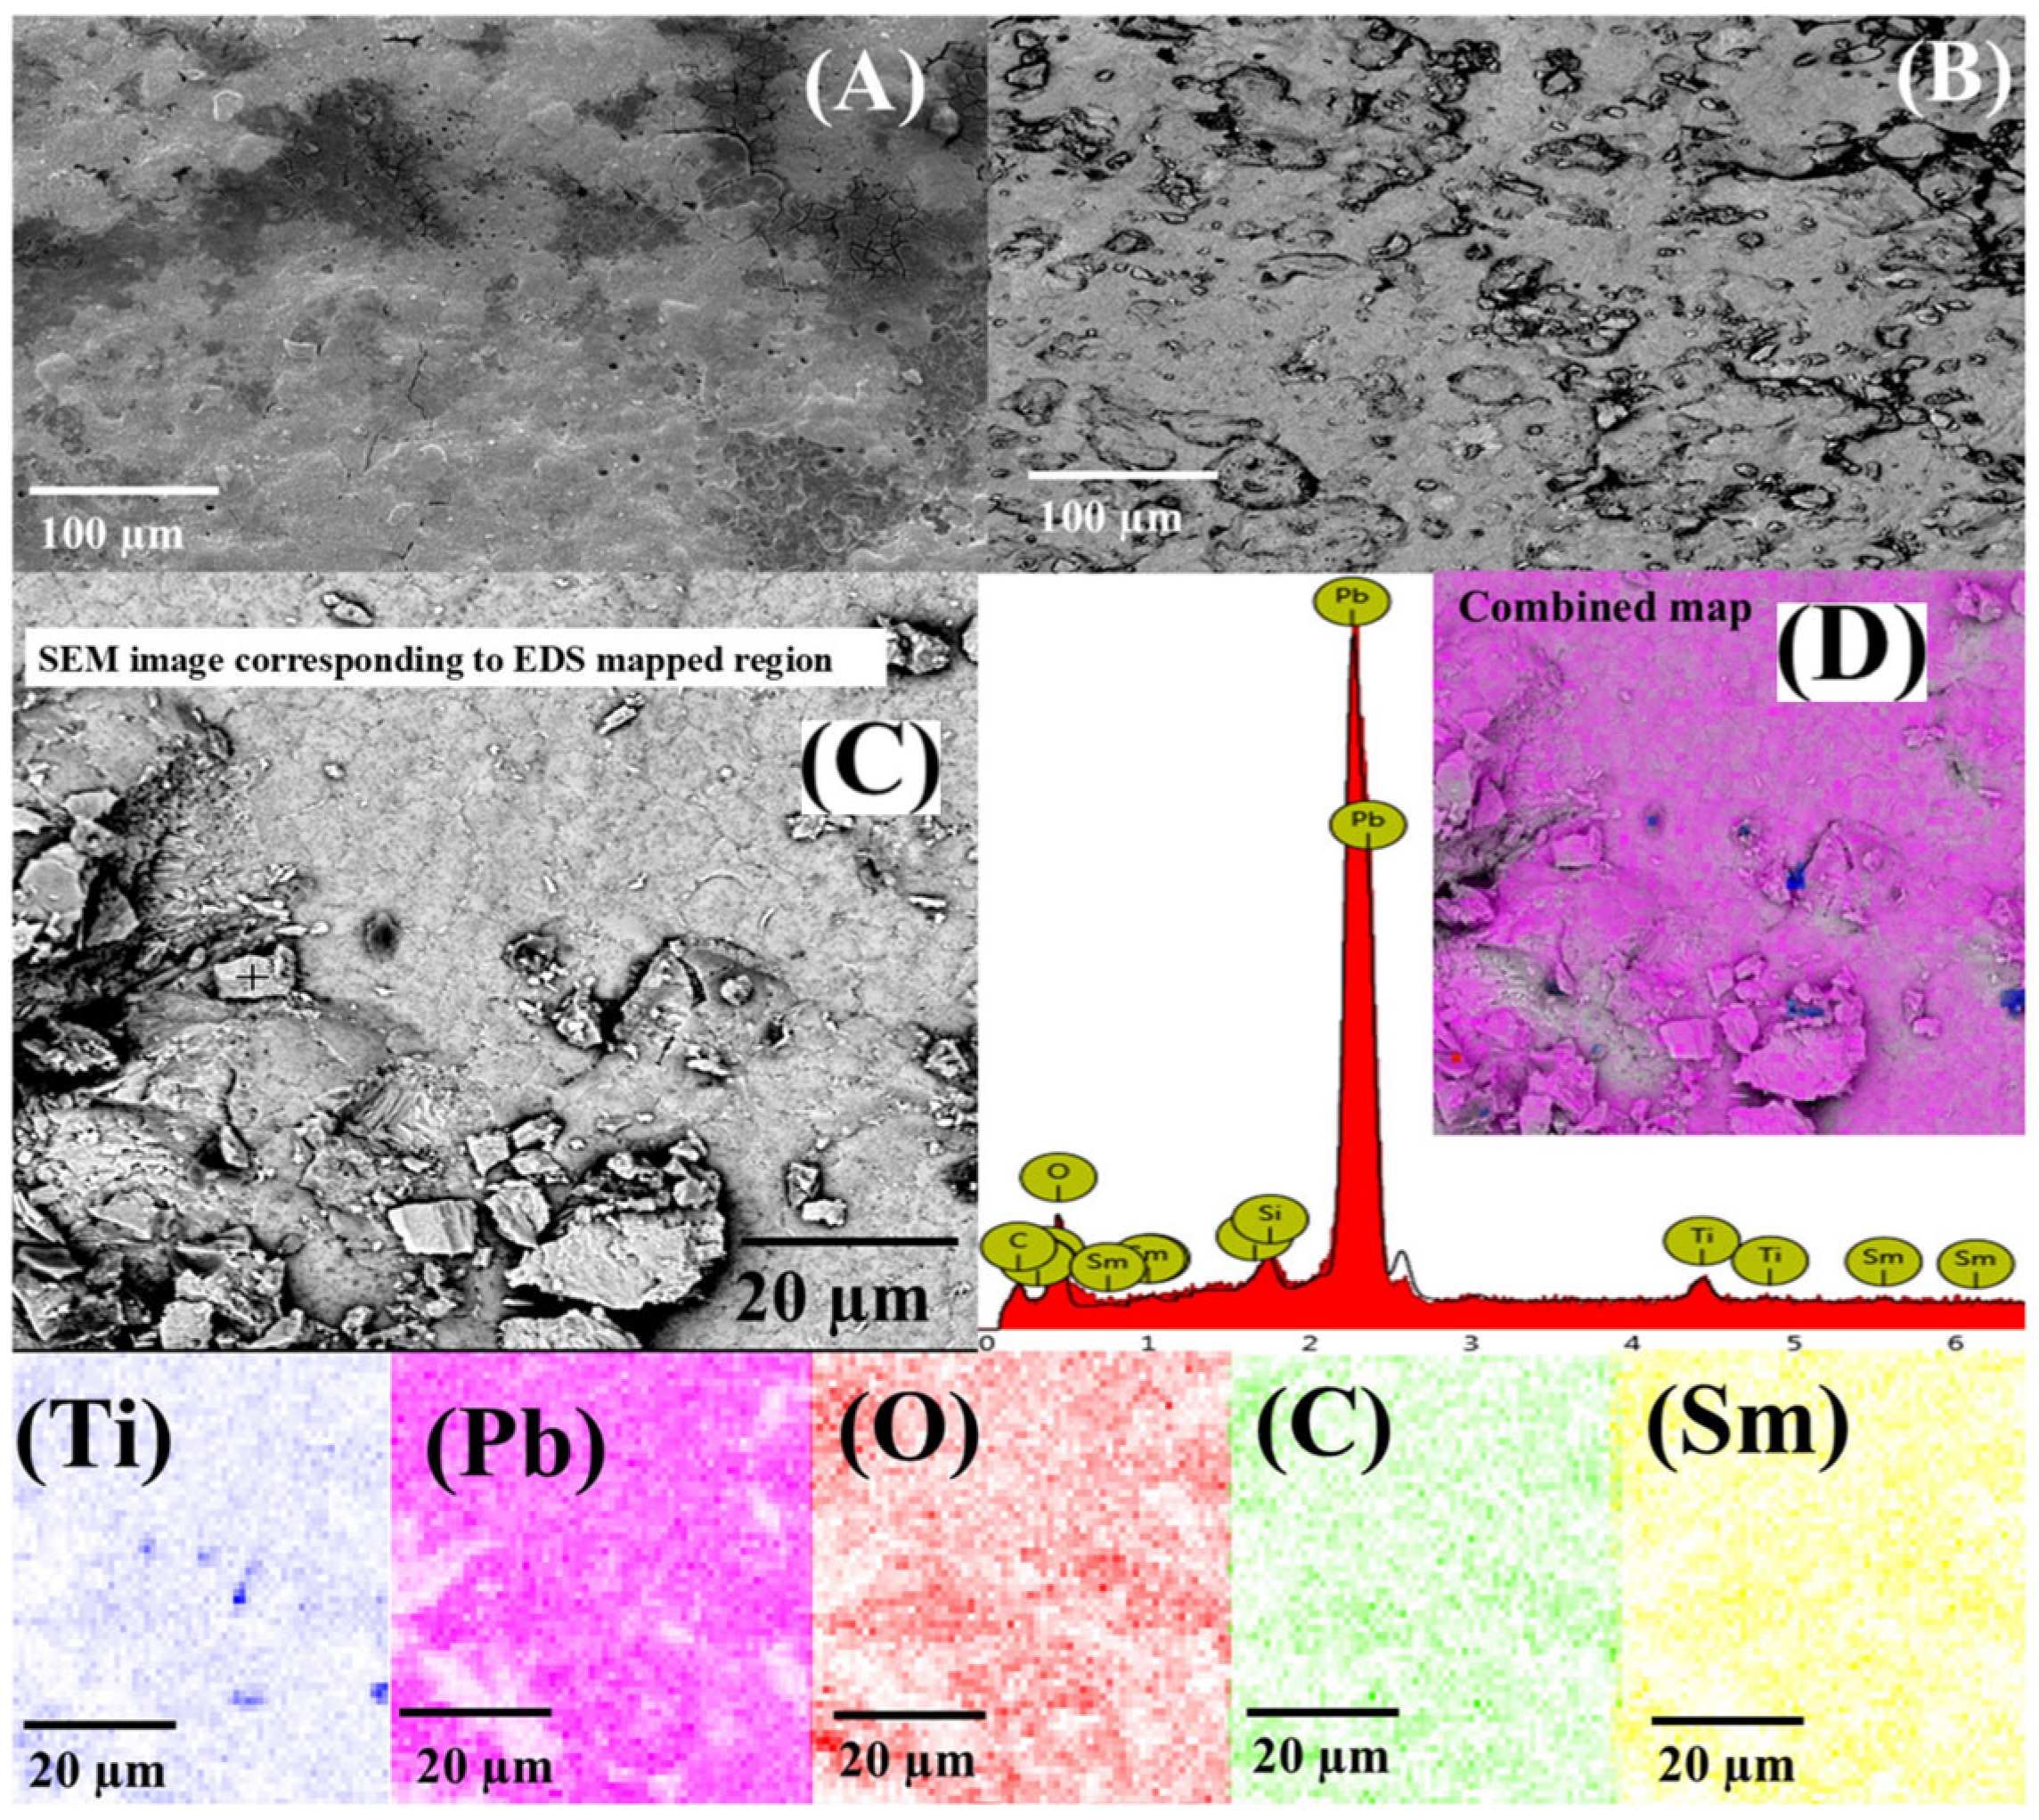
SEM images of Ti/Sb-SnO2/PbO2 and Ti/Sb-SnO2/Sm-PbO2 are presented in Figure 2A,B while the Figure 2B inset presents an SEM image of Ti/Sb-SnO2/Sm-PbO2 obtained at higher magnification, for better presentation and understanding of the surface morphology of the sample. Namely, the morphology of the surface of Ti/Sb-SnO2/Sm-PbO2 is somewhat different compared with the morphology of the Ti/Sb-SnO2/PbO2 sample, which is almost uniform. Cracks (dark lines) can be noticed for both samples, with a higher number of cracks obtained for Ti/Sb-SnO2/Sm-PbO2. This result could be caused by the formation of agglomerates of different sizes, which is well presented in Figure 2B,C. Table 1 shows the EDS analysis of the Ti/Sb-SnO2/Sm-PbO2 sample, where the presence of Pb, O, C, Sm, Ti, and Si is confirmed by their atomic and weight concentrations, with appropriate standard deviations. The highest atomic and weight concentrations were obtained for Pb and O, followed by C, Sm, Ti, and Si. The presented mapping images (Figure 2) of Pb, O, C, and Ti confirm their uniform distribution. The Sm signal in the mapping image could overlap with background noise, because of its low amount in the sample. These SEM-EDS results of Ti/Sb-SnO2/PbO2 and Ti/Sb-SnO2/Sm-PbO2 are in agreement with the results obtained by FTIR, Raman, and XRD analysis.

Figure 2.
SEM images of Ti/Sb-SnO2/PbO2 (A) and Ti/Sb-SnO2/Sm-PbO2 (B). Image (C) corresponds to EDS spectrum of Ti/Sb-SnO2/Sm-PbO2, with combined map image in inset (D) and mapping images of Ti, Pb, O, C, and Sm observed in Ti/Sb-SnO2/Sm-PbO2 sample.

Table 1.
Elemental compositions of Ti/Sb-SnO2/Sm-PbO2, obtained by EDS analysis.
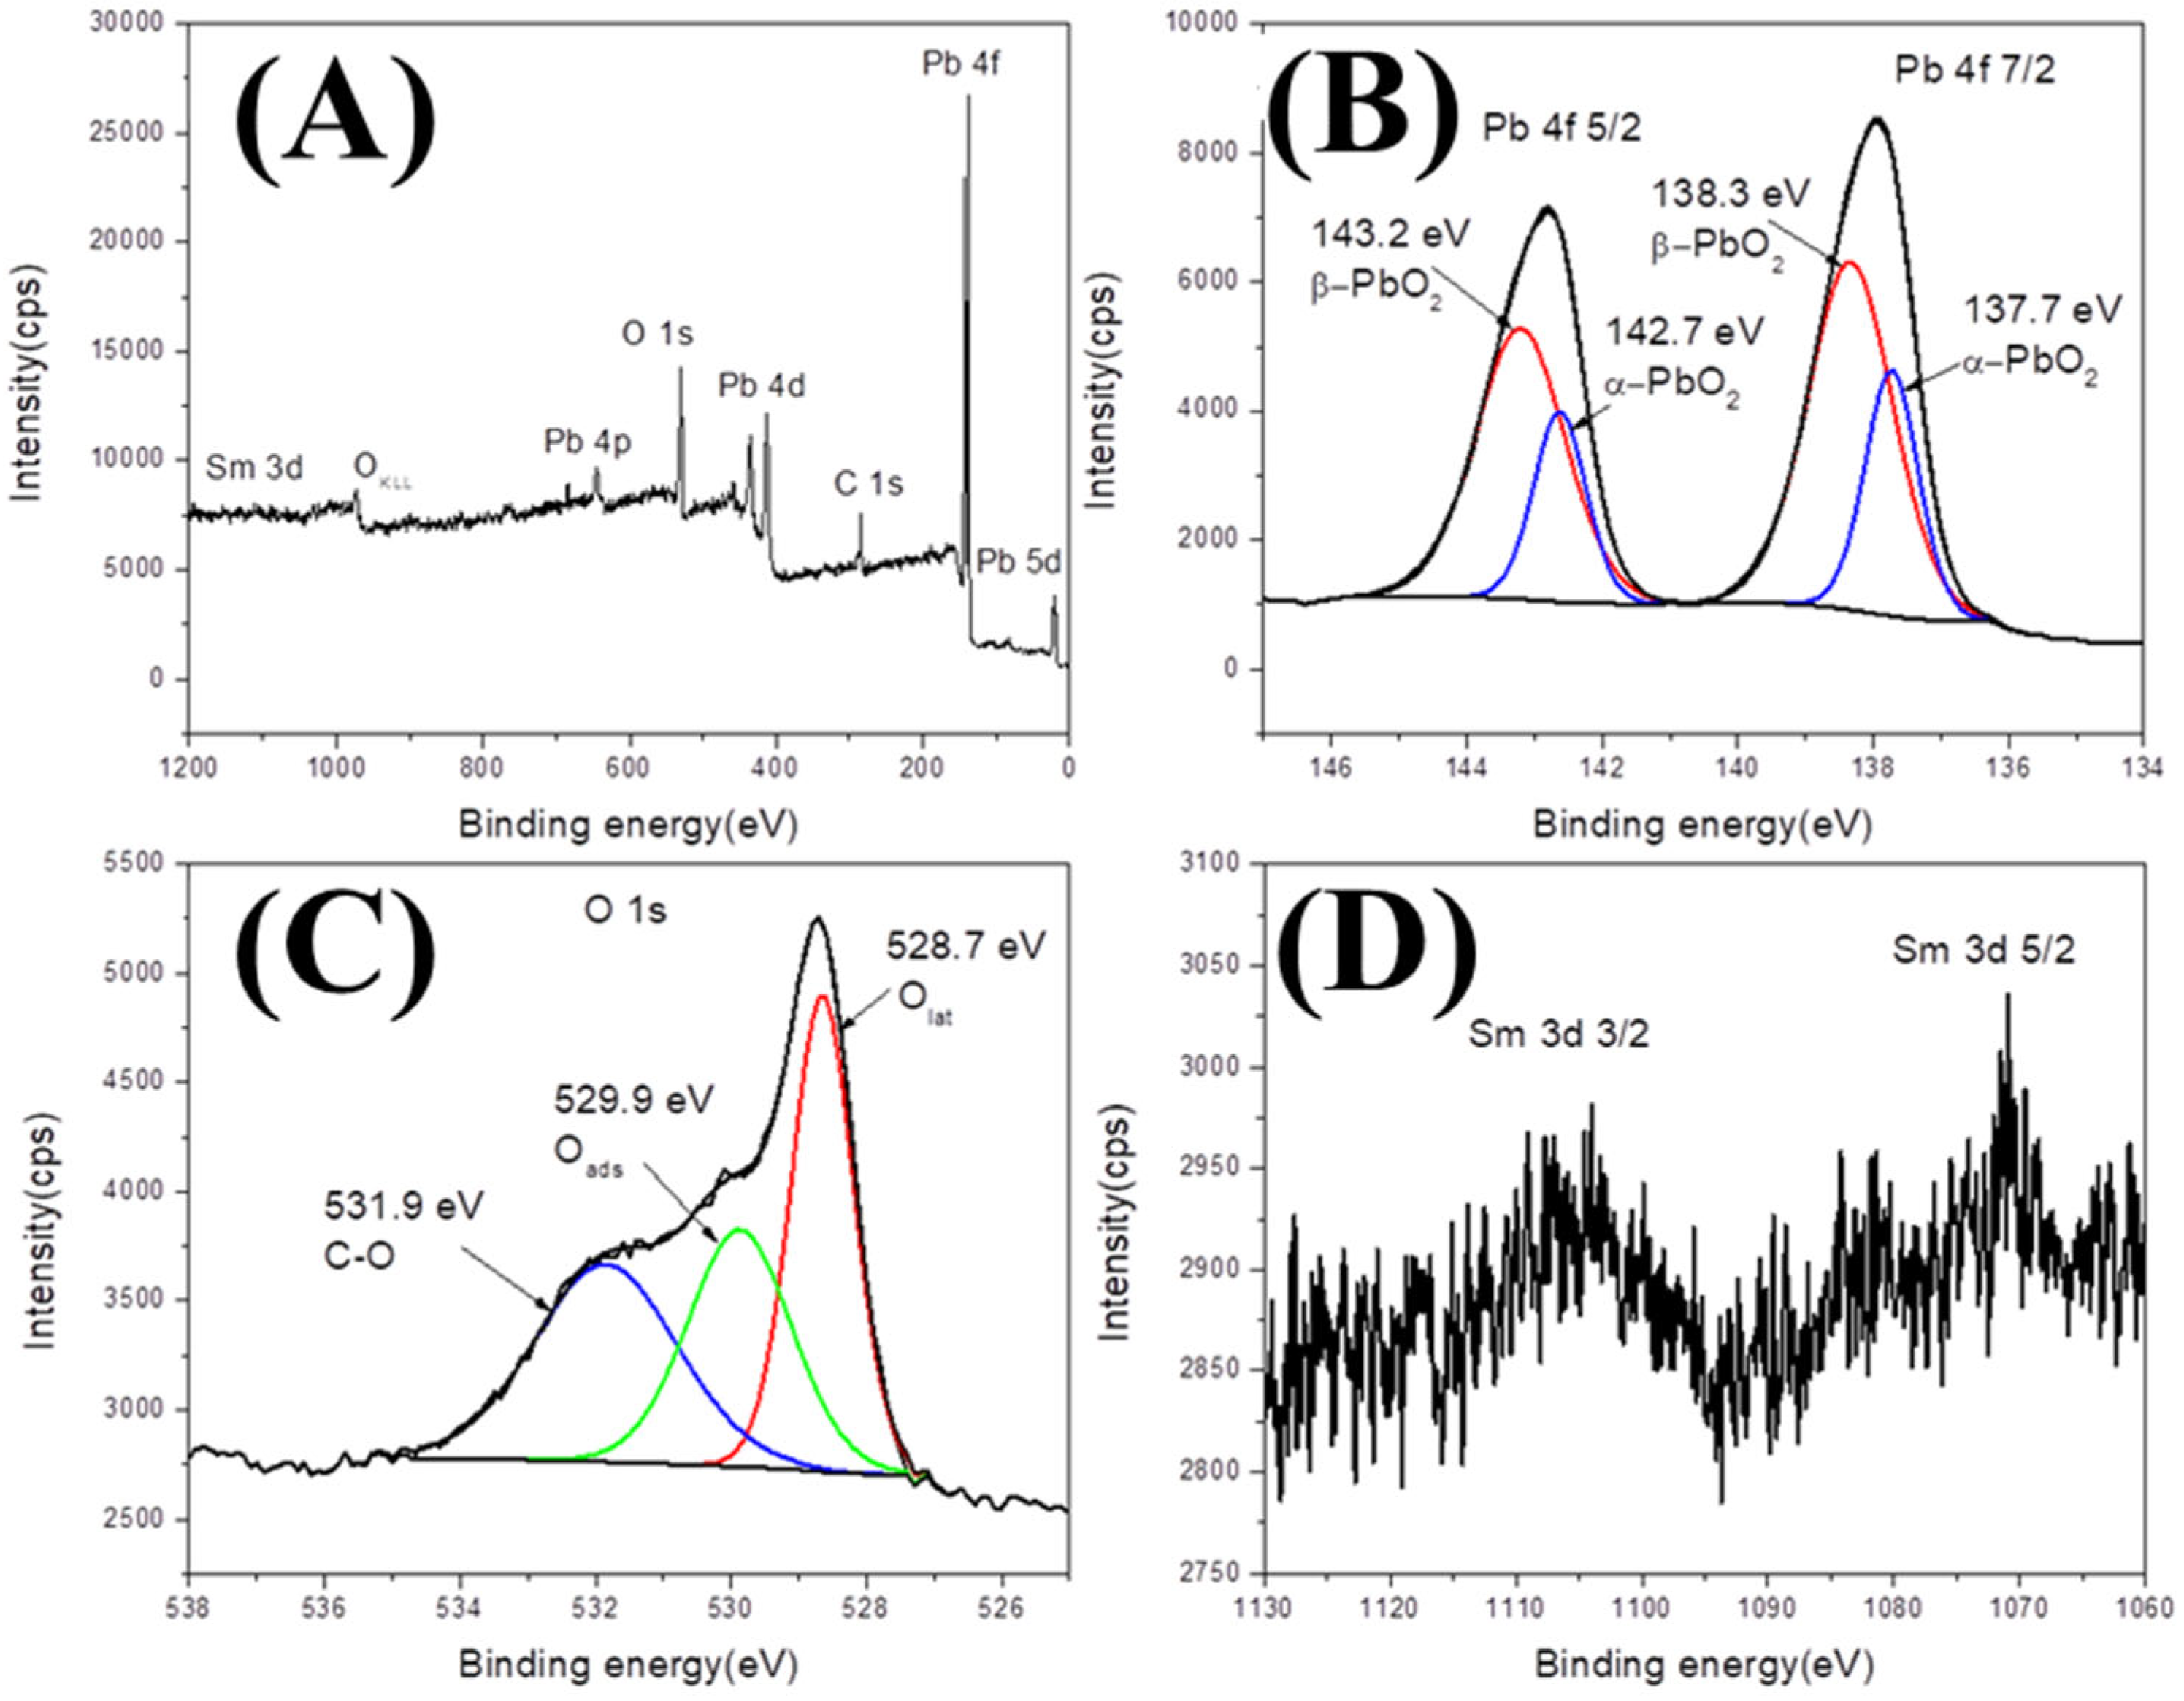
XPS results for the Sm-PbO2 surface are shown in Figure 3. The survey XPS spectra of the Sm-PbO2 sample exhibit prominent peaks for Pb, O, and C (Figure 3A). Peaks for Sn and Sm are not visible in the survey spectra, while the main Sb 3d peak overlaps with that of O 1s. The spectra resemble that of pure PbO2, with some C impurities originating from exposure to air. The survey spectra of the PbO2 sample without Sm are identical, and are therefore not shown.
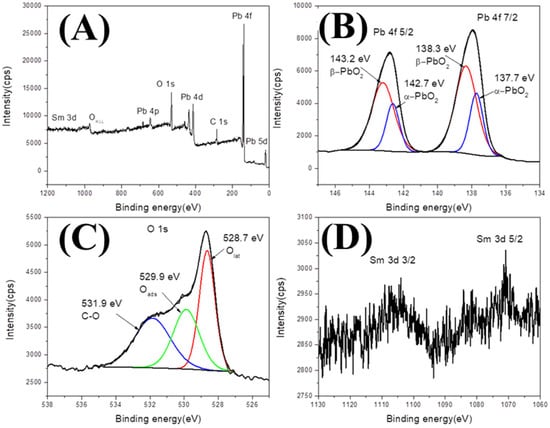
Figure 3.
XPS spectra for Sm-PbO2 of (A) survey, (B) Pb 4f, (C) O 1s, and (D) Sm 3d.
The high-resolution spectra of Pb 4f (Figure 3B) have a characteristic Pb 4f 5/2 and Pb 4f 7/2 doublet. The peaks at 138.3 eV and 143.2 eV, which account for 70.1% of the total Pb emission, can be assigned to α-PbO2, while the peaks at 137.7 eV and 142.7 eV, which account for 29.9% of the total emission, can be attributed to β-PbO2 [63]. The doublet separation is 5 eV for α-PbO2, while for β-PbO2, it is 4.9 eV, which is in line with the literature.
The high-resolution spectra of O 1s (Figure 3C) are deconvoluted into three components. Peaks at 528.7 eV, 529.9 eV, and 531.9 eV can be attributed to lattice oxygen from the PbO2 structure (36.1%), to adsorbed oxygen (O2, OH− or water) on the surface (29.8%), and to oxygen forming bonds with organic carbon impurities (34.1%), respectively [64]. The amount of Oads may be directly correlated with the number of oxygen vacancies in the crystal structure of PbO2, which tends to adsorb oxygen species to stabilize these vacancies. These oxygen vacancies promote charge transfer and give more ECSA, improving the OER performance [64,65].
Since Sm 3d is not visible in the survey spectra, the part of the spectrum zone where it is supposed to be located was recorded in high resolution with three consecutive scans (Figure 3D). Two peaks corresponding to Sm 3d 3/2 and Sm 3d 5/2 [65] can be observed, which are only slightly more prominent than the background noise. This confirms the presence of Sm in the sample, with an At% of Sm that is close to the detection limit of XPS (0.1 At%). Since the ratio of peak intensity and the background noise are too low, Sm peaks cannot be accurately deconvoluted to determine the chemical state.
3.2. Obtained Theoretical Results
Calculation of basic properties of the bulk material was carried out utilizing the experimentally obtained hexagonal (space group P4/nmm) unit cell of PbO2, containing 16 Pb and 32 O atoms. The calculated band gap is 0.31 eV, which aligns with the nature of n-type semiconductors, such as PbO2 [66]. The projected density of states (pDOS) of the PbO2 bulk material (Figure 4A) reveals that the valence band (VB) is predominantly composed of O 2p states, while the conduction band (CB) is primarily composed of Pb 6s states, with the CB minimum positioned at the Γ point. All the findings are in good agreement with previous experimental and theoretical findings [66,67].
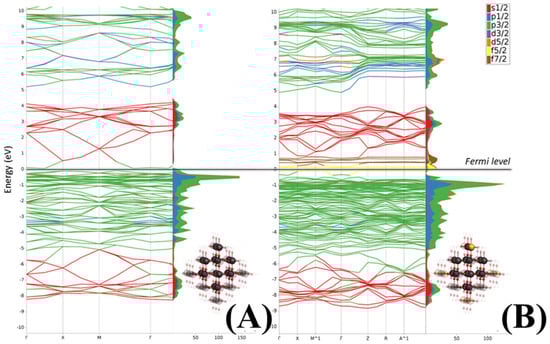
Figure 4.
The computed pDOS for pure PbO2 in the Pb16O32 cell configuration (A) and its Sm-doped analog in the form Pb16–1O32Sm1 (B). The Fermi level (Ef), represented by the black glowing line, is set to 0 eV.
To model the doping effect of pristine PbO₂ with Sm, one Pb atom in the crystal lattice was substituted with a Sm atom, resulting in a supercell configuration containing 1 Sm atom, 15 Pb atoms, and 32 O atoms. Upon Sm doping, the band structure becomes denser and more complex (Figure 4B). Most importantly, two new peaks, corresponding to Sm 4f states, emerge within the middle of the initial band gap region and near the lower edge of the CB, whereby the Fermi level moves towards the CB minimum, practically closing the band gap. As a result, the electrons from the VB absorb photons and transfer to the unoccupied Sm 4f states located in the middle of the band gap, before further exciting to the conduction band. This process reduces the energy required for electron transitions from the VB to the CB, accelerating and increasing the number of transitions. The electron-deficient characteristic of the 4f orbital can be regarded as an electron trap, promoting photogenerated e−/h+ migration. When electron trap centers capture electrons, it becomes more challenging for holes to recombine with the trapped electrons, thus extending the period required for the trapped electrons to be released into the conduction band. Consequently, this process reduces the recombination rate of charge carriers and extends their lifetime, enhancing the electron transfer to reactant molecules, and further increasing the catalytic turnover rate and the formation of ROS (hydroxyl radicals (OH•) and superoxide radical anions (O2•−)).
To investigate the adsorption of H2O molecules onto the surface of PbO2, a periodic 2 × 3 × 1 supercell PbO2 (110) with four-layer thickness (in Pb96O96 configuration) was built. During optimization, the two bottom layers were fixed in the bulk position, whereas the two upper atom layers with adsorbed H2O molecule (s) were allowed to relax. The vacuum layer was set to 40 Å in the slab system to avoid interlayer interaction. The optimized structure of a H2O molecule adsorbed onto the PbO2 surface reveals that, following the initial interaction between the O atom of the water molecule and the metal atoms on the surface, a significant elongation of the O-H bond occurs (Figure 5). This elongation is driven by the interaction between the H atom of the water molecule and the O atoms on the surface, which weakens the bond and facilitates dissociation.
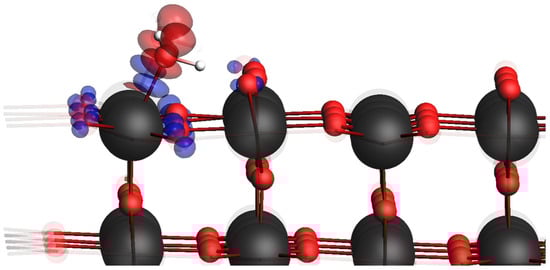
Figure 5.
A H2O molecule adsorbed onto the PbO2 surface, together with the corresponding plot of the NOCV pair, with the strongest contribution to the deformation density.
The pEDA-NOCV method was utilized to provide a more detailed analysis of the bonding interactions between the surface and the adsorbed water molecules. Figure 5 illustrates the most significant NOCV pair, with the biggest contributions to the deformation density, representing the redistribution of electron density between interacting fragments (water molecule and the material surface) upon bond formation. The red lobes indicate regions of electron depletion due to fragment interactions, while the blue lobes correspond to areas of increased electron density. The results suggest that electron density is transferred from the O atom of water (indicated by red lobes) to the Pb atom on the material’s surface in an electron-donating process. The density accumulates, forming a chemical bond (represented by blue lobes), which subsequently facilitates back-donation from the Pb atom to the surrounding oxygen atoms. Additionally, an increased electron density is observed in the surface O atoms interacting with the H atoms of water, indicating the formation of a weak hydrogen bond.
3.3. Oxygen Evolution Reaction Investigation
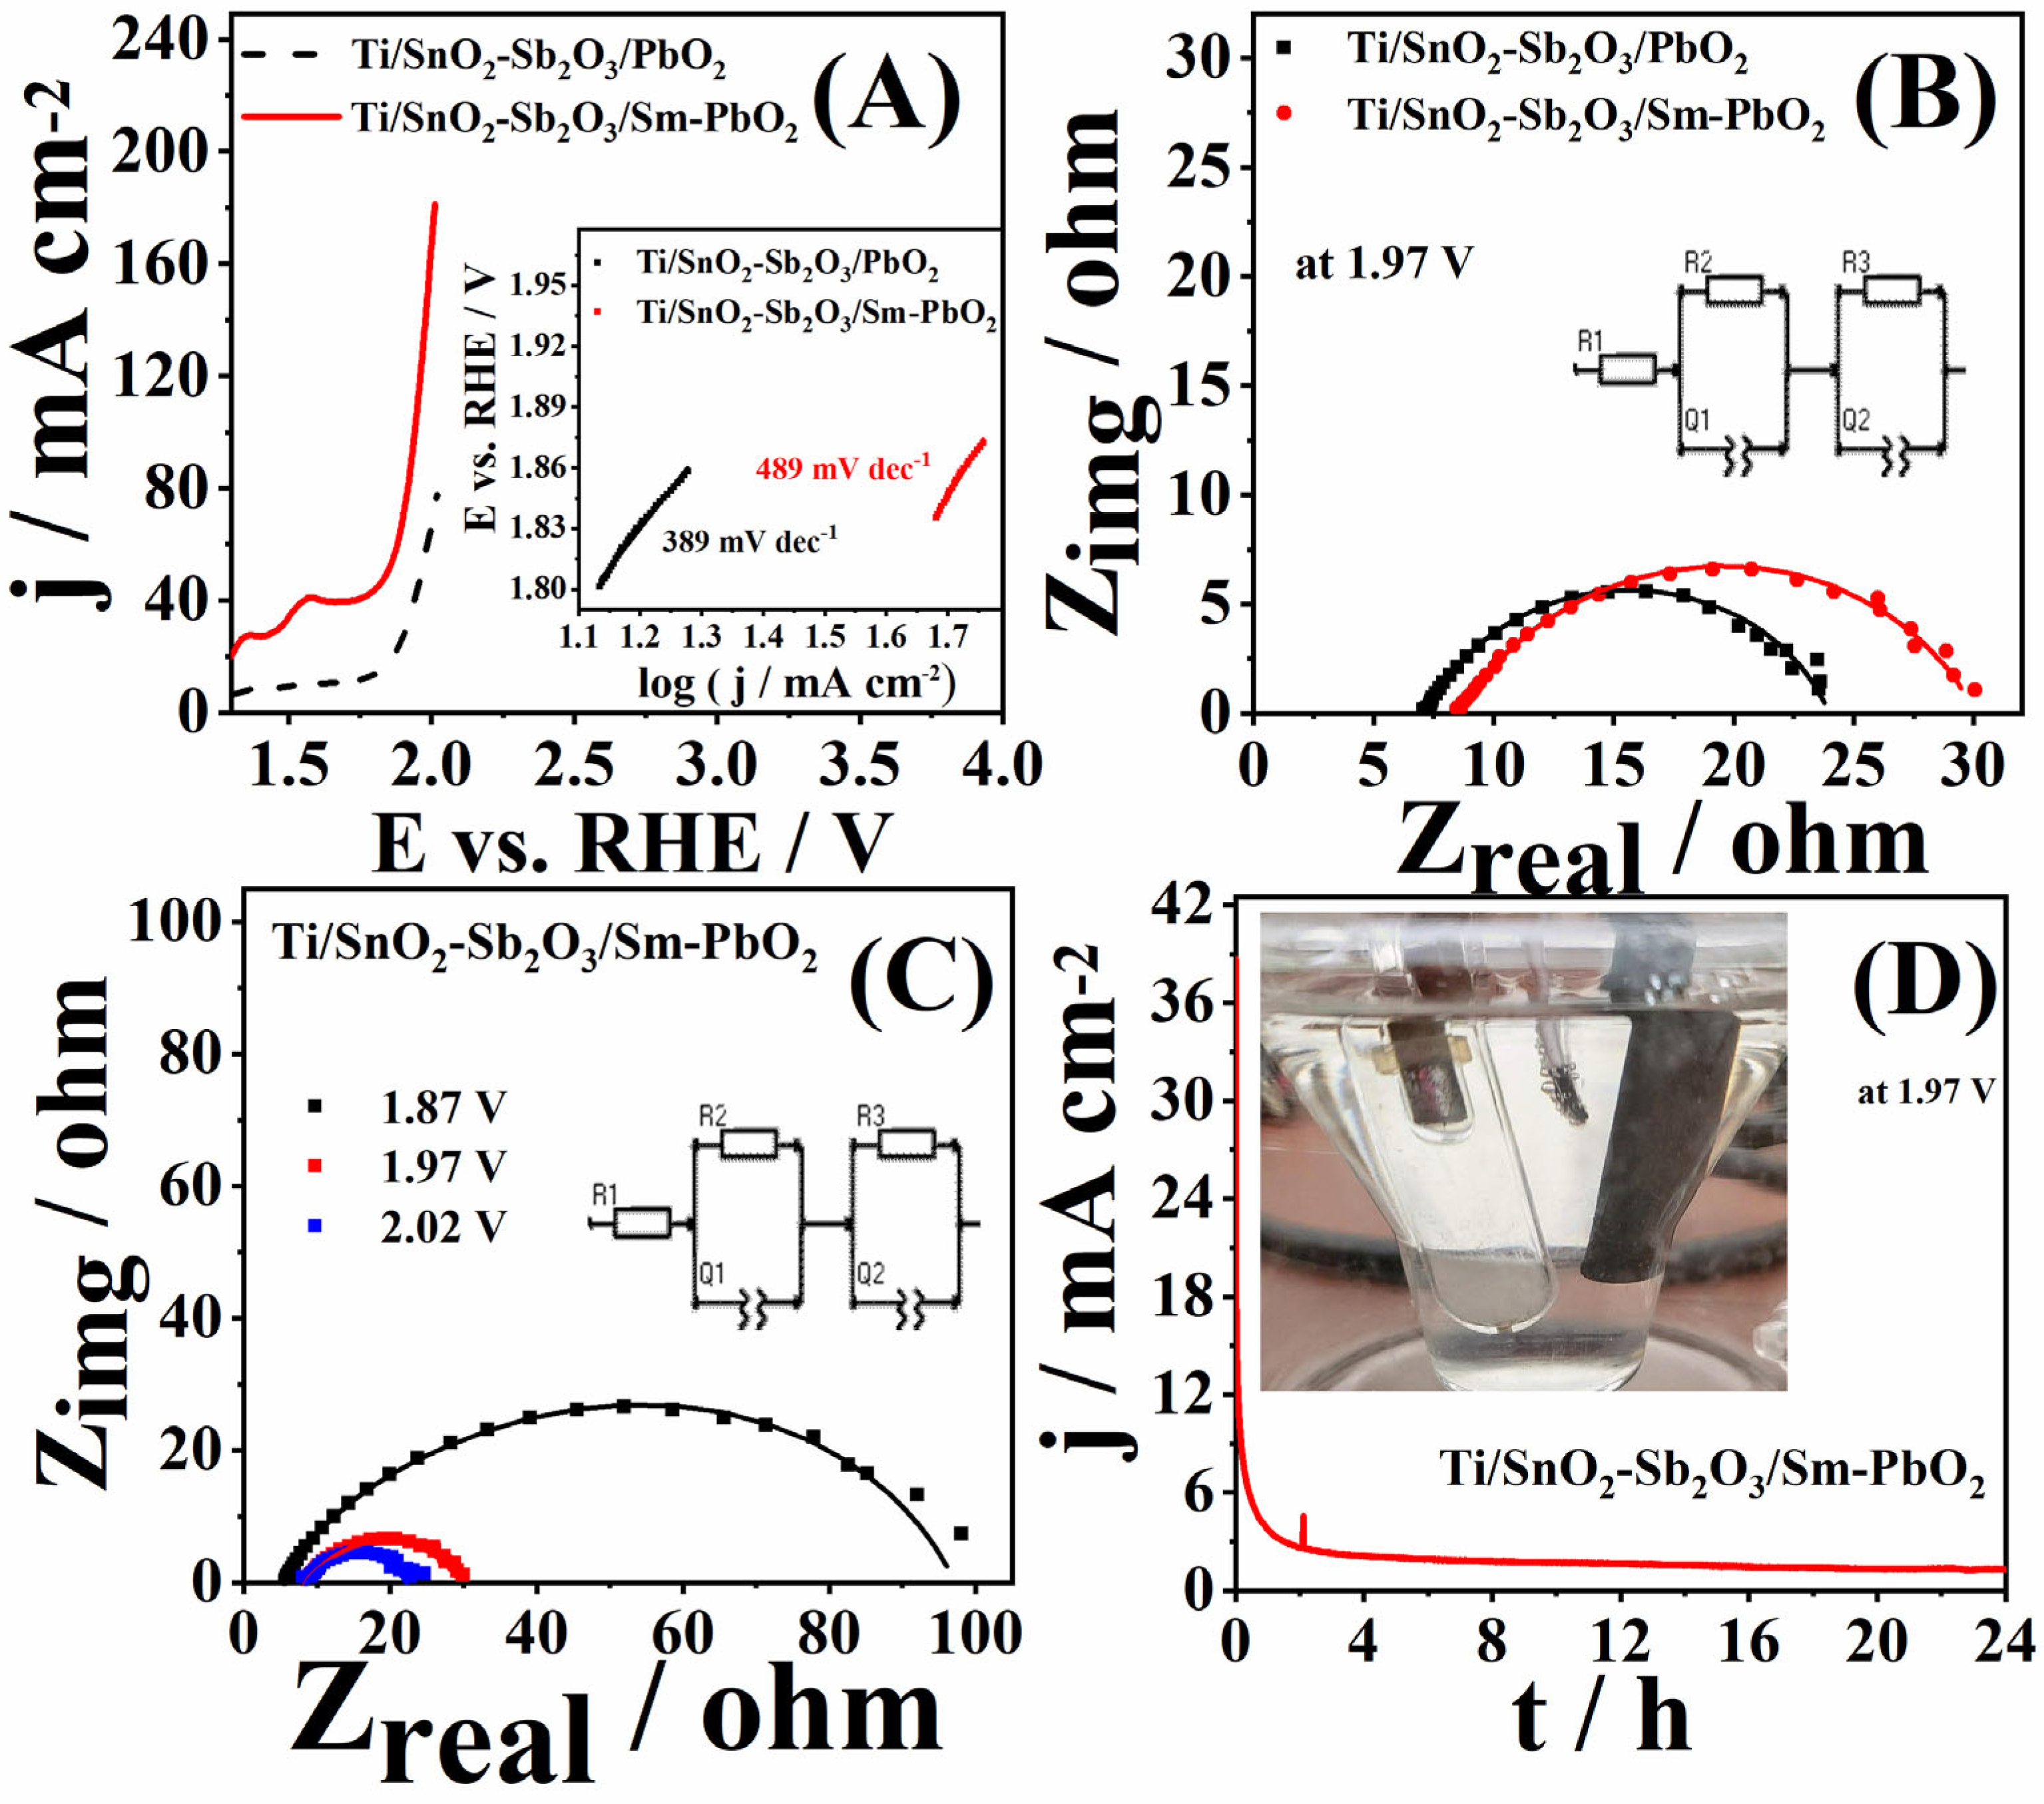
The oxygen evolution reaction activity of Ti/Sb-SnO2/Sm-PbO2 is presented and compared with the OER activity of the Ti/Sb-SnO2/PbO2 electrode in Figure 6A. Two oxidation peaks, obtained for both electrodes at 1.36 and 1.56 V, represent oxidation of Pb (II) and Pb (IV), respectively [68,69]. The onset potential (Eonset) of 1.80 and 1.83 V and overpotential ηonset values at Eonset (ηonset = Eonset − 1.2 V) of 600 and 630 mV were found for Ti/Sb-SnO2/Sm-PbO2 and Ti/Sb-SnO2/PbO2, respectively. Ti/Sb-SnO2/Sm-PbO2 showed 30 mV more negative Eonset and ηonset values, meaning that the OER starts earlier than at the primary PbO2 electrode without Sm. Highly conductive MXene (Ti3C2Tx) was prepared by electrophoretic deposition (EPD) as an interlayer of the PbO2 electrode to obtain several electrodes, such as EPD-1.0/PbO2, EPD-2.0/PbO2, and EPD-5.0/PbO2 [70]. Namely, these electrodes showed OER activity with an Eonset of 2.25 V for both the EPD-1.0/PbO2 and EPD-2.0/PbO2 electrodes, and 2.38 V for EPD-5.0/PbO2 [63]. Also, ηonset values of 1050 mV for both EPD-1.0/PbO2 and EPD-2.0/PbO2 and 1180 mV for EPD-5.0/PbO2 were obtained [70]. These values of Eonset and ηonset are significantly higher than those presented here (Table 2). Similar OER behavior was shown for three Ti-PbO2 electrodes with different micro/nanostructures and surface hydrophobicity (Ti-PbO2-reference, Ti-PbO2-2, and Ti-PbO2-4) [71]. Specifically, Eonset values from 2.44 to 3.12 V and ηonset values from 1240 to 1920 mV were found for the Ti-PbO2-reference, Ti-PbO2-2, and Ti-PbO2-4 electrodes (Table 2) [71]. On the other hand, PbO2-MnO2 and PbO2 gave Eonset values of 1.83 and 1.93 V and ηonset values of 630 and 730 mV, respectively [68]. Here, the examined primary Ti/SnO2-Sb2O3/PbO2 electrode showed the same Eonset and ηonset values as the PbO2-MnO2 electrode, while Ti/SnO2-Sb2O3/Sm-PbO2 offered somewhat lower values. On the other hand, different cerium OER electrocatalysts showed Eonset values ranging from 1.31 to 1.65 V (Table 2), which are significantly lower than the values obtained here for Eonset [72,73]. OER current densities of 67.1 and 168.4 mA cm−2 were obtained for Ti/Sb-SnO2/PbO2 and Ti/Sb-SnO2/Sm-PbO2 (Table 2) at 2 V, respectively. Namely, the Ti/Sb-SnO2/Sm-PbO2 electrode showed enhanced OER activity, with 2.5 times higher OER currents than Ti/Sb-SnO2/PbO2. The highest OER current densities obtained here for the synthesized electrodes, compared with all values of OER current densities, are presented in Table 2.
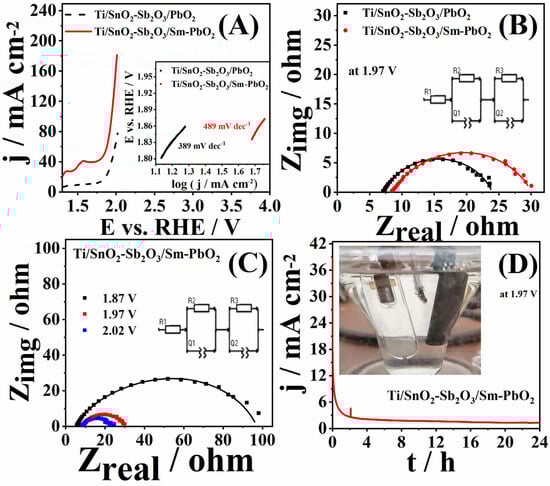
Figure 6.
OER polarization curves (IR-corrected) of Ti/Sb-SnO2/PbO2 and Ti/Sb-SnO2/Sm-PbO2 at 20 mV s−1, with the corresponding Tafel slope in the inset (A); Nyquist plots of the Ti/Sb-SnO2/PbO2 and Ti/Sb-SnO2/Sm-PbO2 electrodes at 1.97 V (B); Nyquist plots of the Ti/Sb-SnO2/Sm-PbO2 electrode at three different potentials of 1.87, 1.97, and 2.02 V, with the appropriate equivalent circuit (C); and the chronoamperometry curve of Ti/Sb-SnO2/Sm-PbO2 at 1.97 V during 24 h in 1 M KOH (D).
On the other hand, Ti/Sb-SnO2/Sm-PbO2 showed a higher Tafel slope (489 mV dec−1) than the Ti/Sb-SnO2/PbO2 electrode (389 mV dec−1), which means that the rate of the OER at the PbO2 electrode with Sm was somewhat slower than the rate of the OER at the primary PbO2 electrode (Figure 6A inset). The higher value of the Tafel slope of Ti/Sb-SnO2/Sm-PbO2 can be attributed to the presence of many gas bubbles or oxygen species on the electrode surface (Figure 6D inset), which were noticed during the measurements, and block the active surface area [74]. The electrode’s surface is covered with a permanent layer of oxygen bubbles during the OER, which depends on the characteristics of the electrocatalyst surface and the current density. These bubbles typically form on surface irregularities and obstruct the active sites of the electrocatalysts during the OER [74]. In both cases, the Tafel slopes are higher than 120 mV dec−1, meaning that the OER rate-determining step is the generation and absorption of OER intermediates [68,75]. Interestingly, similar Tafel slopes (Table 2) were noticed for platinum (Pt) and earth-abundant transition metals (M = Ni and Cu) on graphene nanoplatelets (sqPtM/GNPs) electrocatalysts [76] and for Pt and Cu nanoparticles supported on graphene nanoplatelets (PtCu/GNPs). Also, NiA showed a similar Tafel slope, while NiX zeolites showed significantly higher values than the examined PbO2 electrodes [37]. On the other hand, three-times-lower Tafel slopes in the range from 139 to 180 mV dec−1 were observed for GdFe1-xCuxO3 catalysts calcined at different temperatures (GFC20600, GFC20700, and GFC20800) [77]. Also, other rare-earth electrocatalysts have shown lower Tafel slopes than those obtained here, ranging from 138 to 281 mV dec−1 [72,73].
Table 2.
OER kinetic parameters of Ti/Sb-SnO2/PbO2 and Ti/Sb-SnO2/Sm-PbO2 electrocatalysts compared with literature reports.
Table 2.
OER kinetic parameters of Ti/Sb-SnO2/PbO2 and Ti/Sb-SnO2/Sm-PbO2 electrocatalysts compared with literature reports.
| OER Electrocatalysts | Electrolyte | Eonset/V | ηonset/mV | b/mV dec−1 | j at 2 V/mA cm−2 | Ref. |
|---|---|---|---|---|---|---|
| Ti/Sb-SnO2/PbO2 | 1 M KOH (pH = 14) | 1.83 | 630 | 389 | 67.1 | This work |
| Ti/Sb-SnO2/Sm-PbO2 | 1 M KOH (pH = 14) | 1.80 | 600 | 489 | 168.4 | This work |
| EPD-1.0/PbO2 | 0.25 M Na2SO4 (pH = 6) | ~2.25 | 1050 | / | ~35 | [70] |
| EPD-2.0/PbO2 | 0.25 M Na2SO4 (pH = 6) | ~2.25 | 1050 | / | ~30 | [70] |
| EPD-5.0/PbO2 | 0.25 M Na2SO4 (pH = 6) | ~2.38 | 1180 | / | ~45 | [70] |
| Ti-PbO2-reference | 0.1 M Na2SO4 (pH = 6.2) | ~3.12 | 1920 | / | / | [71] |
| Ti-PbO2-2 | 0.1 M Na2SO4 (pH = 6.2) | ~2.44 | 1240 | / | / | [71] |
| Ti-PbO2-4 | 0.1 M Na2SO4 (pH = 6.2) | ~2.44 | 1240 | / | / | [71] |
| PbO2-MnO2 | 0.5 M H2SO4 (pH = 0.3) | ~1.83 | ~630 | 123 | / | [68] |
| PbO2 | 0.5 M H2SO4 (pH = 0.3) | ~1.93 | ~730 | 152 | / | [68] |
| GFC20600 | 1 M KOH (pH = 14) | / | / | 139 | / | [77] |
| GFC20700 | 1 M KOH (pH = 14) | / | / | 154 | / | [77] |
| GFC20800 | 1 M KOH (pH = 14) | / | / | 180 | / | [77] |
| CeO2 | 0.1 M KOH (pH = 13) | 1.36 | 110 | 148 | / | [72] |
| CeO2/rGO, | 0.1 M KOH (pH = 13) | 1.31 | 160 | 138 | / | [72] |
| La2O3/rGO | 0.1 M KOH (pH = 13) | / | / | 210 | / | [72] |
| Ce0.95Ni0.05O2−δ | 0.1 M KOH (pH = 13) | 1.65 | 450 | 281 | 0.9 | [73] |
| Ce0.90Ni0.10O2−δ | 0.1 M KOH (pH = 13) | 1.58 | 380 | 232 | 1.8 | [73] |
Nyquist plots of Ti/Sb-SnO2-/PbO2 and Ti/Sb-SnO2-/Sm-PbO2 electrodes are presented in Figure 6B. Table 3 shows the EIS parameters of the examined electrodes, which were calculated by fitting EIS data with the appropriate equivalent circuit in the Figure 6B inset. Charge-transfer resistance (Rct) values of 16.5 and 20.5 Ω were obtained for Ti/Sb-SnO2/PbO2 and Ti/Sb-SnO2/Sm-PbO2, respectively. Additional Nyquist plots were recorded at three different OER potentials for the Ti/Sb-SnO2/Sm-PbO2 electrode (Figure 6C), where decreasing Rct with increasing potential was observed. Namely, the Rct of Ti/Sb-SnO2/Sm-PbO2 was decreased from 70.3 to 12.2 Ω at 1.87 and 2.02 V, respectively.
Table 3.
Electrochemical impedance spectroscopy (EIS) parameters of Ti/Sb-SnO2/PbO2 and Ti/Sb-SnO2/Sm-PbO2 electrodes in 1 M KOH at1.97 V.
Chronoamperometric (CA) curves of the Ti/Sb-SnO2/Sm-PbO2 electrode at 1.97 V during 24 h are presented in Figure 6D. The Ti/Sb-SnO2/Sm-PbO2 electrodes gave 1.4 mA cm−2 during the OER over 24 h. This result shows good OER stability of the examined electrode. The OER current densities of Ti/Sb-SnO2/Sm-PbO2 were decreased by 33.5% when comparing the current densities in the 3rd and 24th hours. This fact could be the consequence of the presence of many oxygen gas bubbles on the electrode’s surface during the OER (Figure 6D inset). Testing the sample with the ICP-OES method showed that, after a twenty-four-hour stability test during the OER, the lead concentration was below the instrument’s detection limits. This result confirms the stability and longevity of the developed electrode, as well as its compliance with environmental sustainability requirements.
The projected density of states (pDOS) for synthesized electrodes shows that the valence and conduction bands consist of O 2p and Pb 6 s states, respectively, with the conduction band minimum located at the Γ point in pure PbO2. A denser and more complex band structure is observed in PbO2 with the Sm structure, where Sm 4f states appear in the middle of the initial band gap region, near the lower edge of the conduction bands. The Fermi level’s shift towards the conduction band minimum leads to the closing of the band gap. This fact could account for the better catalytic activity of the Ti/Sb-SnO2/Sm-PbO2 electrode than the Ti/Sb-SnO2/PbO2 electrode.
3.4. AOP Application of Ti/Sb-SnO2/Sm-PbO2 Electrode for CBZ Removal
3.4.1. Effect of Applied Current Density
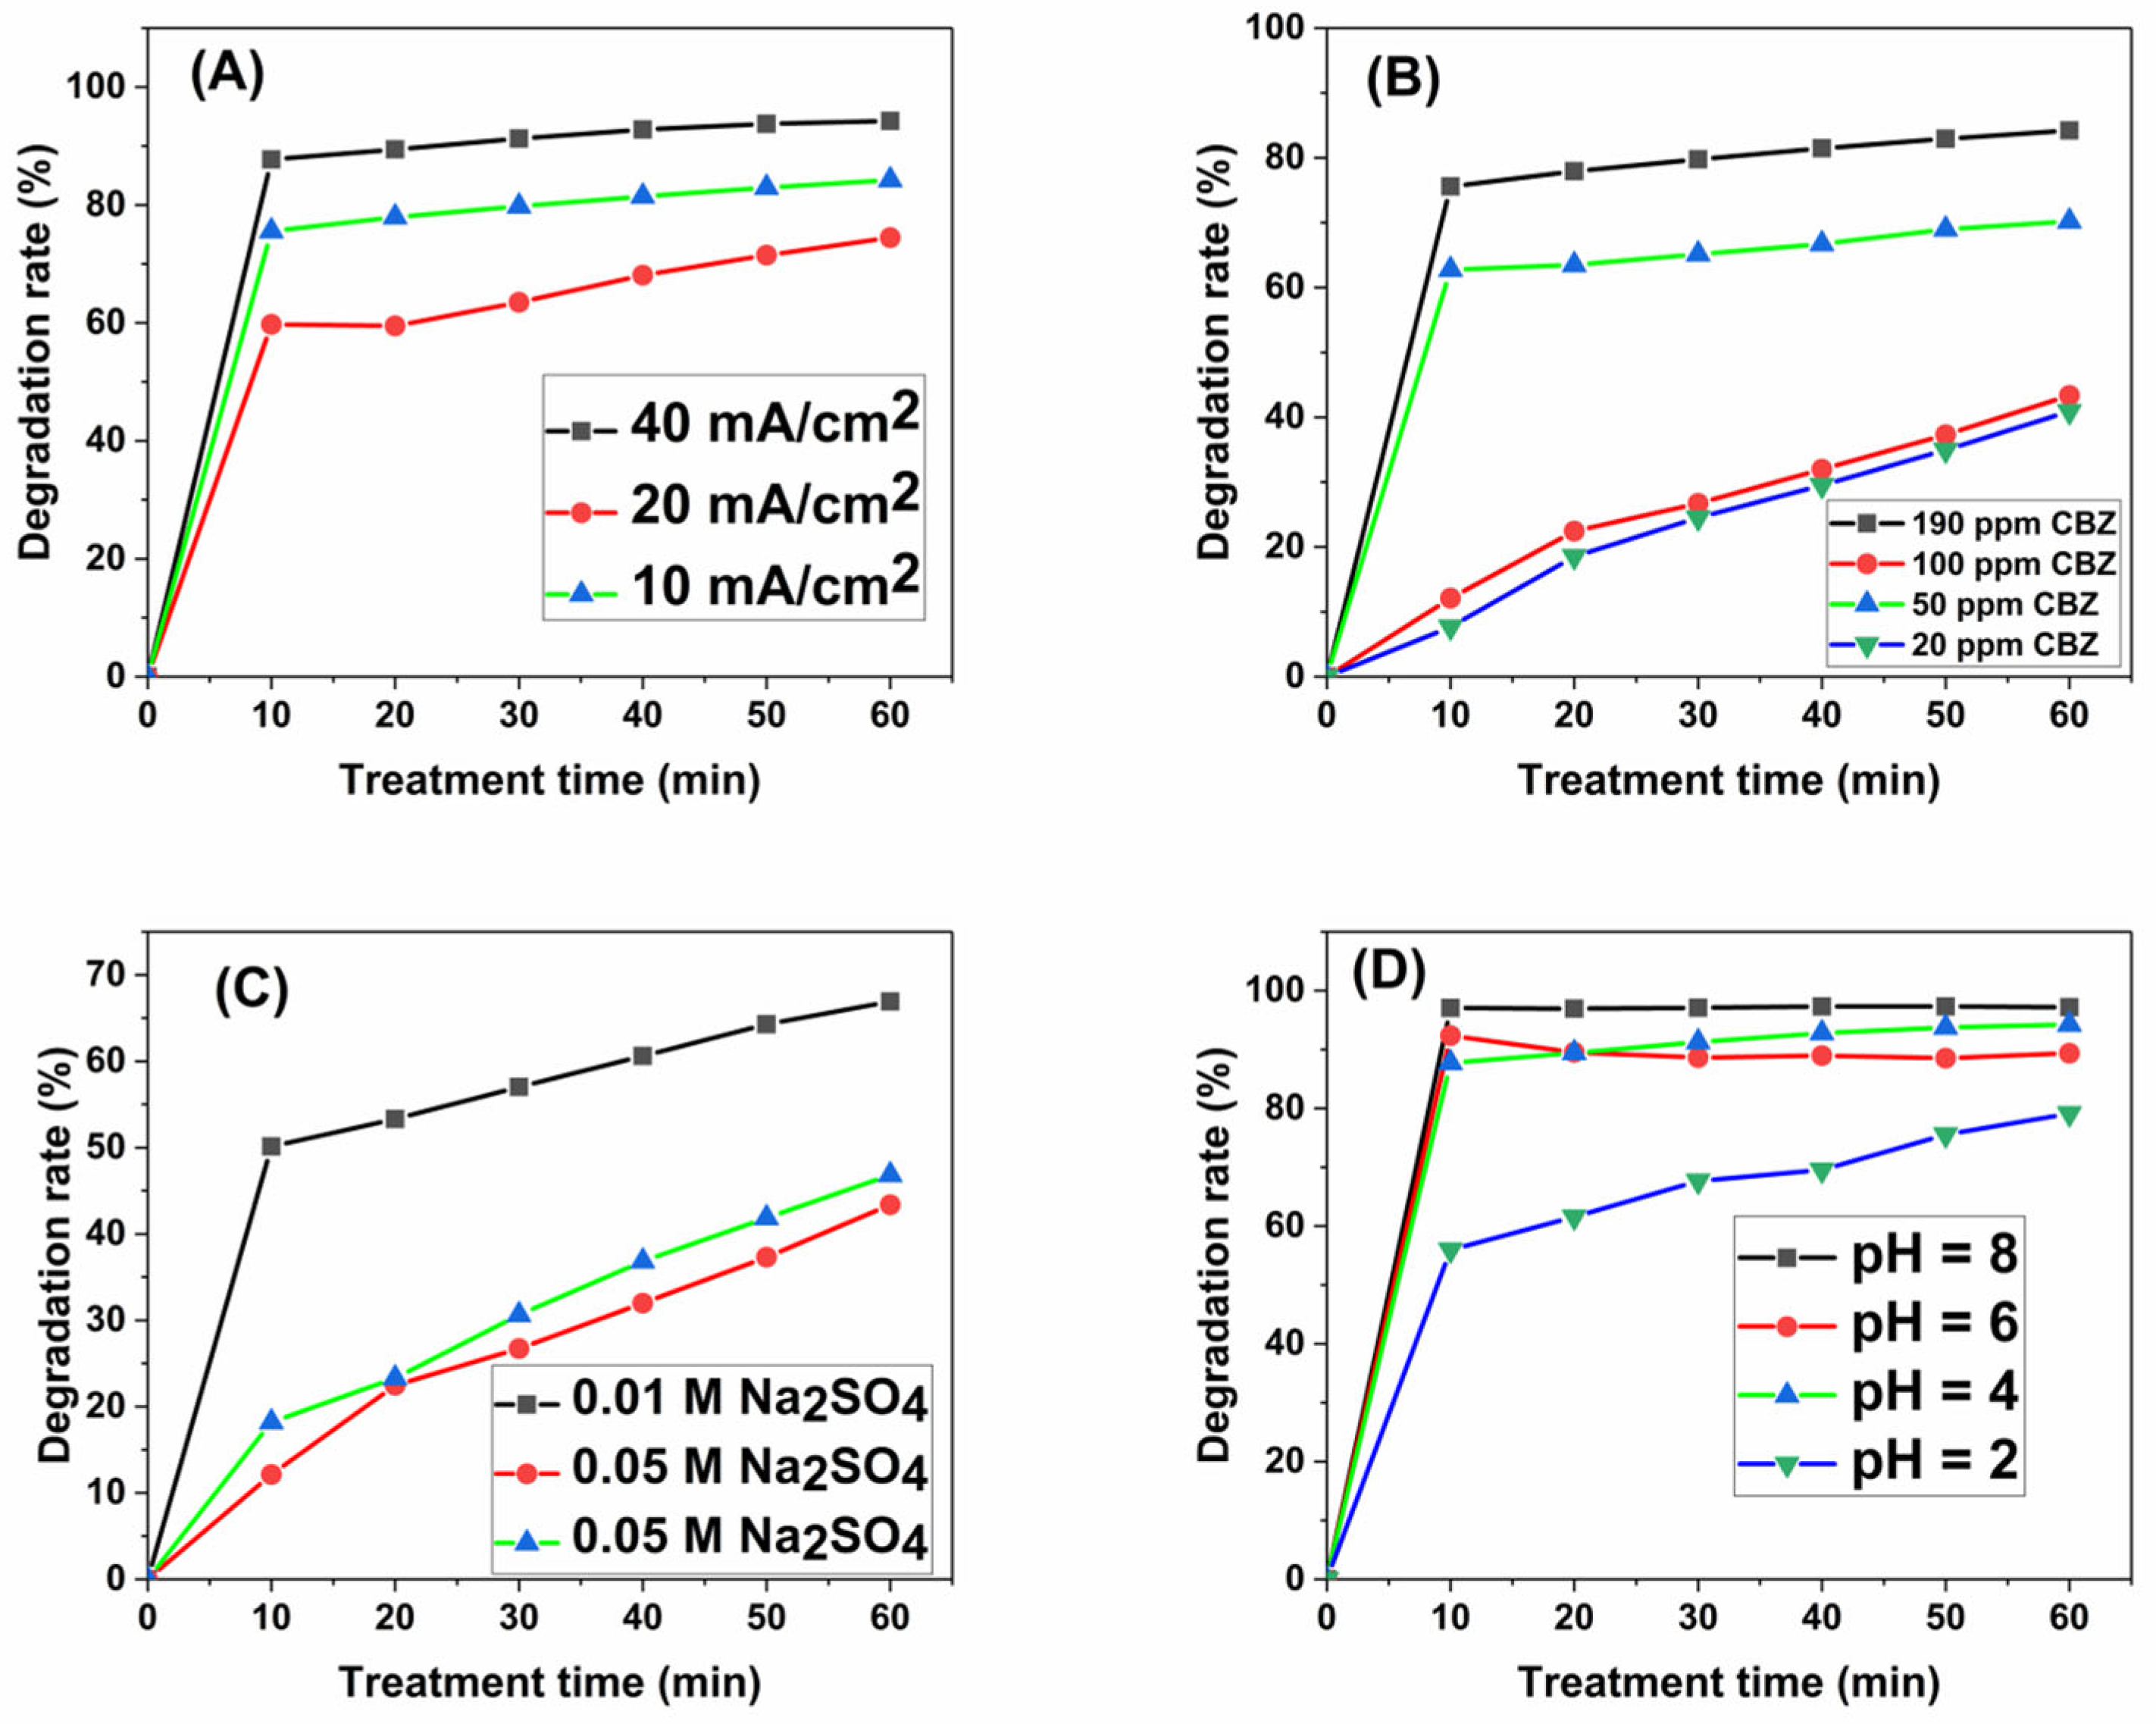
CBZ was degraded under different applied currents (40 mA (10 mA/cm2), 80 mA (20 mA/cm2), and 160 mA (40 mA/cm2)), while the other parameters were as follows: native pH, supporting electrolyte 0.05 M Na2SO4, and 190 ppm of CBZ. The obtained results presented in Figure 7A show that the removal of CBZ after 60 min was the highest when the highest current density was applied, which can be explained by the highest production of ROS during the electrolysis of the aqueous solution, and thus the highest degradation rate, which was 84.2%. At an applied current density of 20 mA/cm2, the degradation rate after 60 min of electrolysis was 74.5%, which is lower compared to the 84.2% analyte removal at 10 mA/cm2 for the same period. The reason for the slightly higher degradation efficiency at a current density of 10 mA/cm2 may be the side reactions, as the reactive species produced at a current density of 20 mA/cm2 do not have to be used directly for degradation, but can be spent on other reactions. This effect can also be caused by an increased temperature, which is not the case with the current density of 10 mA/cm2. The mentioned effect, which occurs at a current density of 20 mA/cm2, is negligible at a current density of 40 mA/cm2, due to the application of twice the current density, which generates a greater number of hydroxyl radicals and suppresses the influence of other factors. Thus, the applied current density of 10 mA/cm2 was chosen as the optimal condition.
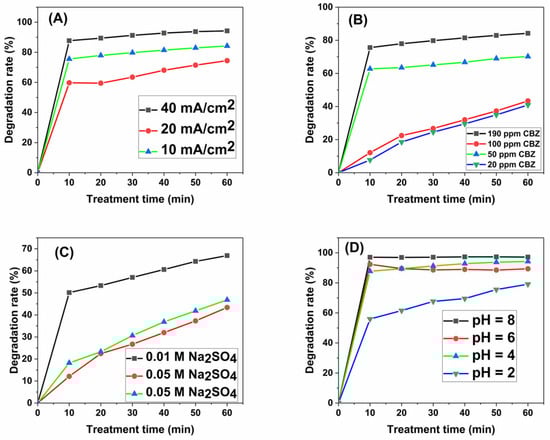
Figure 7.
The effect of the applied current density on the efficiency of the CBZ degradation rate (A); the effect of the initial concentration of CBZ on the efficiency of the CBZ degradation rate (B); the effect of the supporting electrolyte concentration on the efficiency of the CBZ degradation rate (C); and the effect of the initial pH value on the efficiency of the CBZ degradation rate (D).
3.4.2. Effect of Initial Concentration of CBZ
Given that different concentrations of pollutants can be found in industrial wastewater, it was necessary to examine the influence of different initial CBZ concentrations on the degradation efficiency by applying a current density of 10 mA/cm2, an electrolyte concentration of 0.05 M, and a pH value of 4. As can be seen from Figure 7B, more than 80% of CBZ was degraded at an initial concentration of 190 mg/L, which demonstrates the excellent degradation ability of the Sm-doped PbO2 electrode towards this fungicide. However, a lower degradation efficiency was observed for the same electrolysis time at lower initial concentrations. The reason for this result can be explained by the removal of a larger number of pollutants per unit of time for its higher initial concentrations. Considering the fact that conditions such as the applied current and electrolyte concentration were the same at different initial analyte concentrations, radical production remained unchanged. However, analyzing the obtained degradation efficiency value for a concentration of 100 mg/L, it can be concluded that, contrary to the previous explanation, a smaller amount of CBZ was removed compared to at a concentration of 50 mg/L. In order to explain this phenomenon, it is necessary to take into account the control of diffusion. The degradation reaction takes place on the surface of the electrode with hydroxyl radicals, which means that at lower analyte concentrations, a higher removal rate can occur, given that degradation is faster than the diffusion of pollutants and their intermediates. At higher pollutant concentrations, there is an accumulation of both the pollutant itself and intermediates that cannot be removed, and thus prevent contact of the analyte with the active area of the electrode. Comparing four different initial analyte concentrations, it can be concluded that at a concentration of 100 mg/L, gradual degradation occurred during 60 min of electrolysis. In the other three cases, after 10 min, the highest percentage of CBZ was degraded, while in the next 50 min, a slight change in the degradation efficiency was observed. A concentration of 190 mg/L was chosen as optimal, due to it producing the highest degradation rate compared to the other three experiments.
3.4.3. Effect of Supporting Electrolyte Concentration
The presence of electrolytes in the aqueous solution of CBZ supports its degradation by increasing the conductivity and affecting the generation of hydroxyl radicals. Therefore, variations in electrolyte concentration can have a huge impact on the efficiency of organic pollutant degradation. In this case, the influence of the electrolyte Na2SO4 in concentrations of 0.01 M, 0.05 M, and 0.1 M was observed, and the obtained results were 66.9%, 43.4%, and 46.8%, respectively (Figure 7C). The highest degradation rate was for 0.01 M, while at the other two higher values of Na2SO4 concentration, the degradation efficiency was similar, and slightly lower compared to the lowest concentration of electrolyte. This shows that higher electrolyte concentrations do not necessarily mean better CBZ degradation. Although a higher concentration of electrolyte can generate more radicals for better degradation, too-high concentrations can lead, in this case, to an excess of SO42− ions, which can be absorbed on the surface of the electrode, and thus prevent the interaction between CBZ and hydroxyl radicals and reduce the amount of analyte removed from the solution.
3.4.4. Effect of Initial pH Value
In order to determine the influence of the pH value of the solution during CBZ degradation, solutions in which the pH value varied, while the other parameters remained unchanged, were prepared. NaOH and H2SO4 were used to adjust the pH value. An acidic environment can be expected to be the most favorable medium for the degradation of organic pollutants [11,13,18,68,69,70,71,72]. Results obtained in this way are most often a consequence of inhibiting the oxygen evolution reaction, which contributes to the generation of hydroxyl radicals and a greater efficiency of organic pollutant degradation. Figure 7D shows the results obtained for pH values from 2 to 8 at a current density of 10 mA/cm2, an electrolyte concentration of 0.05 M, and a CBZ concentration of 190 mg/L. Similar degradation efficiency after 60 min of the treatment was obtained for pH values 4, 6, and 8: 94.2%, 89.3%, and 97.2%, respectively. In an acidic environment of pH 2, after 60 min, the degradation rate was 79.1%, which is slightly lower compared to the results obtained in the other three media. This can be explained by the different chemical structures of the degrading pesticide, which are influenced by pH value. Considering that the solubility of CBZ is weaker in water, and that it is necessary to apply slightly acidic conditions of around pH 4, we chose this pH for the final parameters of the degradation method. The slightly lower degree of degradation, 3%, did not justify the additional use of chemicals to adjust the acidity of the initial solution, so pH 4 was chosen—the value of the native solution prepared for the experiments.
Summing up all the previous studies related to the development of the method for the degradation of CBZ, the final parameters are the following: pH 4, a current strength of 40 mA (or 10 mA/cm2), a concentration of sodium sulfate as the supporting electrolyte of 0.05 M, and a concentration of the starting compound of 190 mg/L. With these parameters, a degradation efficiency of 94.2% was achieved. Looking at the previously published literature on this topic, which deals with either the degradation of the same compound or the use of electrodes of a similar structure, we can conclude that the results achieved in this work are comparable to or better than those mentioned in the literature. Table 4 shows the results of the degradation efficiency when the electrolysis conditions were similar or the same; in this way, a comparison can be made to reach certain conclusions. In addition to the efficiency of degradation during the electrochemical process, paying attention to electricity consumption is necessary. The current density applied in this study of 10 mA/cm2 can be considered more suitable than the higher current density applied in other works. The duration of electrolysis also plays a role, which was 120 min in most of the mentioned works. While most of the previous studies used a PbO2-modified electrode as an anode, one presented the use of a BDD electrode for CBZ degradation, with NaCl as an electrolyte. Considering the lower efficiency of CBZ degradation and the price of the BDD electrode, it can be concluded that conditions such as using a PbO2 electrode modified with Sm and using Na2SO4 as an electrolyte are a better choice for the degradation of this pesticide. From Table 4, it is also possible to conclude that different degradation results were obtained under the same conditions, where two electrodes, with and without added metal, were used for the degradation of the same analyte. This indicates a higher degradation efficiency if the PbO2 electrode is modified with a certain metal. Although the electrode proposed in this work achieved very significant results for the degradation of carbendazim, additional studies must be conducted to examine the intermediate and final degradation products, the percentage of mineralization of the sample, and the toxicity of the intermediate and final products. Such studies will serve to compare, in detail, the efficiency of this method with that of other methods. Additional studies and theoretical investigations will confirm the mechanism of carbendazim degradation.
Table 4.
Comparison of the results obtained in this work with the results of CBZ degradation using other conditions, as well as the degradation of different organic pollutants using the same or similar degradation conditions and electrodes.
4. Conclusions
In this study, Ti/Sb-SnO2/Sm-PbO2 showed significantly higher OER activity than the primary PbO2 electrode, demonstrating that the addition of Sm enhanced the OER activity of the PbO2 electrode. Both LSV and CA analyses showed higher OER current densities of Ti/Sb-SnO2/Sm-PbO2 than Ti/Sb-SnO2/PbO2. Additionally, XPS analysis was performed, but the very low peak intensity of Sm on survey spectra could not provide information about its chemical state. On the other hand, DFT proved the influence of Sm on the increased generation of ROS. Also, this work aimed to present the most efficient way to remove CBZ pesticide from an aqueous solution by applying anodic oxidation. Under optimal experimental conditions, 94.2% of CBZ was removed from the aqueous solution after 60 min of electrolysis. It can be concluded that the pollutant removal process mentioned in this paper uses conditions that are very favorable from the point of view of price and electricity consumption (experiment duration, required operating parameters, electrodes), and that the introduction of rare earth elements into pristine materials opens a new field of application of lead oxide electrodes, with improved characteristics and applications to some of today’s most pressing problems—wastewater treatment and energy production.
Author Contributions
Conceptualization, M.K., S.S. and D.S.; methodology, M.K. and S.S.; formal analysis, M.K., S.S., D.B.-B., A.Z.J., L.R., J.M., F.V. and D.S.; investigation, M.K., S.S., D.B.-B., A.Z.J., L.R., J.M., F.V. and D.S.; writing—original draft preparation, D.B.-B., M.K., J.M. and F.V.; writing—review and editing, J.M., F.V. and D.S.; visualization, M.K., S.S., J.M., F.V. and D.S.; supervision, J.M. and D.S.; project administration, D.S.; All authors have read and agreed to the published version of the manuscript.
Funding
The authors acknowledge the financial support from the Ministry of Science, Technological Development and Innovation of the Republic of Serbia (contract no.451-03-136/2025-03/200146; 451-03-66/2025-03/200168; 451-03-66/2025-03/200146; 451-03-65/2025-03/200146, and 451-03-66/2025-03/200146).
Data Availability Statement
Data are available on request to the corresponding author.
Conflicts of Interest
The authors declare no conflicts of interest.
References
- Merel, S.; Benzing, S.; Gleiser, C.; Di Napoli-Davis, G.; Zwiener, C. Occurrence and Overlooked Sources of the Biocide Carbendazim in Wastewater and Surface Water. Environ. Pollut. 2018, 239, 512–521. [Google Scholar] [CrossRef] [PubMed]
- Singh, S.; Singh, N.; Kumar, V.; Datta, S.; Wani, A.B.; Singh, D.; Singh, K.; Singh, J. Toxicity, Monitoring and Biodegradation of the Fungicide Carbendazim. Environ. Chem. Lett. 2016, 14, 317–329. [Google Scholar] [CrossRef]
- Wang, S.-Y.; Shi, X.-C.; Liu, F.-Q.; Laborda, P. Chromatographic Methods for Detection and Quantification of Carbendazim in Food. J. Agric. Food Chem. 2020, 68, 11880–11894. [Google Scholar] [CrossRef]
- Wang, D.; Yang, G.; Yun, X.; Luo, T.; Guo, H.; Pan, L.; Du, W.; Wang, Y.; Wang, Q.; Wang, P.; et al. Carbendazim Residue in Plant-Based Foods in China: Consecutive Surveys from 2011 to 2020. Environ. Sci. Ecotechnology 2024, 17, 100301. [Google Scholar] [CrossRef] [PubMed]
- Regulation-396/2005-EN-EUR-Lex. Available online: https://eur-lex.europa.eu/eli/reg/2005/396/oj (accessed on 25 July 2024).
- Zhou, T.; Guo, T.; Wang, Y.; Wang, A.; Zhang, M. Carbendazim: Ecological Risks, Toxicities, Degradation Pathways and Potential Risks to Human Health. Chemosphere 2023, 314, 137723. [Google Scholar] [CrossRef]
- Marković, M.; Jović, M.; Stanković, D.; Kovačević, V.; Roglić, G.; Gojgić-Cvijović, G.; Manojlović, D. Application of Non-Thermal Plasma Reactor and Fenton Reaction for Degradation of Ibuprofen. Sci. Total Environ. 2015, 505, 1148–1155. [Google Scholar] [CrossRef]
- Marković, A.; Savić, S.; Kukuruzar, A.; Konya, Z.; Manojlović, D.; Ognjanović, M.; Stanković, D.M. Differently Prepared PbO2/Graphitic Carbon Nitride Composites for Efficient Electrochemical Removal of Reactive Black 5 Dye. Catalysts 2023, 13, 328. [Google Scholar] [CrossRef]
- Jović, M.; Manojlović, D.; Stanković, D.; Dojčinović, B.; Obradović, B.; Gašić, U.; Roglić, G. Degradation of Triketone Herbicides, Mesotrione and Sulcotrione, Using Advanced Oxidation Processes. J. Hazard. Mater. 2013, 260, 1092–1099. [Google Scholar] [CrossRef]
- Savić, B.G.; Stanković, D.M.; Živković, S.M.; Ognjanović, M.R.; Tasić, G.S.; Mihajlović, I.J.; Brdarić, T.P. Electrochemical Oxidation of a Complex Mixture of Phenolic Compounds in the Base Media Using PbO2-GNRs Anodes. Appl. Surf. Sci. 2020, 529, 147120. [Google Scholar] [CrossRef]
- Temgoua, R.C.T.; Bussy, U.; Alvarez-Dorta, D.; Galland, N.; Hémez, J.; Thobie-Gautier, C.; Tonlé, I.K.; Boujtita, M. Using Electrochemistry Coupled to High Resolution Mass Spectrometry for the Simulation of the Environmental Degradation of the Recalcitrant Fungicide Carbendazim. Talanta 2021, 221, 121448. [Google Scholar] [CrossRef]
- Vlahović, F.; Ognjanović, M.; Djurdjić, S.; Kukuruzar, A.; Antić, B.; Dojčinović, B.; Stanković, D. Design of an Ethidium Bromide Control Circuit Supported by Deep Theoretical Insight. Appl. Catal. B Environ. 2023, 334, 122819. [Google Scholar] [CrossRef]
- Bian, X.; Xia, Y.; Zhan, T.; Wang, L.; Zhou, W.; Dai, Q.; Chen, J. Electrochemical Removal of Amoxicillin Using a Cu Doped PbO2 Electrode: Electrode Characterization, Operational Parameters Optimization and Degradation Mechanism. Chemosphere 2019, 233, 762–770. [Google Scholar] [CrossRef] [PubMed]
- Chen, J.; Xia, Y.; Dai, Q. Electrochemical Degradation of Chloramphenicol with a Novel Al Doped PbO2 Electrode: Performance, Kinetics and Degradation Mechanism. Electrochimica Acta 2015, 165, 277–287. [Google Scholar] [CrossRef]
- Dai, Q.; Xia, Y.; Sun, C.; Weng, M.; Chen, J.; Wang, J.; Chen, J. Electrochemical Degradation of Levodopa with Modified PbO2 Electrode: Parameter Optimization and Degradation Mechanism. Chem. Eng. J. 2014, 245, 359–366. [Google Scholar] [CrossRef]
- Moreira, F.C.; Boaventura, R.A.R.; Brillas, E.; Vilar, V.J.P. Electrochemical Advanced Oxidation Processes: A Review on Their Application to Synthetic and Real Wastewaters. Appl. Catal. B Environ. 2017, 202, 217–261. [Google Scholar] [CrossRef]
- da Costa, E.P.; Bottrel, S.E.C.; Starling, M.C.V.M.; Leão, M.M.D.; Amorim, C.C. Degradation of Carbendazim in Water via Photo-Fenton in Raceway Pond Reactor: Assessment of Acute Toxicity and Transformation Products. Environ. Sci. Pollut. Res. 2018, 26, 4324–4336. [Google Scholar] [CrossRef]
- Jović, M.; Stanković, D.; Manojlović, D.; Anđelković, I.; Milić, A.; Dojčinović, B.; Roglić, G. Study of the Electrochemical Oxidation of Reactive Textile Dyes Using Platinum Electrode. Int. J. Electrochem. Sci. 2013, 8, 16. [Google Scholar] [CrossRef]
- Bouya, H.; Errami, M.; Chakir, A.; Hammouti, B. Comparison of BDD and SnO2 Electrodes for Carbendazim Electro-Oxidation. Chem. Sci. Rev. Lett. 2014, 3, 151–158. [Google Scholar]
- Popov, N.; Ristić, M.; Bošković, M.; Perović, M.; Musić, S.; Stanković, D.; Krehula, S. Influence of Sn Doping on the Structural, Magnetic, Optical and Photocatalytic Properties of Hematite (α-Fe2O3) Nanoparticles. J. Phys. Chem. Solids 2022, 161, 110372. [Google Scholar] [CrossRef]
- Popov, N.; Krehula, S.; Ristić, M.; Kuzmann, E.; Homonnay, Z.; Bošković, M.; Stanković, D.; Kubuki, S.; Musić, S. Influence of Cr Doping on the Structural, Magnetic, Optical and Photocatalytic Properties of α-Fe2O3 Nanorods. J. Phys. Chem. Solids 2021, 148, 109699. [Google Scholar] [CrossRef]
- Andjelkovic, I.; Stankovic, D.; Nesic, J.; Krstic, J.; Vulic, P.; Manojlovic, D.; Roglic, G. Fe Doped TiO2 Prepared by Microwave-Assisted Hydrothermal Process for Removal of As(III) and As(V) from Water. Ind. Eng. Chem. Res. 2014, 53, 10841–10848. [Google Scholar] [CrossRef]
- Manojlović, D.; Lelek, K.; Roglić, G.; Zherebtsov, D.; Avdin, V.; Buskina, K.; Sakthidharan, C.; Sapozhnikov, S.; Samodurova, M.; Zakirov, R.; et al. Efficiency of Homely Synthesized Magnetite: Carbon Composite Anode toward Decolorization of Reactive Textile Dyes. Int. J. Environ. Sci. Technol. 2020, 17, 2455–2462. [Google Scholar] [CrossRef]
- Stanković, D.M.; Kukuruzar, A.; Savić, S.; Ognjanović, M.; Janković-Častvan, I.M.; Roglić, G.; Antić, B.; Manojlović, D.; Dojčinović, B. Sponge-like Europium Oxide from Hollow Carbon Sphere as a Template for an Anode Material for Reactive Blue 52 Electrochemical Degradation. Mater. Chem. Phys. 2021, 273, 125154. [Google Scholar] [CrossRef]
- Wang, K.; Xing, X.; Liu, W.; Jiang, Y.; Li, H.; Lu, Y.; Chen, H.; Ren, H. Fabrication of a Novel PbO2 Electrode with Rare Earth Elements Doping for p-Nitrophenol Degradation. J. Environ. Chem. Eng. 2023, 11, 109513. [Google Scholar] [CrossRef]
- Xu, X.; Wang, Y.; Zeng, W.; Gong, Y. Luminescence and Storage Properties of Sm-Doped Alkaline-Earth Atannates—IOPscience. J. Electrochem. Soc. 2011, 158, J305. [Google Scholar] [CrossRef]
- Wei, L.; Yang, Y.; Xia, X.; Fan, R.; Su, T.; Shi, Y.; Yu, J.; Li, L.; Jiang, Y. Band Edge Movement in Dye Sensitized Sm-Doped TiO2 Solar Cells: A Study by Variable Temperature Spectroelectrochemistry. RSC Adv. 2015, 5, 70512–70521. [Google Scholar] [CrossRef]
- Liu, Q.; Liu, Y.; Li, C.; Li, J.; He, H.; Li, Y.; Li, W. Hydrothermal Sm-Doped Tungsten Oxide Vertically Plate-like Array Photoelectrode and Its Enhanced Photoelectrocatalytic Efficiency for Degradation of Organic Dyes. J. Mater. Sci. Mater. Electron. 2016, 28, 4004–4013. [Google Scholar] [CrossRef]
- Wan, Y.; Xie, X.; Zhou, S.; Li, W.; Ma, J.; Zhou, Y.; Song, Y.; Zhou, J.; Pan, A. Sm Doping-Enhanced Li3VO4/C Electrode Kinetics for High-Performance Lithium-Ion Batteries. ACS Appl. Energy Mater. 2025, 8, 3581–3591. [Google Scholar] [CrossRef]
- Bibi, I.; Alrowaily, A.W.; Alotaibi, B.M.; Alyousef, H.A.; Alotiby, M.F.; Dahshan, A.; Ahmad, K.; Saleem, M. Sol–Gel Fabrication of Sm-Doped MnTiO3 Perovskite Electrode for Enhanced Oxygen Evaluation Reaction. Appl. Organomet. Chem. 2025, 39, e7850. [Google Scholar] [CrossRef]
- Narsimulu, D.; Rao, B.N.; Nagaraju, G.; Yu, J.S.; Satyanarayana, N. Enhanced Energy Storage Performance of Nanocrystalline Sm-Doped CoFe2O4 as an Effective Anode Material for Li-Ion Battery Applications. J. Solid State Electrochem. 2020, 24, 225–236. [Google Scholar] [CrossRef]
- Milikić, J.; Stojanović, S.; Damjanović-Vasilić, L.; Vasilić, R.; Rakočević, L.; Lazarević, S.; Šljukić, B. Porous Cerium-Zeolite Bifunctional ORR/OER Electrocatalysts in Alkaline Media. J. Electroanal. Chem. 2023, 944, 117668. [Google Scholar] [CrossRef]
- Milikić, J.; Knežević, S.; Ognjanović, M.; Stanković, D.; Rakočević, L.; Šljukić, B. Template-Based Synthesis of Co3O4 and Co3O4/SnO2 Bifunctional Catalysts with Enhanced Electrocatalytic Properties for Reversible Oxygen Evolution and Reduction Reaction. Int. J. Hydrog Energy 2023, 48, 27568–27581. [Google Scholar] [CrossRef]
- Andrić, S.; Milikić, J.; Sevim, M.; Santos, D.M.F.; Šljukić, B. Frontiers | Effect of Carbon Support on the Activity of Monodisperse Co45Pt55 Nanoparticles for Oxygen Evolution in Alkaline Media. Front. Chem. 2023, 11, 1244148. [Google Scholar] [CrossRef] [PubMed]
- Milikić, J.; Balčiūnaitė, A.; Sukackienė, Z.; Mladenović, D.; Santos, D.M.F.; Tamašauskaitė-Tamašiūnaitė, L.; Šljukić, B. Bimetallic Co-Based (CoM, M = Mo, Fe, Mn) Coatings for High-Efficiency Water Splitting. Materials 2020, 14, 92. [Google Scholar] [CrossRef]
- Milikić, J.; Stojanović, S.; Damjanović-Vasilić, L.; Vasilić, R.; Šljukić, B. Efficient Bifunctional Cerium-Zeolite Electrocatalysts for Oxygen Evolution and Oxygen Reduction Reactions in Alkaline Media. Synth. Met. 2023, 292, 117231. [Google Scholar] [CrossRef]
- Milikić, J.; Vasić, M.; Amaral, L.; Cvjetićanin, N.; Jugović, D.; Hercigonja, R.; Šljukić, B. NiA and NiX Zeolites as Bifunctional Electrocatalysts for Water Splitting in Alkaline Media. Int. J. Hydrog Energy 2018, 43, 18977–18991. [Google Scholar] [CrossRef]
- Gusmão, F.M.B.; Đurić, T.; Milikić, J.; Radinović, K.; Santos, D.M.F.; Stanković, D.; Šljukić, B. Transition Metal Polyoxometalates with Reduced Graphene Oxide for High-Performance Air-Electrode of Metal-Air Batteries. Int. J. Hydrog Energy 2024, 71, 763–774. [Google Scholar] [CrossRef]
- Duan, X.; Ma, F.; Yuan, Z.; Chang, L.; Jin, X. Comparative Studies on the Electro-Catalytic Oxidation Performance of Surfactant–Carbon Nanotube-Modified PbO2 Electrodes. J. Electroanal. Chem. 2012, 677–680, 90–100. [Google Scholar] [CrossRef]
- Parr, R.G.; Weitao, Y. Density-Functional Theory of Atoms and Molecules; Oxford University Press: Oxford, UK, 1994. [Google Scholar]
- Koch, W.; Max, C. Holthausen A Chemist’s Guide to Density Functional Theory, 2nd ed.; Wiley: Hoboken, NJ, USA, 2015. [Google Scholar]
- te Velde, G.; Bickelhaupt, F.M.; Baerends, E.J.; Fonseca Guerra, C.; van Gisbergen, S.J.A.; Snijders, J.G.; Ziegler, T. Chemistry with ADF. J. Comput. Chem. 2001, 22, 931–967. [Google Scholar] [CrossRef]
- te Velde, G.; Baerends, E.J. Precise Density-Functional Method for Periodic Structures. Phys. Rev. B 1991, 44, 7888–7903. [Google Scholar] [CrossRef]
- Philipsen, H.T.; Velde, G.T.; Baerends, E.J.; Berger, J.A.; de Boeij, P.L.; Franchini, M.; Groeneveld, J.A.; Kadantsev, E.S.; Klooster, R.; Kootstra, F.; et al. BAND 2024.1, SCM, Theoretical Chemistry; Vrije Universiteit: Amsterdam, The Netherlands, 2024. [Google Scholar]
- Perdew, J.P.; Burke, K.; Ernzerhof, M. Generalized Gradient Approximation Made Simple. Phys. Rev. Lett. 1996, 77, 3865–3868. [Google Scholar] [CrossRef] [PubMed]
- Perdew, J.P.; Ruzsinszky, A.; Csonka, G.I.; Vydrov, O.A.; Scuseria, G.E.; Constantin, L.A.; Zhou, X.; Burke, K. Restoring the Density-Gradient Expansion for Exchange in Solids and Surfaces. Phys. Rev. Lett. 2008, 100, 136406. [Google Scholar] [CrossRef] [PubMed]
- Kadantsev, E.S.; Klooster, R.; De Boeij, P.L.; Ziegler, T. The Formulation and Implementation of Analytic Energy Gradients for Periodic Density Functional Calculations with STO/NAO Bloch Basis Set. Mol. Phys. 2007, 105, 2583–2596. [Google Scholar] [CrossRef]
- Cuyacot, B.J.R.; Novotný, J.; Berger, R.J.F.; Komorovsky, S.; Marek, R. Relativistic Spin–Orbit Electronegativity and the Chemical Bond Between a Heavy Atom and a Light Atom. Chem.—Eur. J. 2022, 28, e202200277. [Google Scholar] [CrossRef]
- Raupach, M.; Tonner, R. A Periodic Energy Decomposition Analysis Method for the Investigation of Chemical Bonding in Extended Systems. J. Chem. Phys. 2015, 142, 194105. [Google Scholar] [CrossRef]
- Mitoraj, M.P.; Michalak, A.; Ziegler, T. A Combined Charge and Energy Decomposition Scheme for Bond Analysis. J. Chem. Theory Comput. 2009, 5, 962–975. [Google Scholar] [CrossRef]
- Mitoraj, M.; Michalak, A. Applications of Natural Orbitals for Chemical Valence in a Description of Bonding in Conjugated Molecules. J. Mol. Model. 2008, 14, 681–687. [Google Scholar] [CrossRef]
- Costantini, I.; Lottici, P.P.; Bersani, D.; Pontiroli, D.; Casoli, A.; Castro, K.; Madariaga, J.M. Darkening of Lead- and Iron-Based Pigments on Late Gothic Italian Wall Paintings: Energy Dispersive X-Ray Fluorescence, μ-Raman, and Powder X-Ray Diffraction Analyses for Diagnosis: Presence of β-PbO2 (Plattnerite) and α-PbO2 (Scrutinyite). J. Raman Spectrosc. 2020, 51, 680–692. [Google Scholar] [CrossRef]
- Balachandran, U.; Eror, N.G. Raman Spectra of Titanium Dioxide. J. Solid State Chem. 1982, 42, 276–282. [Google Scholar] [CrossRef]
- Dan, Y.; Lu, H.; Liu, X.; Lin, H.; Zhao, J. Ti/PbO2 + Nano-Co3O4 Composite Electrode Material for Electrocatalysis of O2 Evolution in Alkaline Solution. Int. J. Hydrog Energy 2011, 36, 1949–1954. [Google Scholar] [CrossRef]
- Comisso, N.; Armelao, L.; Cattarin, S.; Fasolin, S.; Mattarozzi, L.; Musiani, M.; Rancan, M.; Vázquez-Gómez, L.; Verlato, E. Deposition of FeOOH Layers onto Porous PbO2 by Galvanic Displacement and Their Use as Electrocatalysts for Oxygen Evolution Reaction. J. Electroanal. Chem. 2021, 880, 114844. [Google Scholar] [CrossRef]
- Shamsi, F.; Rezaei, M. Anodic Electrodeposition of PbO2 on ATO/Ti with Simultaneous Doping of F, Co, and Fe as Super-Hydrophilic, Highly Active, and Durable Electrocatalyst for Oxygen Evolution Reaction in Acidic Solution. Colloids Surf. Physicochem. Eng. Asp. 2023, 670, 131608. [Google Scholar] [CrossRef]
- Kong, J.; Shi, S.; Kong, L.; Zhu, X.; Ni, J. Preparation and Characterization of PbO2 Electrodes Doped with Different Rare Earth Oxides. Electrochimica Acta 2007, 53, 2048–2054. [Google Scholar] [CrossRef]
- Zhang, Y.; He, P.; Jia, L.; Li, C.; Liu, H.; Wang, S.; Zhou, S.; Dong, F. Ti/PbO2-Sm2O3 Composite Based Electrode for Highly Efficient Electrocatalytic Degradation of Alizarin Yellow R. J. Colloid Interface Sci. 2019, 533, 750–761. [Google Scholar] [CrossRef]
- Gržeta, B.; Tkalčec, E.; Goebbert, C.; Takeda, M.; Takahashi, M.; Nomura, K.; Jakší, M. Structural Studies of Nanocrystalline SnO2 Doped with Antimony: XRD and Mössbauer Spectroscopy. J. Phys. Chem. Solids 2002, 63, 765–772. [Google Scholar] [CrossRef]
- Akgul, F.A.; Gumus, C.; Er, A.O.; Farha, A.H.; Akgul, G.; Ufuktepe, Y.; Liu, Z. Structural and Electronic Properties of SnO2. J. Alloys Compd. 2013, 579, 50–56. [Google Scholar] [CrossRef]
- Tigau, N.; Ciupina, V.; Prodan, G.; Rusu, G.I.; Vasile, E. Structural Characterization of Polycrystalline Sb2O3 Thin Films Prepared by Thermal Vacuum Evaporation Technique. J. Cryst. Growth 2004, 269, 392–400. [Google Scholar] [CrossRef]
- Ghosh, P.; Kundu, S.; Kar, A.; Ramanujachary, K.V.; Lofland, S.; Patra, A. Synthesis and Characterization of Different Shaped Sm2O3 Nanocrystals. J. Phys. Appl. Phys. 2010, 43, 405401. [Google Scholar] [CrossRef]
- Molla, M.A.I.; Yanagi, G.; Furukawa, M.; Tateishi, I.; Katsumata, H.; Kaneco, S. Optimization of Operating Conditions for Electrochemical Decolorization of Methylene Blue with Ti/α-PbO2/β-PbO2 Composite Electrode. J. Compos. Sci. 2021, 5, 117. [Google Scholar] [CrossRef]
- Yang, H.; Zhou, Y.; Chen, K.; Yu, X.; Sun, F.; Wang, M.; Cheng, Z.; Zhang, J.; Niu, Q.J. Effects of PbO2/Pb3O4 Ratio Alteration for Enhanced Electrochemical Advanced Oxidation Performance. J. Solid State Chem. 2021, 301, 122277. [Google Scholar] [CrossRef]
- Nenadović, S.S.S.; Kljajević, L.M.; Ivanović, M.M.; Mirković, M.M.; Radmilović, N.; Rakočević, L.Z.; Nenadović, M.T. Structural and Chemical Properties of Geopolymer Gels Incorporated with Neodymium and Samarium. Gels 2021, 7, 195. [Google Scholar] [CrossRef] [PubMed]
- Scanlon, D.O.; Kehoe, A.B.; Watson, G.W.; Jones, M.O.; David, W.I.F.; Payne, D.J.; Egdell, R.G.; Edwards, P.P.; Walsh, A. Nature of the Band Gap and Origin of the Conductivity of PbO2 Revealed by Theory and Experiment. Phys. Rev. Lett. 2011, 107, 246402. [Google Scholar] [CrossRef]
- Payne, D.J.; Paolicelli, G.; Offi, F.; Panaccione, G.; Lacovig, P.; Beamson, G.; Fondacaro, A.; Monaco, G.; Vanko, G.; Egdell, R.G. A Study of Core and Valence Levels in β-PbO2 by Hard X-Ray Photoemission. J. Electron Spectrosc. Relat. Phenom. 2009, 169, 26–34. [Google Scholar] [CrossRef]
- Wang, X.; Wang, J.; Jiang, W.; Chen, C.; Wei, J.; Yu, B.; Chen, B.; Xu, R.; Yang, L. MnCo2O4 Decorating Porous PbO2 Composite with Enhanced Activity and Durability for Acidic Water Oxidation. Fuel 2023, 338, 127344. [Google Scholar] [CrossRef]
- Yang, H.; Liang, J.; Zhang, L.; Liang, Z. Electrochemical Oxidation Degradation of Methyl Orange Wastewater by Nb/PbO2 Electrode. Int. J. Electrochem. Sci. 2016, 11, 1121–1134. [Google Scholar] [CrossRef]
- Man, S.; Luo, D.; Sun, Q.; Yang, H.; Bao, H.; Xu, K.; Zeng, X.; He, M.; Yin, Z.; Wang, L.; et al. When MXene (Ti3C2Tx) Meet Ti/PbO2: An Improved Electrocatalytic Activity and Stability. J. Hazard. Mater. 2022, 430, 1–14. [Google Scholar] [CrossRef]
- Lyu, J.; Han, H.; Wu, Q.; Ma, H.; Ma, C.; Dong, X.; Fu, Y. Enhancement of the Electrocatalytic Oxidation of Dyeing Wastewater (Reactive Brilliant Blue KN-R) over the Ce-Modified Ti-PbO2 Electrode with Surface Hydrophobicity. J. Solid State Electrochem. 2019, 23, 847–859. [Google Scholar] [CrossRef]
- Sun, L.; Zhou, L.; Yang, C.; Yuan, Y. CeO2 Nanoparticle-Decorated Reduced Graphene Oxide as an Efficient Bifunctional Electrocatalyst for Oxygen Reduction and Evolution Reactions. Int. J. Hydrog Energy 2017, 42, 15140–15148. [Google Scholar] [CrossRef]
- Milikić, J.; Fuentes, R.O.; Tasca, J.E.; Santos, D.M.F.; Šljukić, B.; Figueiredo, F.M.L. Nickel-Doped Ceria Bifunctional Electrocatalysts for Oxygen Reduction and Evolution in Alkaline Media. Batteries 2022, 8, 100. [Google Scholar] [CrossRef]
- Kapałka, A.; Fóti, G.; Comninellis, C. Determination of the Tafel Slope for Oxygen Evolution on Boron-Doped Diamond Electrodes. Electrochem. Commun. 2008, 10, 607–610. [Google Scholar] [CrossRef]
- Lai, Y.; Li, Y.; Jiang, L.; Xu, W.; Lv, X.; Li, J.; Liu, Y. Electrochemical Behaviors of Co-Deposited Pb/Pb-MnO2 Composite Anode in Sulfuric Acid Solution—Tafel and EIS Investigations. J. Electroanal. Chem. 2012, 671, 16–23. [Google Scholar] [CrossRef]
- Mladenović, D.; Daş, E.; Santos, D.M.F.; Bayrakçeken Yurtcan, A.; Šljukić, B. Highly Efficient Oxygen Electrode Obtained by Sequential Deposition of Transition Metal-Platinum Alloys on Graphene Nanoplatelets. Materials 2023, 16, 3388. [Google Scholar] [CrossRef] [PubMed]
- Omari, E.; Omari, M. Cu-Doped GdFeO3 Perovskites as Electrocatalysts for the Oxygen Evolution Reaction in Alkaline Media. Int. J. Hydrog Energy 2019, 44, 28769–28779. [Google Scholar] [CrossRef]
- Duan, X.; Ma, F.; Yuan, Z.; Chang, L.; Jin, X. Electrochemical Degradation of Phenol in Aqueous Solution Using PbO2 Anode. J. Taiwan Inst. Chem. Eng. 2013, 44, 95–102. [Google Scholar] [CrossRef]
- Zhong, C.; Wei, K.; Han, W.; Wang, L.; Sun, X.; Li, J. Electrochemical Degradation of Tricyclazole in Aqueous Solution Using Ti/SnO2–Sb/PbO2 Anode. J. Electroanal. Chem. 2013, 705, 68–74. [Google Scholar] [CrossRef]
- Yao, Y.; Li, M.; Yang, Y.; Cui, L.; Guo, L. Electrochemical Degradation of Insecticide Hexazinone with Bi-Doped PbO2 Electrode: Influencing Factors, Intermediates and Degradation Mechanism. Chemosphere 2019, 216, 812–822. [Google Scholar] [CrossRef]
- Yang, Y.; Xia, Y.; Wei, F.; Zhang, L.; Yao, Y. Electrochemical Oxidation of the Pesticide Nitenpyram Using a Gd-PbO2 Anode: Operation Parameter Optimization and Degradation Mechanism. J. Chem. Technol. Biotechnol. 2020, 95, 2120–2128. [Google Scholar] [CrossRef]
- Yao, Y.; Teng, G.; Yang, Y.; Huang, C.; Liu, B.; Guo, L. Electrochemical Oxidation of Acetamiprid Using Yb-Doped PbO2 Electrodes: Electrode Characterization, Influencing Factors and Degradation Pathways. Sep. Purif. Technol. 2019, 211, 456–466. [Google Scholar] [CrossRef]


Disclaimer/Publisher’s Note: The statements, opinions and data contained in all publications are solely those of the individual author(s) and contributor(s) and not of MDPI and/or the editor(s). MDPI and/or the editor(s) disclaim responsibility for any injury to people or property resulting from any ideas, methods, instructions or products referred to in the content. |
© 2025 by the authors. Licensee MDPI, Basel, Switzerland. This article is an open access article distributed under the terms and conditions of the Creative Commons Attribution (CC BY) license (https://creativecommons.org/licenses/by/4.0/).