Abstract
Along with technology development and market change, automated production should be made easier and more intelligent to promote production efficiency and product quality as well as reduce labor and production costs. The introduction of the Internet of Things (IoT) is an important issue in automated processing. This study aims to apply the Industrial Internet of Things (IIoT) to automated processing systems for real-time monitoring of the condition of production lines and analyze the causal relationship between vibration, surface roughness, tool wear, and take successive milling of medium carbon steel workpieces as a case study. First, automated processing hardware equipment is set up, and software and hardware are required for installing IIoT; then, the IoT App is designed. Second, successive automated processing experiments are preceded. The Taguchi method is utilized in the processing process to find optimized cutting parameters to be the parameter setting values for successive cutting. Three accelerometers are used to detect vibration changes in the cutting process; meanwhile, IIoT is introduced to monitor the condition of the production line. Finally, Using big data analytics acquired in the experiments to verify the processing quality under optimized cutting parameters could make a 4.516% improvement and obtain the vibration value for the best tool change during successive processing as well as to realize the obtainment of current processing information through IIoT. The system would deliver tool change or processing abnormality alerts to users for real-time condition exclusion. To achieve the goal of remote monitoring and intelligent automatic processing.
1. Introduction
Reducing costs with mass production is taken into account in a traditional industry, and substantial changes also appear in the industry along with time changes. However, increasing labor and raw material costs cause pressure for businesses. To cope with network technology and rapid circulation of information, product novelty, diversity, and uniqueness have become the goals pursued by consumers. The introduction of the Internet of Things (IoT) into machining becomes an important issue.
The Automatic Identification Center at the Massachusetts Institute of Technology proposed the idea of frequency identification IoT in 1999, with the major functions of data collection, processing, and transmission as well as information application [1]. Through the upgrade and innovation of various types of sensing equipment in past years, IoT became a system calculating the mutual association among devices, machinery, and digital machines. Under the IoT structure, people could apply electronic shelf labels to connect real objects to the Internet. Simply speaking, it allowed things to be uploaded to the Internet for reading or delivering information as well as smooth communications between things and things or things and people [2]. The initial practice of IoT was realized in 1998. A Coke vending machine could connect to the Internet, and the quantity of Coke in the vending machine could be checked [3]. Along with the evolution of smaller and stronger processing units, IoT was generally applied to transportation logistics, industrial manufacturing, health care, individuals, or society [4,5].
The emergency of Industry 4.0 in 2013 integrated smart digital technology into manufacturing and industrial processes, covering a series of virtual and real technologies, like the Internet of Things (IoT), AI, Big Data, Robot, and automation, to realize smart manufacturing, smart decision-making for supply chain operation, and customization, so as to promote productivity, efficiency, and flexibility. Such technologies were not simply used in processing monitoring and measurement; manufacturers could also analyze and track big data acquired from the entire production process through IoT-related technologies to realize process optimization and achieve the best product output [6,7,8]. For this reason, companies presently seeking competitive advantage positively search for technologies provided by IoT to achieve the predictive maintenance of equipment. Businesses of logistics supply, workflow, and product delivery are quantized for easy engineering and logistics control and to reduce the risks of manual control [9].
In recent years, the Internet of Things (IoT) technology also has been widely applied in cutting processes. The following summarizes several research findings in this domain: Sisinni et al. explored the challenges and applications of industrial IoT, providing valuable insights into the monitoring and optimization of cutting processes in smart manufacturing [10]. Qazi et al., while focusing primarily on smart agriculture, discussed the inspirational value of integrating IoT technology with artificial intelligence for cutting applications [11]. Chen et al. introduced methods for real-time monitoring of cutting conditions using IoT technology [12]. Xu et al. examined the future prospects of IoT in cyber-physical systems [13]. Borghesi et al. introduce ExaMon-X, a suite of functionalities for predictive maintenance in high-performance computing systems developed using machine learning techniques [14].
These studies cover various advancements in cutting applications, ranging from real-time monitoring to edge computing, demonstrating both the potential and challenges of IoT technology. However, limited research has explored the relationship between IoT technology and cutting process parameters such as vibration, surface roughness, and tool change timing.
The Taguchi method has gained widespread recognition as an effective statistical approach for optimizing machining and cutting processes. Developed by Genichi Taguchi, this methodology enhances quality by minimizing variability and improving performance through robust experimental design. The application of this method in cutting processes has demonstrated significant improvements in surface roughness, tool wear, and cutting efficiency, making it an invaluable tool for modern manufacturing.
Over the past few years, researchers have extensively utilized the Taguchi method to optimize cutting parameters in various machining operations, including turning, milling, electric discharge machining (EDM), and laser cutting.
Bhavani et al. [15] employed this technique to determine optimal cutting speed, feed rate, and depth of cut, leading to reduced surface roughness. Bhaskar Mutyalu et al. [16] used the Taguchi method to cut parameters that are varied to observe performance characteristics and find optimal outcomes. Bouhali et al. found that the depth of cut is the most effective cutting parameter, influencing both surface roughness and cutting temperature, and developed mathematical models to predict surface roughness and cutting temperature and select the most favorable cutting parameters [17]. Nguyen et al. [18] expanded this approach to laser cutting of stainless steel, optimizing process conditions through a combined Taguchi and response surface methodology framework. Singh et al. [19,20] conducted in-depth research on the application of enhanced hybrid aluminum matrix composites and proposed the optimal process parameters for EDM using the Taguchi technique, followed by an Analysis of Variance and confirmatory tests when machining a newly developed hybrid aluminum metal matrix composite. The results indicated that the material removal rate (MRR) increased with higher pulse-on time and current but decreased with higher voltage. Lower surface roughness was achieved when current, voltage, and pulse duration were minimized. Additionally, the choice of electrode material significantly influenced both MRR and surface roughness.
These studies collectively underscore the importance of the Taguchi method in refining cutting processes, reducing production costs, and improving overall machining efficiency. As manufacturing industries continue to demand higher precision and quality, advanced optimization techniques like the Taguchi method become increasingly crucial.
Dry cutting machining generally refers to machining performed with little to no cutting fluid. This method is significant in reducing environmental impact, lowering costs, and improving production efficiency. In recent years, research on the technology in dry cutting, such as Gintin et al., focused on the machined surface integrity of titanium alloy under the dry milling process [21], Pereira et al. discussed tool wear in dry helical milling for hardened steels [22], and Caggiano et al. presented dry milling in carbon fiber [23]. Research by Dudzinski et al. reviews the developments towards dry and high-speed machining for difficult-to-machine materials [24]. Furthermore, reviews like Yu et al. emphasized the machinability of difficult-to-machine alloys with advanced lubricating and cooling techniques [25]. Selvan et al. [26] explore these advancements, examining various strategies that researchers have investigated to enhance the efficiency and reliability of dry cutting techniques. Chen et al. also conducted research on automated dry milling and obtained the relationship between optimized dry milling parameters and vibration, noise, and processing quality [27,28].
Smart manufacturing has emerged as a transformative paradigm in the era of Industry 4.0, integrating advanced digital technologies to enhance production efficiency, precision, and sustainability. The advent of data-driven approaches, artificial intelligence (AI), and cyber-physical systems has revolutionized industrial processes, enabling real-time monitoring, optimization, and decision-making. Among these technological advancements, intelligent 3D surface measurement has gained significant attention for its potential to improve manufacturing accuracy and quality assurance. Yang et al. (2021) [29] reviewed the recent developments in data-driven intelligent 3D surface measurement and highlighted its impact on smart manufacturing, emphasizing the role of AI and machine learning (ML) in improving measurement precision and efficiency.
Another key aspect of smart manufacturing is the integration of machine learning for process optimization. Tseng et al. (2021) [30] proposed a smart tool holder calibrated by ML techniques to measure cutting forces in fine-turning operations. Their study demonstrated the effectiveness of ML-based calibration in enhancing the accuracy of machining processes, which is crucial for improving product quality and reducing waste. Additionally, the concept of digital twins has gained traction as a powerful tool for simulating and controlling manufacturing environments. Mattila et al. (2022) [31] explored the use of digital twin documents in smart factories, utilizing simulation frameworks such as ROS, Gazebo, and Twinbase to enhance system control and efficiency. Their findings underscored the importance of digital twins in enabling predictive maintenance, process optimization, and seamless integration of cyber-physical systems.
Sustainability is another critical aspect driving advancements in smart manufacturing. Celent et al. (2023) [32] investigated the use of compressed cold air-cooling via vortex tubes in hard milling processes, demonstrating its potential to reduce thermal damage and extend tool life while maintaining machining efficiency. Their research aligns with the growing emphasis on sustainable manufacturing practices that minimize environmental impact. Furthermore, the integration of cloud computing in manufacturing has facilitated data-driven decision making and improved resource allocation. Dani et al. (2023) [33] introduced a cloud-empowered data-centric paradigm, illustrating how cloud-based frameworks enhance connectivity, scalability, and real-time analytics in smart manufacturing.
In light of these developments, this study aims to combine cyber-physical technologies of the robot arm, CNC milling machine, and Internet of Things to build the IIoT automated processing system, allowing users, through control computers, the real-time monitoring of the processing machine on the production line and collection of the vibration value and relevant data during processing in order to provide correct tool-change time and achieve the objective of maintaining product quality. Finally, successive automated processing experiments are preceded to verify the improvement in processing quality, real-time monitor the conditions of the production line, and send tool change or processing abnormality alerts to users for real-time condition exclusion. It is expected that the research results could provide a useful reference for IoT intelligent automated processing and predictive maintenance.
2. Experimental System
The experimental system architecture in this study comprises hardware architecture, software architecture, and system integration, with details provided below.
2.1. Hardware Architecture
Figure 1 presents the main hardware components. The primary hardware architecture consists of a mobile robot arm, with the FANUC M-10iA/12M robot arm (for Japan) mounted on a mobile platform. The system also includes a CNC milling machine (YCM NXV 600A model, for Taiwan), a Pro-face GP-4402W human–machine interface (HMI, for Japan) by Schneider Electric for system interaction and control, accelerometers by MEGGITT Wilcoxon Research model 785A (for USA), and an ADVANTECH MIC-7700 industrial PC (for Taiwan). During the milling process, the mobile robot arm autonomously picks and places workpieces.
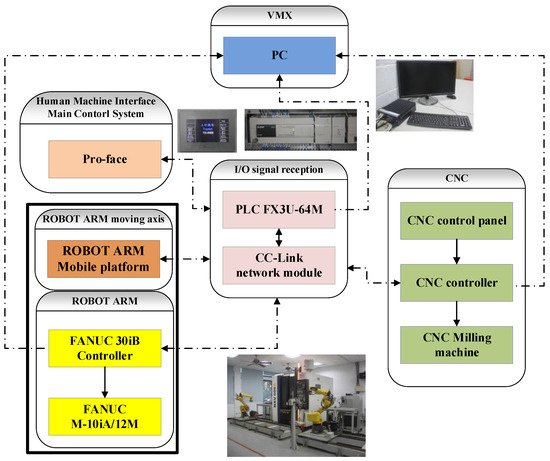
Figure 1.
Experimental field and main hardware architecture.
An FX3U-64M programmable logic controller (PLC, for Japan) with an FX3U-16CCL-M CC-Link module is employed, facilitating communication and control of the entire production line through the HMI. Additionally, this research integrates the Industrial Internet of Things (IIoT) platform, Virtual Multiple Extend (VMX), to manage system communication and engineering data, achieving automated processing, remote monitoring, and control. The experimental field and setup are also depicted in Figure 1.
2.2. Software Architecture
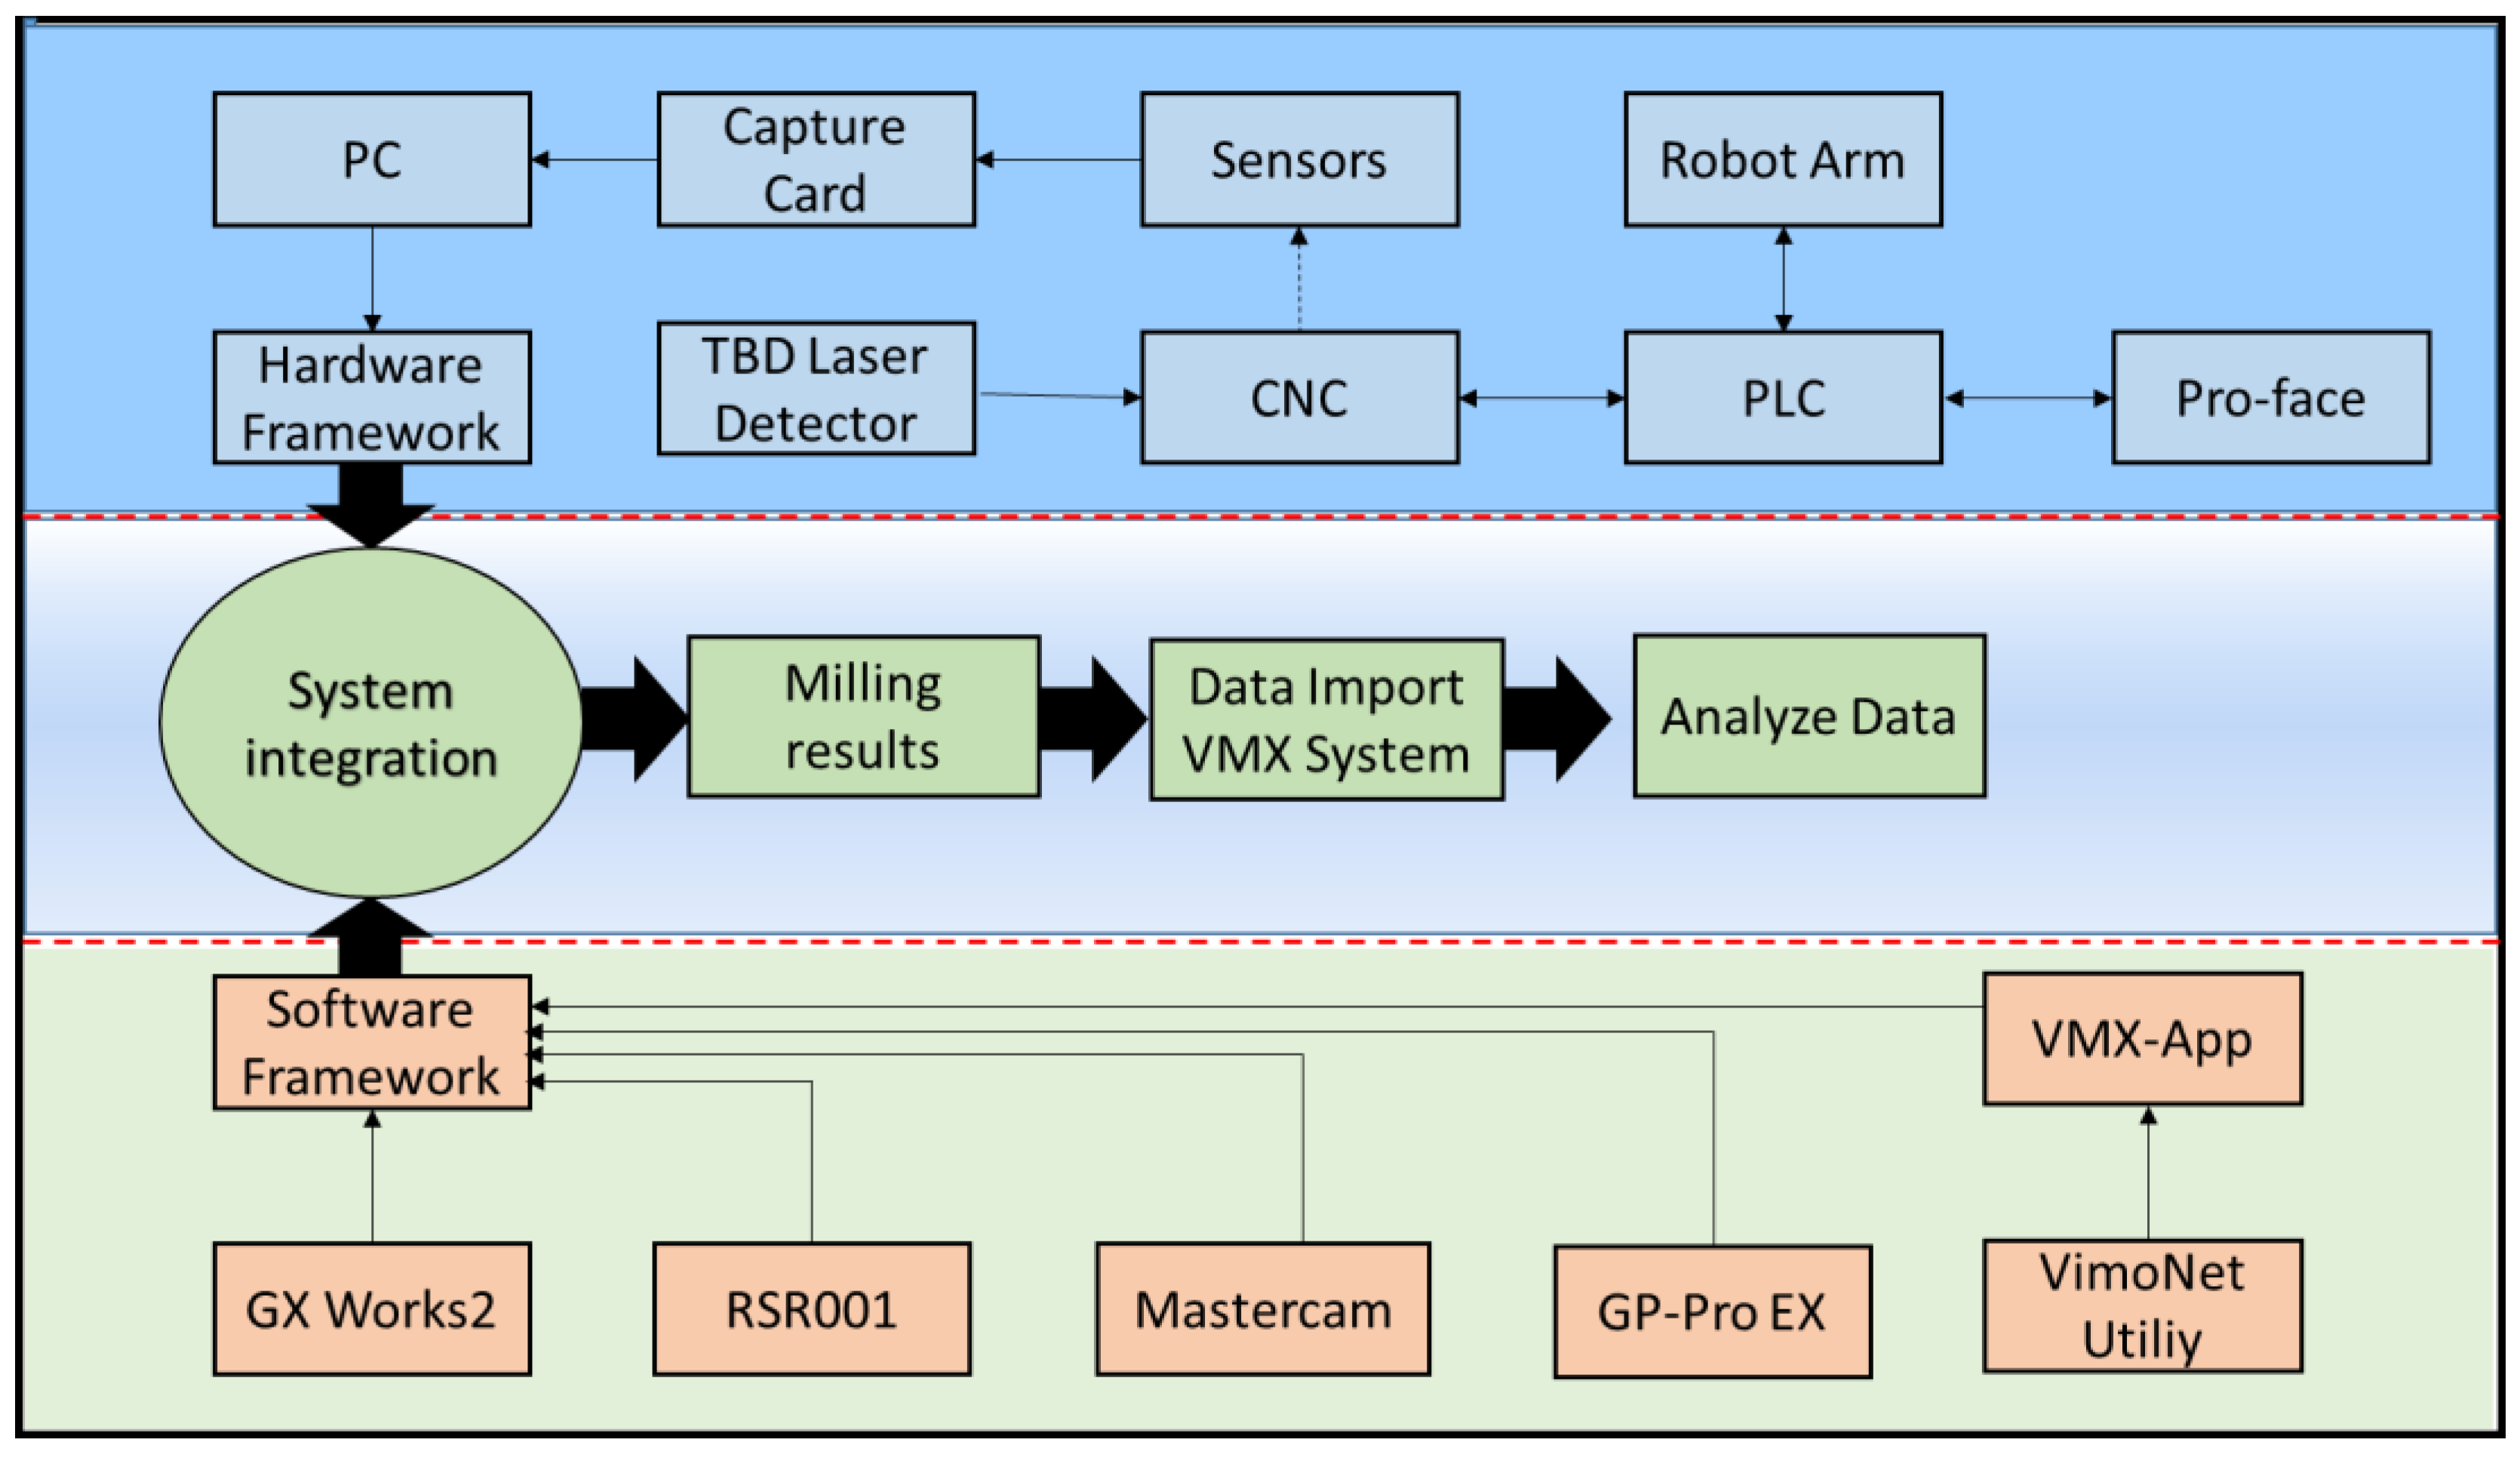
Figure 2 illustrates the experimental software architecture along with its corresponding hardware components. The system operates as follows: the CNC machining process, including toolpath planning and cutting parameters, is designed using Mastercam, which also compiles the necessary NC code. Production line control programs are developed using GX Works2, a PLC engineering software, to enable seamless collaboration between the robotic arm and the machining system.
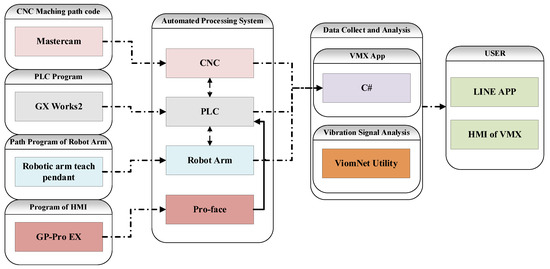
Figure 2.
Main experimental software architecture and its corresponding hardware equipment.
The robotic arm’s movements are programmed via the FANUC teaching pendant, while the Pro-face HMI programming software (GP-Pro EX Ver. 4.08.2) is utilized for designing and configuring the human–machine interface. Communication between the HMI and the system, as well as data acquisition and analysis for the VMX platform, is achieved through custom applications developed in C#. VMX offers flexible configuration options, allowing developers to customize interfaces and functionalities as needed while also facilitating data transmission to databases and mobile applications.
Additionally, the robotic arm teaching pendant enables operators to program applications and remotely control the robot’s movements.
Industrial Internet of Things (IIoT) platform VMX, a technology developed by Industrial Technology Research Institute (ITRI), Taiwan, for the application in intelligent factories, originated from the cross-controller communication module built in the process when ITRI developed intelligent software and was constantly included core functions of geometrical computation sensing analysis, aiming to provide a simplified development environment for machine tool intelligent software developers reducing the software development and maintenance costs. The core technologies of VMX contained digital design, digital manufacturing, intelligent factor software, precision measurement, robot arm, and SMB (Server Message Block) data exchange deepening, where the establishment of SMB and cloud service allowed adding or adjusting the connection target of SMB, controlling the designation of SMB uploaded data, and updating SMB on the cloud to achieve the remote adjustment of intelligent equipment setting and satisfy customer needs. VMX IIoT, in experiments, was the platform for receiving and analyzing processing machine data. The user end could self-design customized Apps and introduce experimental data into the platform to achieve the objectives of remote monitoring and intelligent manufacturing [16]. This study also involves designing and developing applications related to automated machining monitoring and control using the C# programming language on the platform.
2.3. System Integration
Figure 3 shows the IIoT and automatic milling integrated system. The automated processing procedure consists of several sequential steps. Initially, the robotic arm’s gripper retrieves the workpiece from the material feeder. The robotic arm, maneuvering along the walking axis, transports the workpiece to the fixture of the CNC milling machine. Once securely clamped, the robotic arm withdraws from the machining zone, allowing the CNC milling machine to commence the cutting process autonomously. Upon completion, the robotic arm retrieves the processed workpiece and transfers it to the stock rack, thus, completing the automation cycle.
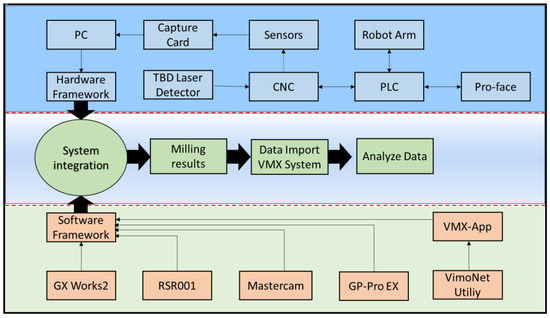
Figure 3.
IIoT and automatic milling integrated system.
To ensure machining stability, a TBD tool breakage detection unit, and three industrial accelerometer sensors (model 785A) are deployed during the dry cutting process. The TBD tool breakage detection unit (HS version), manufactured by MARPOSS Corp. (from Italy), is utilized for tool failure identification. Accelerometers produced by MEGGITT Wilcoxon Research are used to detect vibration changes in the cutting process. Additionally, the Industrial IoT platform VMX integrates cutting information from the automated processing system, facilitating remote monitoring and control of the entire machining process.
3. Materials and Methods
The experiment planning in this study is sequenced by selecting tools and materials required for the experiment, design of Mastercam cutting shape and path arrangement, setting up of Industrial Internet of Things (IIoT) VMX and Apps design, factor, and level design for the Taguchi Method, preceding cutting experiment, acquiring optimized parameters for the cutting between selected tools and materials, preceding automated successive cutting under the conditions of optimized parameters, measuring the surface roughness of the workpiece, and introducing vibration data into VMX platform to achieve the effect of IoT monitoring, as well as data analysis and discussion.
3.1. Experimental Materials and Tools
An S45C mild carbon steel cylinder with a hardness of about HRC55, shape diameter of 65 mm, and height of 55 mm is selected as the workpiece material for this study. Solid carbide end mills with 4-flute, mill helix angle 45°, and diameter ψ6.0 mm from JIA DIAN PRECISE ENTERPRISE CO., LTD. (for Taiwan), model number 450-BC06064, are selected as the tool.
3.2. Mastercam Processing Path Planning
For stability and consistency in the processing process, Mastercam is used for planning the processing path. The processing path in this study is planned clockwise rotated cutting, and dynamic milling is utilized for cutting. The tool, before contacting the workpiece, is blank running for a distance to reduce the effect of backlash. The experimental materials are processed with a reference machining plane before dry milling in order to achieve the authenticity and stability of the milling experiment. Figure 4 shows the Mastercam path planning diagram.
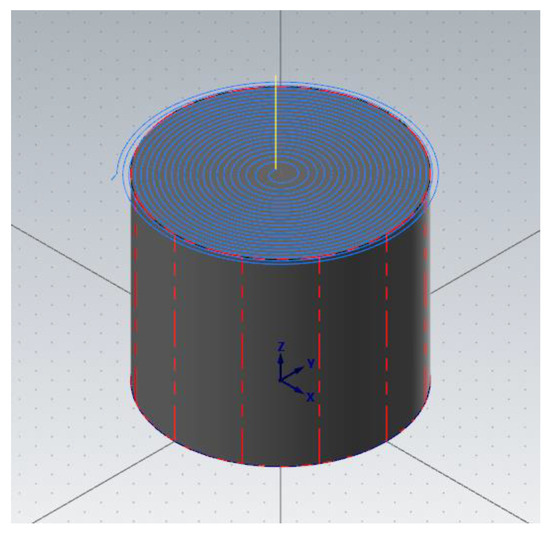
Figure 4.
Mastercam processing path planning.
3.3. VMX App Design
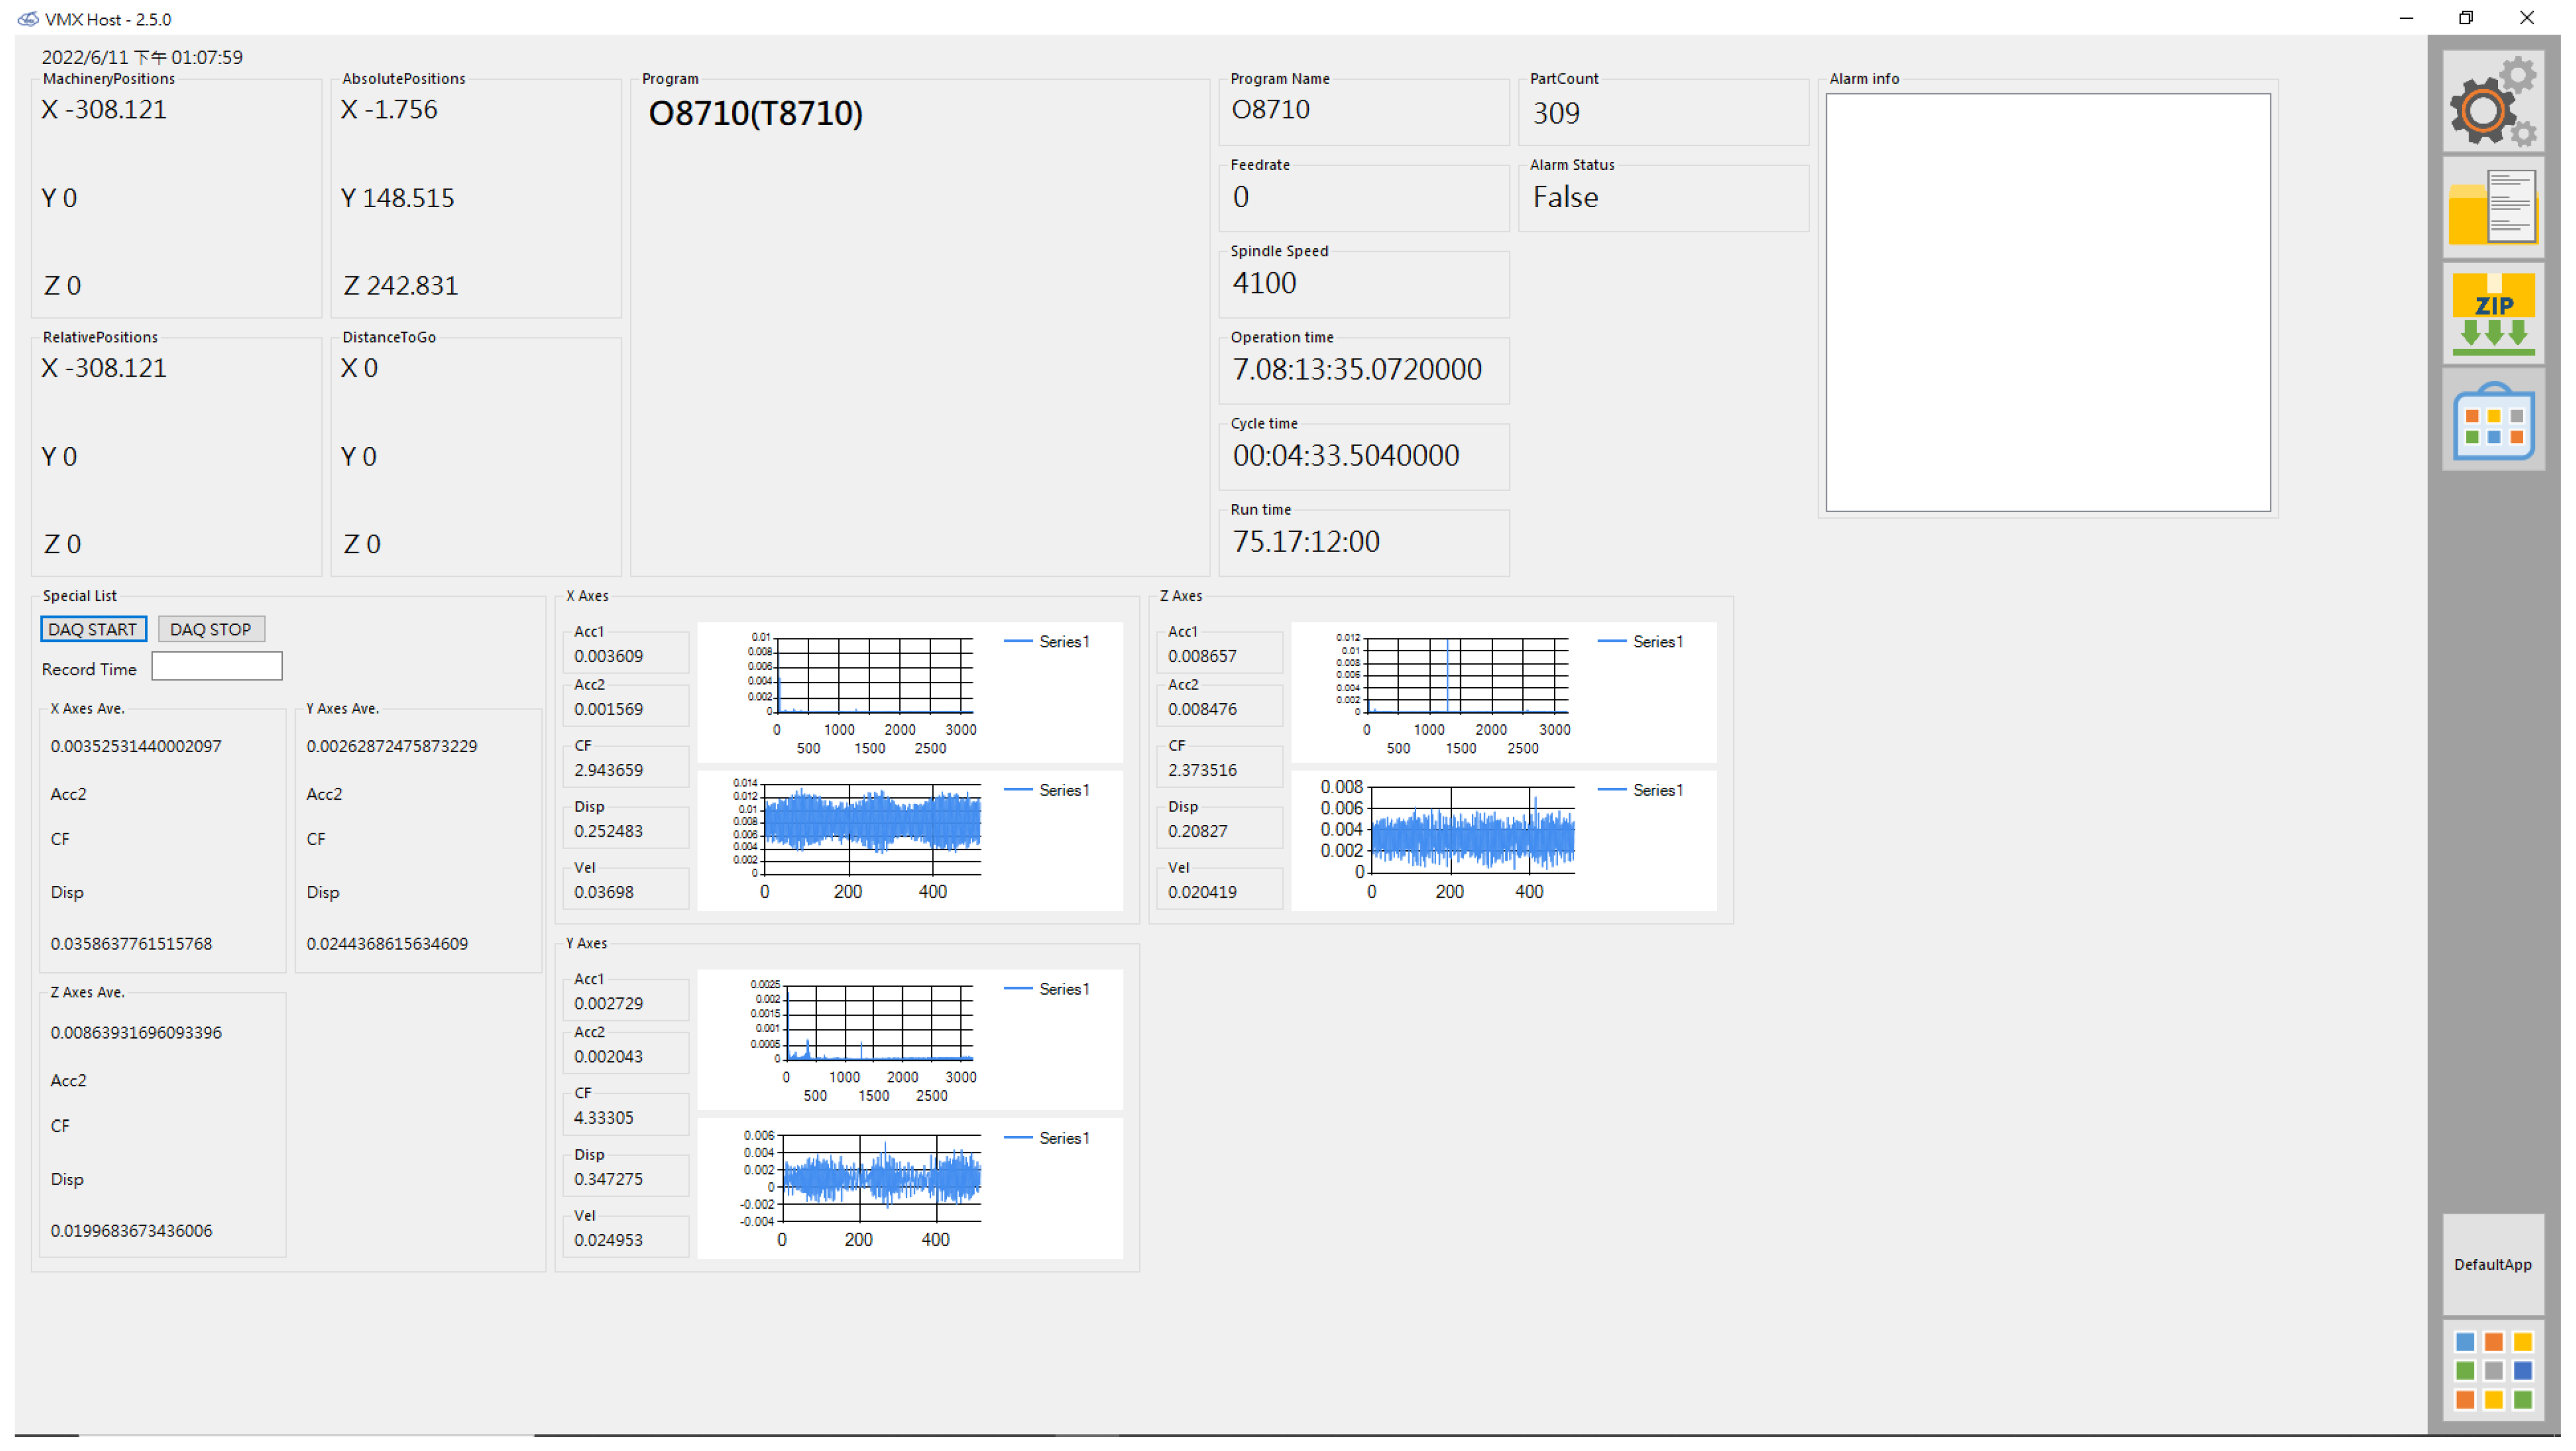
The VMX App, designed with C# language, simulates the interface of the CNC automated processing machine control panel, i.e., to clearly see the mechanical coordinates, absolute coordinates, relative coordinates, and processing path distance of the CNC processing machine on the human–machine interface, so as to achieve a more user-friendly human–machine interface. It allows users to confirm the processing NC code, rotational speed, and feed rate on the interface to understand the procedure executed by the processing machine exactly. In addition, the processing information of the processing machine, such as the total turn-on time, current processing time, and total processing times, are also recorded on the interface.
The accelerometers installed on the CNC machine are used to sense vibration during the processing process. The vibration data are then transmitted to the PC through a capture card to monitor the vibration conditions of acceleration, speed, and displacement on the X-, Y-, and Z-axis of the CNC machine tool spindle through the IoT human–machine interface. Moreover, the App design could convert recorded values into text files for further analyses. Figure 5 shows the diagram of the human–machine interface in the VMX App.
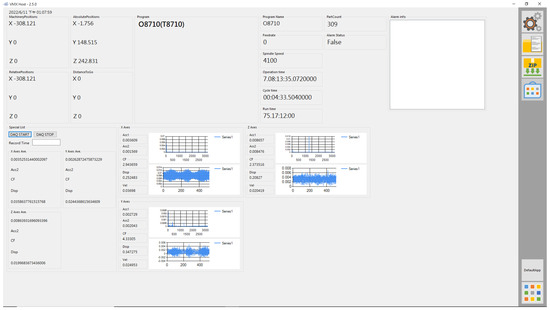
Figure 5.
HMI of experimental system with the VMX.
3.4. Taguchi Methods Orthogonal Array Design
In this research, spindle speed (S), feed per tooth (F), radial cutting depth (R), and axial cutting depth (A) are selected as the experimental control factors. Based on the processing parameter range recommended by the tool supplier, each factor is assigned three levels, as shown in Table 1. To minimize the number of experiments and simplify data analysis, an L9(34) orthogonal array (Table 2) is used for experimental design. Table 2 presents the configuration of the control factors, detailing nine unique parameter combinations. For each combination, surface roughness is measured three times, and the average of these measurements is used for analysis, as described in detail in Section 4. The objective of this experiment is to determine the optimal cutting parameters.

Table 1.
Control factors and their levels.
Table 2.
Experimental set: Orthogonal table L9(34) assignment of control factors.
3.5. Automatic Successive Cutting with Optimized Parameters
The second-stage experiment aims to obtain the tool change timing during successive cutting. First, optimized parameters acquired from the Taguchi method are set in the CNC milling machine cutting program, and the successive cutting is preceded by automated processing systems. The robot arm is in charge of picking up and placing automatic workpieces in the processing process. The system is set to process 20 workpieces as a process. Three accelerometers are utilized to measure the vibration of the CNC spindle in the processing process, and the engineering information in the processing process is recorded through IIoT. The workpieces are measured for surface roughness; tool damage and wear are also measured after completing the processing process. Finally, the obtained engineering data are compared and analyzed to enhance the reliability of the experimental results. The national surface roughness N8 level is regarded as the standard of the processing quality in this experiment. The measured value of the workpiece exceeding the set standard reveals the change in the timing of the tool.
3.6. Introducing Data into the Industrial Internet of Things
The industrial Internet of Things (IIoT) is introduced to the experiments in this study. First, the accelerometer and noise meter App is designed in the VMX IIoT system to acquire the vibration during processing, transmit data to the database, and connect the database with the industry big data. Such a design enhances the practicability of the system for real-time data collecting, analysis, and application to further optimize the production process.
4. Results and Discussion
4.1. Taguchi Methods Experimental Results
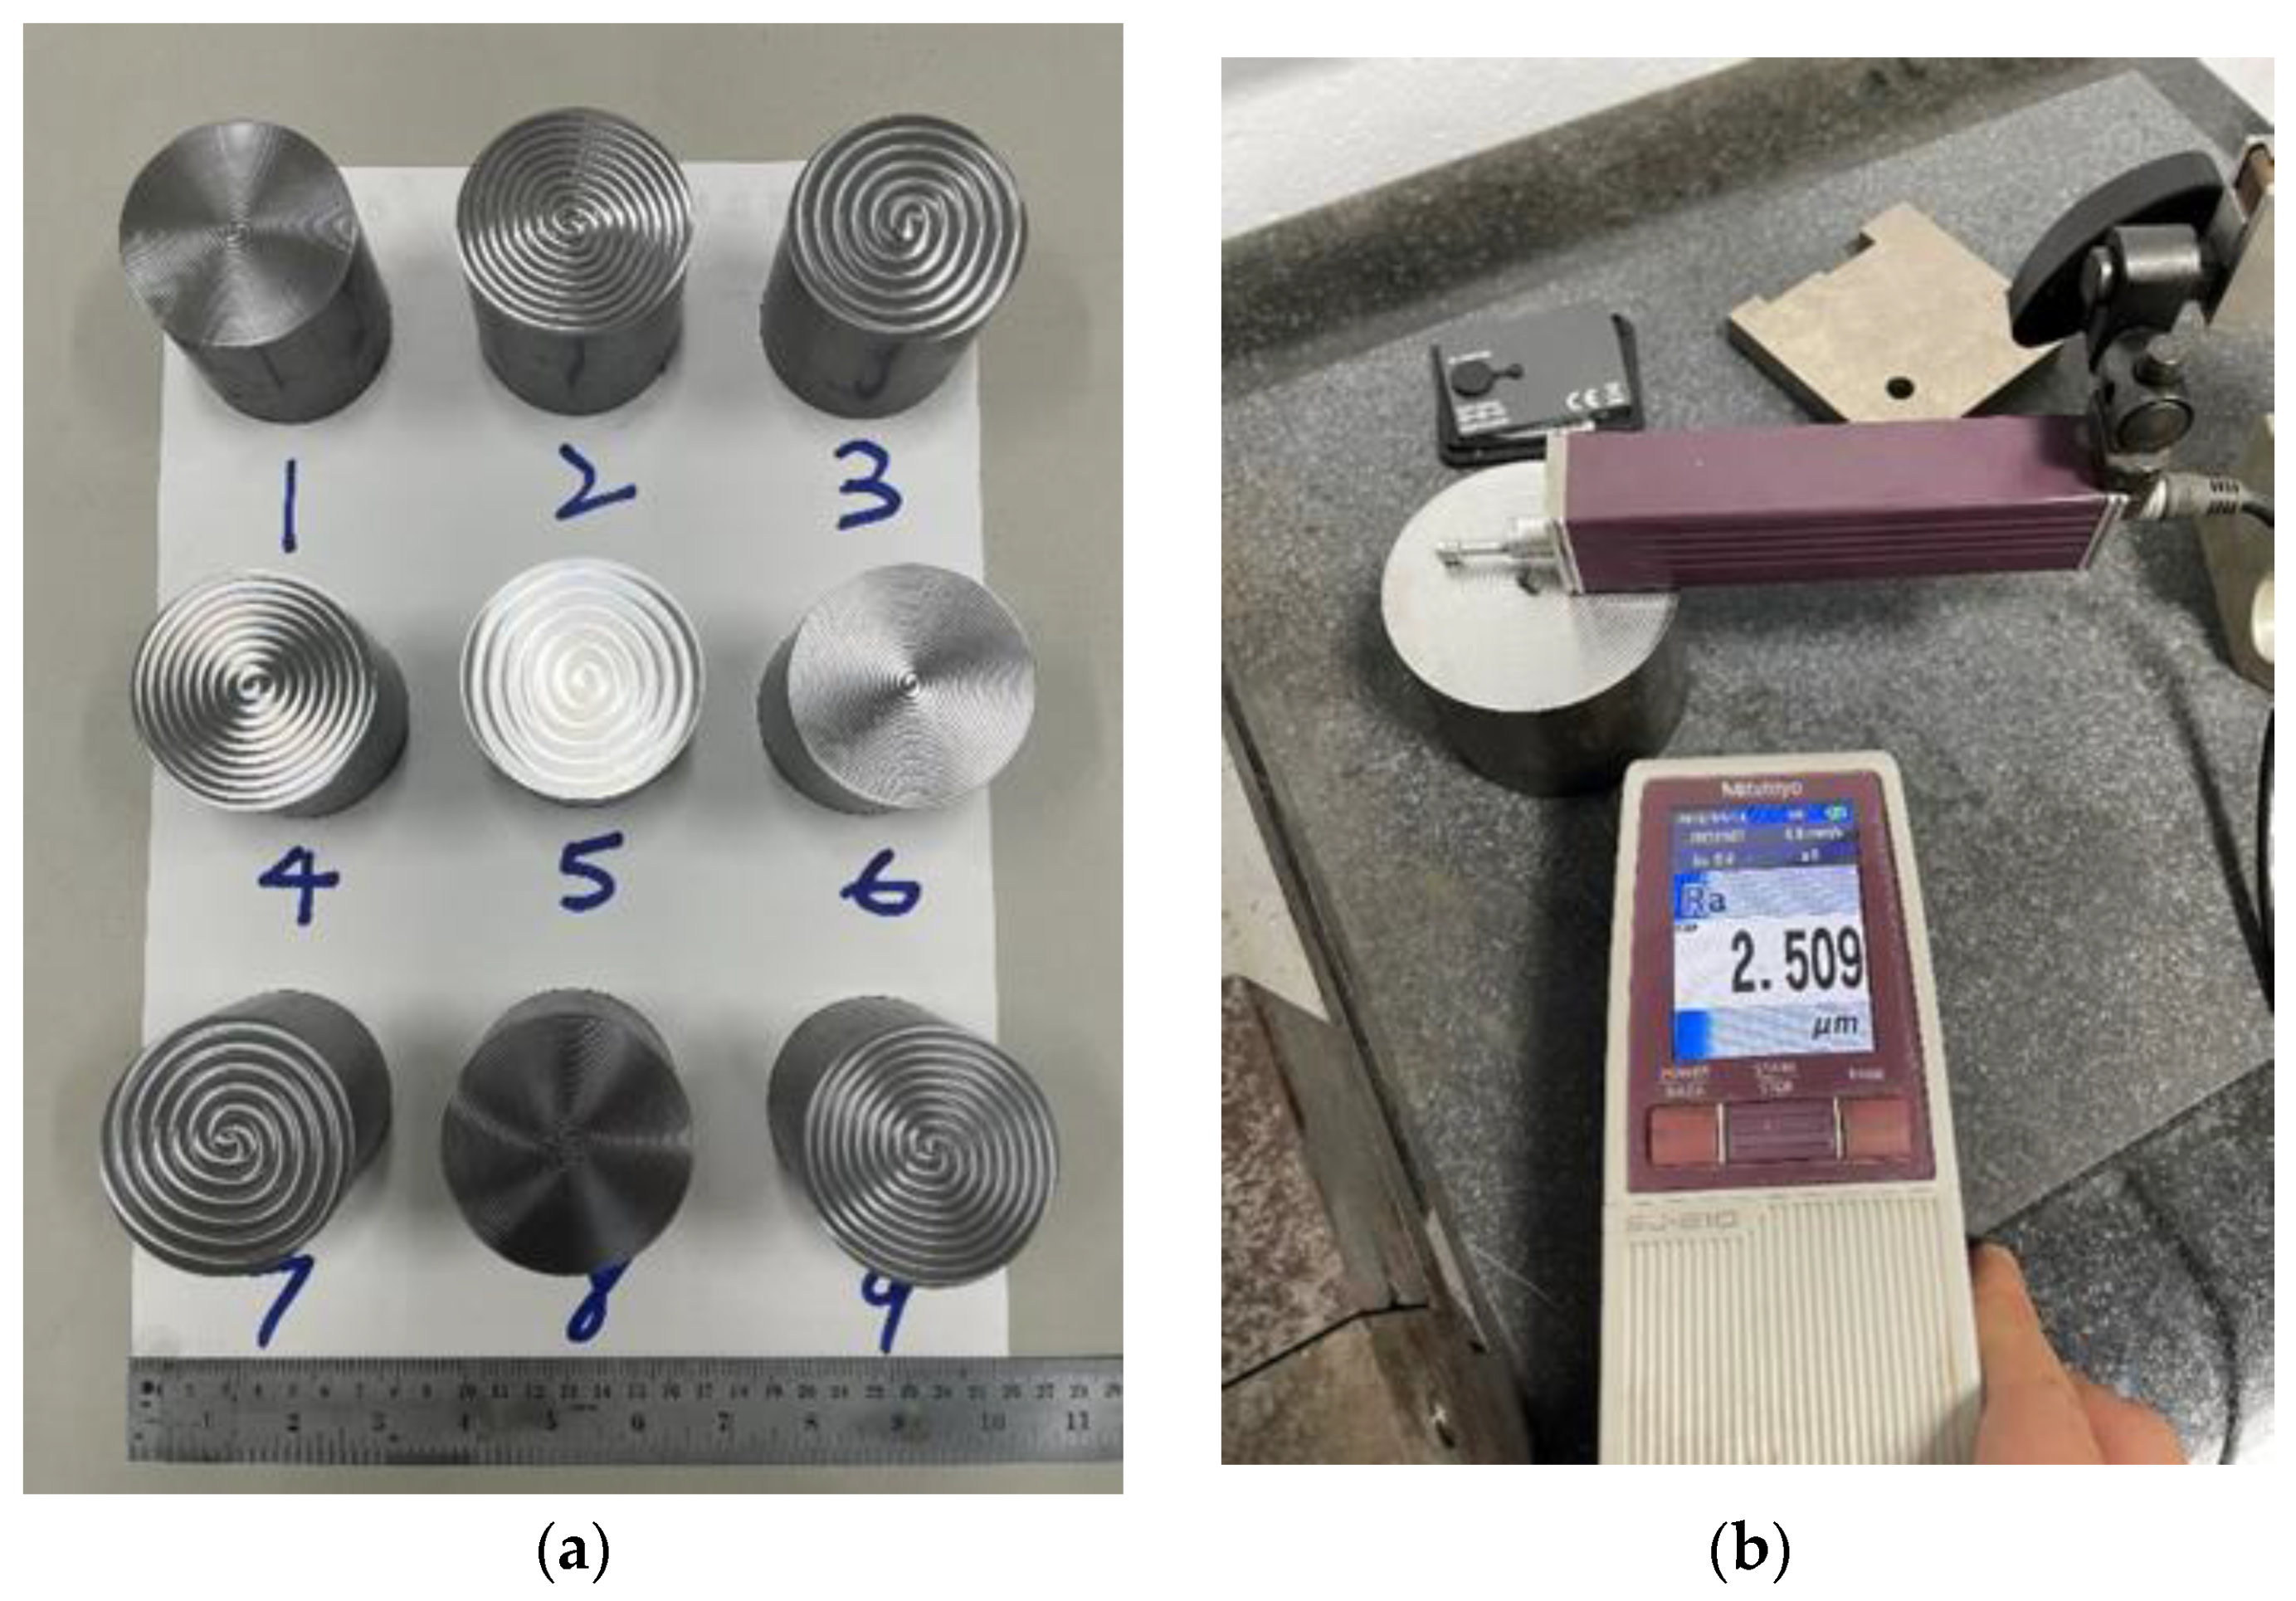
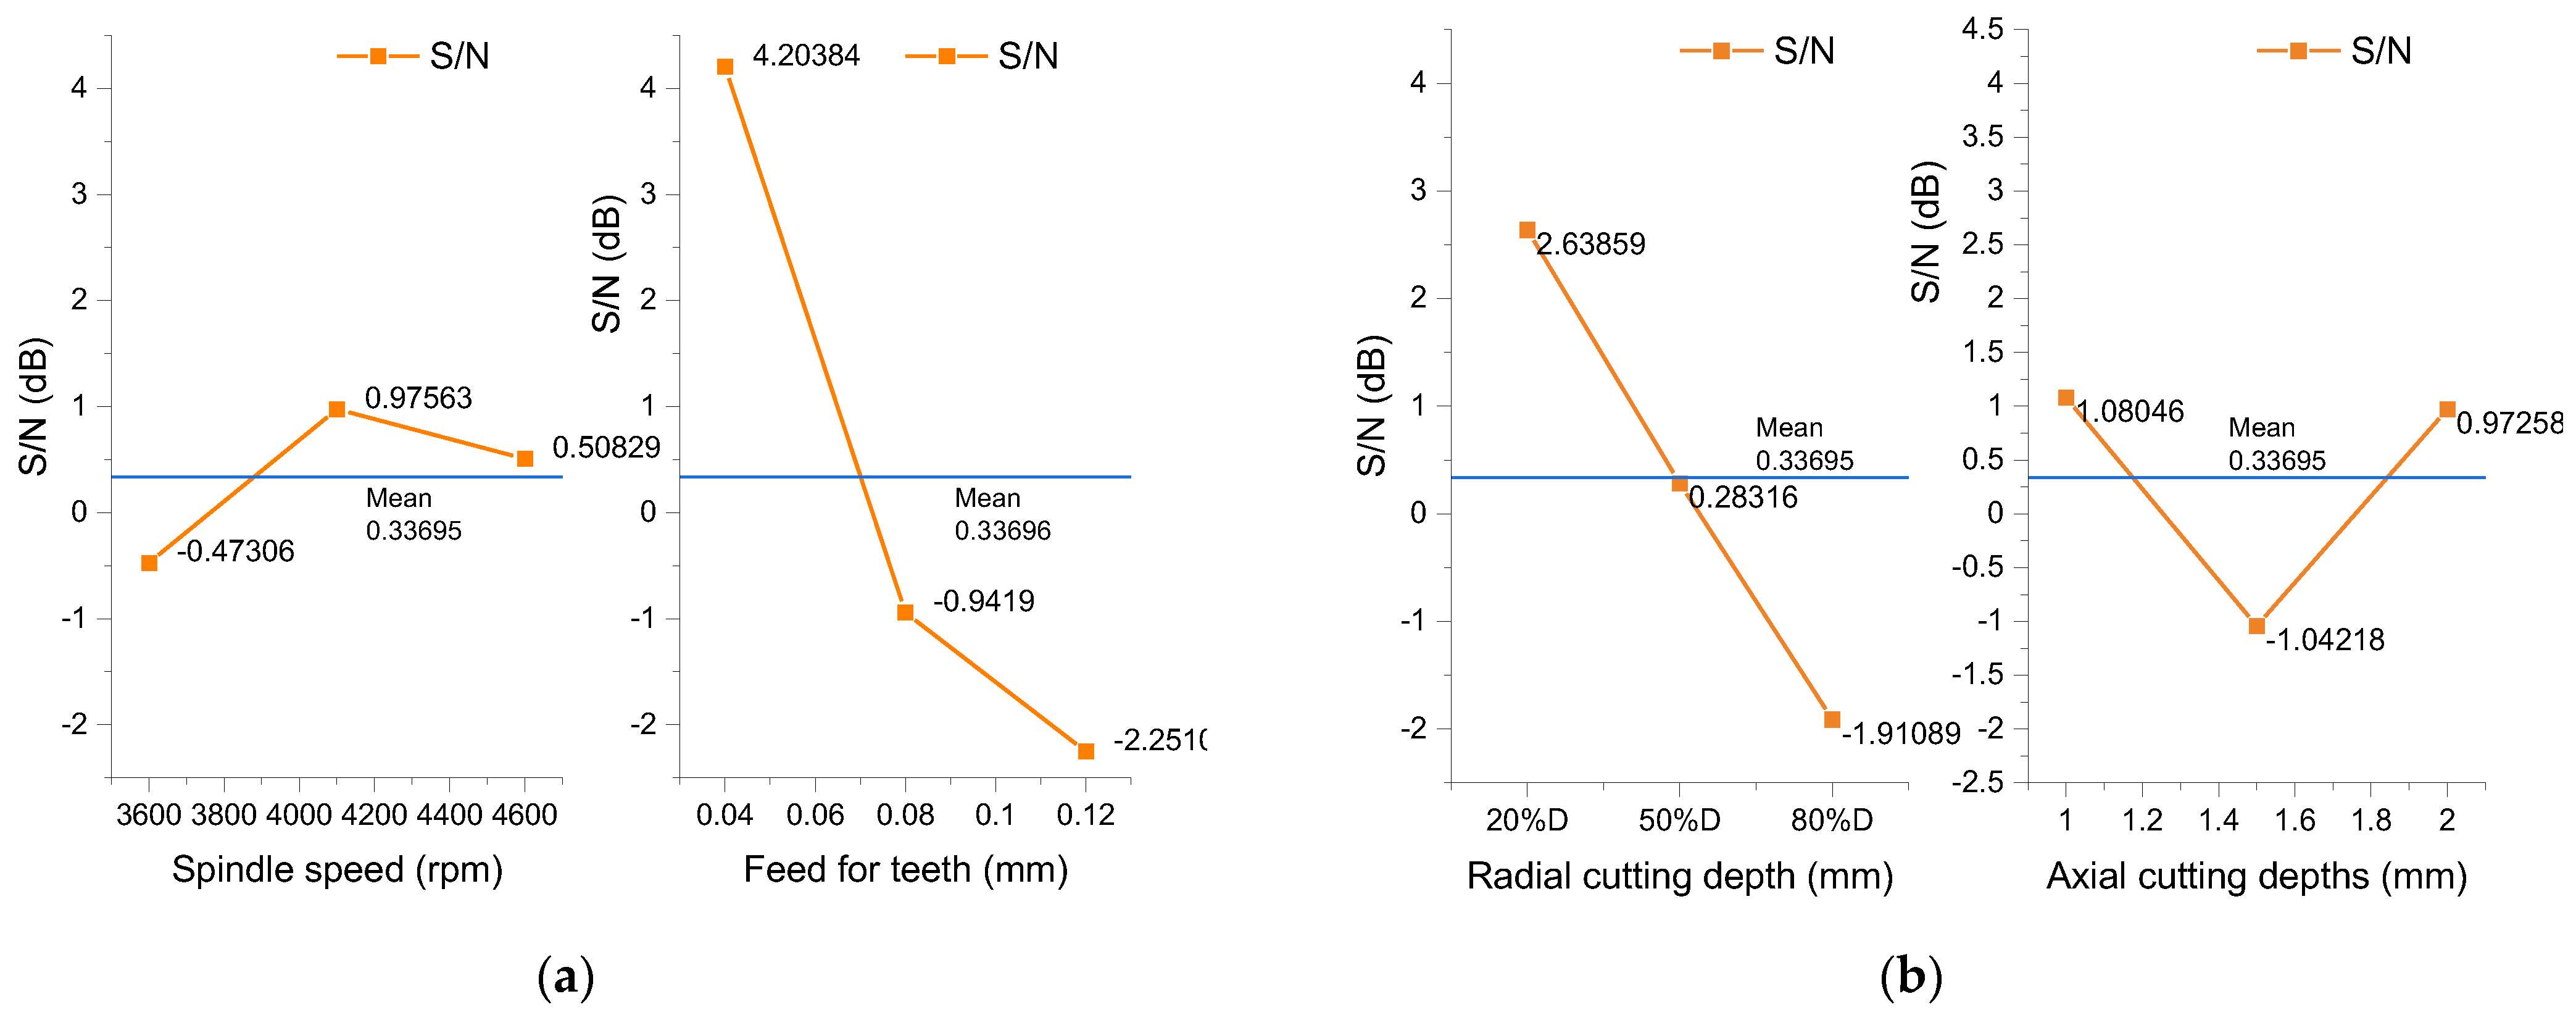
The Taguchi method is widely recognized for its efficiency and cost-effectiveness in experimental design, especially in industrial applications. Its robust approach to process optimization with a minimal number of experimental runs makes it an attractive choice. However, from a scientific perspective, it has limitations, such as relying on orthogonal arrays and assuming that the signal-to-noise ratio is sufficient to capture variations. These constraints may prevent the exploration of complete interaction effects, requiring the support of additional analyses and methods to address such issues effectively. One of the commonly used improvement methods is shown in reference [34]. In this study, accelerometers are used in the cutting process to measure cutting vibration. The dry cutting experiment and the Taguchi Method are utilized to optimize the analysis of cutting parameters to acquire the best combination of cutting parameters. After nine experiments with the Taguchi Method (the workpieces shown in Figure 6a), the Mitutoyo SJ-210 surface roughness measuring instrument from Mitutoyo Corporation was used to measure the surface roughness of the workpieces. Figure 6b displays the actual measuring picture. The surface roughness data of Q1, Q2, Q3, and Ave are obtained (Table 3). With signal/noise analysis, the sequence of the important S/N ratio controlling factors (Table 4) is obtained, and the reaction diagram of the control factor’s S/N ratio is drawn (Figure 7). The experimental analysis results reveal the best cutting parameters, which are spindle rotational speed of 3600 rpm, cutting output of each flute of 0.12 mm, radial cutting depth of 80% D, and axial cutting depth of 1.5mm. From the reaction analysis of the control factor S/N ratio, the importance of control factors to the surface roughness of cutting workpieces is sequenced feed per teeth > radial cutting depth > axial cutting depth > spindle rotational speed. Such parameters could effectively enhance the cutting quality. Using the combined optimized parameters for the milling experiment again, the workpiece surface roughness Ra 0.444 μm is the best processing quality of all experiments in this study. When using other combinations of parameters for experiments, the obtained surface roughness of 0.465 μm relatively improves the processing quality by 4.516%.
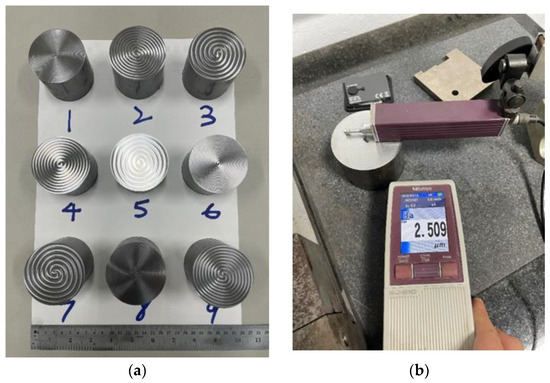
Figure 6.
Photos of the nine workpieces and measuring the surface roughness after the experimental with the Taguchi method: (a) The nine workpieces after the milling with the Taguchi method; (b) the Surface roughness of the workpiece after the experiment measured using Mitutoyo SJ-210 (for Taiwan Mitutoyo).
Table 3.
The surface roughness, SD, and S/N of workpieces data after the Taguchi experimental method.
Table 4.
The Response table for S/N ratios.
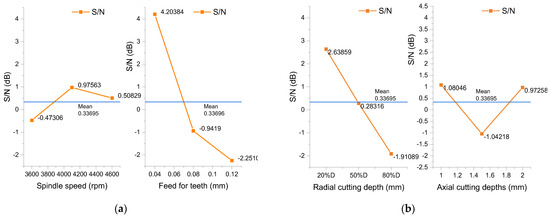
Figure 7.
Main effect graphs for S/N ratios of surface roughness: (a) Response of S/N ratios in spindle speed, feed for teeth control factors; (b) response of S/N ratios in radial cutting depth, axial cutting depth control factors.
Analysis of Variance
Through the preliminary Analysis of the Variance table, the S/N ratio reaction acquired from the optimization analysis, including the degree of freedom (DOF) of factors, sum of squares (SS), mean square (MS), net sum of squares (net SS), and contribution, is calculated cutting output of each flute (61.94%) and radial depth (27.54%) with larger contribution as well as spindle rotational speed (2.91%) and axial cutting depth (7.61%) with smaller contribution, revealing smaller effects of changing factor parameters on roughness. In this case, factors with less influence are included in the error integration for further analysis.
From the Analysis of Variance to show the error integration results, it is discovered that the F-value is 11.96, the p-value is 0.08, the contribution of cutting output of each flute is 64.18%, with a confidence level of 98%, and the contribution of radial cutting depth appears to be 25.34%, where the F-value is 6.12, the p-value is 0.17, and the confidence level is 91%. It is, therefore, considered that the adjustment of the cutting output of each flute and cutting parameters of radial cutting depth appears to have more obvious effects on surface roughness.
4.2. Successive Cutting with Optimized Parameters
Successive cutting, matching the automated processing system, uses 20-workpiece cutting as a cycle where, matching the process model, 20 experimental workpieces are measured each time. It was simultaneously observed that during the automatic successive cutting process, the workpiece surface roughness and the vibration of the workpiece could generally be divided into three stages:
- Initial Cutting Stage (1st to 20th cutting trials):
Figure 8a shows the 20th workpiece surface. It is discovered that the tool wear speed, under the cutting with optimal parameters, is slow but shows stage changes. At the beginning of cutting, the new tool presents a complete blade surface that the processed product quality is comparatively stable. In addition, the tool appears to be slightly worn, which would not substantially affect workpiece surface roughness, averagely maintaining under Ra 1.0 μm. The tip also appears to be slightly coated. The cutting ability of the tool presents better performance at the stage, Figure 8b.
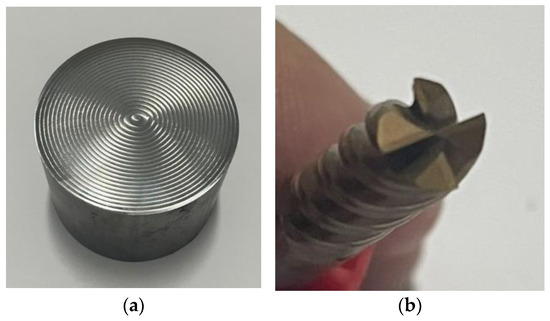
Figure 8.
Photos of the workpiece and milling cutter after the 20th milling: (a) the workpiece’s surface roughness is below Ra 1 μm; (b) the complete blade appearance of end milling.
- 2.
- Mid-Cutting Stage (21st to 40th cutting trials):
Regarding the workpiece surface roughness changes during the 20th–40th experiments, the workpiece surface roughness appears below Ra 2.1 μm due to obvious increasing tool wear. Figure 9a shows the 40th workpiece surface. At the later stage of the 21st–40th experiments, a slight spark would appear during cutting, and poor chip breaking starts to present. Cutting chips start to change colors due to high temperature, and the tool appears to have poor cutting ability. From the observation of the tool, the tooltip changes color due to high temperature and appears to have larger wear (Figure 9b).

Figure 9.
Photos of the workpiece and milling cutter after the 40th milling: (a) the workpiece’s surface roughness is below Ra 2.1 μm; (b) the tooltip of the end mill shows discoloration and increased wear.
- 3.
- Late Cutting Stage (41st to 57th cutting trials):
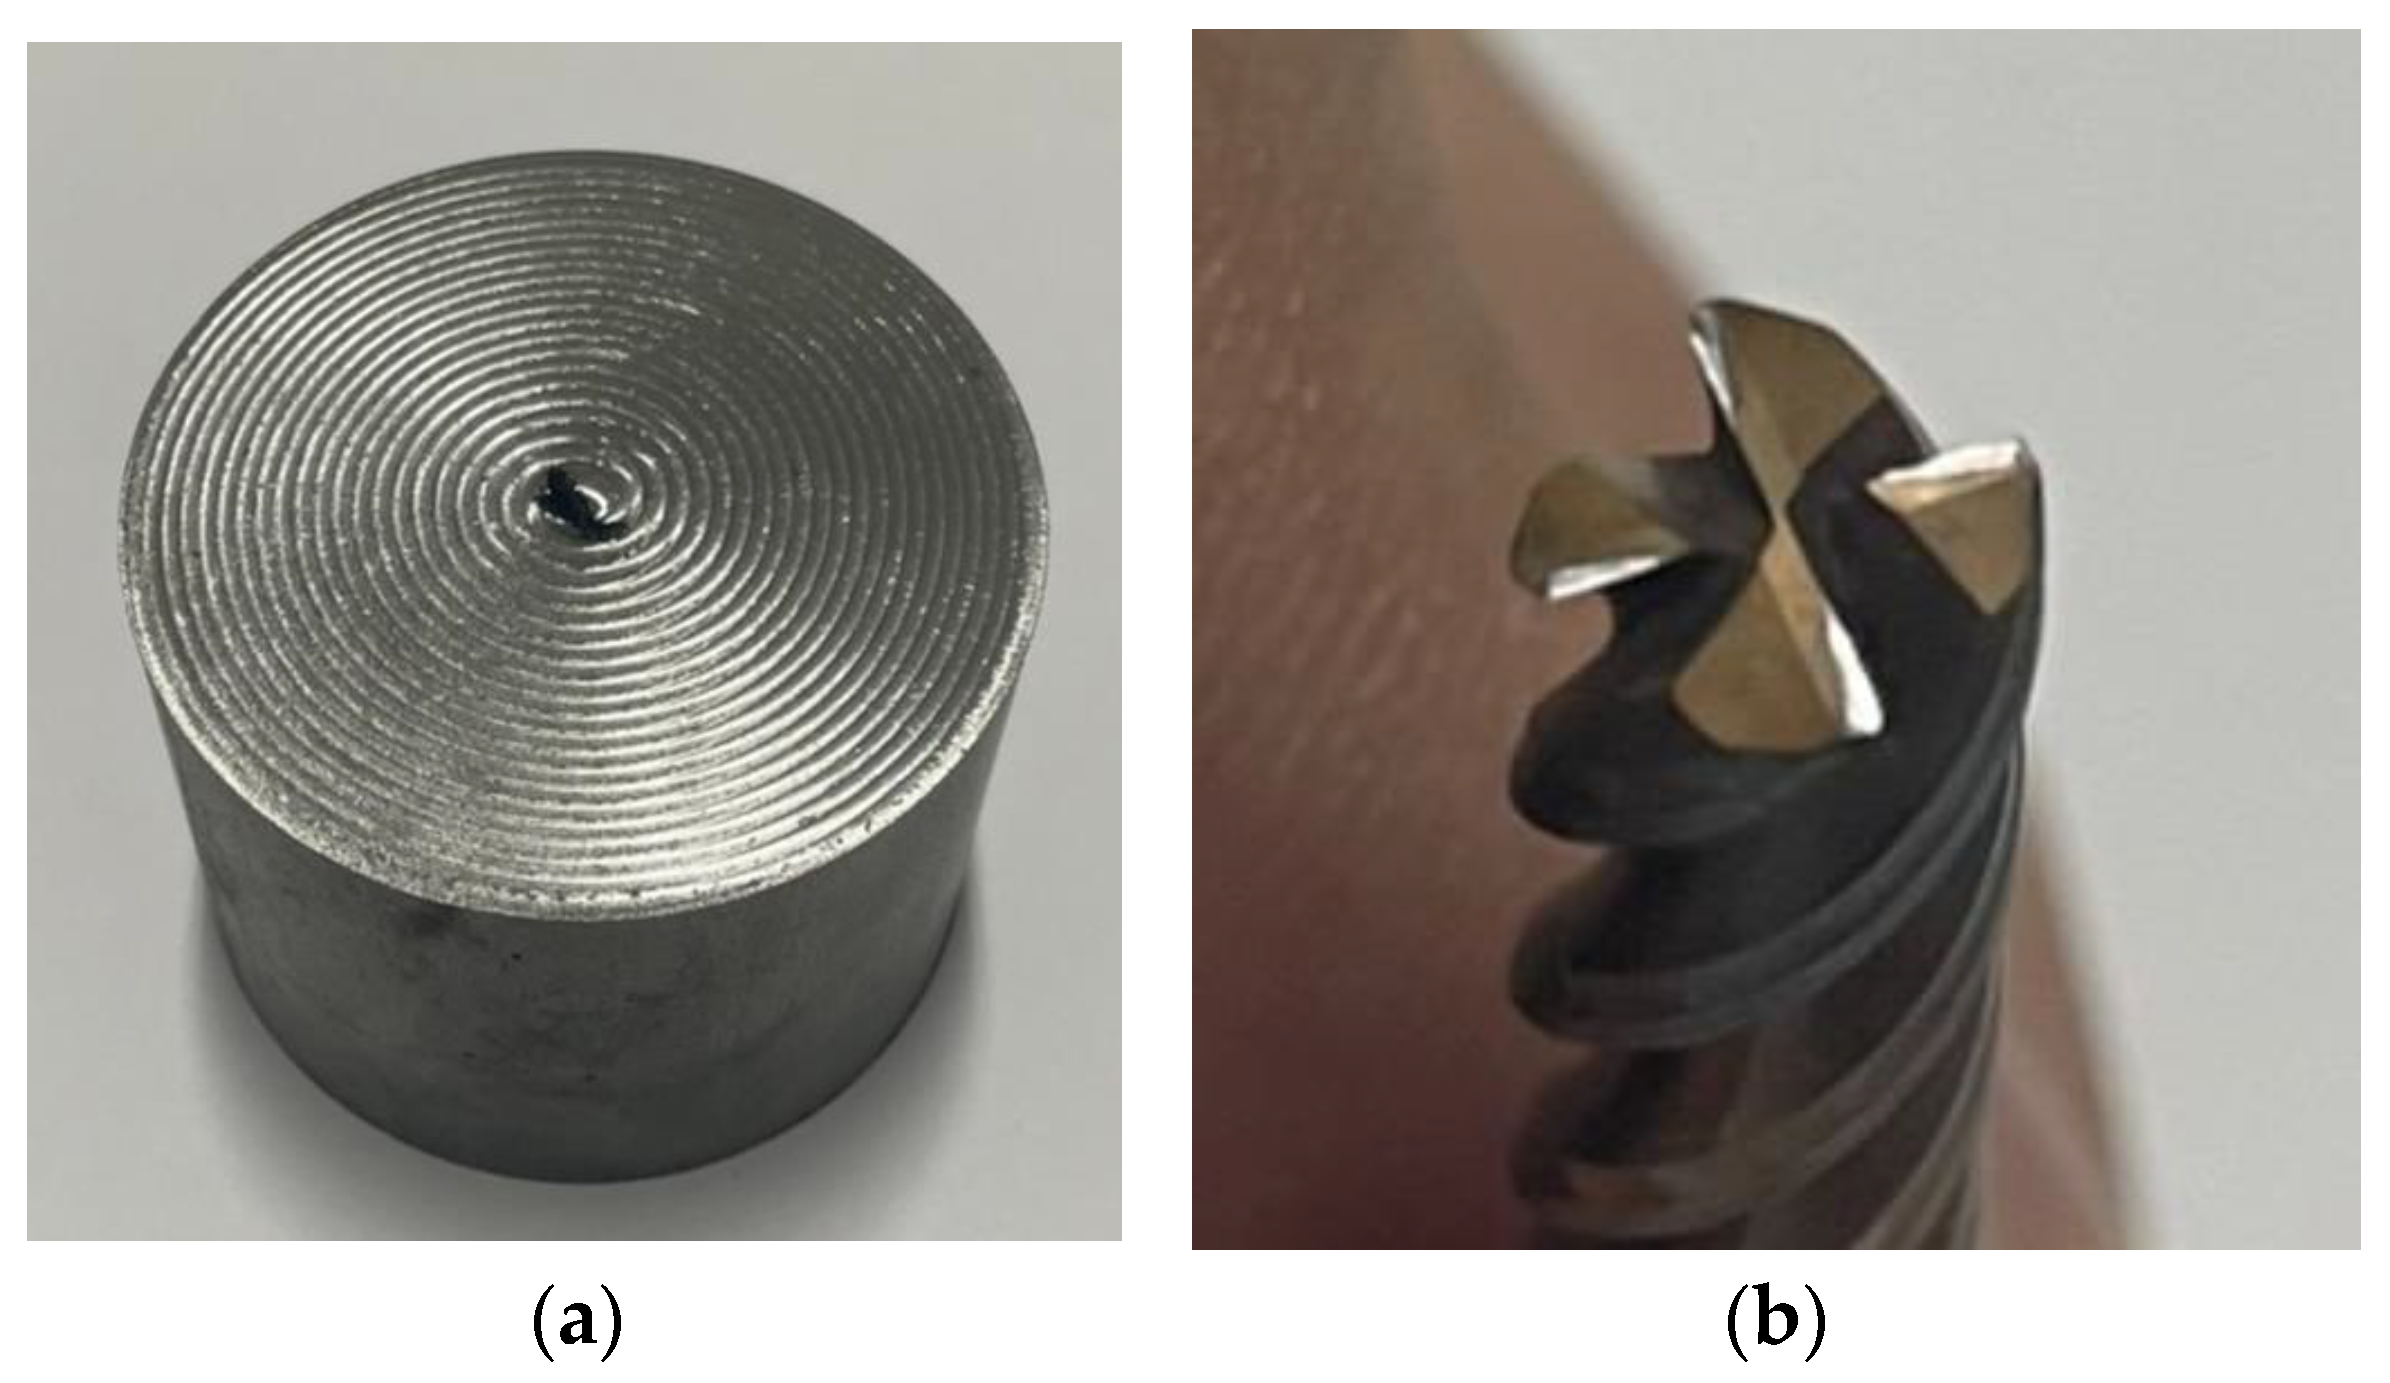
Regarding the workpiece surface roughness changes in the 41st–57th experiments, the surface roughness shows fierce changes due to tool wear in long-time processing. After the 52nd cutting, the workpiece surface roughness exceeds the initially set N8 standard, Ra 3.2 μm. After processing for the 58th time, the tool flute deformation and crack result in breaking, Figure 10a. By observing the processing process of the processing machine, a large spark would appear during cutting, and chips would entangle in the tool during the cutting process. The tool with insufficient cutting ability, in the 58th experiment, caused a severely defective tip of the end mill and an obvious crack (Figure 10b). Figure 11 displays the graph of workpiece surface roughness changes in the 1st–57th experiments.
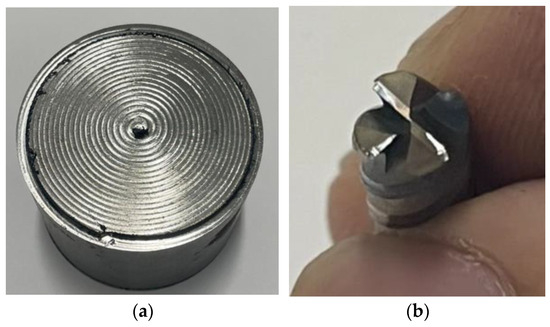
Figure 10.
Photos of the workpiece and milling cutter after the 57th milling: (a) the workpiece’s surface roughness exceeds Ra 3.2 μm of the set N8 standard; (b) the tooltip’s obvious crack appearance of end milling. Surface roughness exceeds the originally set N8 standard.

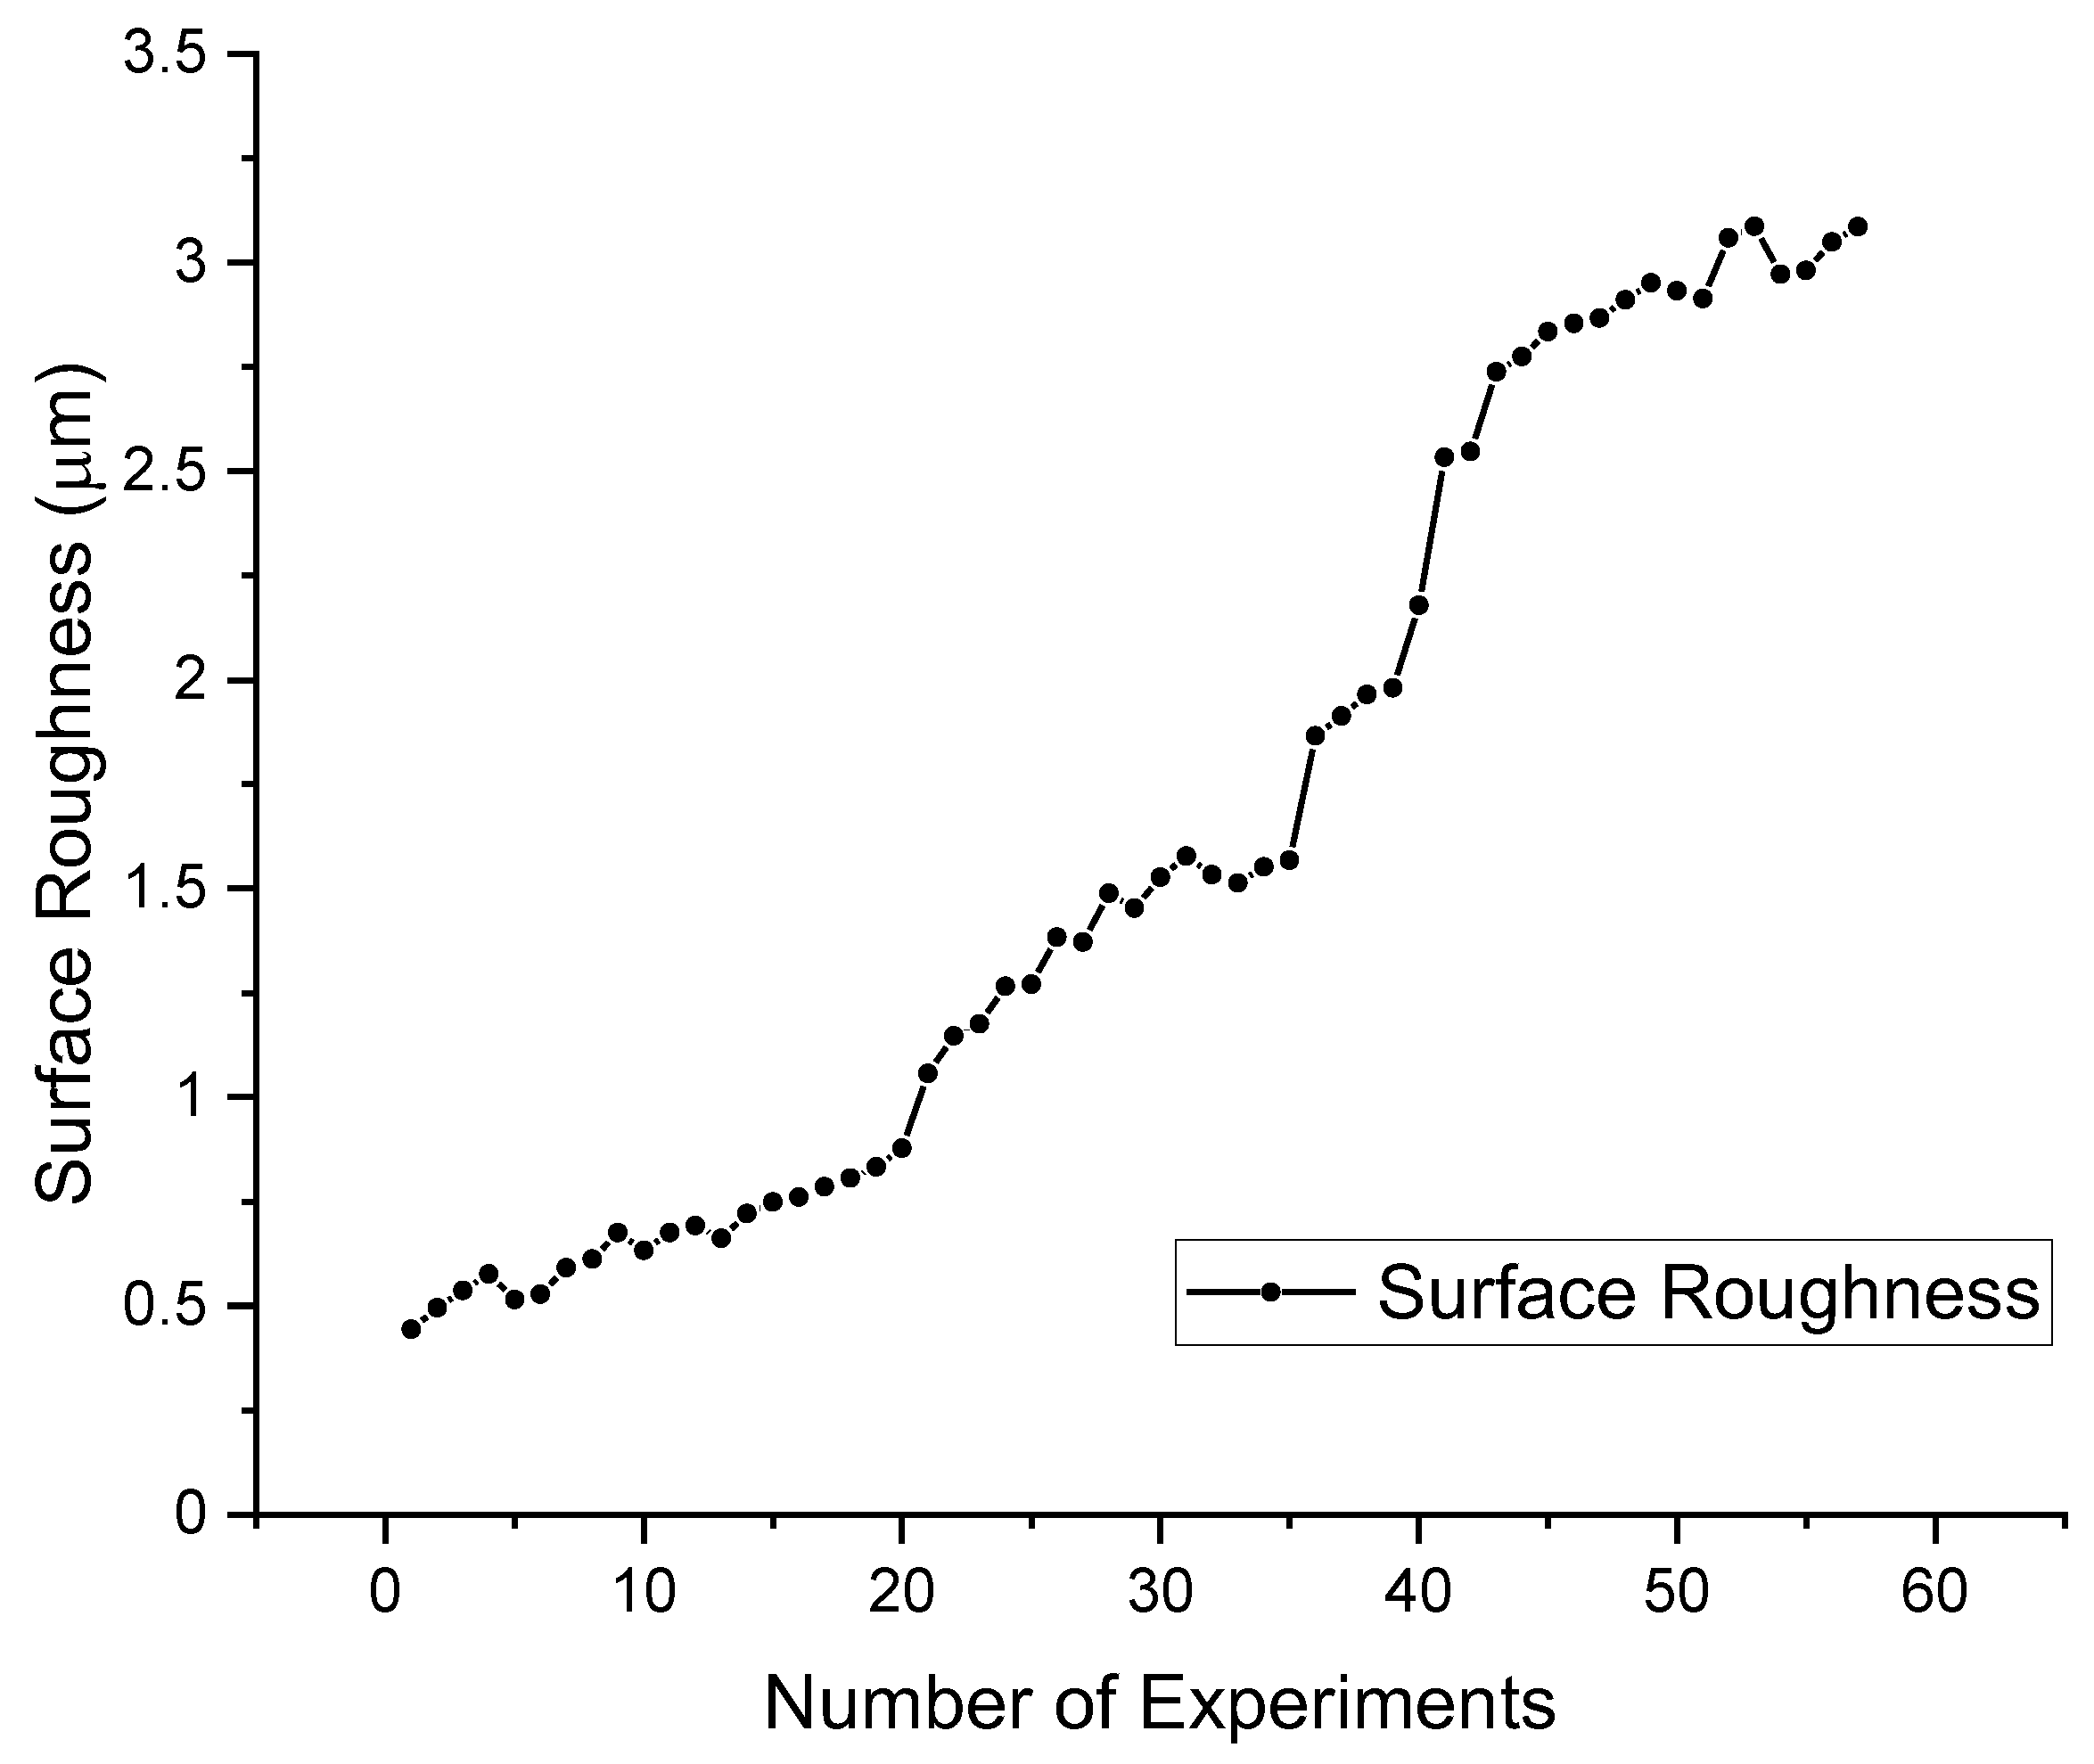
Figure 11.
The graph of workpiece surface roughness changes in the 1st–57th experiments.
Industrial Internet of Things and Numerical Analysis of Vibration on CNC Machine Tool Spindle
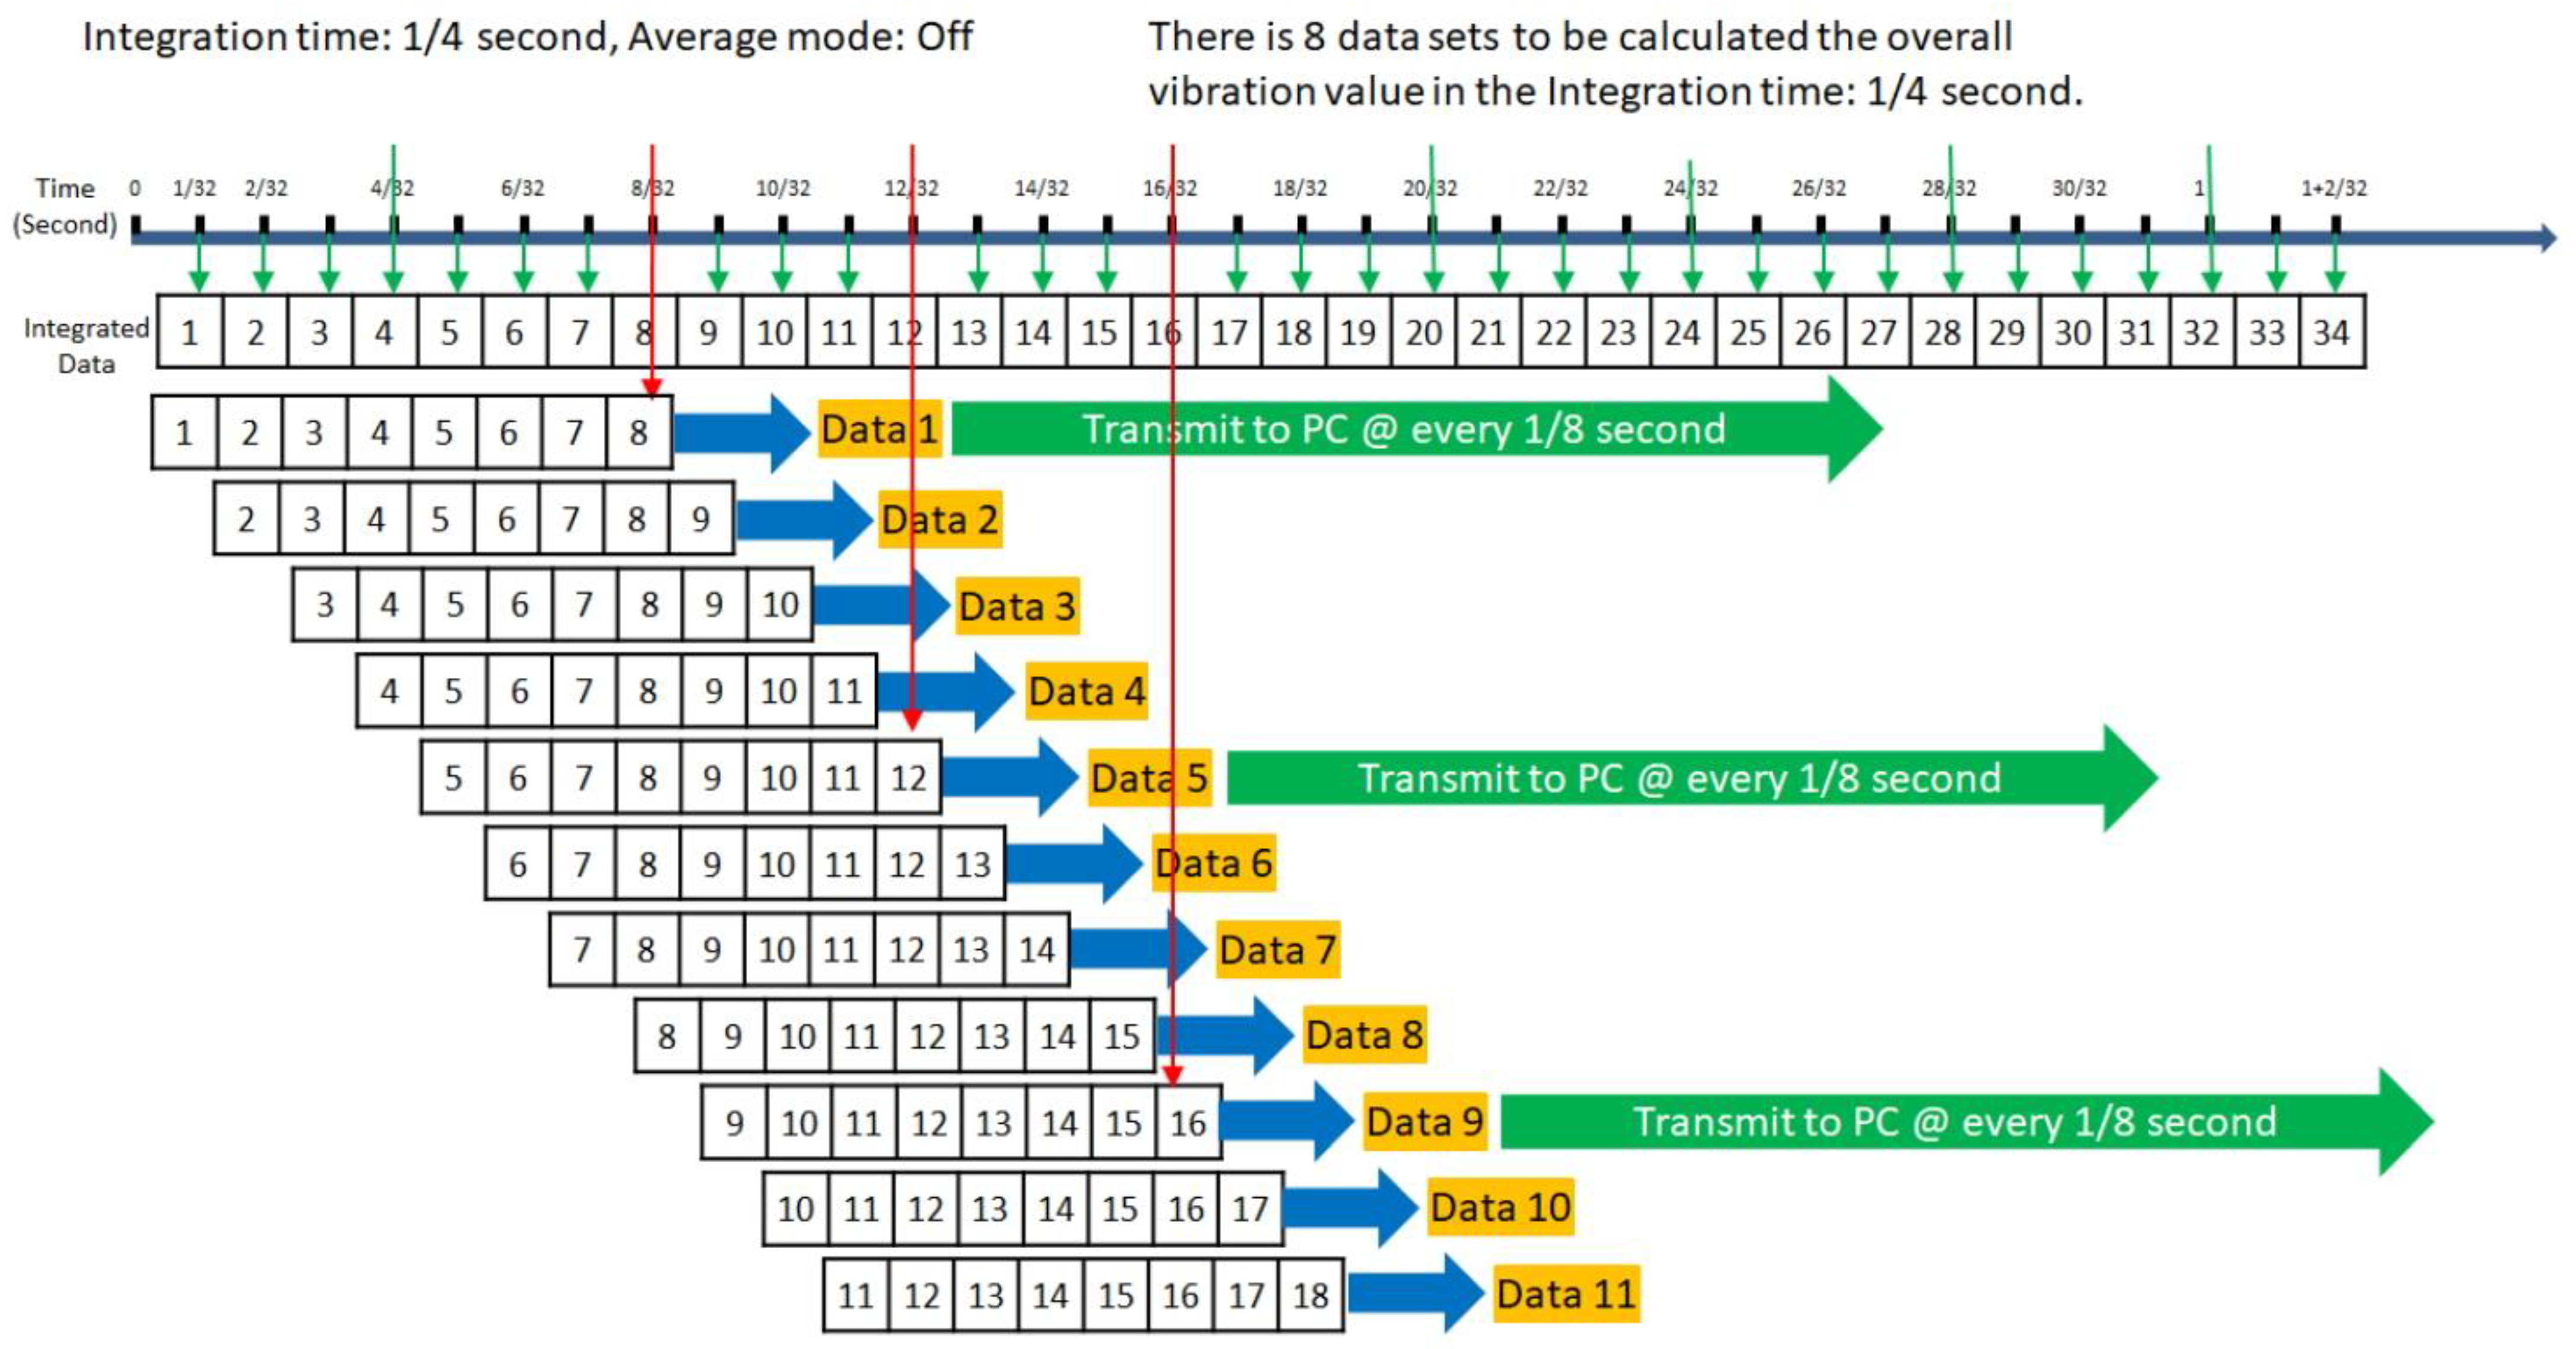
The Industrial Internet of Things (IIoT) is connected to the successive automated processing process of collecting vibration and engineering information data. The vibration waveform could be shown with acceleration, speed, displacement, or spectrum. The data could be saved in the database in Excel or text format. The acceleration filtering and the speed filtering, in the cutting process, are set to 10 Hz–10 kHz and 10 Hz–5 kHz, respectively, to calculate the integration time of 1/4 s of total vibration. The device is set to transmit data to the computer every 1/8 s (Figure 12). The acceleration and speed vibration data are analyzed with root mean square (RMS), with the corresponding units mm/s2 (or G) and mm/s, respectively.
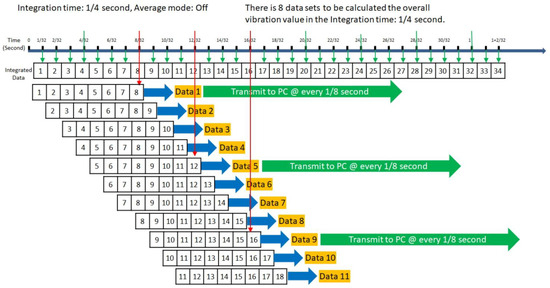
Figure 12.
Diagram of 1/4 integral time of total vibration amount [35].
After removing the engaging and retracting process from the vibration data analysis, the cutting time is 267 s. Finally, the 267 pieces of data in each set are analyzed, each effective processing vibration acceleration and speed value are measured, and the vibration value changes among experiments in the successive processing process are analyzed.
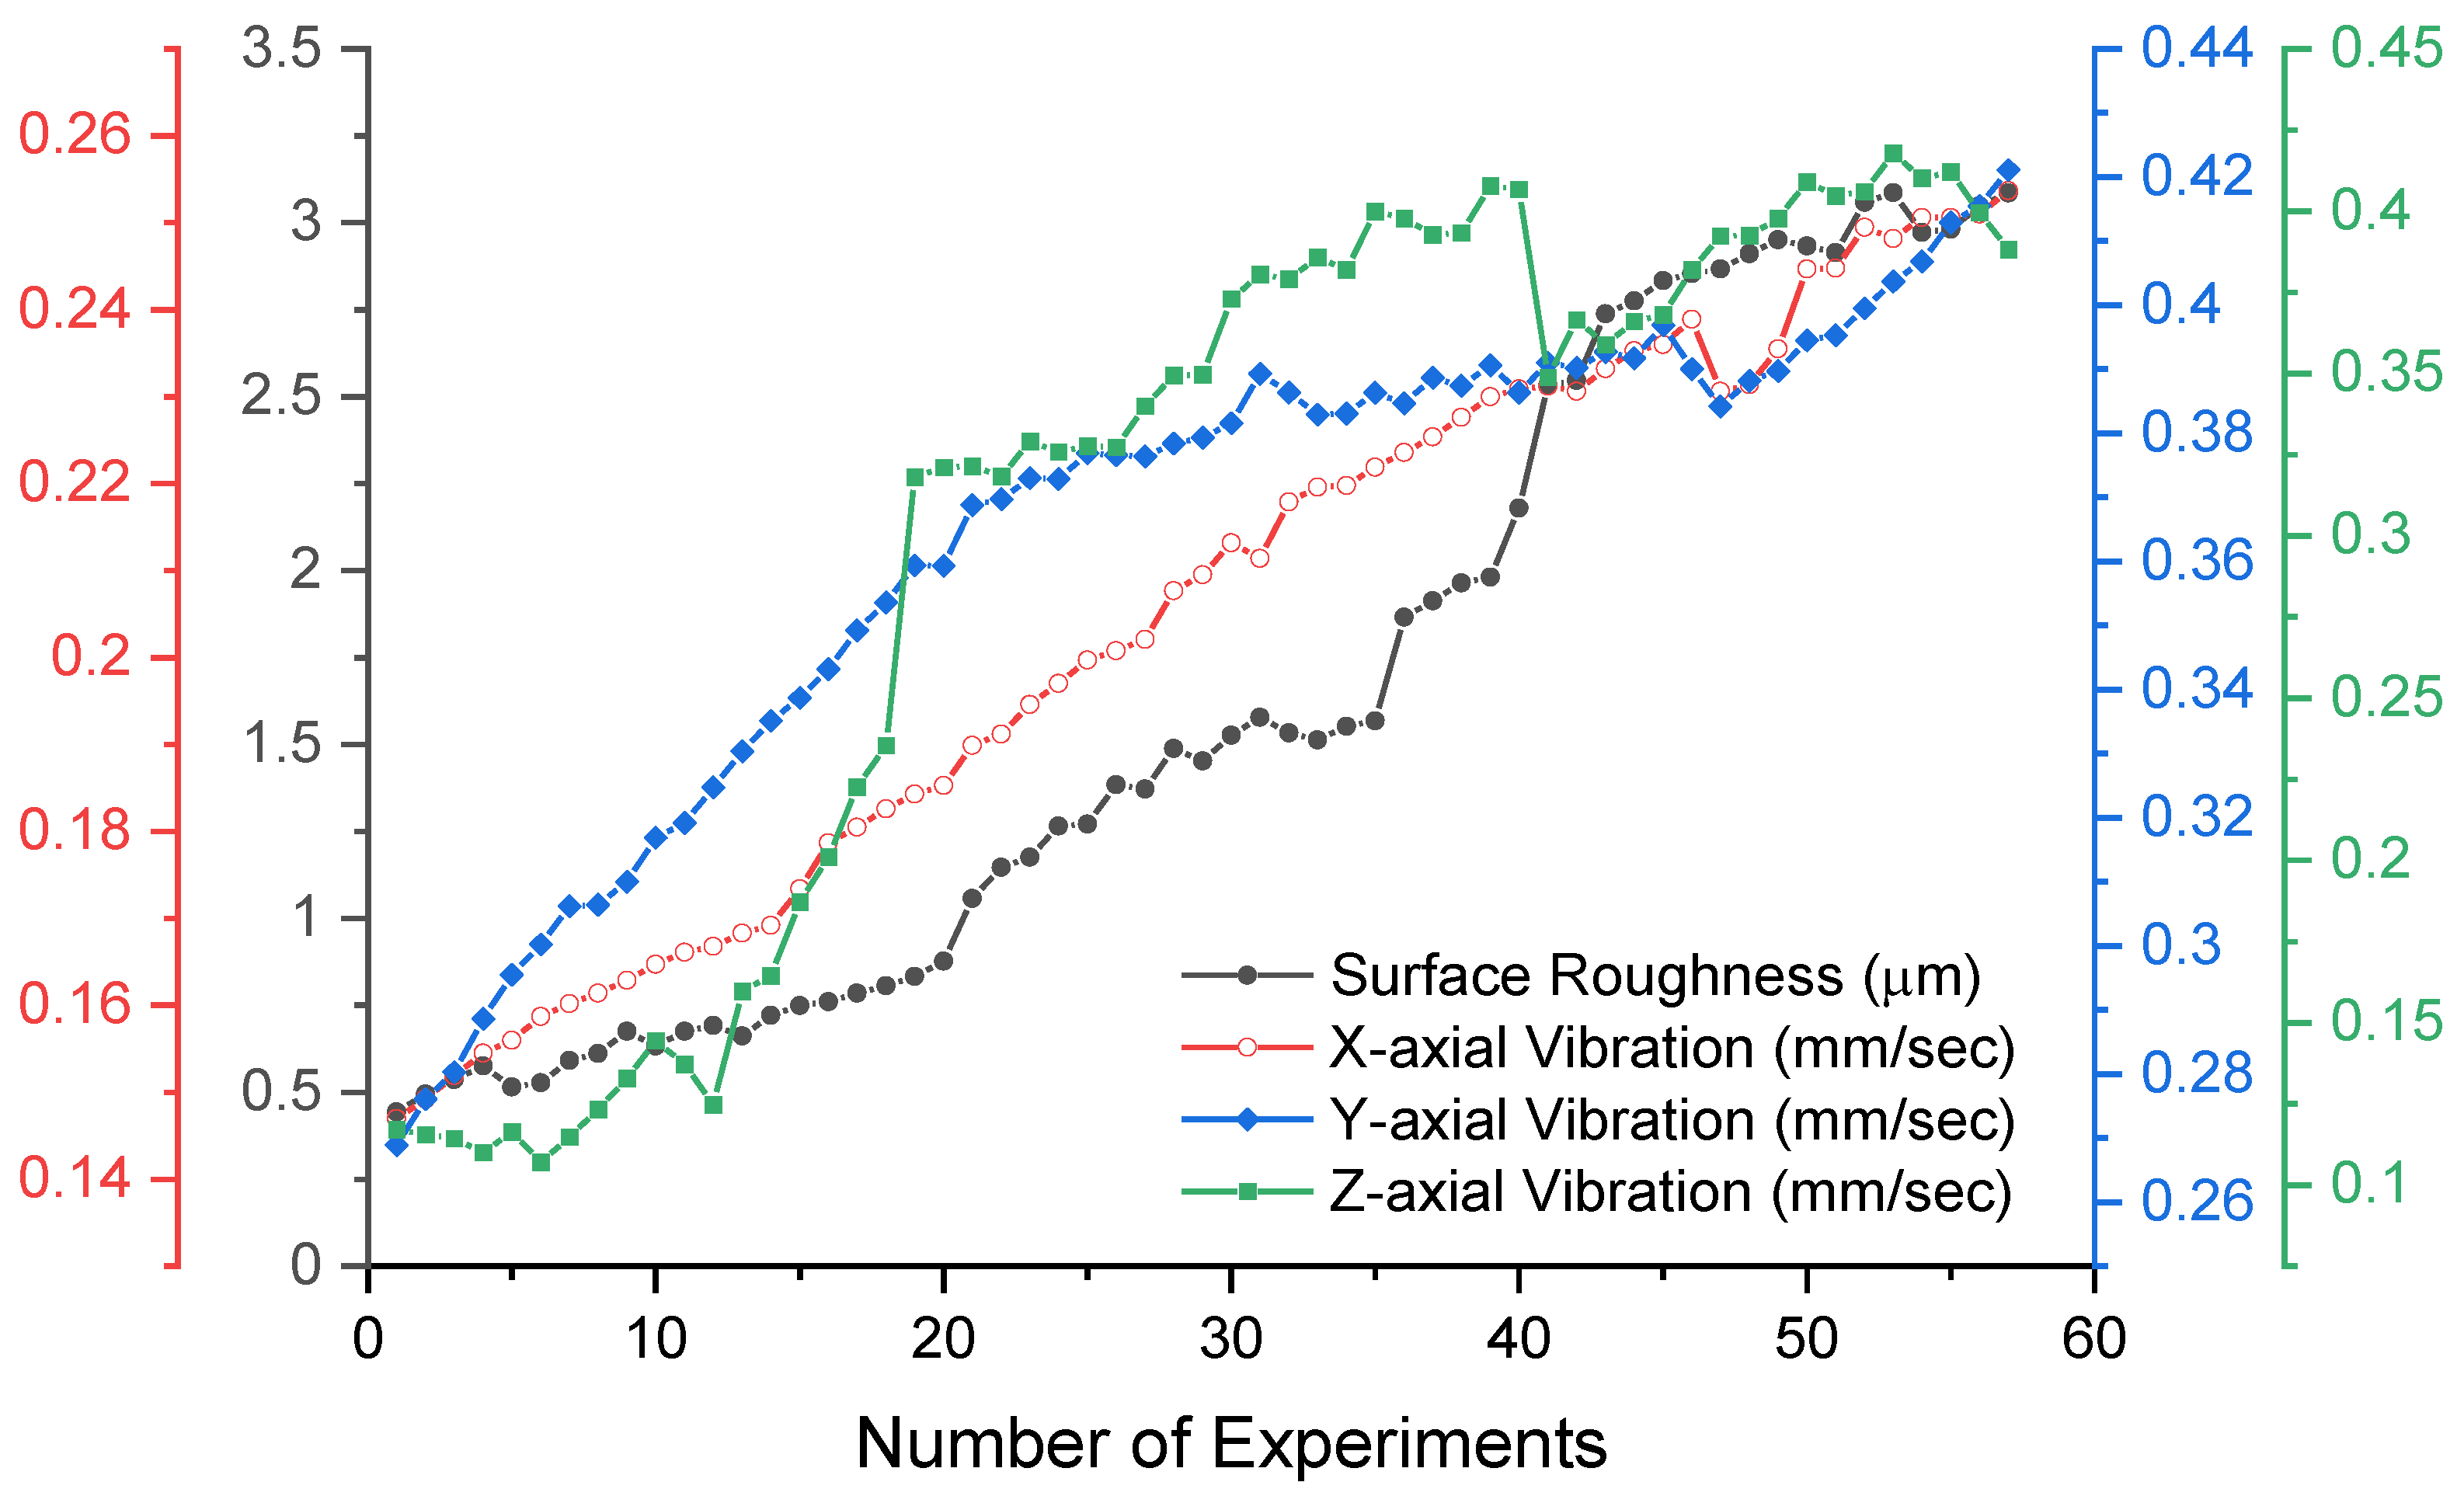
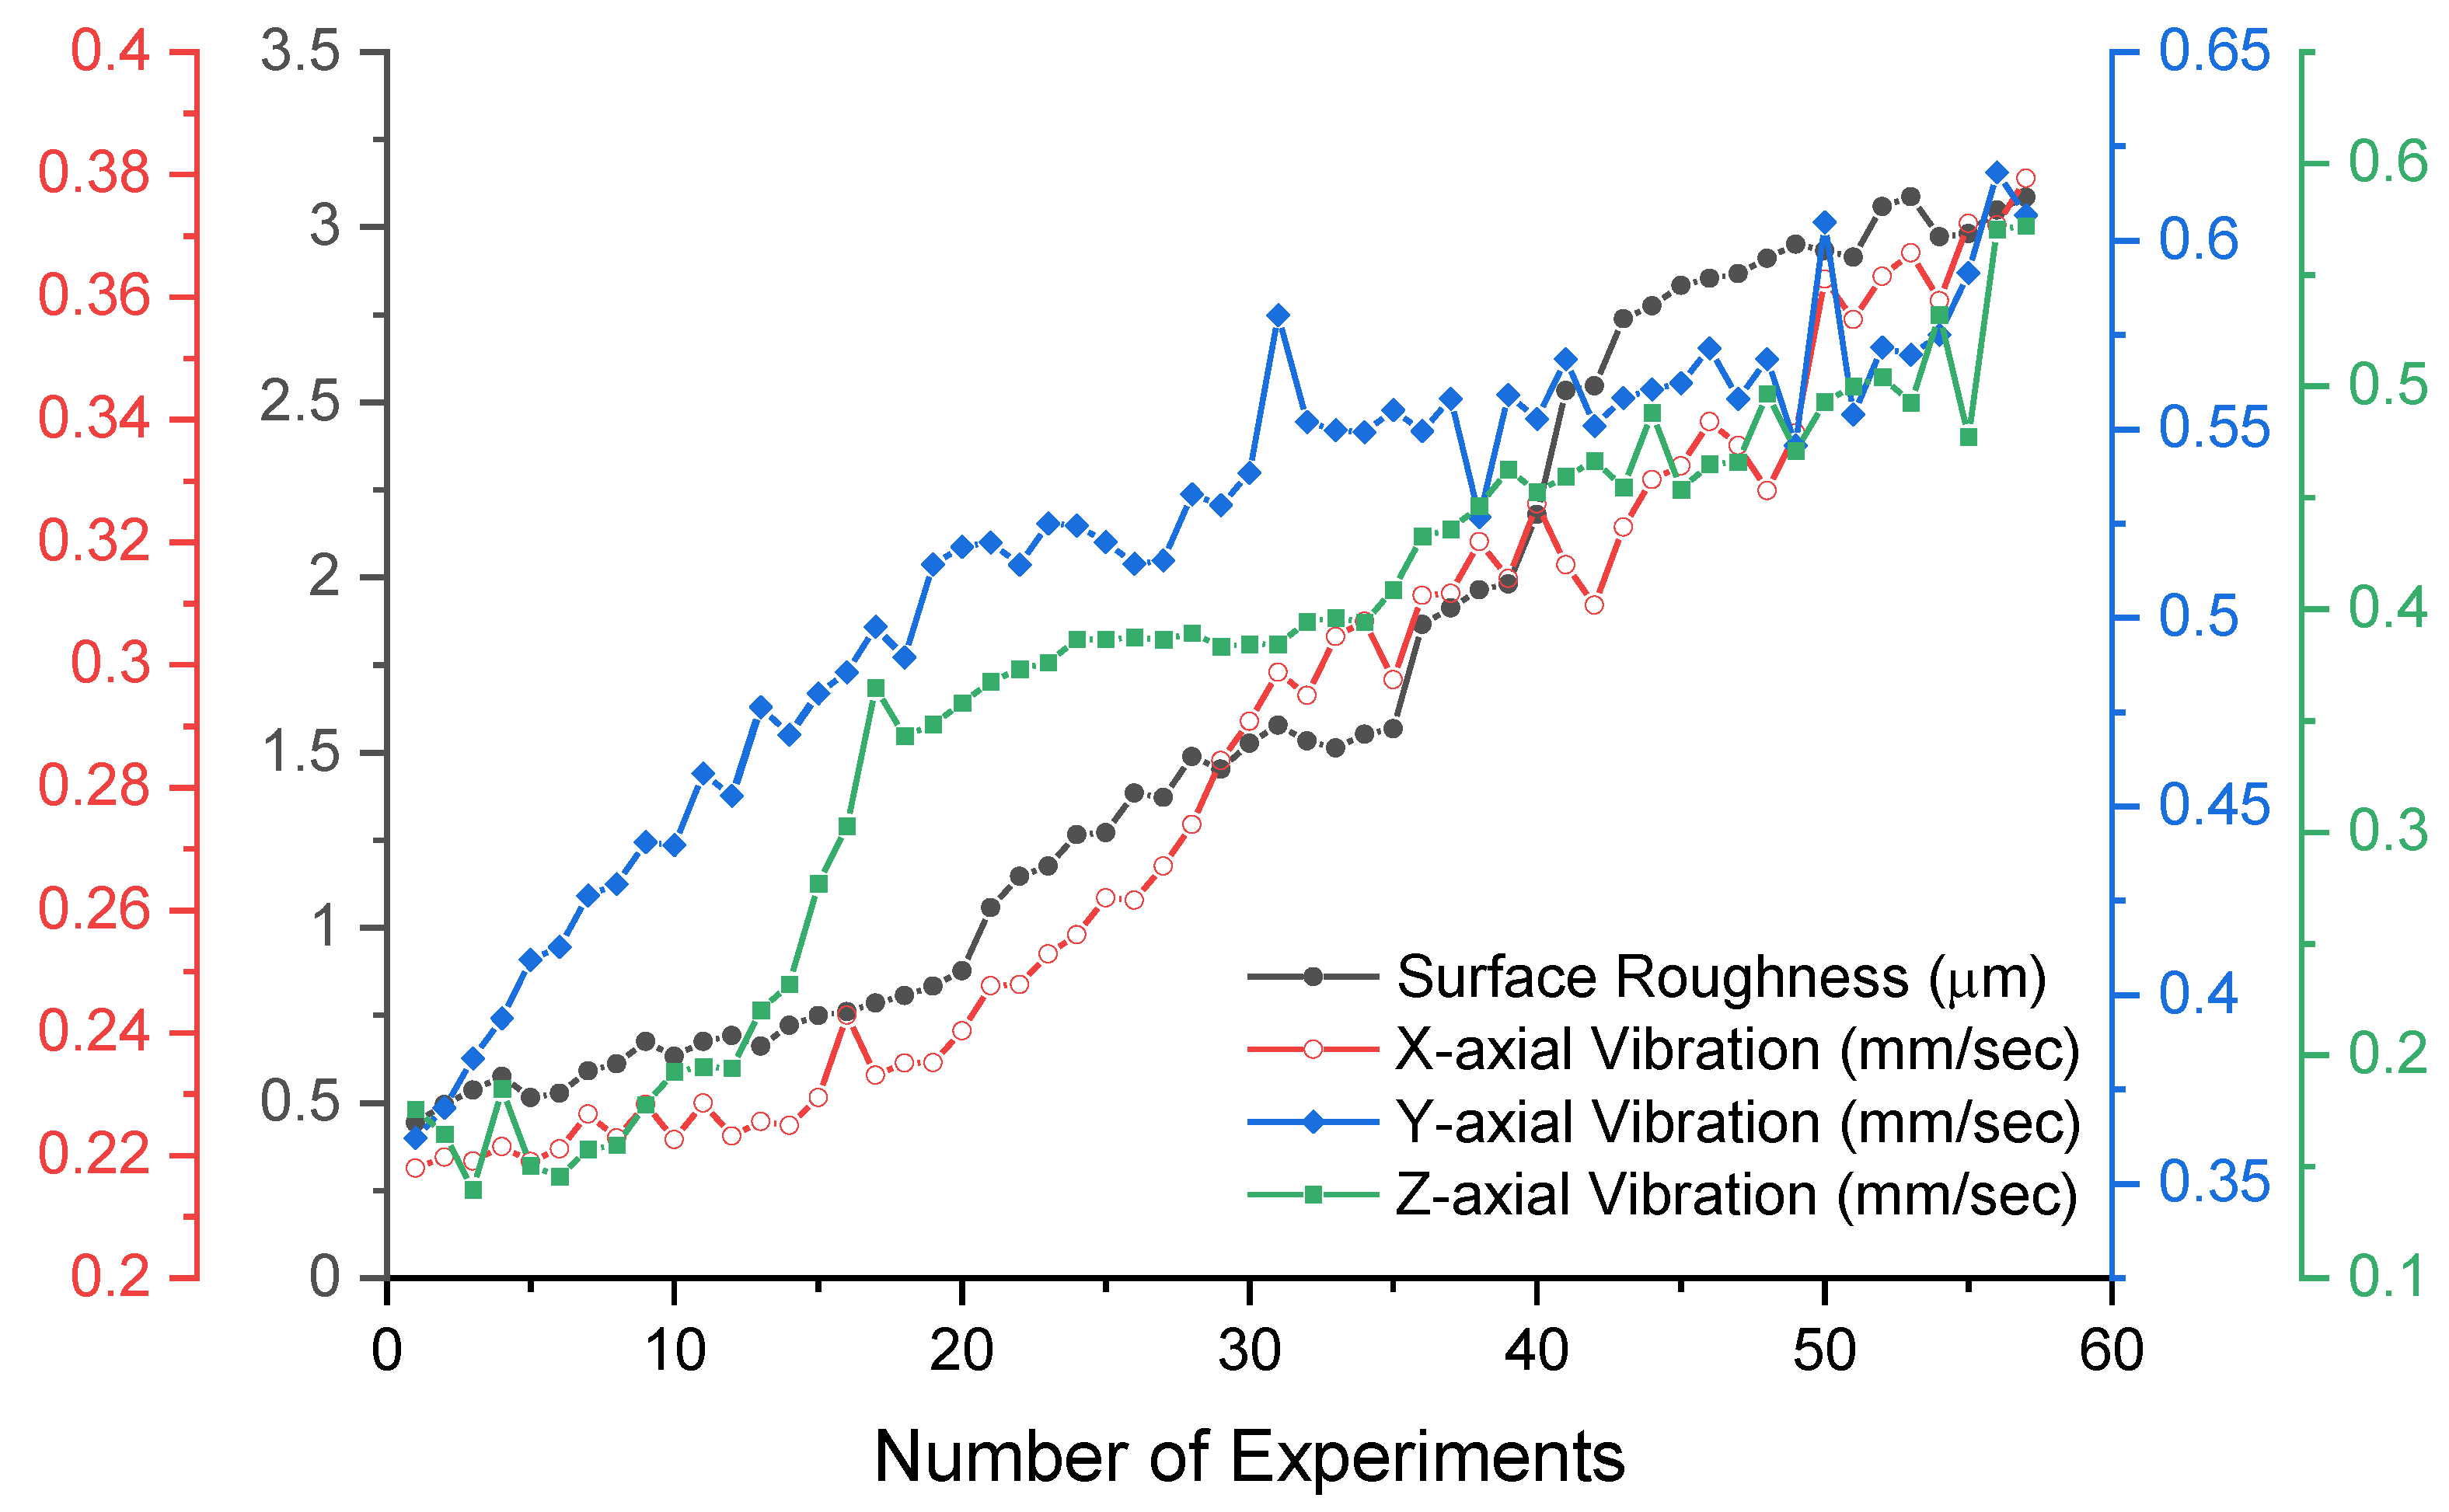
According to the vibration speed and acceleration analyses on the X-axis in the experiments, it is discovered that the vibration speed appears to increase linearly along with increasing processing times. Nevertheless, the vibration speed at the 47th~49th cutting slightly decreases by 0.01, and the vibration acceleration shows a slight increase between 0.256 and 0.277 G. Figure 13 clearly reveals the average change in vibration speed during each cutting on the X-axis in successive automated processing.
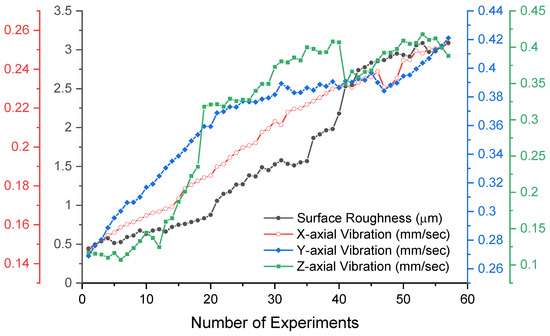
Figure 13.
The correlation between vibration and workpiece surface roughness in successive milling, under the average change in vibration speed during each cutting on the X-, Y-, Z- axis.
The mean speed and acceleration vibration values on the Y-axis in the experiments show a large increase in vibration speed along with increasing processing times, while the vibration speed decreases by about 0.02 at the 45th~48th cutting. The vibration acceleration appears to increase slightly, between 0.385 and 0.419 G. Figure 13 displays the average change in vibration speed on the Y-axis in successive automated processing.
The mean speed and acceleration vibration values on the Z-axis reveal stage changes in vibration speed along with increasing cutting times. The vibration speed appears to have a significant increase during the 1st~19th cutting, increasing about 0.20, and a slow increase during the 20th~40th cutting, increasing about 0.10. The vibration speed slows down the increase by about 0.06 during the 41st~50th cutting but does not appear to change much during the 50th~55th cutting. The vibration speed decreases by about 0.03 during the 55th~57th cutting, and the experiment is stopped due to the tooltip fracture at the 58th cutting. The vibration acceleration remains slightly increased between 0.167 and 0.187 G. Figure 13 shows the average changes in vibration speed on the Z-axis in successive automated processing.
Figure 13 also illustrates the vibrations along the X, Y, and Z axes with the surface roughness of the workpiece, respectively, during the automatic successive milling process. According to the experimental results, the analyses are explained as follows. Figure 13, respectively, displays the surface roughness of the workpiece and the average vibration generated along the X, Y, and Z axes during the automatic successive milling process. These levels increase with the number of milling operations. This study applies the principle of the Pearson Correlation Coefficient (r) to analyze and measure the degree of linear correlation between vibration and surface roughness.
The analysis results show that in Figure 13, the Pearson correlation coefficient between the surface roughness and the vibration along the X-axis during successive milling is about 0.972, the coefficient for the Y-axis is about 0.841, and the coefficient for the Z-axis is about 0.898. These results indicate a strong linear relationship between the surface roughness of the workpiece and the vibration generated during successive milling.
4.3. Tool Change Parameter Setting and Successive Process Error Message Recording System
The CNC machine tool spindle vibration in the cutting process is discussed in this chapter. Cutting tool wear in long-time successive processing would gradually increase with processing times. In order to find a proper tool change timing for keeping the workpiece quality in successive milling, the successive processing process is observed through the milling machine error message recorded on the IIoT platform to find out the solution.
4.3.1. Tool Change Timing Parameter Setting
In the successive cutting experiment, the tool flute fractured in the 58th experiment. After milling, the workpiece’s surface roughness is set within the N8 level, Ra 3.2 μm. In order to find out the best tool change timing matching the requirement for processing quality, a meaningful feature point is required for analyses. The workpiece surface roughness at the 52nd cutting experiment, for the first time, exceeds 3.0 μm. It is regarded as the feature point. The experimental data before and after the 52nd time are analyzed in detail.
According to the highest vibration speed analyses on the X-axis, Figure 14 displays the vibration speed change curve on the X-axis and the surface roughness change curve in automation successive cutting. The highest vibration speed at the 52nd time is 0.363396 mm/s, the highest vibration speed at the 51st time is 0.356342 mm/s, the highest speed at the 50th time is 0.362927 mm/s, and the highest vibration speed before the 49th time does not exceed 0.34 mm/s.
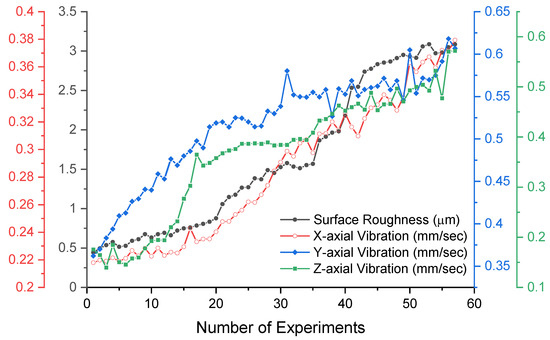
Figure 14.
The correlation between vibration and workpiece surface roughness in successive milling, under the highest vibration speed during each cutting on the X-, Y-, Z- axis.
From the highest vibration speed analyses on the Y-axis, Figure 14 reveals the highest vibration speed change curve on the Y-axis and the surface roughness change curve in automation successive cutting. The highest vibration speed at the 52nd, 51st, and 50th times was 0.571655 mm/s, 0.553874 mm/s, and 0.604851 mm/s, respectively. The highest vibration speed before the 49th time did not exceed 0.57 mm/s.
According to the highest vibration speed analyses on the Z-axis, Figure 14 displays the highest vibration speed change curve on the Z-axis and the surface roughness in automation successive cutting. The highest vibration speed at the 52nd, 51st, 50th, and 48th times was 0.504085 mm/s, 0.500035 mm/s, 0.492929 mm/s, and 0.496757 mm/s, respectively. The highest speed before the 47th time did not exceed 0.47 mm/s.
The highest vibration speed at the 50th time on the X- and Y-axis was higher than before the 50th time, while the highest vibration value at the 50th and 48th times achieved 0.49 mm/s. Regarding the performance on workpiece surface roughness, it appeared as Ra 2.933 μm at the 50th time and Ra 2.911 μm at the 48th time, without much difference. In this case, the speed vibration data at the 50th cutting is selected as the reference for the setting parameter of tool change in successive cutting.
That is, when the vibration speed on the X-axis reaches 0.363 mm/s, the vibration speed on the Y-axis achieves 0.605 mm/s, or the vibration speed on the Z-axis reaches 0.493 mm/s in a successive automated cutting process, the IoT system would propose a tool change alert to remind operators of tool change as soon as possible.
The analysis results show that in Figure 14, the Pearson correlation coefficient between vibration and surface roughness along the X-axis during continuous milling is 0.972, the coefficient for the Y-axis is 0.841, and the coefficient for the Z-axis is 0.898. These results indicate a strong linear relationship between vibration and surface roughness generated during successive milling.
4.3.2. Human–Machine Interface of VMX Plateform
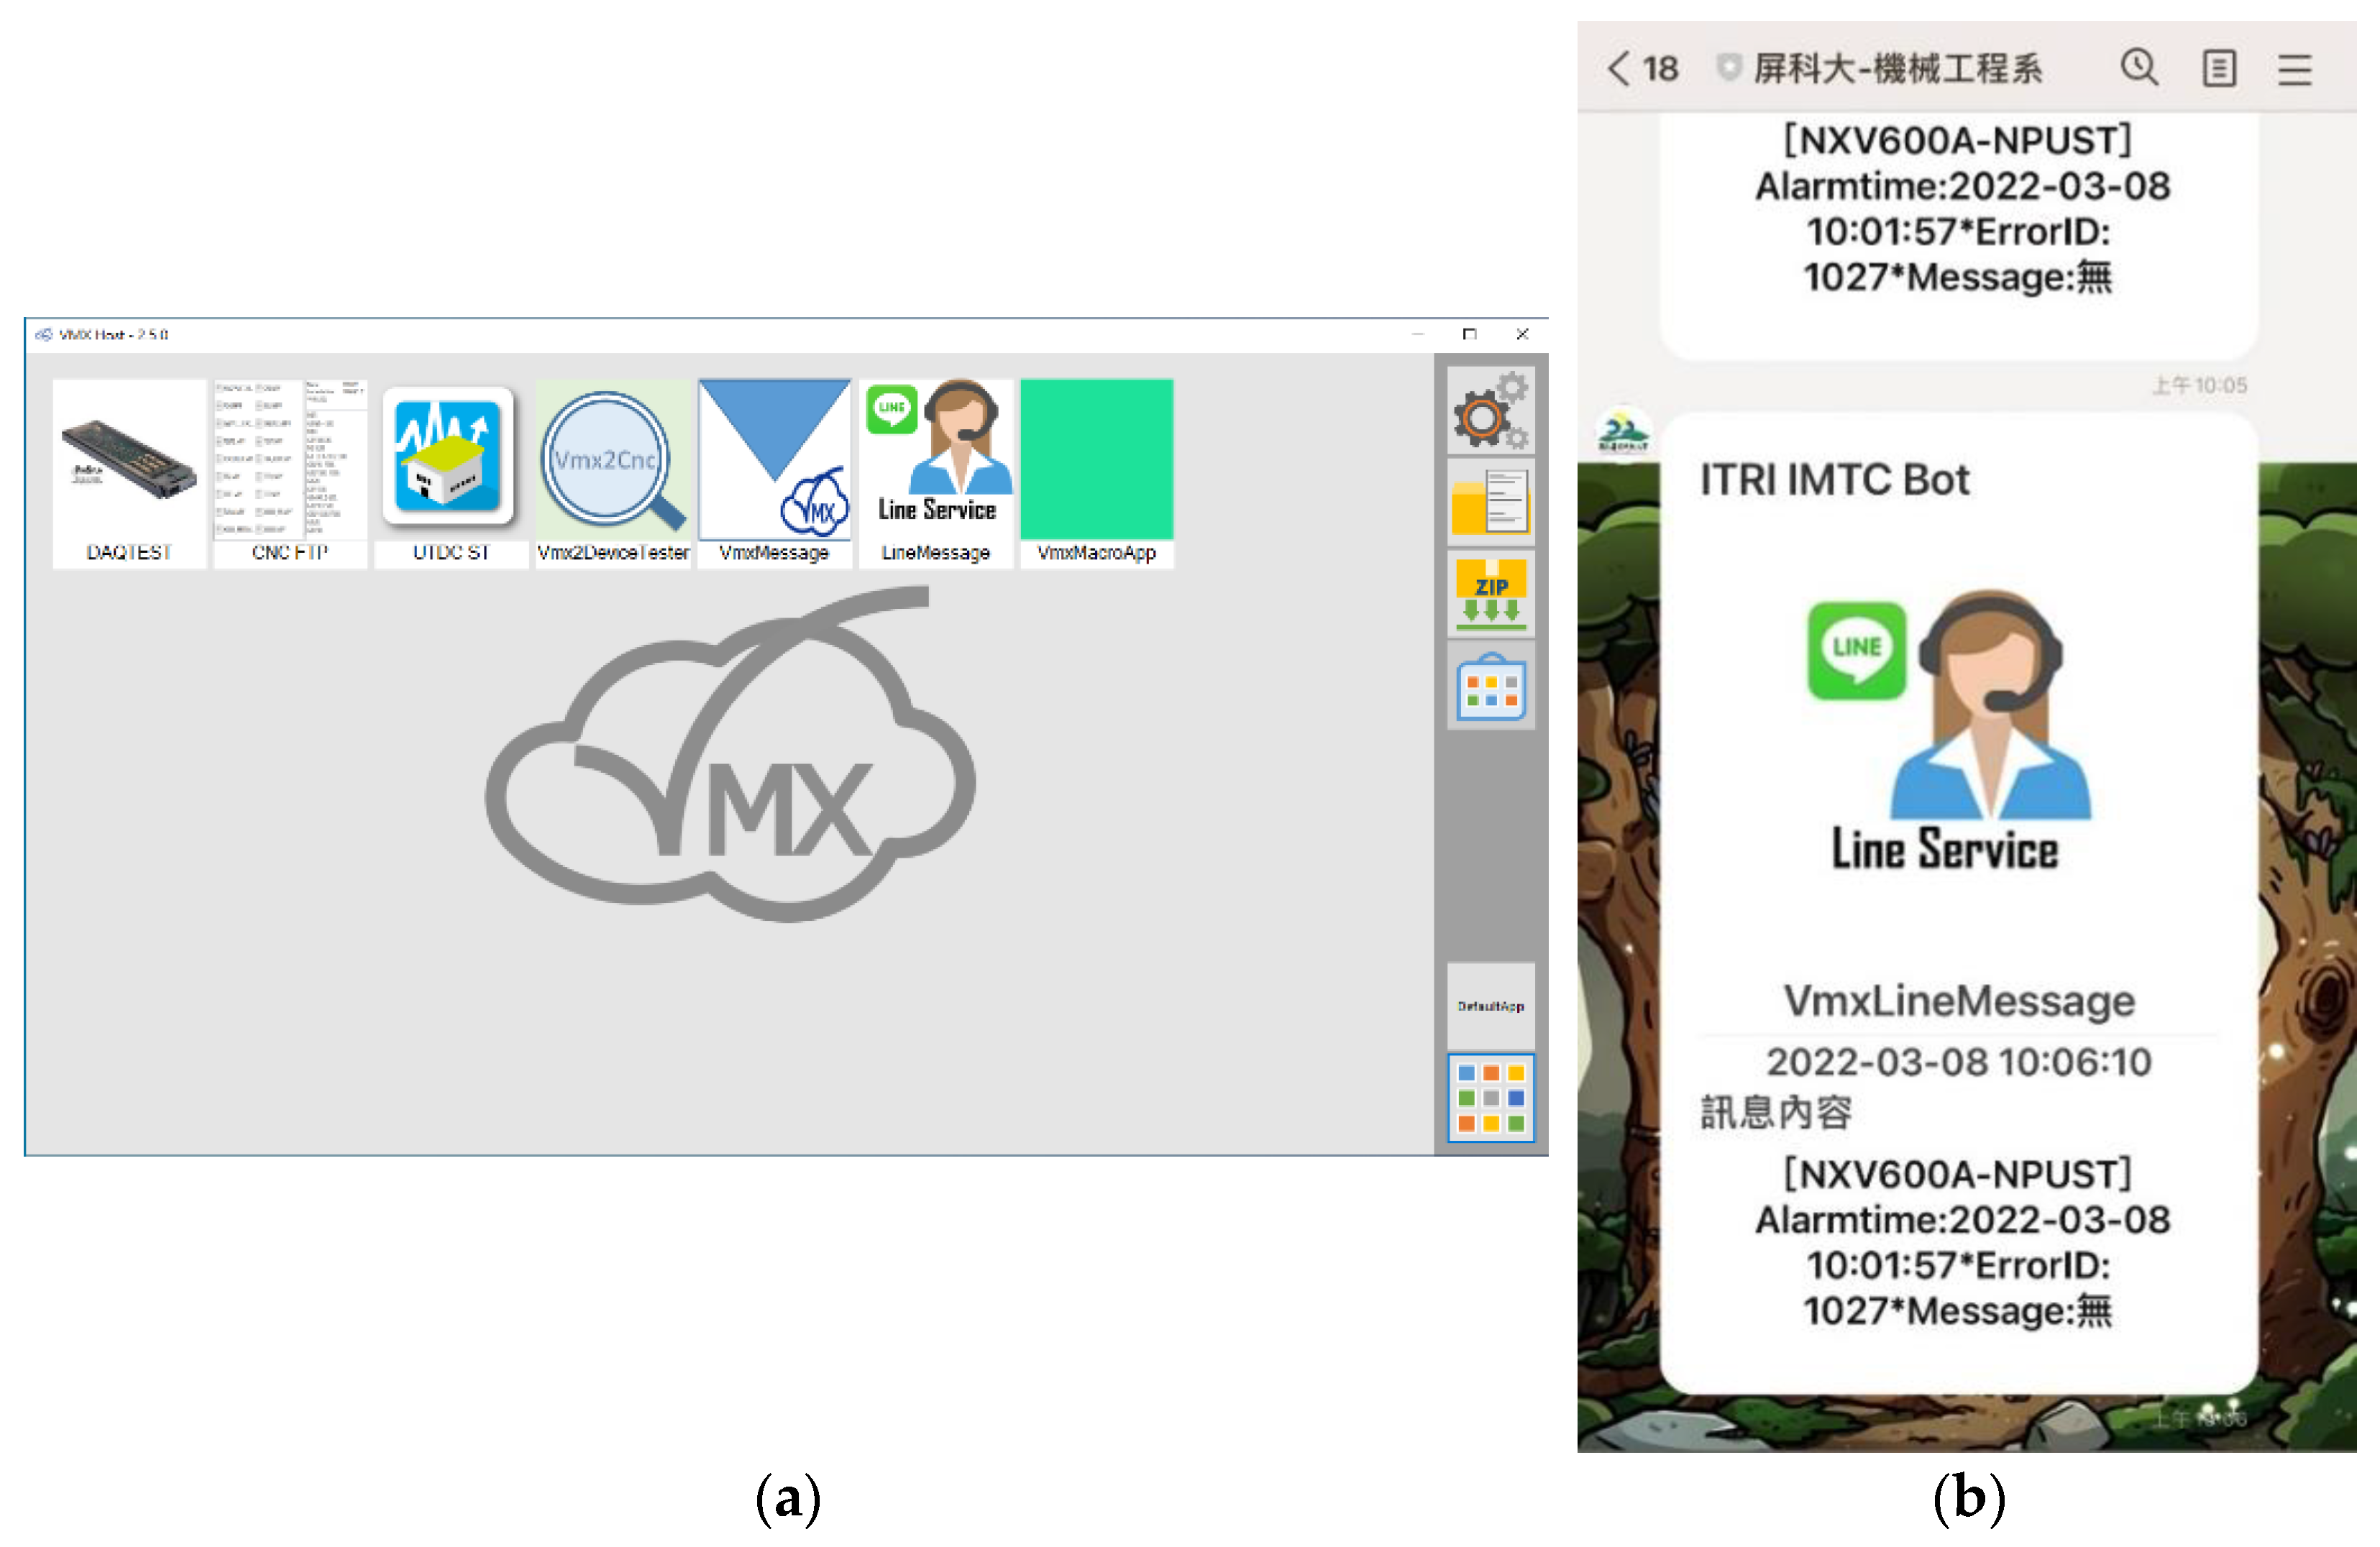
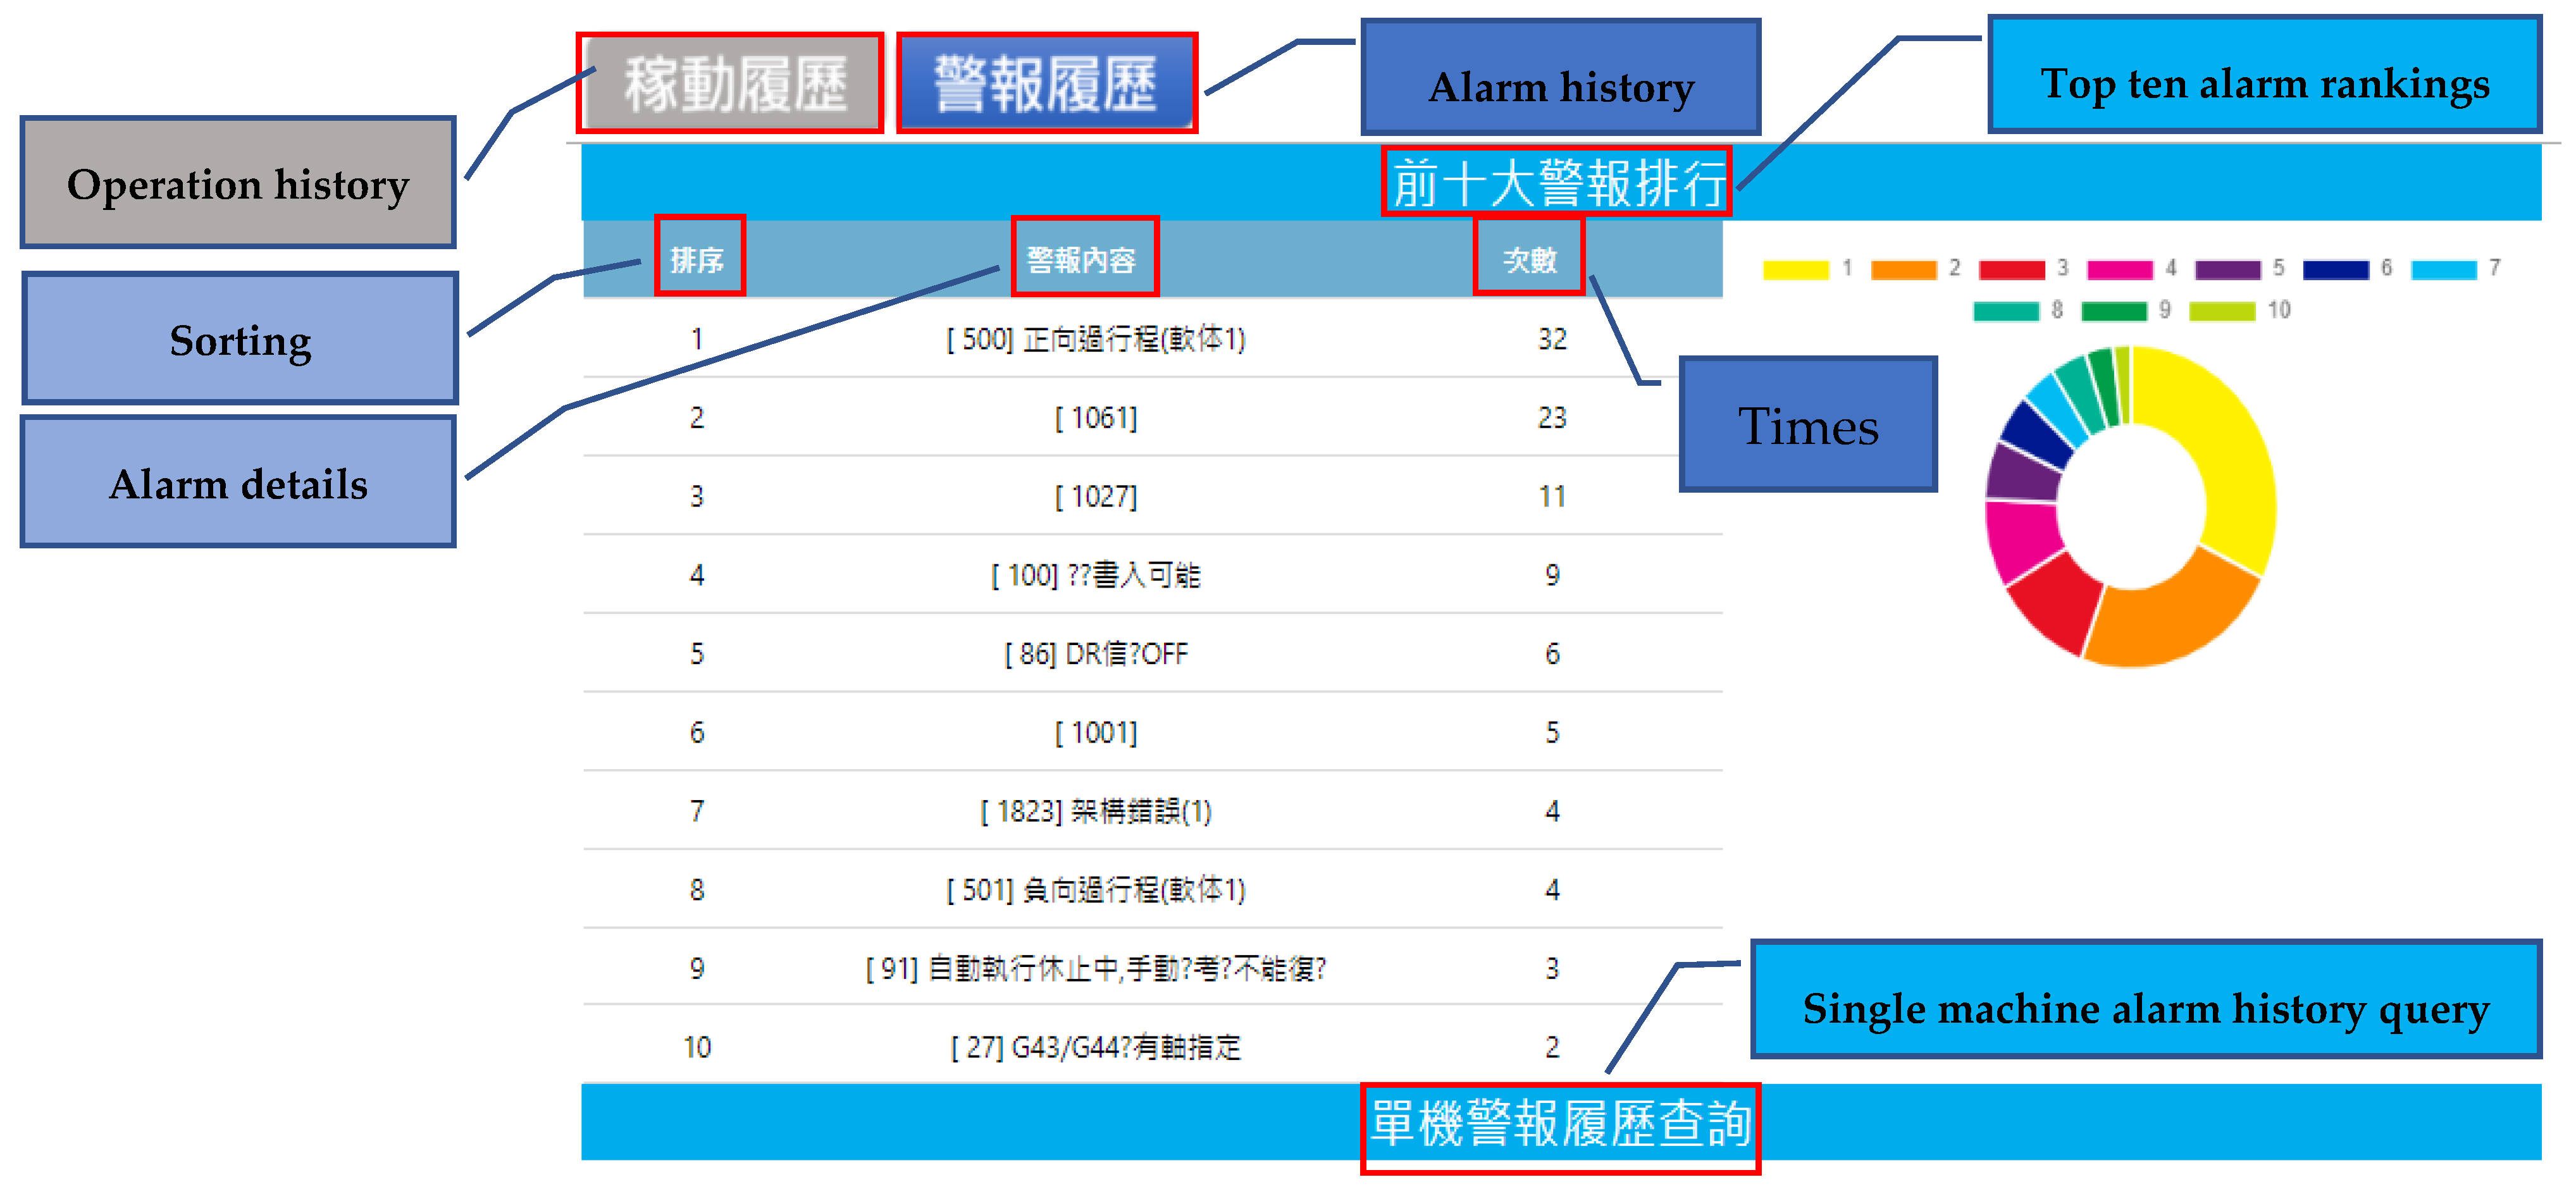
Figure 15a shows the home screen of the VMX human–machine interface. The App is designed for the statistics page of processing abnormity, and frequent problems occurring in the automated processing could be clearly understood on the activation analysis interface. Figure 15b displays the test screen of linked VMX IIoT and LINE. At the time of error occurrence, the platform could inform users through the LINE App on mobiles for real-time dealing with the problems on the production line. Figure 16 displays the processing abnormality statistics interface of VMX IIoT automated processing system, which is clearly presented with a pie chart for users.

Figure 15.
The HMI of VMX the LINE screen: (a) the main HMI of VMX; (b) the test screen of linked VMX and LINE.

Figure 16.
The processing abnormality statistics interface of VMX with a pie chart for users.
In the entire cutting experiment process, abnormal message statistical chart analyses reveal that schedule error during coordinate positioning is the most frequent error during the experiment. Moreover, material shallow clamping or loosing on the mechanical gripper of the robot arm in the workpiece delivery process is recorded in detail to largely help the process optimization in the future, including the statistical analyses of automated processing abnormal messages, the adjustment of robot arm clamping depth and clamping force, as well as the anti-slip gripper of the robot arm.
5. Conclusions
This study realizes the establishment of Industrial Internet of Things (IIoT) automated processing and proposes good tool change timing for users changing tools before the product surface roughness is affected by tool wear. Taguchi Method is used in the experimental process to obtain the optimized cutting parameters as well as in the automated successive processing to obtain better tool change timing, aiming at big data analytics in the processing process. Other important experimental results in this study are summarized as follows:
- The optimized cutting parameter combination acquired through the Taguchi Method experiments contains a spindle rotational speed of 4100 rpm, cutting output of each flute of 0.04 (mm/min), radial cutting depth of 20 %D (1.2 mm), and axial cutting depth of 1.0 mm;
- Under optimized cutting parameters, the surface roughness Ra 0.444 μm obtained in the milling, compared to the surface roughness 0.465 μm obtained in the milling under cutting parameters in the orthogonal array, improves the processing quality by 4.516%;
- Through Analysis of Variance, the cutting output of feed per tooth contribution is 64.18%, and the confidence level is 98%, while the radial cutting depth contribution is 25.34% and the confidence level is 91%. The cutting parameters of the cutting output of each flute and radial cutting depth are, therefore, adjusted to present more obvious effects on workpiece surface roughness;
- The Pearson correlation coefficient between vibration and surface roughness along the X-, Y-, and Z-axis during continuous milling is 0.972, 0.841, and 0.898. These results indicate a strong linear relationship between vibration and surface roughness generated during successive milling, respectively;
- In the successive automated cutting process, the IoT system would propose a tool change alert when the vibration speed on the X-, Y-, or Z-axis, respectively, reaches 0.363 mm/s, 0.605 mm/s, or 0.493 mm/s, to remind operators of tool change as soon as possible.
The currently developed IIoT-applied automated processing system still requires many improvements. It is expected that the IIoT human–machine interface design is more user friendly. In addition, the lens could be set up on the machine tool for image monitoring, enhancing the entire system reliability, and solving the problem of merely cutting related parameters being monitored.
This study simply uses an S45C mild carbon steel workpiece for dry cutting. The research application could be expanded to the practice of automated processing with different materials and cutting methods. It is also expected to provide useful references for IoT intelligent automated processing, optimization processes, and predictive maintenance.
Author Contributions
Conceptualization, C.-S.C. and P.-Y.P.; methodology, C.-S.C.; software, C.-S.C. and P.-Y.P.; validation, C.-S.C. and P.-Y.P.; formal analysis, C.-S.C.; investigation, P.-Y.P.; resources, C.-S.C.; data curation, C.-S.C.; writing—original draft preparation, C.-S.C.; writing—review and editing, C.-S.C.; visualization, C.-S.C. and P.-Y.P.; supervision, C.-S.C.; project administration, C.-S.C.; funding acquisition, C.-S.C. All authors have read and agreed to the published version of the manuscript.
Funding
The research was funded by the Ministry of Education, Taiwan, under the project: Improvement Plan for Teaching in Smart Machinery Integrated Manufacturing Systems Equipment.
Data Availability Statement
The original contributions presented in this study are included in the article. Further inquiries can be directed to the corresponding author.
Acknowledgments
We would like to thank Tsai-Te Huang, Ching-Shui Chang, and Lay-Gaik Teoh for their valuable insights on IIoT system architecture.
Conflicts of Interest
The authors declare no conflicts of interest.
References
- Malik, P.K.; Sharma, R.; Singh, R.; Gehlot, A.; Satapathy, S.C.; Alnumay, W.S.; Pelusi, D.; Ghosh, U.; Nayak, J. Industrial Internet of Things and its Applications in Industry 4.0: State of The Art. Comput. Commun. 2021, 166, 125–139. [Google Scholar]
- Amanullah, M.A.; Habeeb, R.A.A.; Nasaruddin, F.H.; Gani, A.; Ahmed, E.; Nainar, A.S.M.; Akim, N.M.; Imran, M. Deep learning and big data technologies for IoT security. Comput. Commun. 2020, 151, 495–517. [Google Scholar] [CrossRef]
- Kebande, V.R. Industrial Internet of Things (IIOT) forensics: The forgotten concept in the race toward industry 4.0. Forensic Sci. Int. Rep. 2022, 5, 100257. [Google Scholar]
- Javaid, M.; Haleem, A.; Singh, R.P.; Rab, S.; Suman, R. Upgrading the manufacturing sector via applications of Industrial Internet of Things (IIoT). Sens. Int. 2021, 2, 110–119. [Google Scholar]
- Xu, Z.; Liu, W.; Huang, J.; Yang, C.; Lu, J.; Tan, H. Artificial intelligence for securing iot services in edge computing: A survey. Secur. Commun. Netw. 2020. [Google Scholar] [CrossRef]
- Mehmood, M.U.; Chun, D.; Zeeshan; Han, H.; Jeon, G.; Chen, K. A review of the applications of artificial intelligence and big data to buildings for energy-efficiency and a comfortable indoor living environment. Energy Build. 2019, 202, 109383. [Google Scholar] [CrossRef]
- Hirman, M.; Benesova, A.; Sima, K.; Steiner, F.; Tupa, J. Design Fabrication and Risk Assessment of IoT Unit for Products Manufactured in Industry 4.0 Factory. Procedia Manuf. 2020, 51, 1178–1183. [Google Scholar]
- Kibria, M.G.; Nguyen, K.; Villardi, G.P.; Zhao, O.; Ishizu, K.; Kojima, F. Big data analytics, machine learning, and artificial intelligence in next-generation wireless networks. IEEE Access 2018, 6, 32328–32338. [Google Scholar] [CrossRef]
- Cioffi, R.; Travaglioni, M.; Piscitelli, G.; Petrillo, A.; De Felice, F. Artificial intelligence and machine learning applications in smart production: Progress, trends, and directions. Sustainability 2020, 12, 492. [Google Scholar] [CrossRef]
- Sisinni, E.; Saifullah, A.; Han, S.; Jennehag, U.; Gidlund, M. Industrial Internet of Things: Challenges, Opportunities, and Directions. IEEE Trans. Ind. Inform. 2018, 14, 4724–4734. [Google Scholar] [CrossRef]
- Qazi, S.; Khawaja, B.A.; Farooq, Q.U. IoT-Equipped and AI-Enabled Next Generation Smart Agriculture: A Critical Review, Current Challenges and Future Trends. IEEE Access 2022, 10, 21219–21235. [Google Scholar] [CrossRef]
- Chen, C.; Li, Y.; Wang, Q.; Yang, X.; Wang, X.; Yang, L.T. An Intelligent Edge-Cloud Collaborative Framework for Communication Security in Distributed Cyber-Physical Systems. IEEE Netw. 2024, 38, 172–179. [Google Scholar] [CrossRef]
- Xu, H.; Yu, W.; Griffith, D.; Golmie, N. A Survey on Industrial Internet of Things: A Cyber-Physical Systems Perspective. IEEE Access 2018, 6, 78238–78259. [Google Scholar] [CrossRef] [PubMed]
- Borghesi, A.; Burrello, A.; Bartolini, A. ExaMon-X: A predictive maintenance framework for automatic monitoring in industrial ioT systems. IEEE Internet Things J. 2023, 10, 2995–3005. [Google Scholar] [CrossRef]
- Bhavani, G.; Sudha, V.N.; Raghuram, K.S.; Suresh, K.; Kumar, P.V. Taguchi Method to Enhance the Surface Roughness. AIP Conf. Proc. 2023, 2810, 140008. [Google Scholar] [CrossRef]
- Bhaskar Mutyalu, K.; Venkatrami Reddy, V.; Uma, S.; Maheswara Reddy, K.; Prasad, L. Effect of machining parameters on cutting forces during turning of EN 08, EN 36 & mild steel on high speed lathe by using Taguchi orthogonal array. Mater. Today Proc. 2023, 80, 2411–2415. [Google Scholar] [CrossRef]
- Bouhali, R.; Bendjeffal, H.; Chetioui, K.B.; Bousba, I. Multivariable optimization based on the Taguchi method to study the cutting conditions in aluminum turning. Int. J. Interact. Des. Manuf. 2024, 1–11. [Google Scholar] [CrossRef]
- Nguyen, V.; Altarazi, F.; Tran, T. Optimization of Process Parameters for Laser Cutting Process of Stainless Steel 304: A Comparative Analysis and Estimation with Taguchi Method and Response Surface Methodology. Math. Probl. Eng. 2022, 6677586. [Google Scholar] [CrossRef]
- Singh, M.; Garg, H.K.; Maharana, S.; Muniappan, A.; Loganathan, M.K.; Nguyen, T.V.T.; Vijayan, V. Design and Analysis of an Automobile Disc Brake Rotor by Using Hybrid Aluminium Metal Matrix Composite for High Reliability. J. Compos. Sci. 2023, 7, 244. [Google Scholar] [CrossRef]
- Singh, M.; Garg, H.K.; Maharana, S.; Yadav, A.; Singh, R.; Maharana, P.; Nguyen, T.V.T.; Yadav, S.; Loganathan, M.K. An Experimental Investigation on the Material Removal Rate and Surface Roughness of a Hybrid Aluminum Metal Matrix Composite (Al6061/SiC/Gr). Metals 2021, 11, 1449. [Google Scholar] [CrossRef]
- Ginting, A.; Nouari, M. Surface integrity of dry machined titanium alloys. Int. J. Mach. Tools Manuf. 2009, 49, 325–332. [Google Scholar] [CrossRef]
- Pereira, R.B.D.; Lauro, C.H.; Brandão, L.C.; Ferreira, J.R.; Davim, J.P. Tool wear in dry helical milling for hole-making in AISI H13 hardened steel. Int. J. Adv. Manuf. Technol. 2019, 101, 2425–2439. [Google Scholar] [CrossRef]
- Caggiano, A.; Improta, I.; Nele, L. Characterization of a New Dry Drill-Milling Process of Carbon Fiber Reinforced Polymer Laminates. Materials 2018, 11, 1470. [Google Scholar] [CrossRef] [PubMed]
- Dudzinski, D.; Devillez, A.; Moufki, A.; Larrouquère, D.; Zerrouki, V.; Vigneau, J. A review of developments towards dry and high-speed machining of Inconel 718 alloy. Int. J. Mach. Tools Manuf. 2004, 44, 439–456, ISSN 0890-6955. [Google Scholar] [CrossRef]
- Pimenov, D.Y.; da Silva, L.R.R.; Machado, A.R.; França, P.H.P.; Pintaude, G.; Unune, D.R.; Kuntoğlu, M.; Krolczyk, G.M. A comprehensive review of machinability of difficult-to-machine alloys with advanced lubricating and cooling techniques. Tribol. Int. 2024, 196, 109677, ISSN 0301-679X. [Google Scholar] [CrossRef]
- Tamil Selvan, M.; Somasundaram, M.; Raja Annamalai, A. Optimizing dry milling of stir-cast and heat-treated AZ80 magnesium alloy using multiple criteria optimization technique: An experimental study. Sci. Rep. 2024, 14, 25801. [Google Scholar] [CrossRef] [PubMed]
- Chen, C.-S.; Pan, P.Y. Industrial Internet of Things Applied to Automated Processing System. In Proceedings of the 20th Conference on Precision Machinery and Manufacturing Technology—PMMT 2022, Kenting, Taiwan, 19–21 May 2023; p. B005. [Google Scholar]
- Chen, C.-S.; Hsu, S.-C. The Relationship of Optimal Cutting Parameter and Surface Roughness in Dry Milling. In Proceedings of the 2024 IEEE 6th Eurasia Conference on IoT, Communication and Engineering (IEEE ECICE 2024), Yunlin, Taiwan, 15–17 November 2024; p. T240035. [Google Scholar]
- Yang, Y.; Dong, Z.; Meng, Y.; Shao, C. Data-Driven Intelligent 3D Surface Measurement in Smart Manufacturing: Review and Outlook. Machines 2021, 9, 13. [Google Scholar] [CrossRef]
- Tseng, L.-W.; Hu, T.-S.; Hu, Y.-C. A Smart Tool Holder Calibrated by Machine Learning for Measuring Cutting Force in Fine Turning and Its Application to the Specific Cutting Force of Low Carbon Steel S15C. Machines 2021, 9, 190. [Google Scholar] [CrossRef]
- Mattila, J.; Ala-Laurinaho, R.; Autiosalo, J.; Salminen, P.; Tammi, K. Using Digital Twin Documents to Control a Smart Factory: Simulation Approach with ROS, Gazebo, and Twinbase. Machines 2022, 10, 225. [Google Scholar] [CrossRef]
- Celent, L.; Bajić, D.; Jozić, S.; Mladineo, M. Hard Milling Process Based on Compressed Cold Air-Cooling Using Vortex Tube for Sustainable and Smart Manufacturing. Machines 2023, 11, 264. [Google Scholar] [CrossRef]
- Dani, S.; Rahman, A.; Jin, J.; Kulkarni, A. Cloud-Empowered Data-Centric Paradigm for Smart Manufacturing. Machines 2023, 11, 451. [Google Scholar] [CrossRef]
- Abdullahu, F.; Zhujani, F.; Todorov, G.; Kamberov, K. An Experimental Analysis of Taguchi-Based Gray Relational Analysis, Weighted Gray Relational Analysis, and Data Envelopment Analysis Ranking Method Multi-Criteria Decision-Making Approaches to Multiple-Quality Characteristic Optimization in the CNC Drilling Process. Processes 2024, 12, 1212. [Google Scholar] [CrossRef]
- G-TECH Instruments Incorporation, VimoNetX1 Instruction Manual. Available online: http://www.ktmeng.com/pdf/vimonet%20manual2.pdf (accessed on 19 March 2025).


Disclaimer/Publisher’s Note: The statements, opinions and data contained in all publications are solely those of the individual author(s) and contributor(s) and not of MDPI and/or the editor(s). MDPI and/or the editor(s) disclaim responsibility for any injury to people or property resulting from any ideas, methods, instructions or products referred to in the content. |
© 2025 by the authors. Licensee MDPI, Basel, Switzerland. This article is an open access article distributed under the terms and conditions of the Creative Commons Attribution (CC BY) license (https://creativecommons.org/licenses/by/4.0/).