Abstract
This study investigated a factory fire that resulted in an unusual situation that caused the deaths of two firefighters. The official fire investigation report was analyzed, records were obtained, and on-site investigations and interviews were conducted. Using these additional data and a calorimetric analysis to determine the combustibility of goods stored in the building at the time, a functional 3D model was produced, and a fire dynamics simulator (FDS) was run. The model was augmented using the results of calorimetric experiments for three types of primary goods being stored in the warehouse area: paper lunch boxes, tissue paper, and corrugated boxes. The reaction heat data obtained for each of the three sample types was 848.24, 468.29, and 301.21 J g−1, respectively. The maximum mass loss data were 98.522, 84.439, and 90.811 mass% for each of the three types, respectively. A full-scale fire scene reconstruction confirmed the fire propagation routes and changes in fire hazard factors, such as indoor temperature, visibility, and carbon monoxide concentration. The FDS results were compared to the NIST recommended values for firefighter heat exposure time. The cause of death for both firefighters was also investigated in terms of the heat resistance of the facepiece lenses of their self-contained breathing apparatus. Based on the findings of this study, recommendations can be made to forestall the recurrence of similar events.
1. Introduction
The total number of firefighter deaths in the United States between 1977 and 2019 was 4254, including 340 firefighters who died in New York’s World Trade Center (WTC) on 11 September 2001 [1]. Excluding the WTC deaths, the highest number of firefighters ever lost in a single year was 174 in 1978; the lowest annual death toll was 48 in 2019—the first time that the number had fallen below 50. In a 5-year period from early 2015, 310 firefighters died, an average of 62 per year. Of the 48 who died in 2019, 20 were career firefighters, 25 were volunteers, and 3 were classified as “others”. Of the 48 firefighters on duty, 13 died on the scene, including 10 in building fires and 3 in forest fires. The data show that for every 100,000 building fires between 2014 and 2018, an average of 5.8 firefighters died in the line of duty in stores/offices, followed by 2.9 in warehouses, 2.7 in public gathering places/residential flats, 2.1 in manufacturing plants, and 0 in health care/educational institutions [1]. Statistics show that between 1990 and 2007, the total average number of career firefighters in the United States was around 282,325 (person yr−1), and the average number of fatalities was ca. 29.2 (person yr−1), of which approximately 7% were due to structural failures. The total number of volunteer firefighters averaged approximately 802,594 (persons yr−1), and the average number of fatalities was roughly 56.6 (persons yr−1), of which ca. 3% died due to structural failures [2]. In 2020, 96 firefighters perished in the United States; 35 of these deaths were attributed to COVID-19. Of the 96 who died on duty, only 6 died as a direct result of their involvement in building fires. These included one firefighter in Cass County, Missouri, USA, who died when the floor of a burning house collapsed; two firefighters in Porterville, California, USA, who became disoriented in a library fire; one firefighter in Cumberland, Pennsylvania, USA, who died when a porch roof collapsed in a house fire; one firefighter in Forsyth, Michigan, USA, who died when the floor of a burning house collapsed; and one firefighter in Martinsburg, WV, USA, who was struck by a falling beam in a barn fire [3].
Given the above data, it is likely that no more than 20% of firefighters perish while fighting building fires in the United States. Indeed, most fatalities are similar to the following example of a house fire in New Haven, Connecticut, USA. At 12:15 a.m. on 12 May 2021, two firefighters became disoriented and were trapped due to smoke from a fire and the collapse of the building structure. This resulted in the death of one and severe injury to the other [4].
Guillaume et al. investigated computational fluid dynamics (CFD) models in a fire dynamics simulator (FDS) using diverse scenarios with different fire sources and ventilation conditions. They successfully modeled the UK’s Grenfell Tower fire incident that occurred in June 2017, showing that the fire initially developed from inside a flat [5]. Vinay modeled the progression of fires under conditions of high oxygen concentration and used FDS to investigate the simulation of a hospital fire [6,7]. Til et al. enhanced the smoke ventilation systems in fire scenarios using CFD software version 6.8.0 [8]. Hanifi et al. probed the propagation of fire in chemical storage facilities through numerical simulations [9].
Data from the Fire Statistics Annual Report of the National Fire Agency show that from 2004 to 2024, 63 firefighters died while on duty in Taiwan [10]. Of these, 25 (75.8%) died while fighting building fires, which is a considerably higher rate than in the United States; however, the causes of death remain similar.
This paper is a case study of a factory fire at 01:53 a.m. on 03 October 2019 in Daya District, Taichung City, Taiwan. According to the official fire investigation report, the fire started on the northeast side of No. 92-7 and was caused by an electrical malfunction. Throughout the response operation, six to eight hose lines were aimed at the north and west sides of No. 92-7. At first, the fire did not reach No. 92-6, and there was approximately an 8 m wide passage between Nos. 92-7 and 92-6 (see Figure 1). To assess the condition of No. 92-6, the site commander assigned two firefighters to enter the building via the second floor and conduct ambient temperature measurements using an infrared camera. Shortly after the two firefighters entered, a full-scale fire broke out at No. 92-6, resulting in the death of the two firefighters. The exact cause of the firefighters’ deaths has yet to be determined, as this incident has anomalies that make it uniquely dissimilar to previous cases. To determine what occurred, the official fire investigation report and the firefighters’ autopsies were sequestered, and the research team visited the fire site to gather information regarding the building construction materials for Nos. 92 and 92-5, both of which were unaffected by the fire. Interviews with the factory owners and employees were also conducted to bring together all the possible data on the matter, including the precise building dimensions, structure type, internal combustibles, and their stacking situation. This was combined with information regarding the number of window openings as well as their size and location.
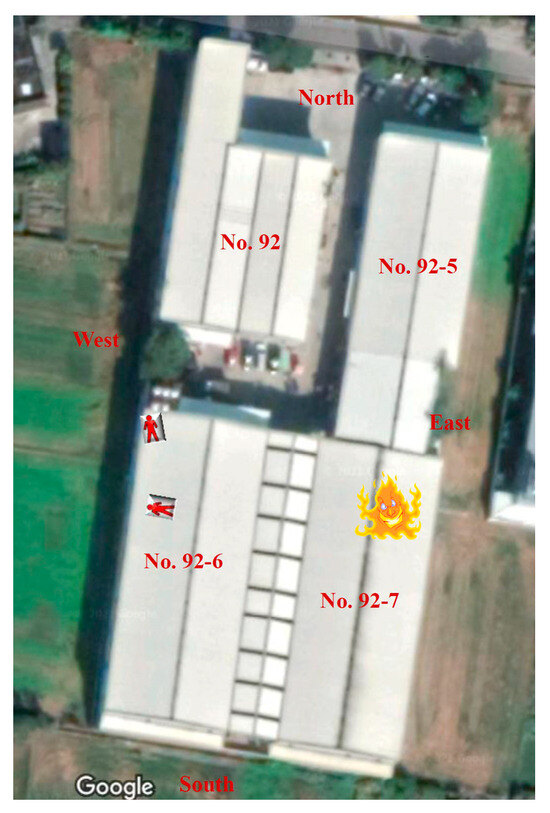
Figure 1.
Google satellite image of the building before the fire.
Samples of the objects being stored in the buildings were submitted to calorimetric analysis. According to the FDS user guide, Section 11.5.5, the heat of reaction thermal analysis data from DSC and TGA can be used as FDS input parameters [11]. The data from these tests were used to populate an FDS model so that the simulation program could reconstruct the most accurate scenario possible. The FDS was applied to reconstruct the entire fire scenario in an attempt to determine the primary cause(s) of the fire at No. 92-6. The results of the computer simulation were based on changes in temperature, visibility, carbon monoxide (CO) concentration, and oxygen concentration inside No. 92-6 during the fire. The data were combined with information regarding the personal protective equipment worn by the firefighters at the time, such as the self-contained breathing apparatus (SCBA). This study aimed to establish the temperature limit that SCBA masks can withstand and determine whether this was exceeded due to the indoor environment at the fire scene. According to the literature [12,13], fire investigators already make good use of the FDS computer simulation system. When combined with experimental techniques, such as calorimetric analysis, FDS simulation can render a complete fire scene reconstruction and assist with forensic fire analysis, providing fair, objective, and accurate data, as demonstrated by Alonso et al. [14] and Yang et al. [15]. A secondary purpose of this study was to assist in determining the causes of death of the two firefighters. Through in-depth investigations, analyses, experiments, and computer simulations, this study hoped to forestall a recurrence of this situation. The approaches used in this study with regard to data reporting, data management, and data analysis could also be of use to other researchers and people responsible for formulating safety protocols.
2. Building Configuration
The research team visited the site of the incident on 26 May 2020. Through interviews with the factory owners and employees, the research team compiled information regarding the building dimensions, window and door placement, and the superstructure. Data on internal combustibles, such as the type and number of objects, their locations, and the object sizes, were also gathered. When combined, these formed the basis of the FDS. Even though the fire destroyed Nos. 92-6 and 92-7, both buildings were similarly constructed to Nos. 92 and 92-5, which did not suffer damage. Thus, many of the building attributes from Nos. 92 and 92-5 could be used to model the scenario. The goods in Nos. 92 and 92-5 were even stacked in a similar pattern. The four buildings in Figure 1 were all two-story metal houses, and Figure 2a provides their internal layouts. The buildings were predominantly constructed of light steel supports with a paneled timber floor forming the second floor, as indicated by the arrow in Figure 2b. In the simulation for this study, the timber floor is configured using the FDS built-in material YELLOW PINE. The density is 640 kg m−3, the specific heat is 2.58 kJ kg−1·K−1, the conductivity is 0.14 W m−1·K−1, the emissivity is 0.9, and the absorption coefficient is 50,000 m−1.
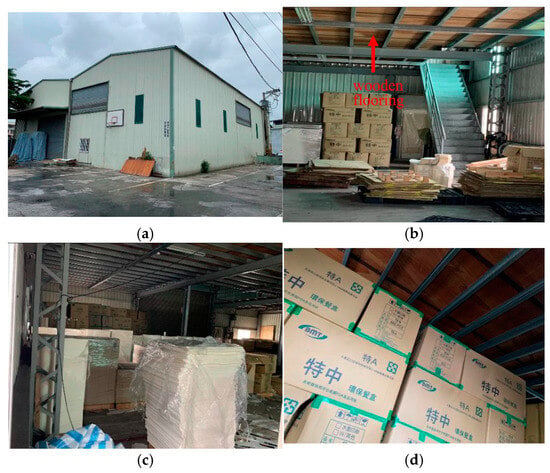
Figure 2.
Exterior building of No. 92, and the construction and interior stacking of No. 92-5: (a) exterior view of No. 92, (b) structure of No. 92-5, (c) interior stacking, and (d) stacking of corrugated boxes.
The front half of the first floor of No. 92-7 housed production machinery and the front half of the first floor of No. 92-6 was office space. The remainder of the building was filled with a large supply of paper goods and functioned as a factory and warehouse. The stored goods primarily consisted of corrugated boxes, paper cups, paper lunch boxes, tissue paper, and disposable tableware. The products were a mix of finished and semi-finished goods, most of which were combustible, as shown in Figure 2c. Because of the large supply of paper-based products and the large number of items stored, most of the items and materials were packed in corrugated cardboard boxes. 100 × 100 × 10 cm3 pallets were also stored on top of each other in the warehouse. The internal stacking height limit for the items was approximately 180 cm, and the storage state of the stacked items was exceptionally dense, as illustrated in Figure 2d.
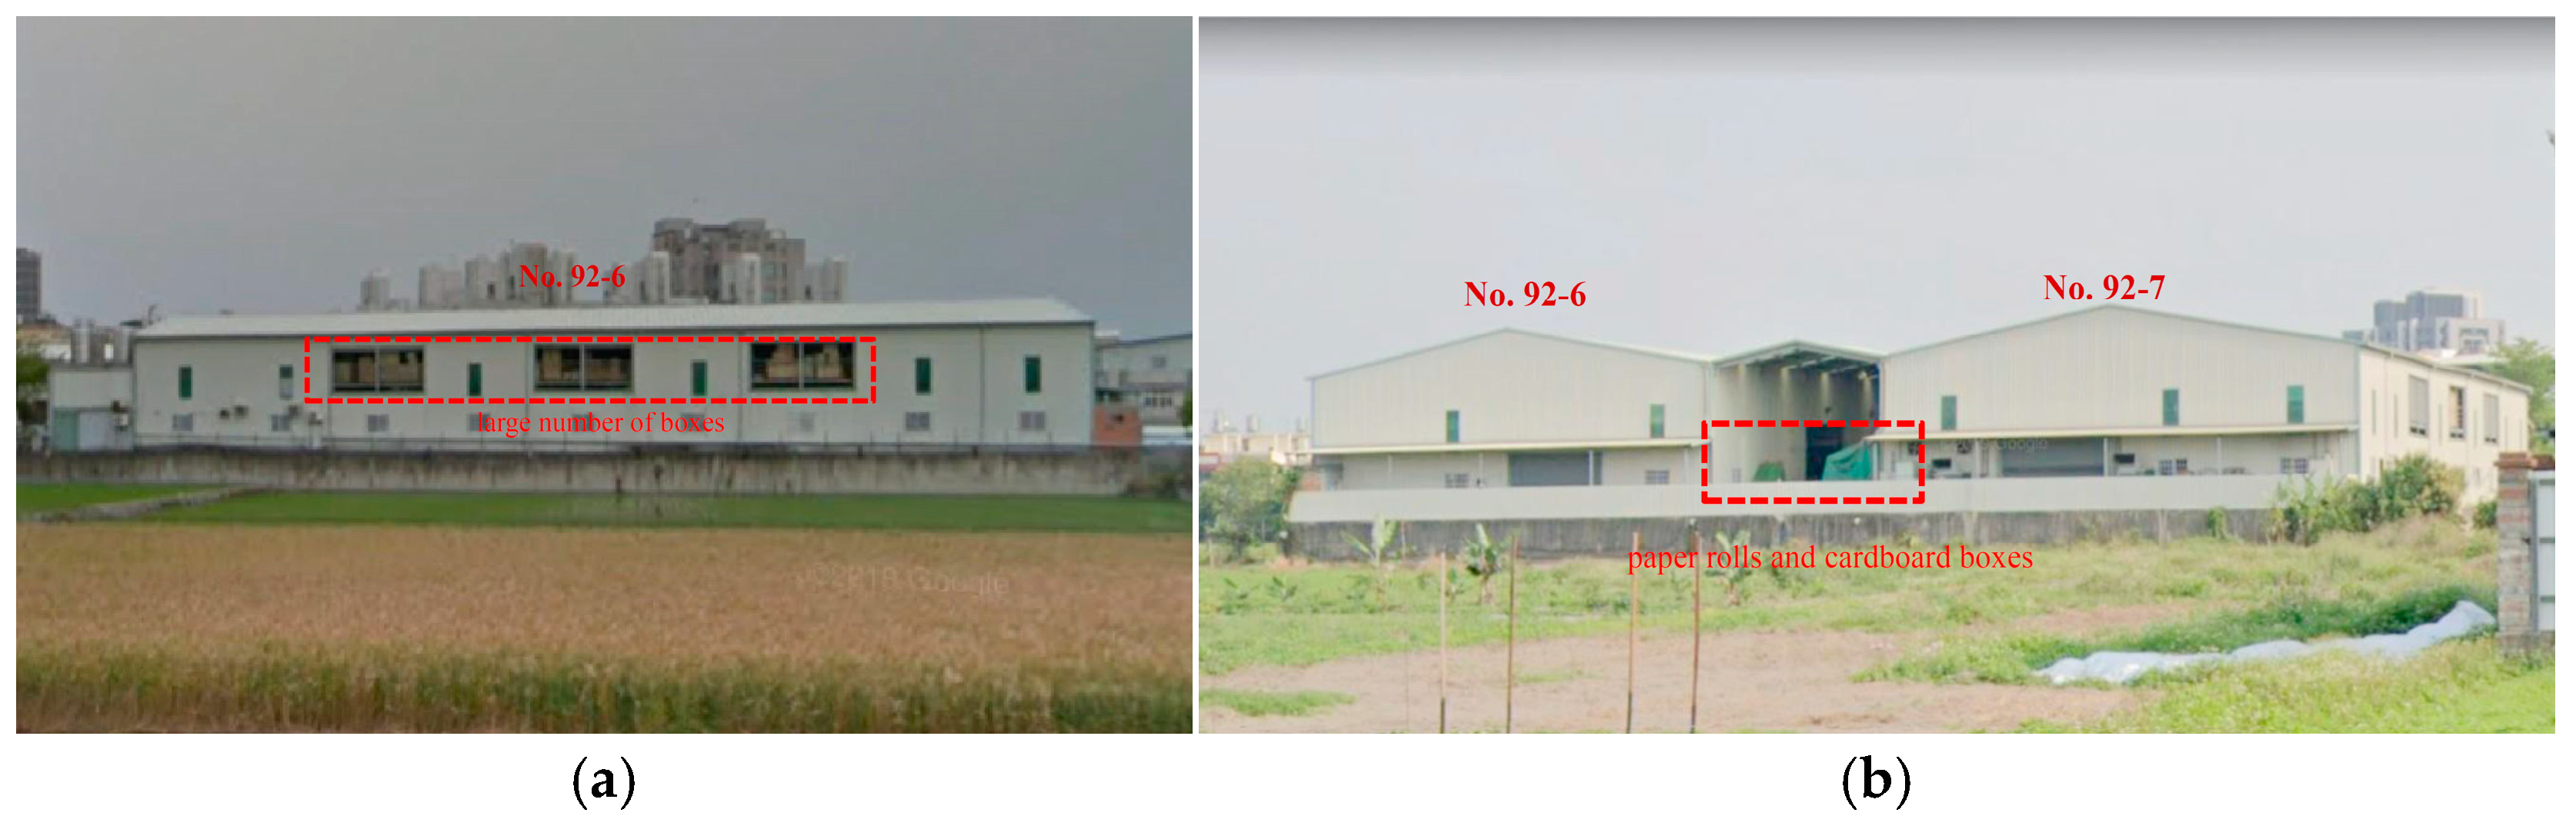
A Google map image of the west side of No. 92-6, captured prior to the fire, shows a large number of boxes and other items stacked on the second floor, as illustrated in the red dotted box in Figure 3a. A second Google map image of the south side of Nos. 92-6 and 92-7 shows the two buildings separated by a passage approximately 8 m wide, and a triangular roof above the passage with the highest point about 7.4 m from the ground (Figure 3b). At the time of the fire, there was a large pile of items, including paper rolls and cardboard boxes, at the bottom of the central passage towards the south side. The stack shown is 4 m high with a width of approximately 2 m and is situated in the center of the passage. This position allowed for the movement of people and vehicles on either side and is marked by the dashed box in Figure 3b.
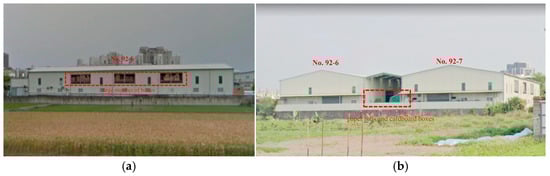
Figure 3.
Google images of Nos. 92-6 and 92-7 before the fire: (a) the west side of No. 92-6 and (b) the south side of Nos. 92-6 and 92-7.
3. Calorimetric Analysis
According to NFPA 921 [16], the guidelines for fire scene reconstruction can be divided into (a) the most likely point of origin, (b) fire cause analysis, (c) fire spread analysis, (d) smoke and other hazard factor analysis, (e) the results of human behavior in fire hazard scenarios, and (f) the response behavior of the fire brigade. In this case, the cause of the fire, the results of human behavior, and the response behavior of the fire brigade are clearly documented in the official fire investigation report. Therefore, this study focused on how the fire at No. 92-7 grew to include No. 92-6 and caused the subsequent death of the two firefighters inside No. 92-6. To ensure the most accurate data would be used for the FDS, three main indoor items were selected for testing in this study: paper lunch boxes, tissue paper, and corrugated cardboard boxes. The existing literature has shown the reliability and effectiveness of calorimetric analysis [17,18,19]. The results of combustion testing, thermal decomposition temperatures, and thermal mass loss for the three samples were obtained in the manner shown in the Section 3.1 “Calorimetric combustion analysis of paper lunch boxes, tissue paper, and corrugated boxes”. The results of the analysis were then used as input data for the material properties in the FDS simulation, as described in the Section 3.2 “Material properties” [20].
3.1. Calorimetric Combustion Analysis of Paper Lunch Boxes, Tissue Paper, and Corrugated Boxes
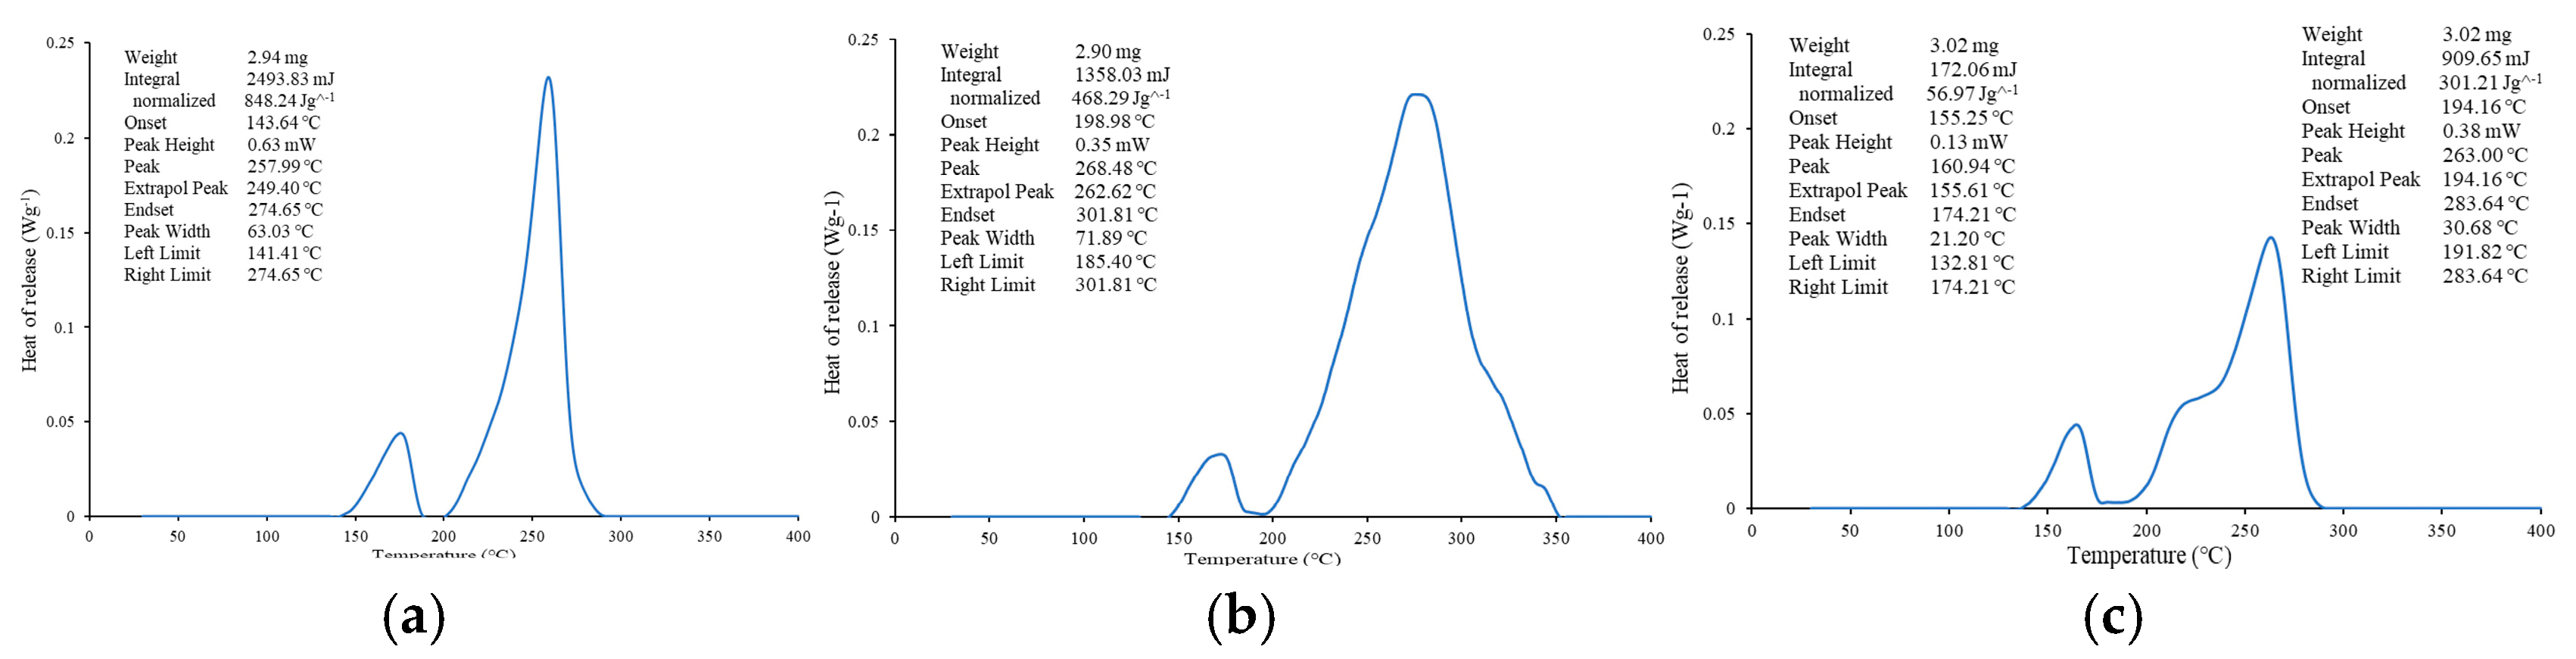
The research team obtained paper lunch boxes, tissue paper, and corrugated boxes for use as samples in a calorimetric combustion experiment. Differential scanning calorimetry (DSC) (Model: Toledo DSC 3) from Mettler Toledo, Switzerland, was used for the procedure and the ASTM E793 [21] guidelines were followed. The sample masses were 2.94 (paper lunch boxes), 2.90 (tissue paper), and 3.02 (corrugated boxes) mg, respectively, and the experiment began with a heating rate of 1.0 °C min−1. Each sample reacted differently to heating; a noticeable heat reaction occurred when the paper lunch boxes reached 143.64 °C, the tissue paper reached 198.98 °C, and the corrugated boxes reached 155.25 °C. Exothermic peak temperatures were obtained at approximately 257.99 °C for the paper lunch boxes, 268.48 °C for the tissue paper, and 163.00 °C for the corrugated boxes. The reaction heat was 848.241 (paper lunch boxes), 468.29 (tissue paper), and 301.21 (corrugated boxes), measured in J g−1. The findings of the experiment are presented in Figure 4.
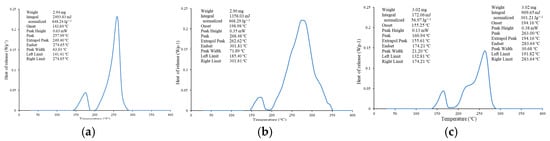
Figure 4.
DSC test results for the three sample types at a heating rate of 1.0 °C min−1: (a) paper lunch boxes, (b) tissue paper, and (c) corrugated boxes.
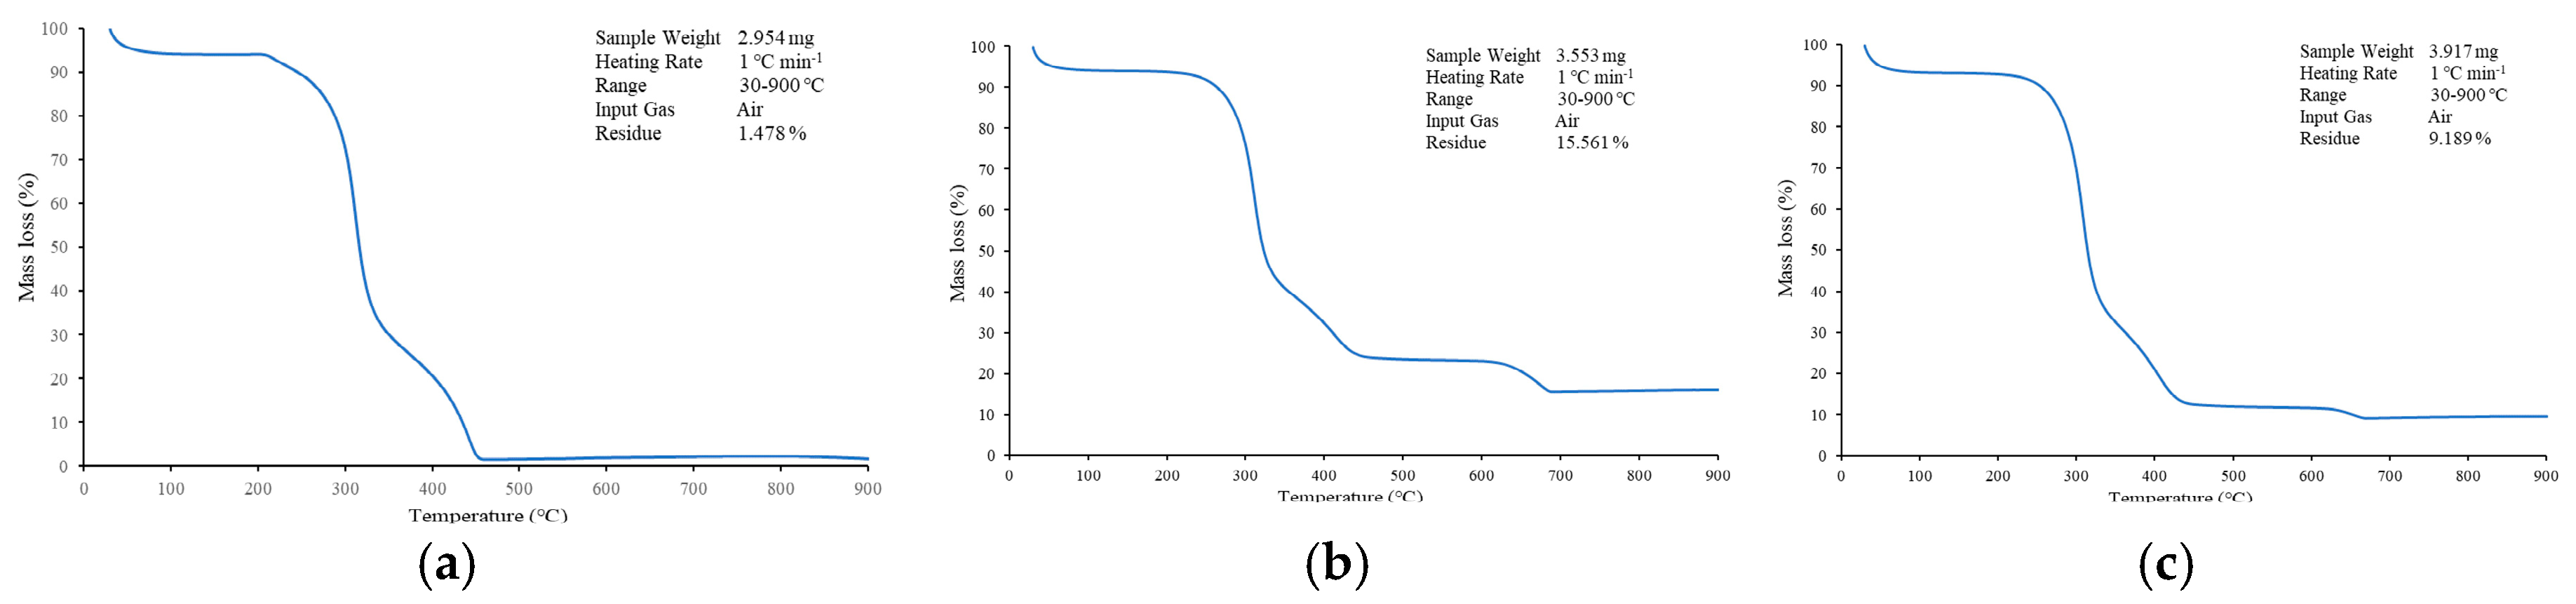
Thermogravimetric analyzer (TGA) testing was also carried out (Model: TGA 8000, PerkinElmer, Waltham, MA, USA), and the experiments followed the ASTM E1131 [19,22] protocols. The sample masses were recorded as 2.954 (paper lunch boxes), 3.553 (tissue paper), and 3.917 (corrugated boxes) mg, respectively, and the samples were tested at a heating rate of 1.0 °C min−1, with temperatures that ranged from 30 to 900 °C.
The residue of each sample was 1.478 mass% (paper lunch boxes), 15.561 mass% (tissue paper), and 9.189 mass% (corrugated boxes). Maximum mass loss was 98.522 mass% (paper lunch boxes), 84.439 mass% (tissue paper), and 90.811 mass% (corrugated boxes), as shown in Figure 5. The results of the calorimetric experiments for the three samples are summarized in Table 1 under the heading “Material properties”.
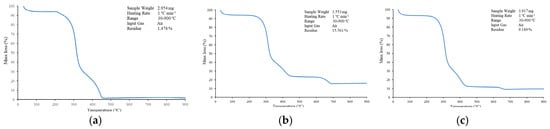
Figure 5.
TG test results for the three sample types at a heating rate of 1.0 °C min−1: (a) paper lunch boxes, (b) tissue paper, and (c) corrugated boxes.

Table 1.
Experimental calorimetric analysis results for the three sample types at a heating rate of 1.0 °C min−1.
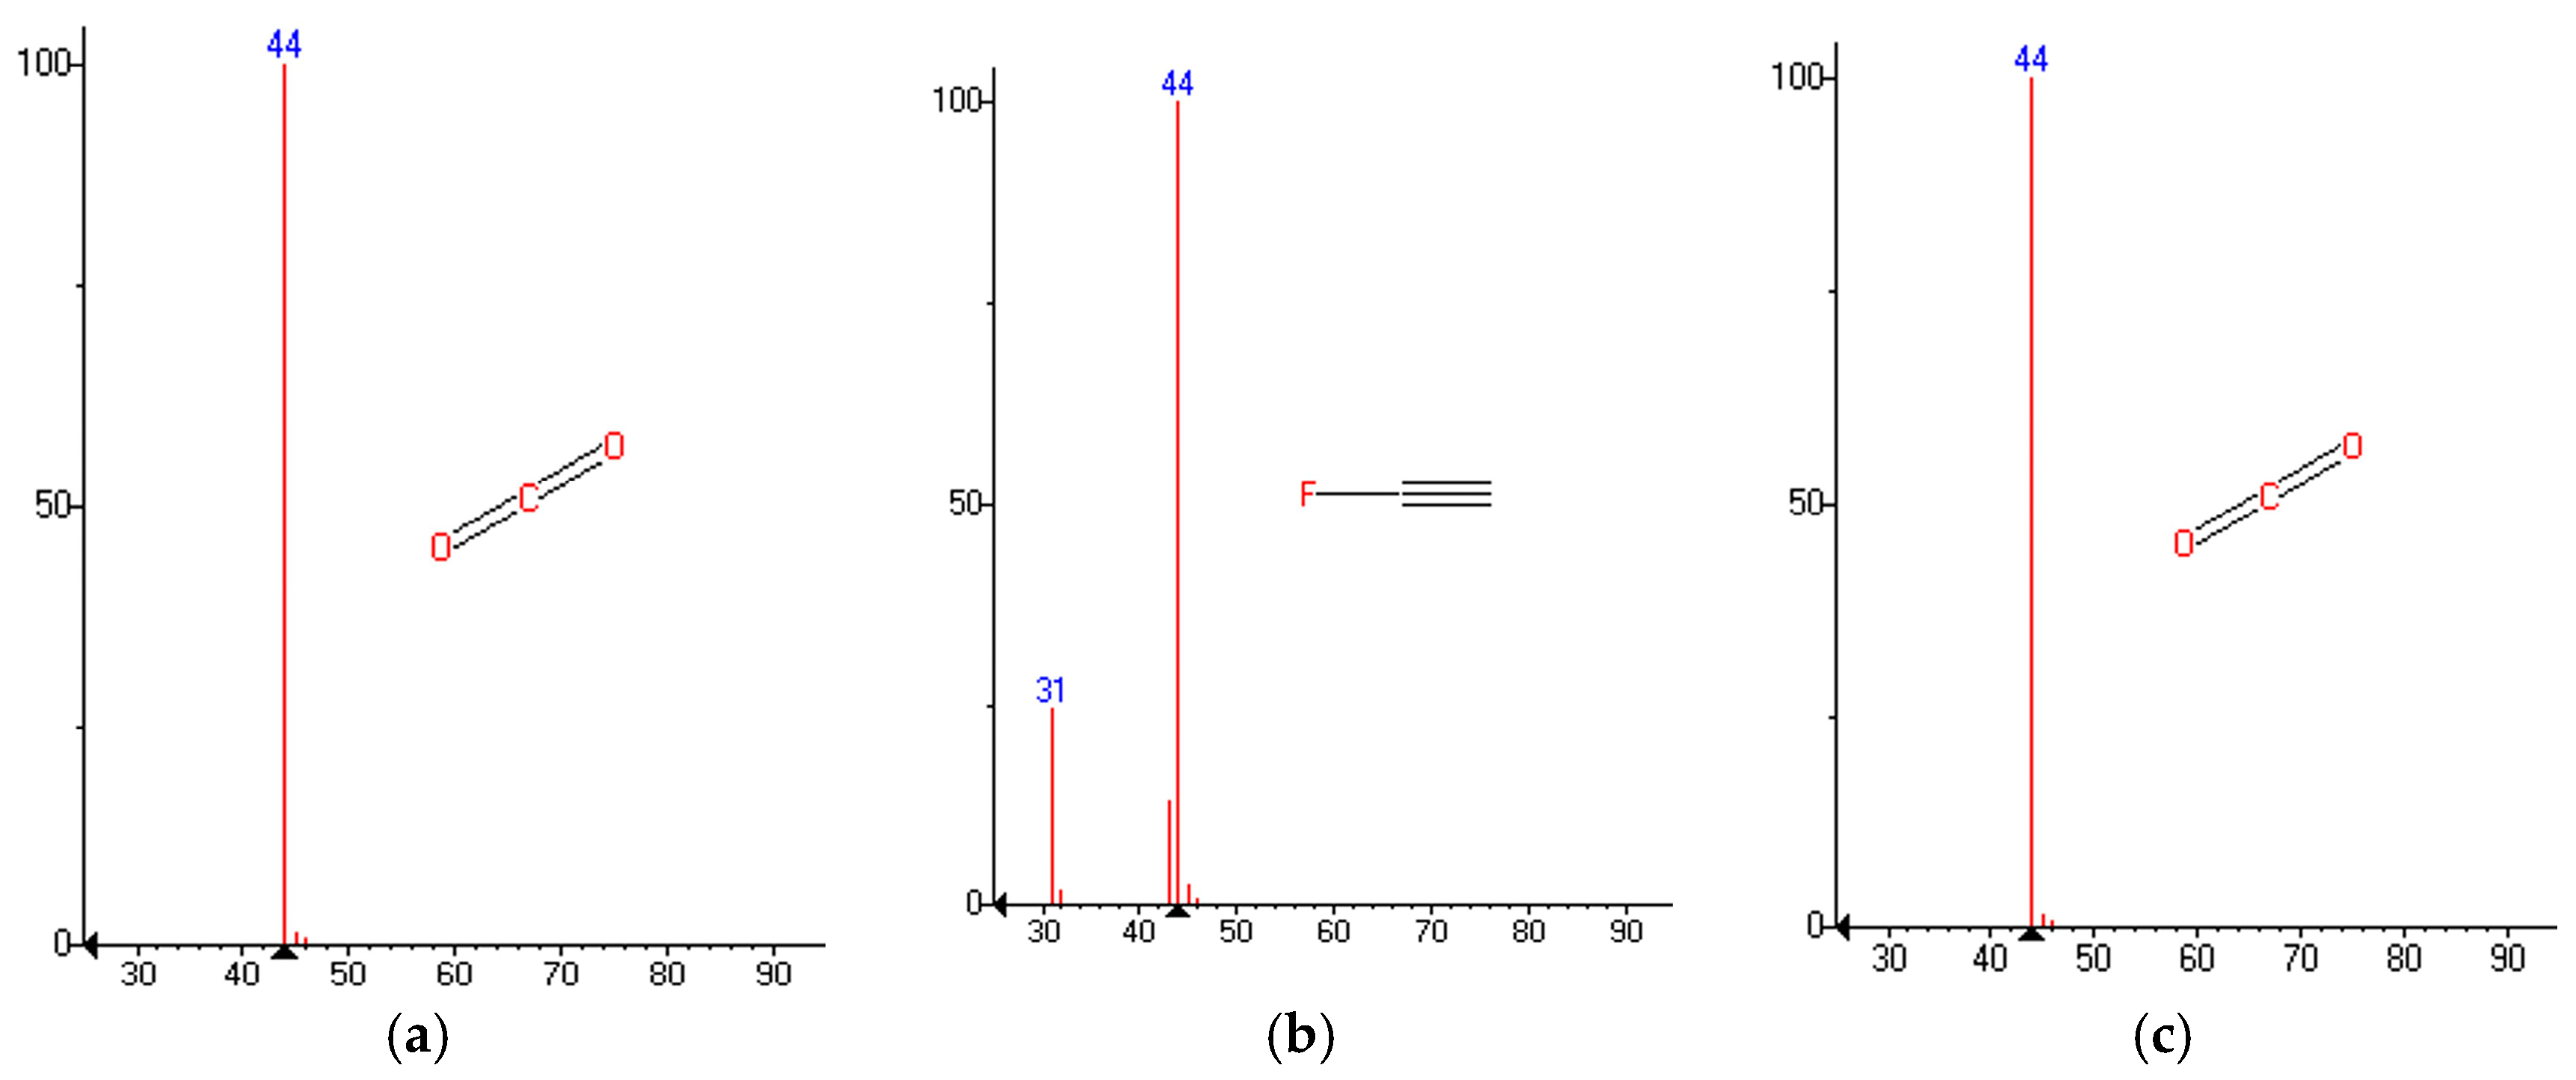
The three sample types were also subjected to TGA analysis; burning gas was captured at 250 °C and analyzed using the GC-MS, and these results are presented in Figure 6. Analysis of these results shows that the dominant gas emitted was carbon dioxide (CO2) but also that the tissue paper contained more fluoroethyne (C2HF) than the other samples. The remaining gases, in smaller proportions, were carbonic acid (H₂CO₃), carbonic anhydride, and acetylene (C2H2).
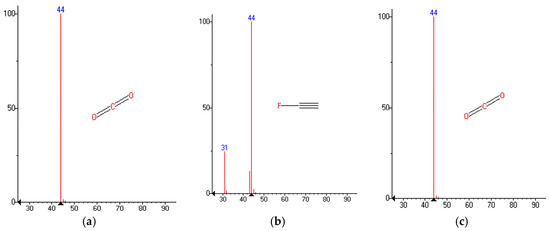
Figure 6.
Test results of the three sample types by GC-MS within 250 °C: (a) paper lunch boxes, (b) tissue paper, and (c) corrugated boxes.
3.2. Material Properties
The main combustible materials inside the building were the wooden flooring on the second floor and the three aforementioned samples. The heat response data of these combustibles was set up in the format of an input file for the FDS program. The setup file also included various material properties from the built-in FDS database. The FDS database already contained the heat response profiles for a wide variety of combustible items. In total, 10 material properties for the paper lunch boxes, tissue paper, and corrugated boxes were determined by matching their properties to existing research or by drawing the data from previous tests. The exact heat, density, and conductivity were received from NIST test results or from the material specifications provided by the supplier. The data used for the FDS analysis are presented in Table 2. Table 2 lists the results of the prior calorimetric analysis, specifically the heat of thermolysis, heat of combustion, reference temperature, temperature range of combustion, residue percentage, and heating rate. The reference rate could be obtained by Equation (1) [11,23]:
where the heating rate is 1.0 °C min−1, and ΔT is the temperature range of combustion. Using the paper lunch box as an example, ΔT = 274.65 − 141.41 = 133.24 (°C) and Vs. is the residue percentage of 1.478 mass% for corrugated boxes. Substituting these results into Equation (1), the following equation (Equation (2)) is formed:
where Y0 from Equation (1) is set to 1 [24,25] and the reference rate rp is 0.0002464, which is used in Table 2.
Table 2.
Material properties of the three sample types used in the FDS simulation.
4. Computer Simulation Analysis
In this study, data from fire scene investigation records, witness interviews, and official reports were compared, analyzed, and elucidated, and then FDS was used to simulate the fire scene. The FDS program was developed by the National Institute of Standards and Technology (NIST) [26] in the United States, and although the first version was produced in February 2000, it is still being maintained and updated. The FDS system is a form of CFD that uses a field model to simulate different fire scenes [14]. Because of the reliability of the program, it is used internationally by numerous agencies and researchers [27,28]. In this paper, FDS version 6.7.4 was adopted to construct the data model.
Once the 3D space had been constructed, the experimental data from the thermogravimetry analyzer (TGA) and differential scanning calorimetry (DSC) experiments were used as inputs for the simulation. By reconstructing the fire scene, taking into account the known timeline of events, and including the known internal fire hazards, the causes of the firefighter casualties could be determined.
4.1. Optimization of Grid Analysis
When a fire simulation space is exceedingly large, the simulation grid size is difficult to manage, and this can lead to issues with outcome accuracy. Conversely, if the grid size is too small, it can take a prohibitively long time for even a powerful computer to calculate. To resolve this issue, Equation (3) [10] was used to perform a grid optimization analysis as follows:
where q is the heat release rate per unit area (HRRPUA) of the building; in general, HRRPUA ranges from 500 to 1000 kW m−2 for non-warehouse buildings and 1000 to 2500 kW m−2 for warehouses [29].
In this case, the non-warehouse area was approximately 30% and the remainder was treated as a warehouse (70%). The HRRPUA for this calculation was a weighted average of 2000 kW m−2, and the fire growth curve for the fire scenario was modeled using the t-squared method in FAST, with an α value of 0.04689 (kW·s⁻2). According to the official fire investigation report, the flame area of the fire was approximately 2.0 m2, the air density ρ0 was 1.2 kg m−3, and the specific heat Cp was 1.0, with an initial temperature T0 = 273 + 27 = 300 K. Entering the aforementioned data into Equation (4) yields
After entering the above data into Equation (5), the following was obtained:
After running several test simulations, it was determined that a grid size of dx = 0.2 m would be suitable. Thus, Equation (6) was calculated as follows:
The literature on grid optimization [26] shows that the ratio of 8.30 falls within the suggested ranges of 4 to 16 for a project of this size; therefore, the grid point size was set to 0.2 × 0.2 × 0.2 m3 for this study.
4.2. Data Model
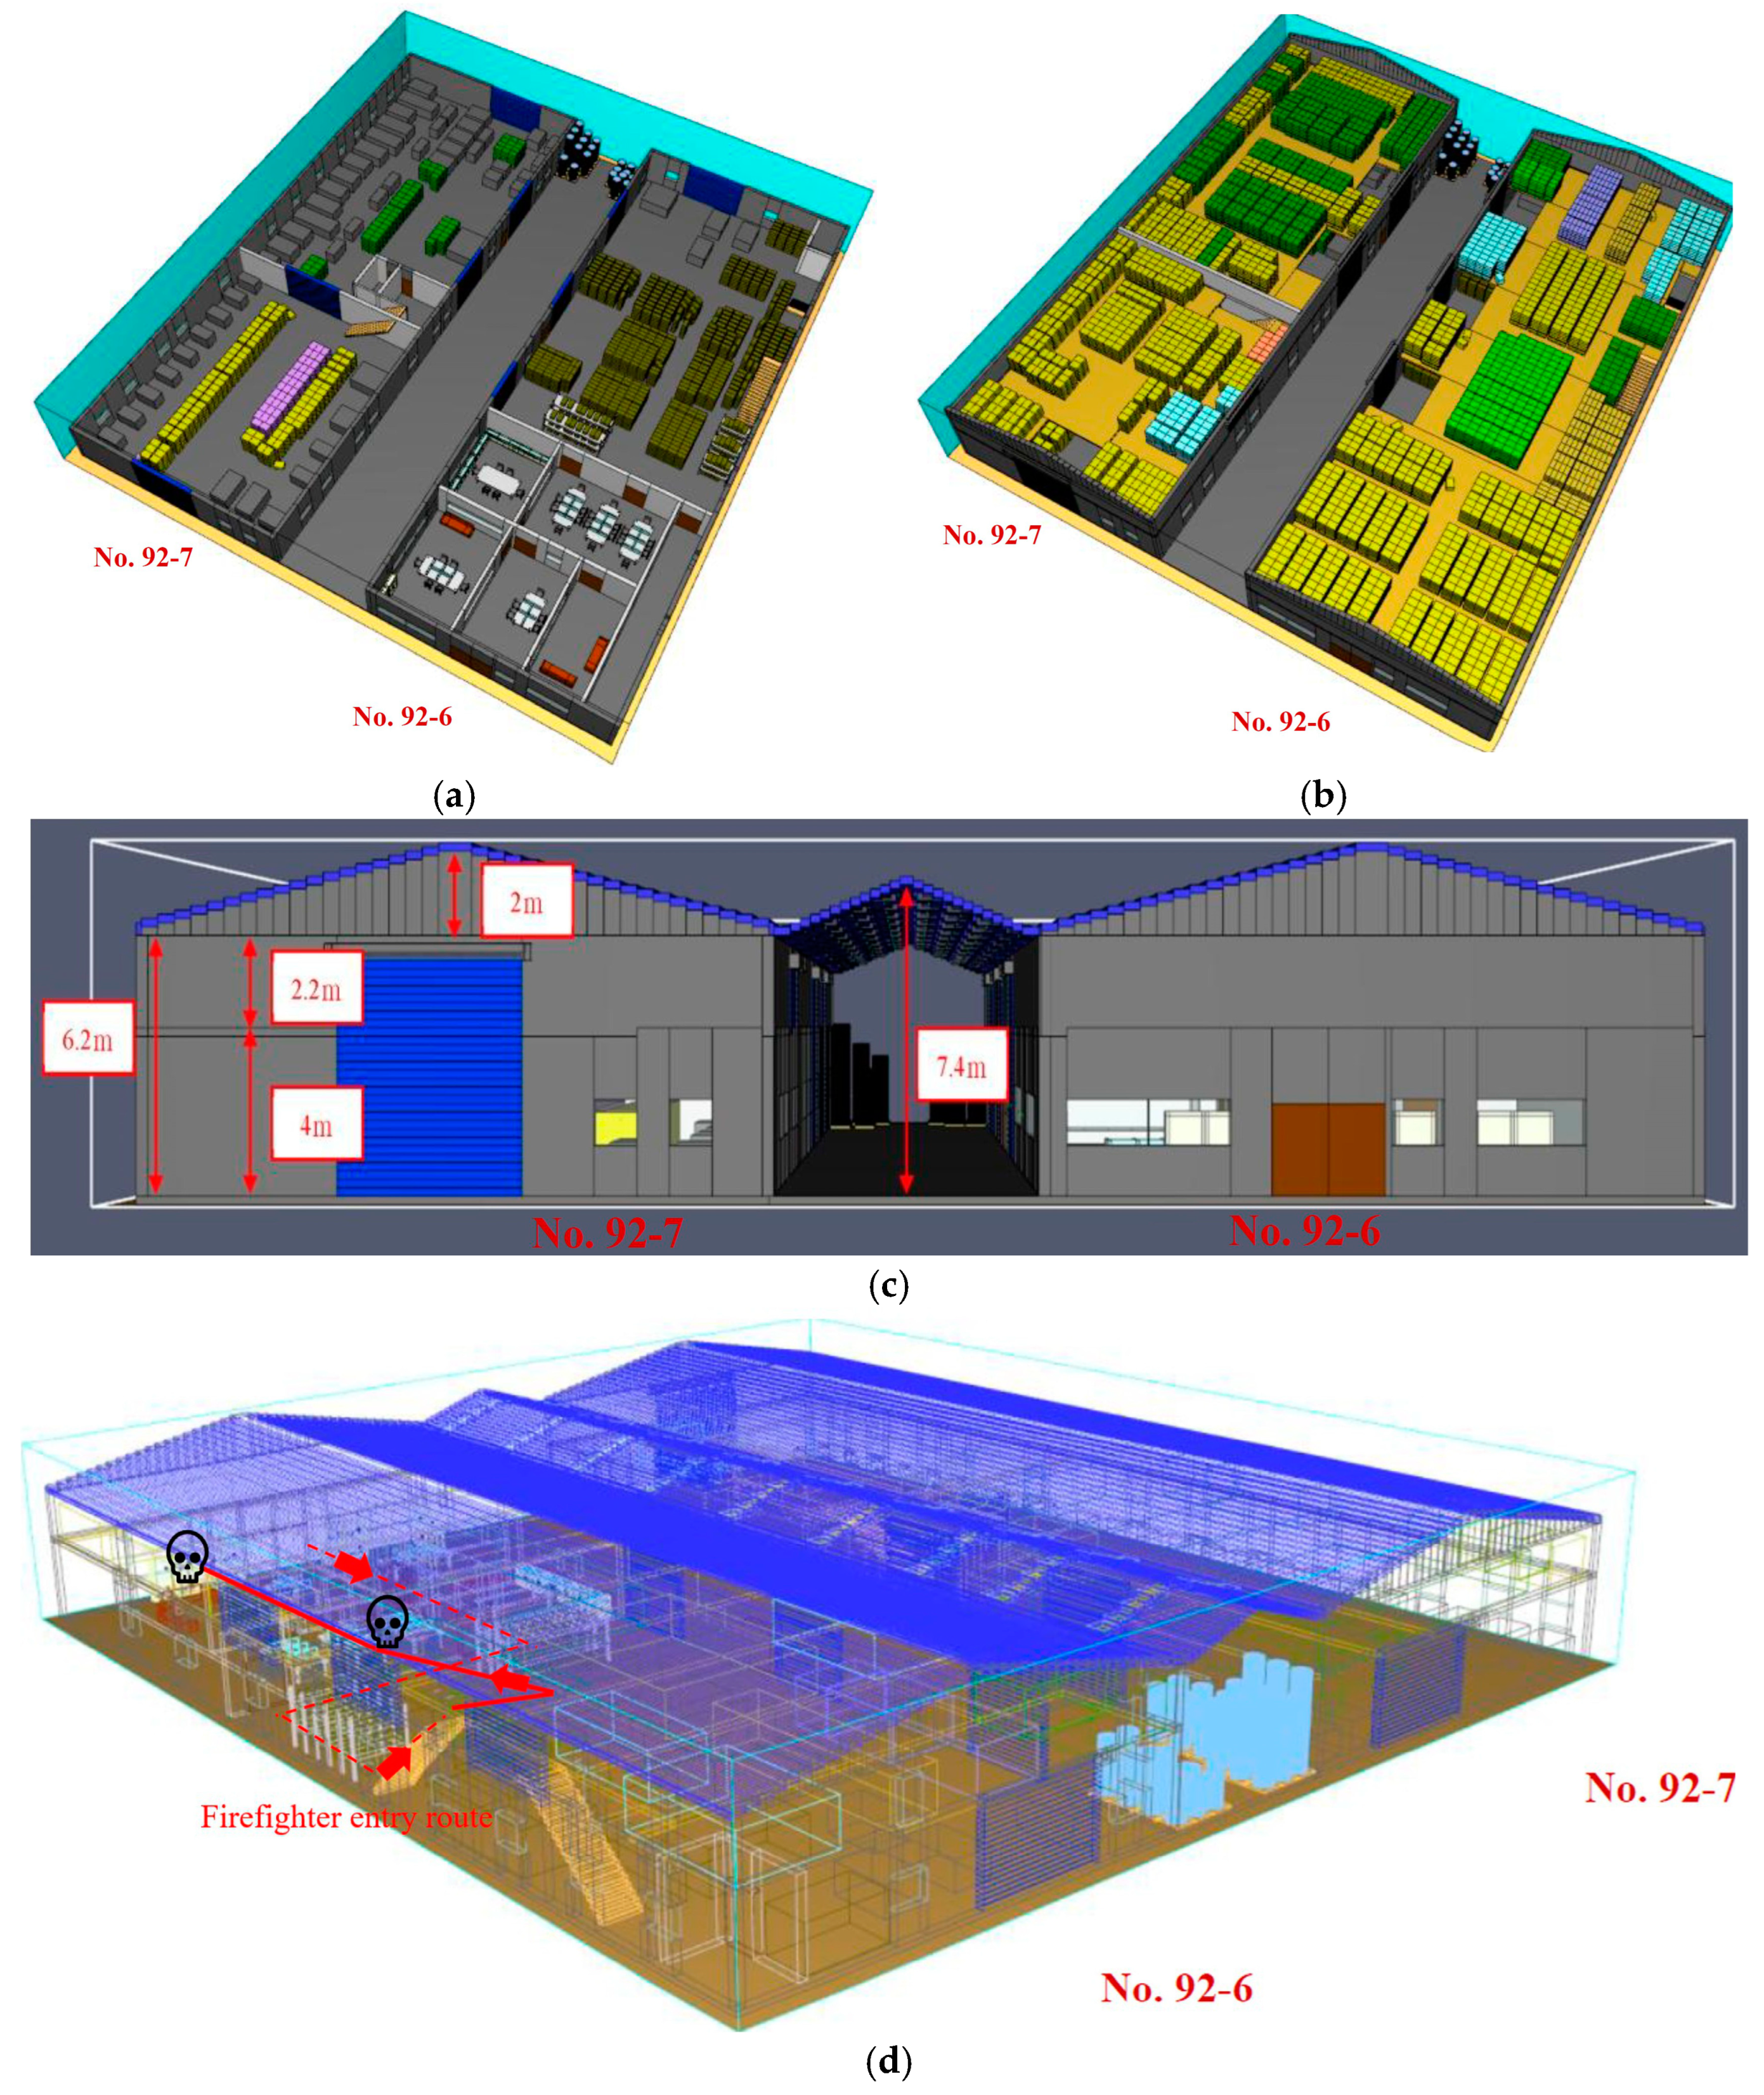
As previously described, two buildings, Nos. 92-7 and 92-6, were used to construct the models for the fire simulation. The modeled areas were 0 to 49.0 m on the x-axis, 0 to 54.0 m on the y-axis, and 0 to 8.6 m on the z-axis. The internal configurations of the first and second floors of the building are shown in Figure 7a,b. The north side elevation is as shown in Figure 7c. A three-dimensional perspective drawing of the two buildings is presented in Figure 7d. Because the grid point size for this study was 0.2 × 0.2 × 0.2 m3, the total number of grids in the simulation area was 245 × 270 × 43 = 2,844,450.
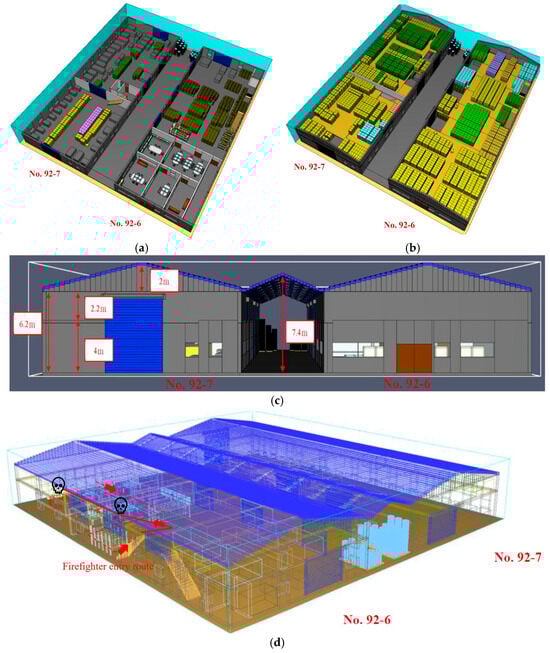
Figure 7.
Nos. 92-6 and 92-7 computer models used to run the FDS simulation: (a) internal configuration—first floor, (b) internal configuration—second floor, (c) north elevation, and (d) wire-frame isometric representation.
4.3. Determination of Fire Spread Paths
According to the official fire investigation report, two firefighters entered No. 92-6 at 02:41 a.m. At that point, No. 92-7 was in full flame and six to eight hose lines had been set up on the north and west sides of No. 92-7 in response. No. 92-6, however, was unaffected by the fire at that time; the first floor was still brightly lit, and the factory staff were busy moving items and property away from 92-7. The two firefighters entered the first floor of No. 92-6 and took the stairs up to the second floor to measure the ambient temperature.
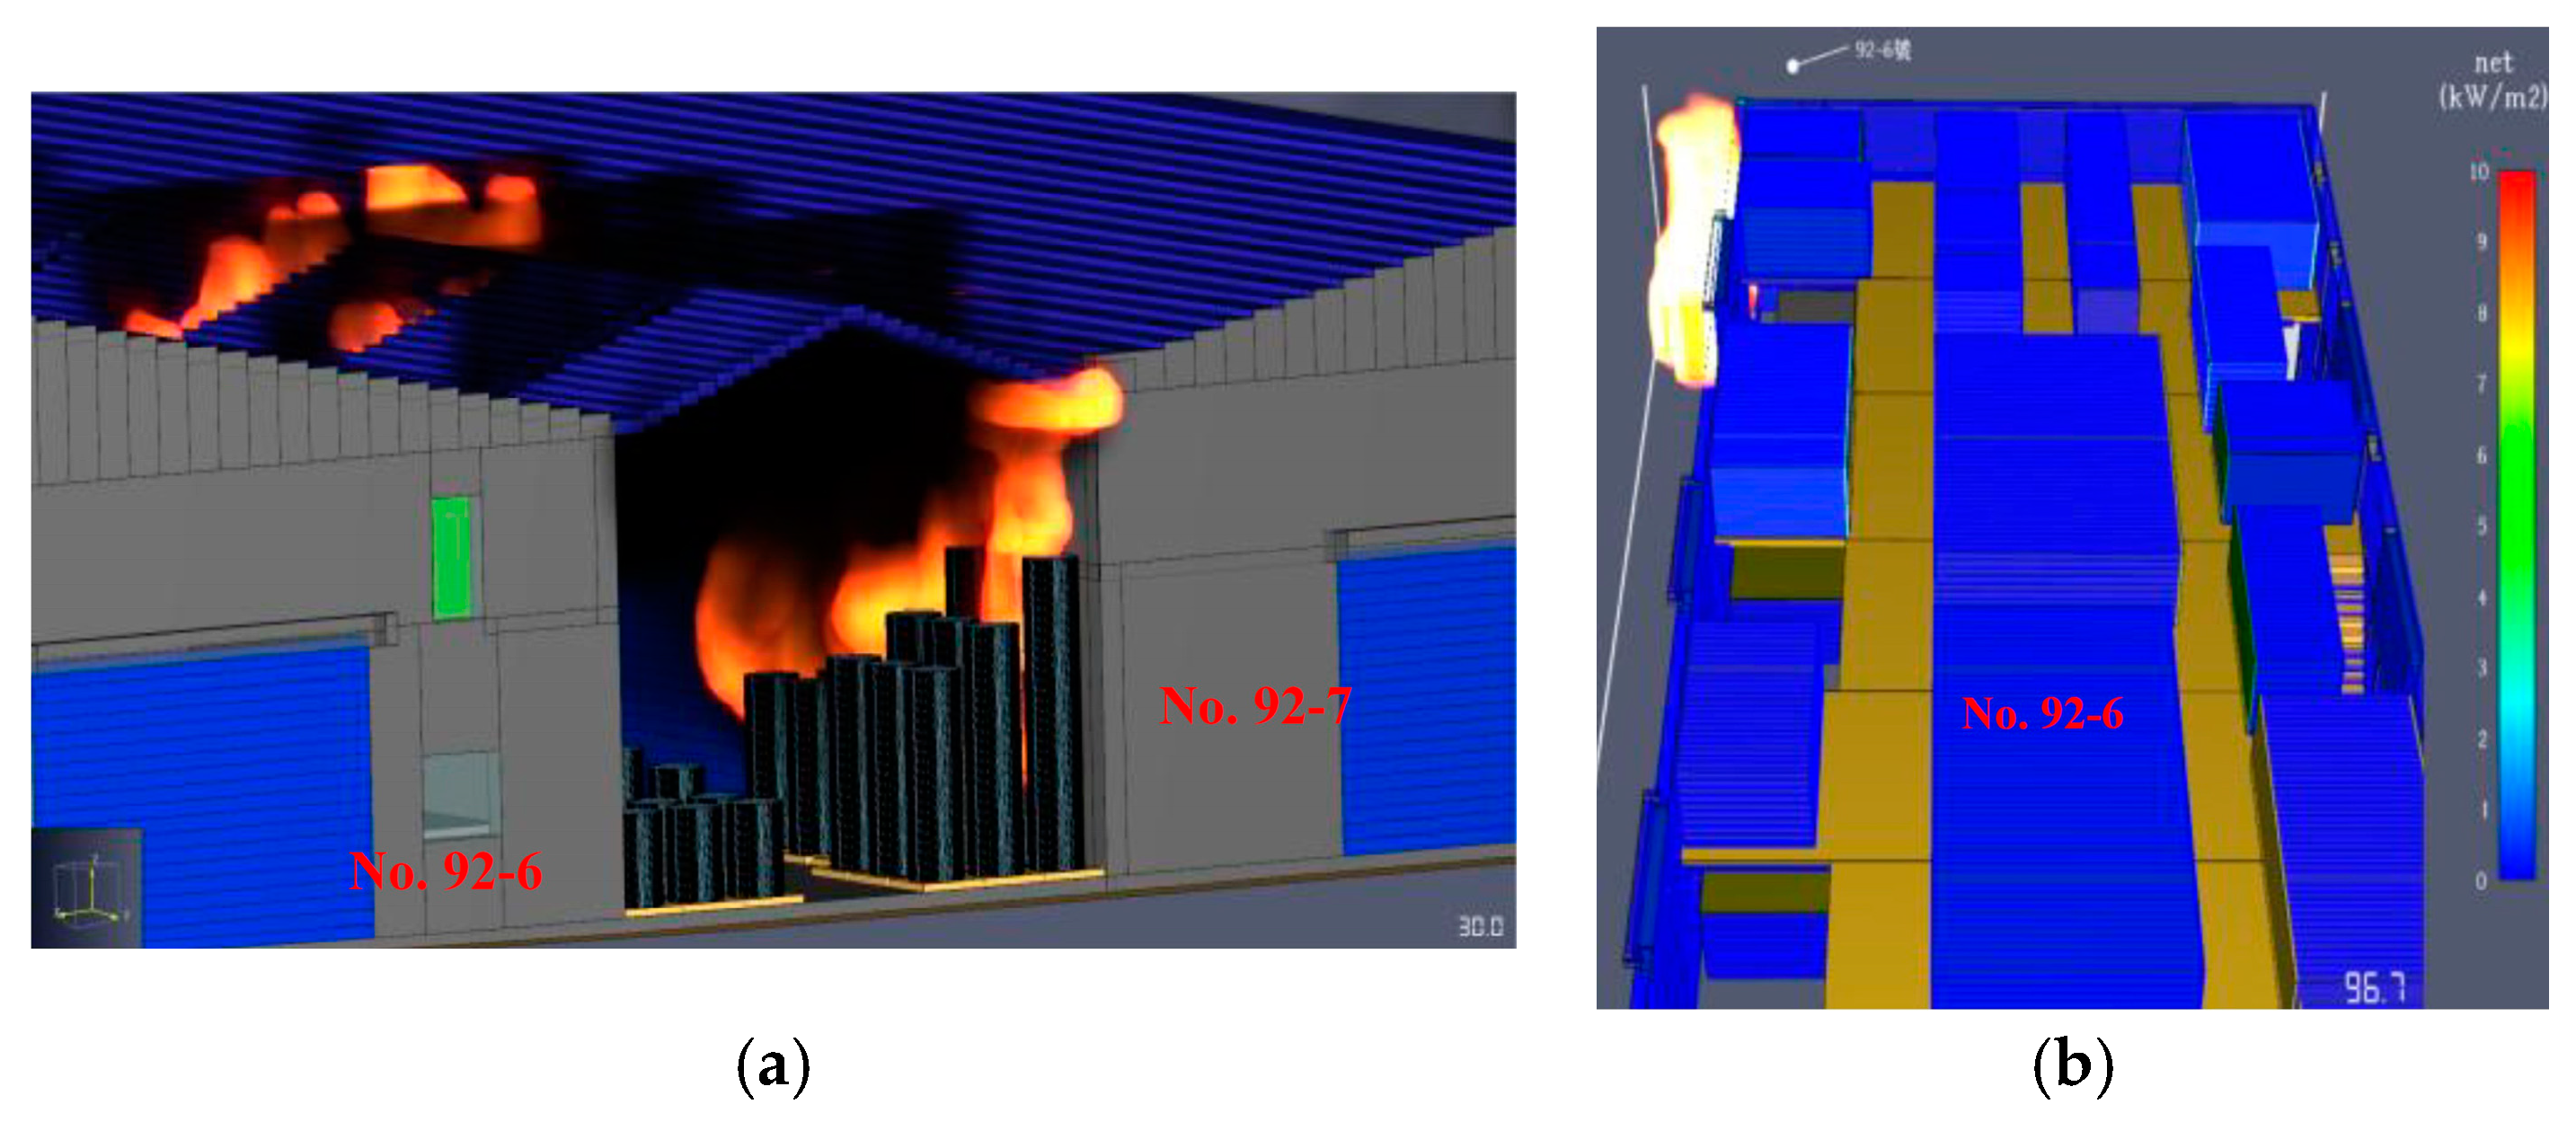
Typical paths of fire spread included ember exposure, radiation, and flame contact [30]. In this situation, the plant was an enclosed space, which makes ember exposure exceedingly unlikely. This study investigated whether the radiant heat flux from the fire at No. 92-7 could have been transmitted to No. 92-6 across the 8 m wide passage, igniting the combustible materials on the other side. As shown in Figure 7a,b, when No. 92-7 was fully burning at 02:41 a.m., the radiant heat passed through the roof of the middle passage towards No. 92-6. However, as shown in Figure 7c,d, the thermal radiation at each of the three measurement sensors outside and inside No. 92-6 was below 10 kW m−2, which would have been insufficient to ignite the combustible materials in No. 92-6 [31,32].
At approximately 200 s into the simulation, the radiation level rapidly dropped close to zero at each of the measurement sensors in Figure 8d. This was attributed to the fact that the light panel on the roof of the middle passage had been destroyed, and an enormous amount of thermal radiation was then dissipating through the breach. This is shown by the red dotted box in Figure 8b. After the simulation was completed, the radiant heat flux from No. 92-7 was still insufficient to ignite the combustible materials inside No. 92-6. In total, the simulation was allowed to run for 1200 s.
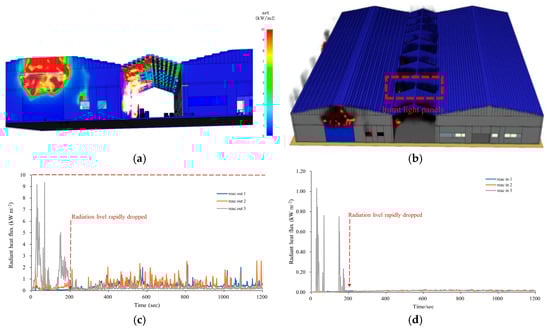
Figure 8.
Computer simulation results of the radiant heat flux and the curves of the measurement sensors: (a) radiant heat flux simulation, (b) burnt light panels on the roof, (c) exterior radiant heat flux outside No. 92-6, and (d) internal radiant heat flux of No. 92-6.
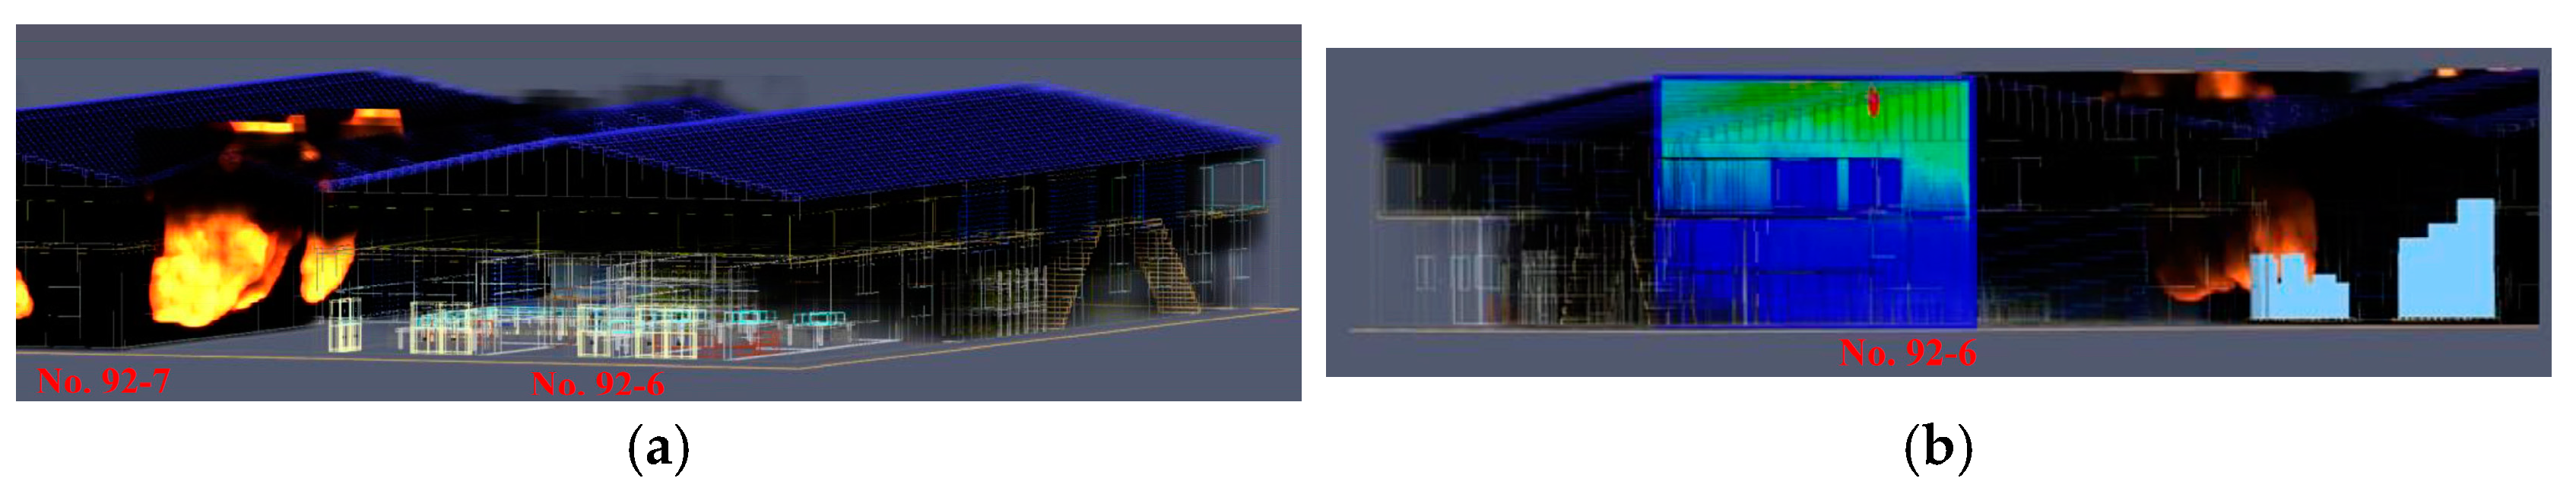
It was observed that when No. 92-7 was fully ablaze at 02:41 a.m., after approximately 9 s, a stream of fire and smoke escaped from the window on the south side of No. 92-7. Approximately 30 s later, an extremely large fire plume, followed by smoke, spread to the pile of paper rolls on the south side of the building. The boundary condition used in the simulation adopted the built-in FDS parameter “OPEN”, allowing airflow exchange with the atmosphere, without specifically setting wind velocity. By 100 s into the simulation, the paper roll pile was in full flame and building in intensity. This made it likely that the fire would spread to No. 92-6, as demonstrated in Figure 9a. Approximately 967 s into the simulation, the paper rolls on the south side of No. 92-6 ignited (Figure 9b). This indicated that the fire in No. 92-7 spread to No. 92-6 by flame extension via the paper roll pile.
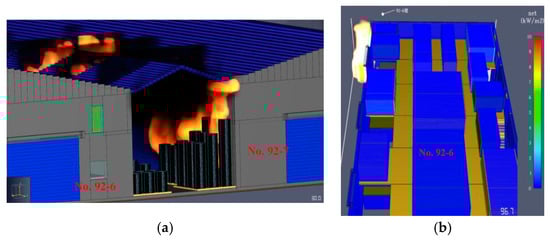
Figure 9.
Computer simulation results of the fire extending to the paper pile on the south side of the middle passage: (a) 30 s after simulation started, and (b) 967 s after simulation started.
Since the fire investigators could not determine the fire spread path for No. 92-7 to No. 92-6, the Fire Investigation Committee referred to the simulation observations from this study and dispatched personnel for another on-site investigation. After excluding the effects of thermal radiation and examining the residues of the paper rolls, window glass remains, and fire flow paths at the site, the committee confirmed that the results of this study closely matched the actual situation.
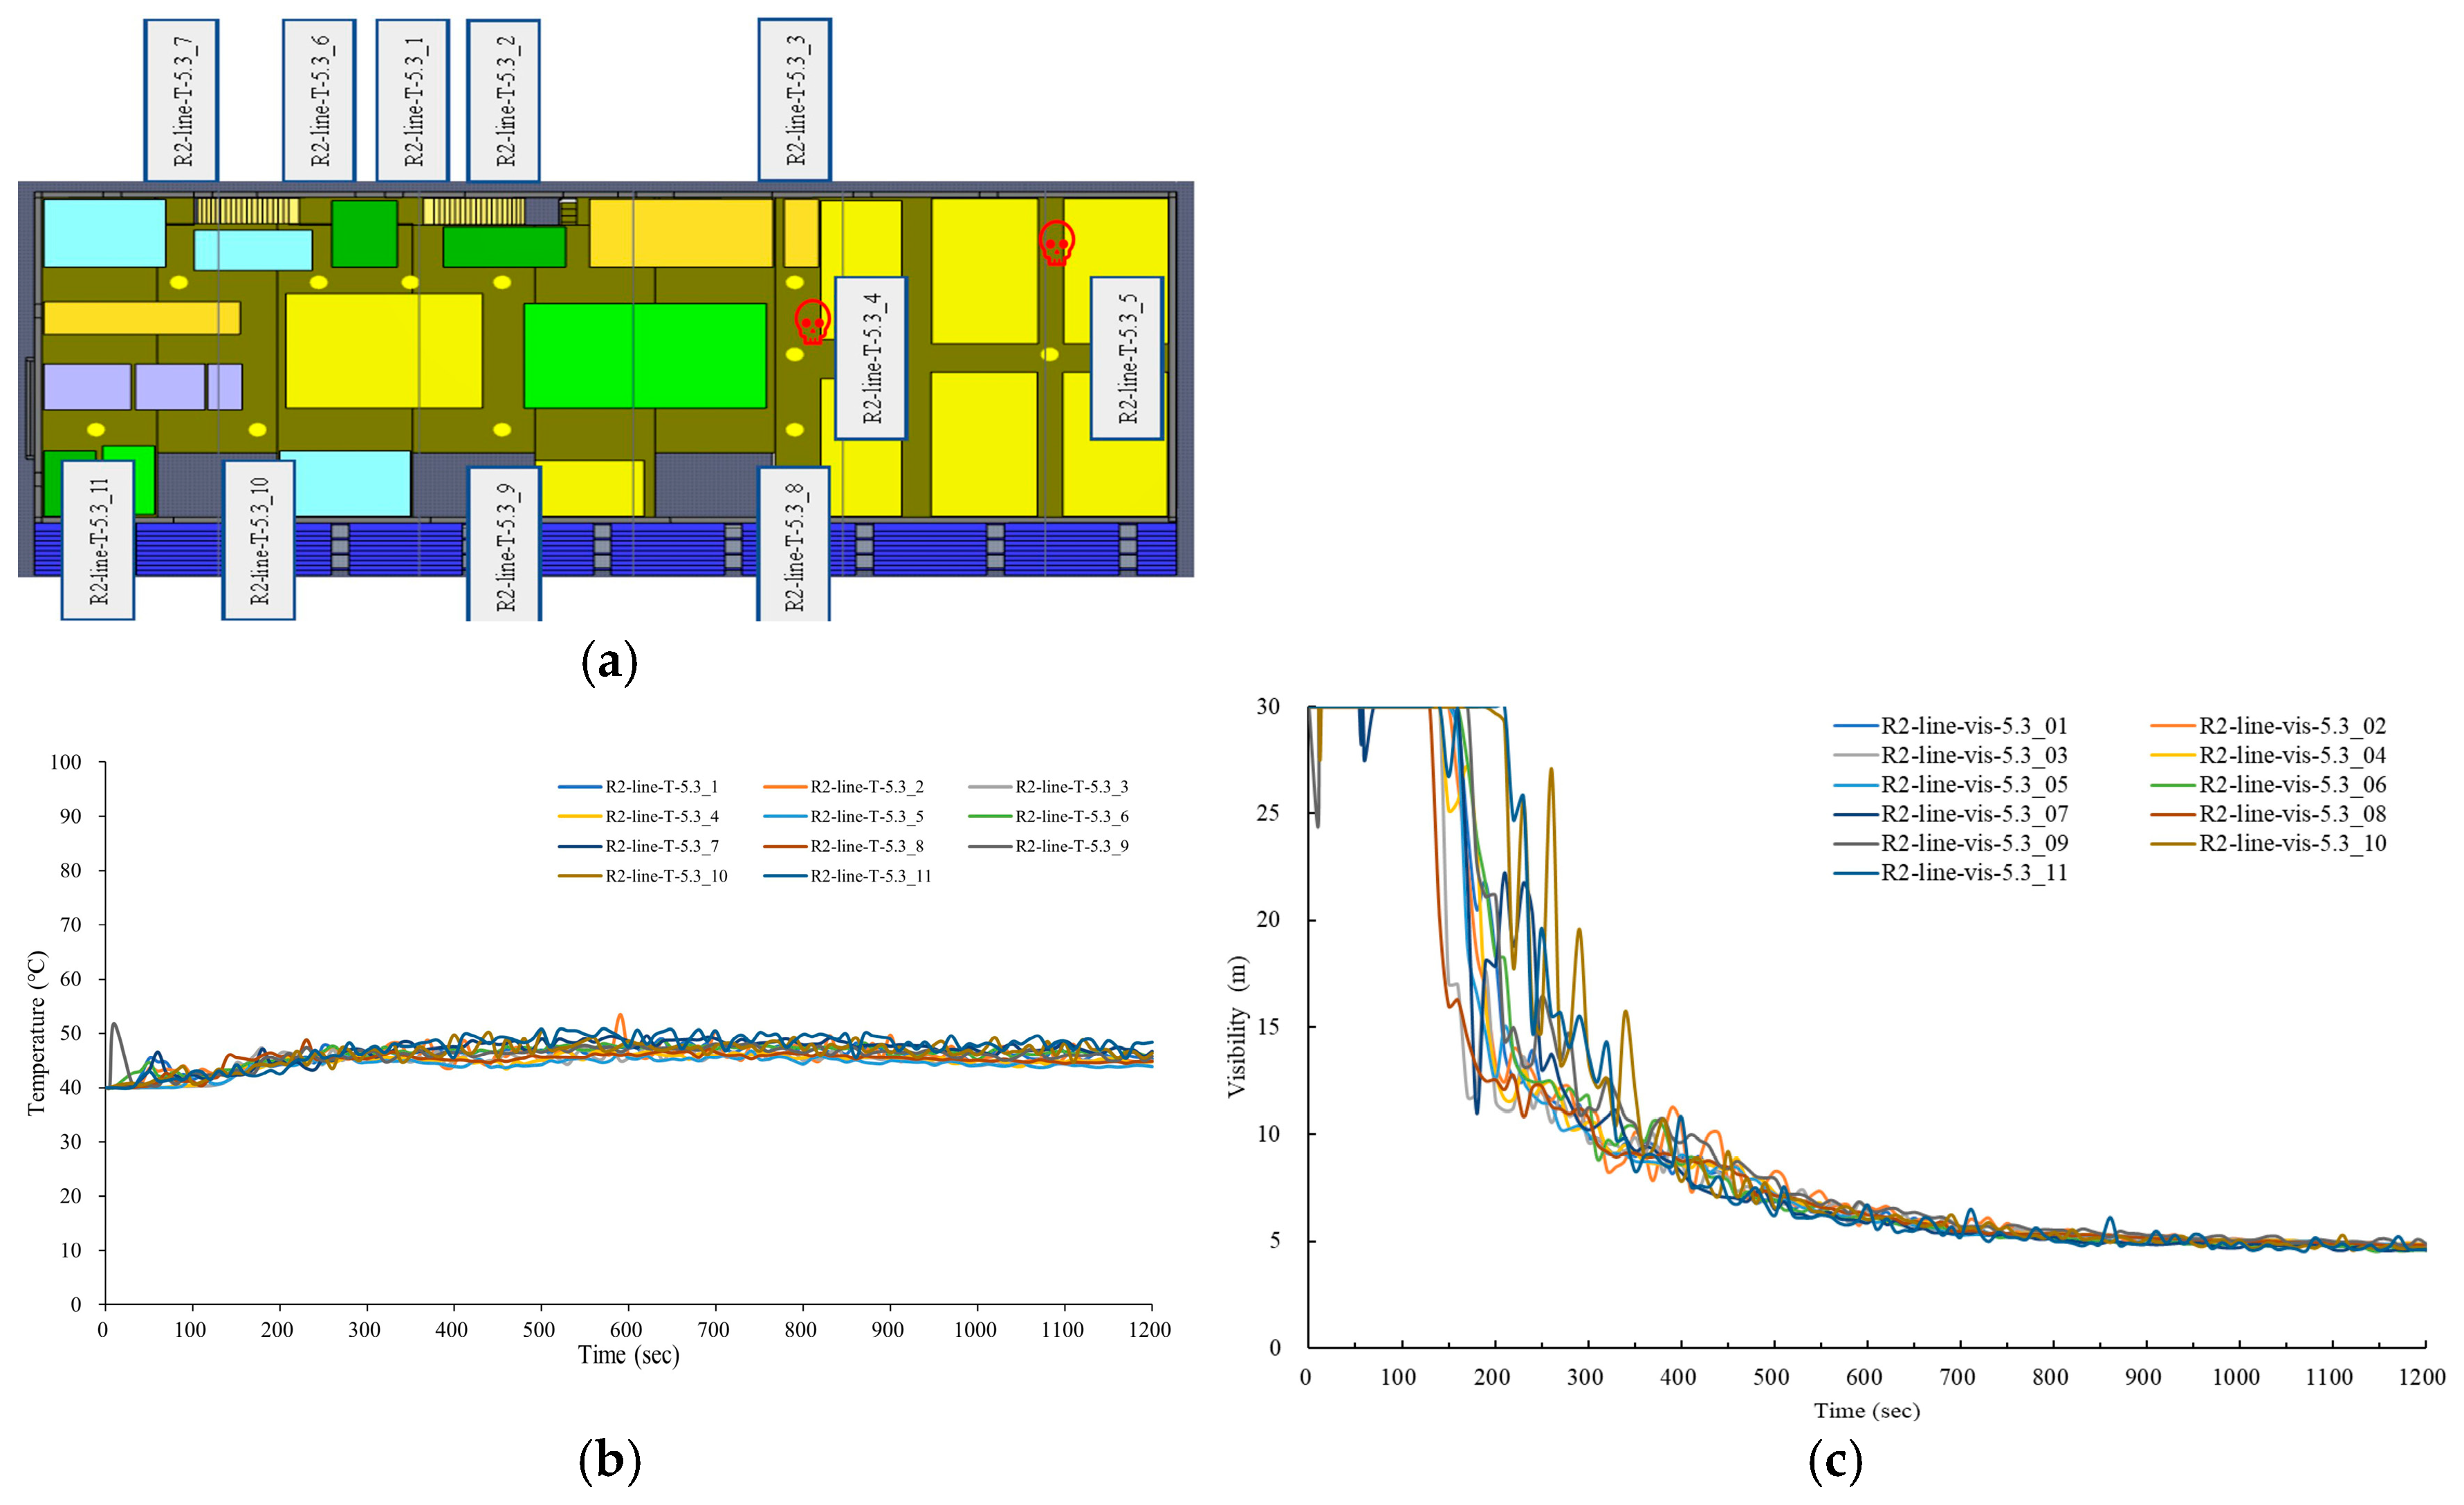
The simulation start time was 02:41 a.m. During the simulation period of 1200 s, the internal heat radiation level of No. 92-6 did not meet the standard requirements for ignition of the combustible materials that were present. A noticeable amount of smoke and combustible gases from the fire at No. 92-7 penetrated the second floor of No. 92-6 through the intermediate passage (Figure 10a,b). During this simulation period, the 11 sensors shown in Figure 11a that were positioned 1.5 m above the surface of the walkway on the second floor of No. 92-6 showed temperatures between 40 and 50 °C (Figure 11b). The temperature at the highest location on the second floor was only ca. 65 °C (Figure 10b). Around 180 s into the simulation, the visibility of the 11 measurement sensors at No. 92-6 dropped to 10 m, one after the other. After approximately 720 s, the visibility had dropped to roughly 5 m (Figure 11c).
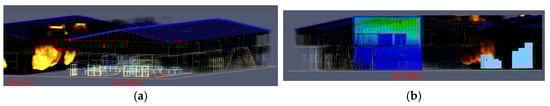
Figure 10.
Simulation results of the spread of the fire and smoke between Nos. 92-6 and 92-7: (a) north side and (b) south side.
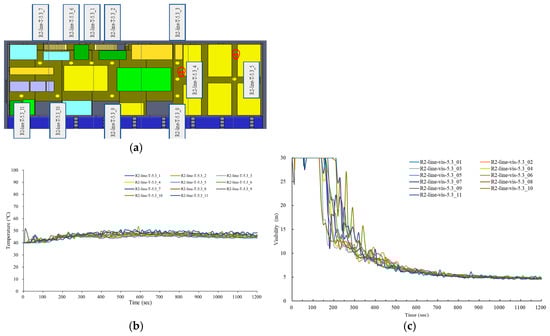
Figure 11.
Computer simulation curves of the 1.5 m sensors above the second-floor walkway surface before the fire at No. 92-6: (a) sensor locations, (b) temperature detected by sensors, and (c) sensor visibility change over time.
The two firefighters entered No. 92-6 at 02:41 a.m. and reached the second floor after approximately 180 s. At this time, the ambient temperature was still below 100 °C, the radiant heat flux was less than 1.0 kW m−2, and the visibility was less than 10 m. According to the US NIST recommendations, the firefighters should have had a thermal resistance rating of Level 1, which would have allowed for a heat exposure time of approximately 25 min in those conditions [33]. When personal protective equipment is worn, by necessity, there is a temperature difference of 10 to 30 °C between the firefighter’s physical sensation and the external environment [32]. It could thus be concluded that because of their protective equipment, the two firefighters were not fully aware of the danger at this time and missed the opportunity to evacuate safely.
4.4. Fire Scene of No. 92-6
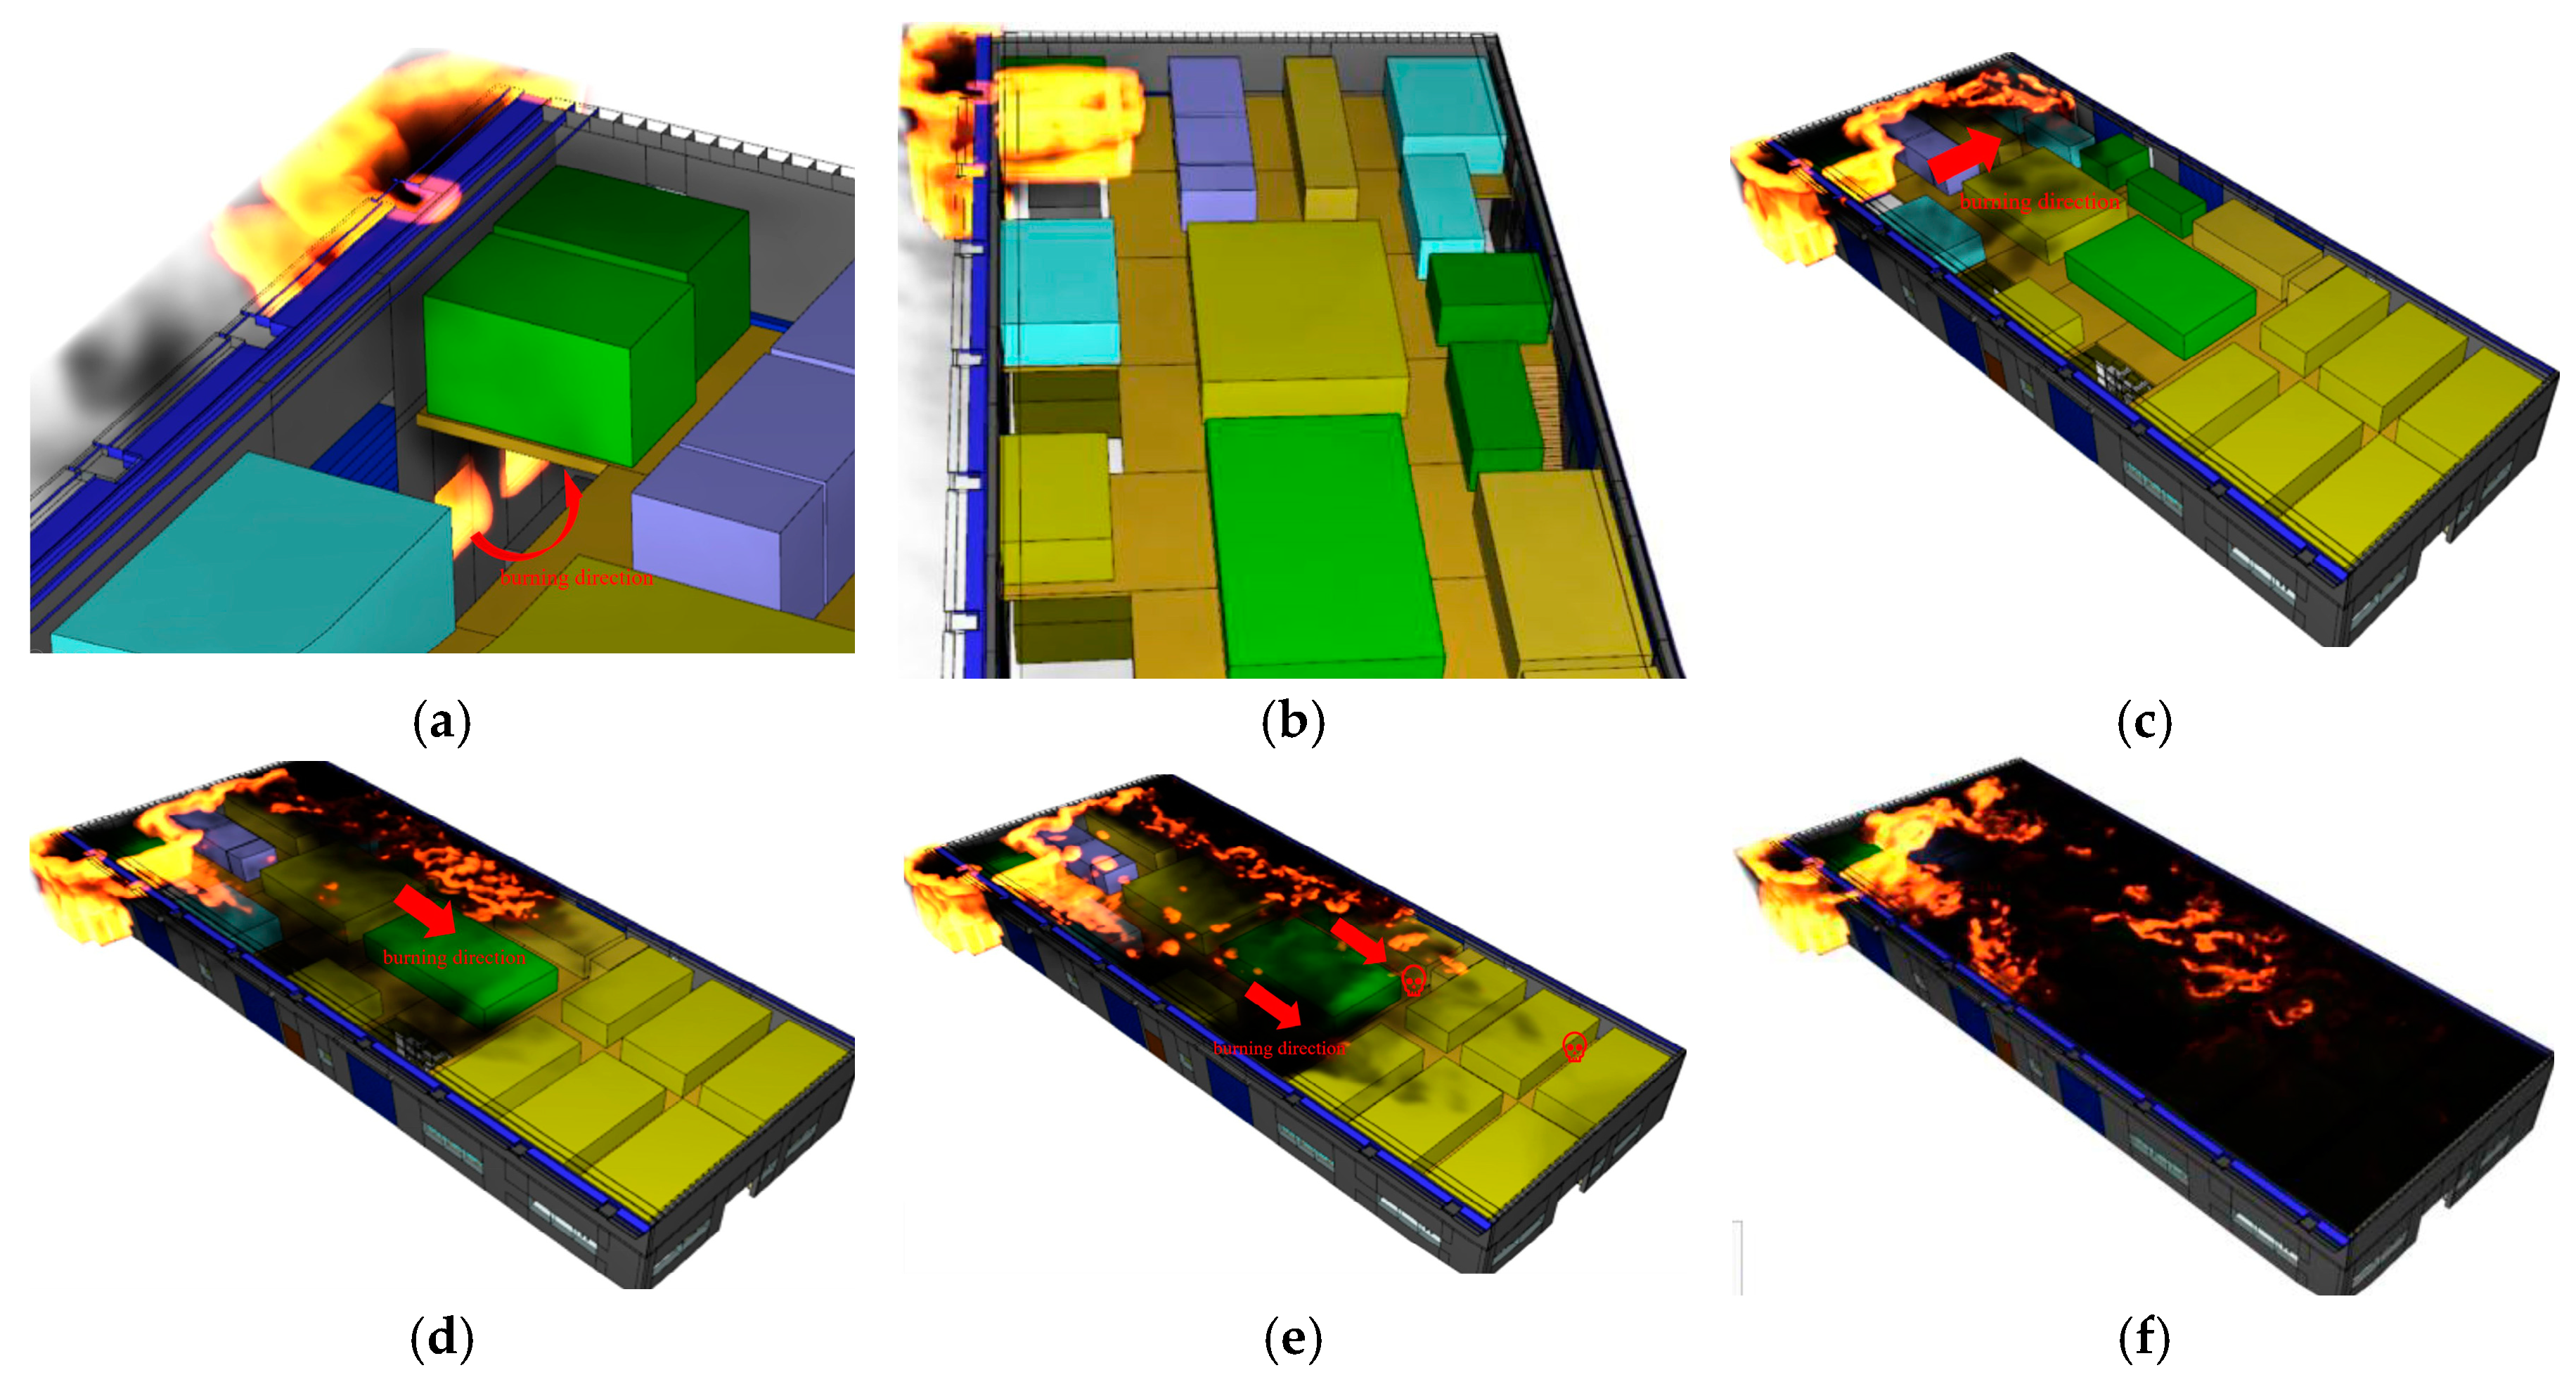
The first simulation began at 02:41 a.m. After 967 s, the paper roll pile on the south side of the exterior of No. 92-6 ignited. This was at around 02:57 a.m. (Figure 12a). This second simulation ran for 600 s to probe the spread of flames and smoke, the changes in indoor temperature, carbon monoxide (CO) levels, and visibility at No. 92-6. When the fire broke out on the south side of the exterior of No. 92-6, after about 107 s, a stream of fire broke through the window on the first floor of No. 92-6 and then traveled up through an opening on the second floor of the factory. This ignited nearby combustibles, as demonstrated in Figure 12b. From 110 to 126 s, the fire spread quickly inside No. 92-6, from east to west, then from south to north, as illustrated in Figure 12c–e. After approximately 134 s (02:59 a.m.), the rear half of the second floor of No. 92-6 was in full flame, and the fire and smoke spread towards the north side, as illustrated in Figure 12f. At this time, a flashover occurred in the interior of the second floor of No. 92-6.
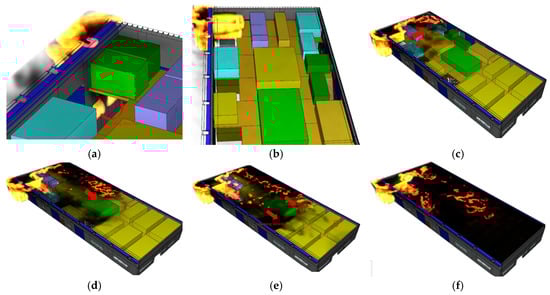
Figure 12.
Computer simulation results of the direction of fire expansion on the second floor at No. 92-6: (a) simulation start time 02:57 a.m., (b) simulation run time 107 s, (c) simulation run time 110 s, (d) simulation run time 118 s, (e) simulation run time 126 s, and (f) simulation run time 134 s.
4.5. Analysis of the Cause of the Firefighters’ Deaths
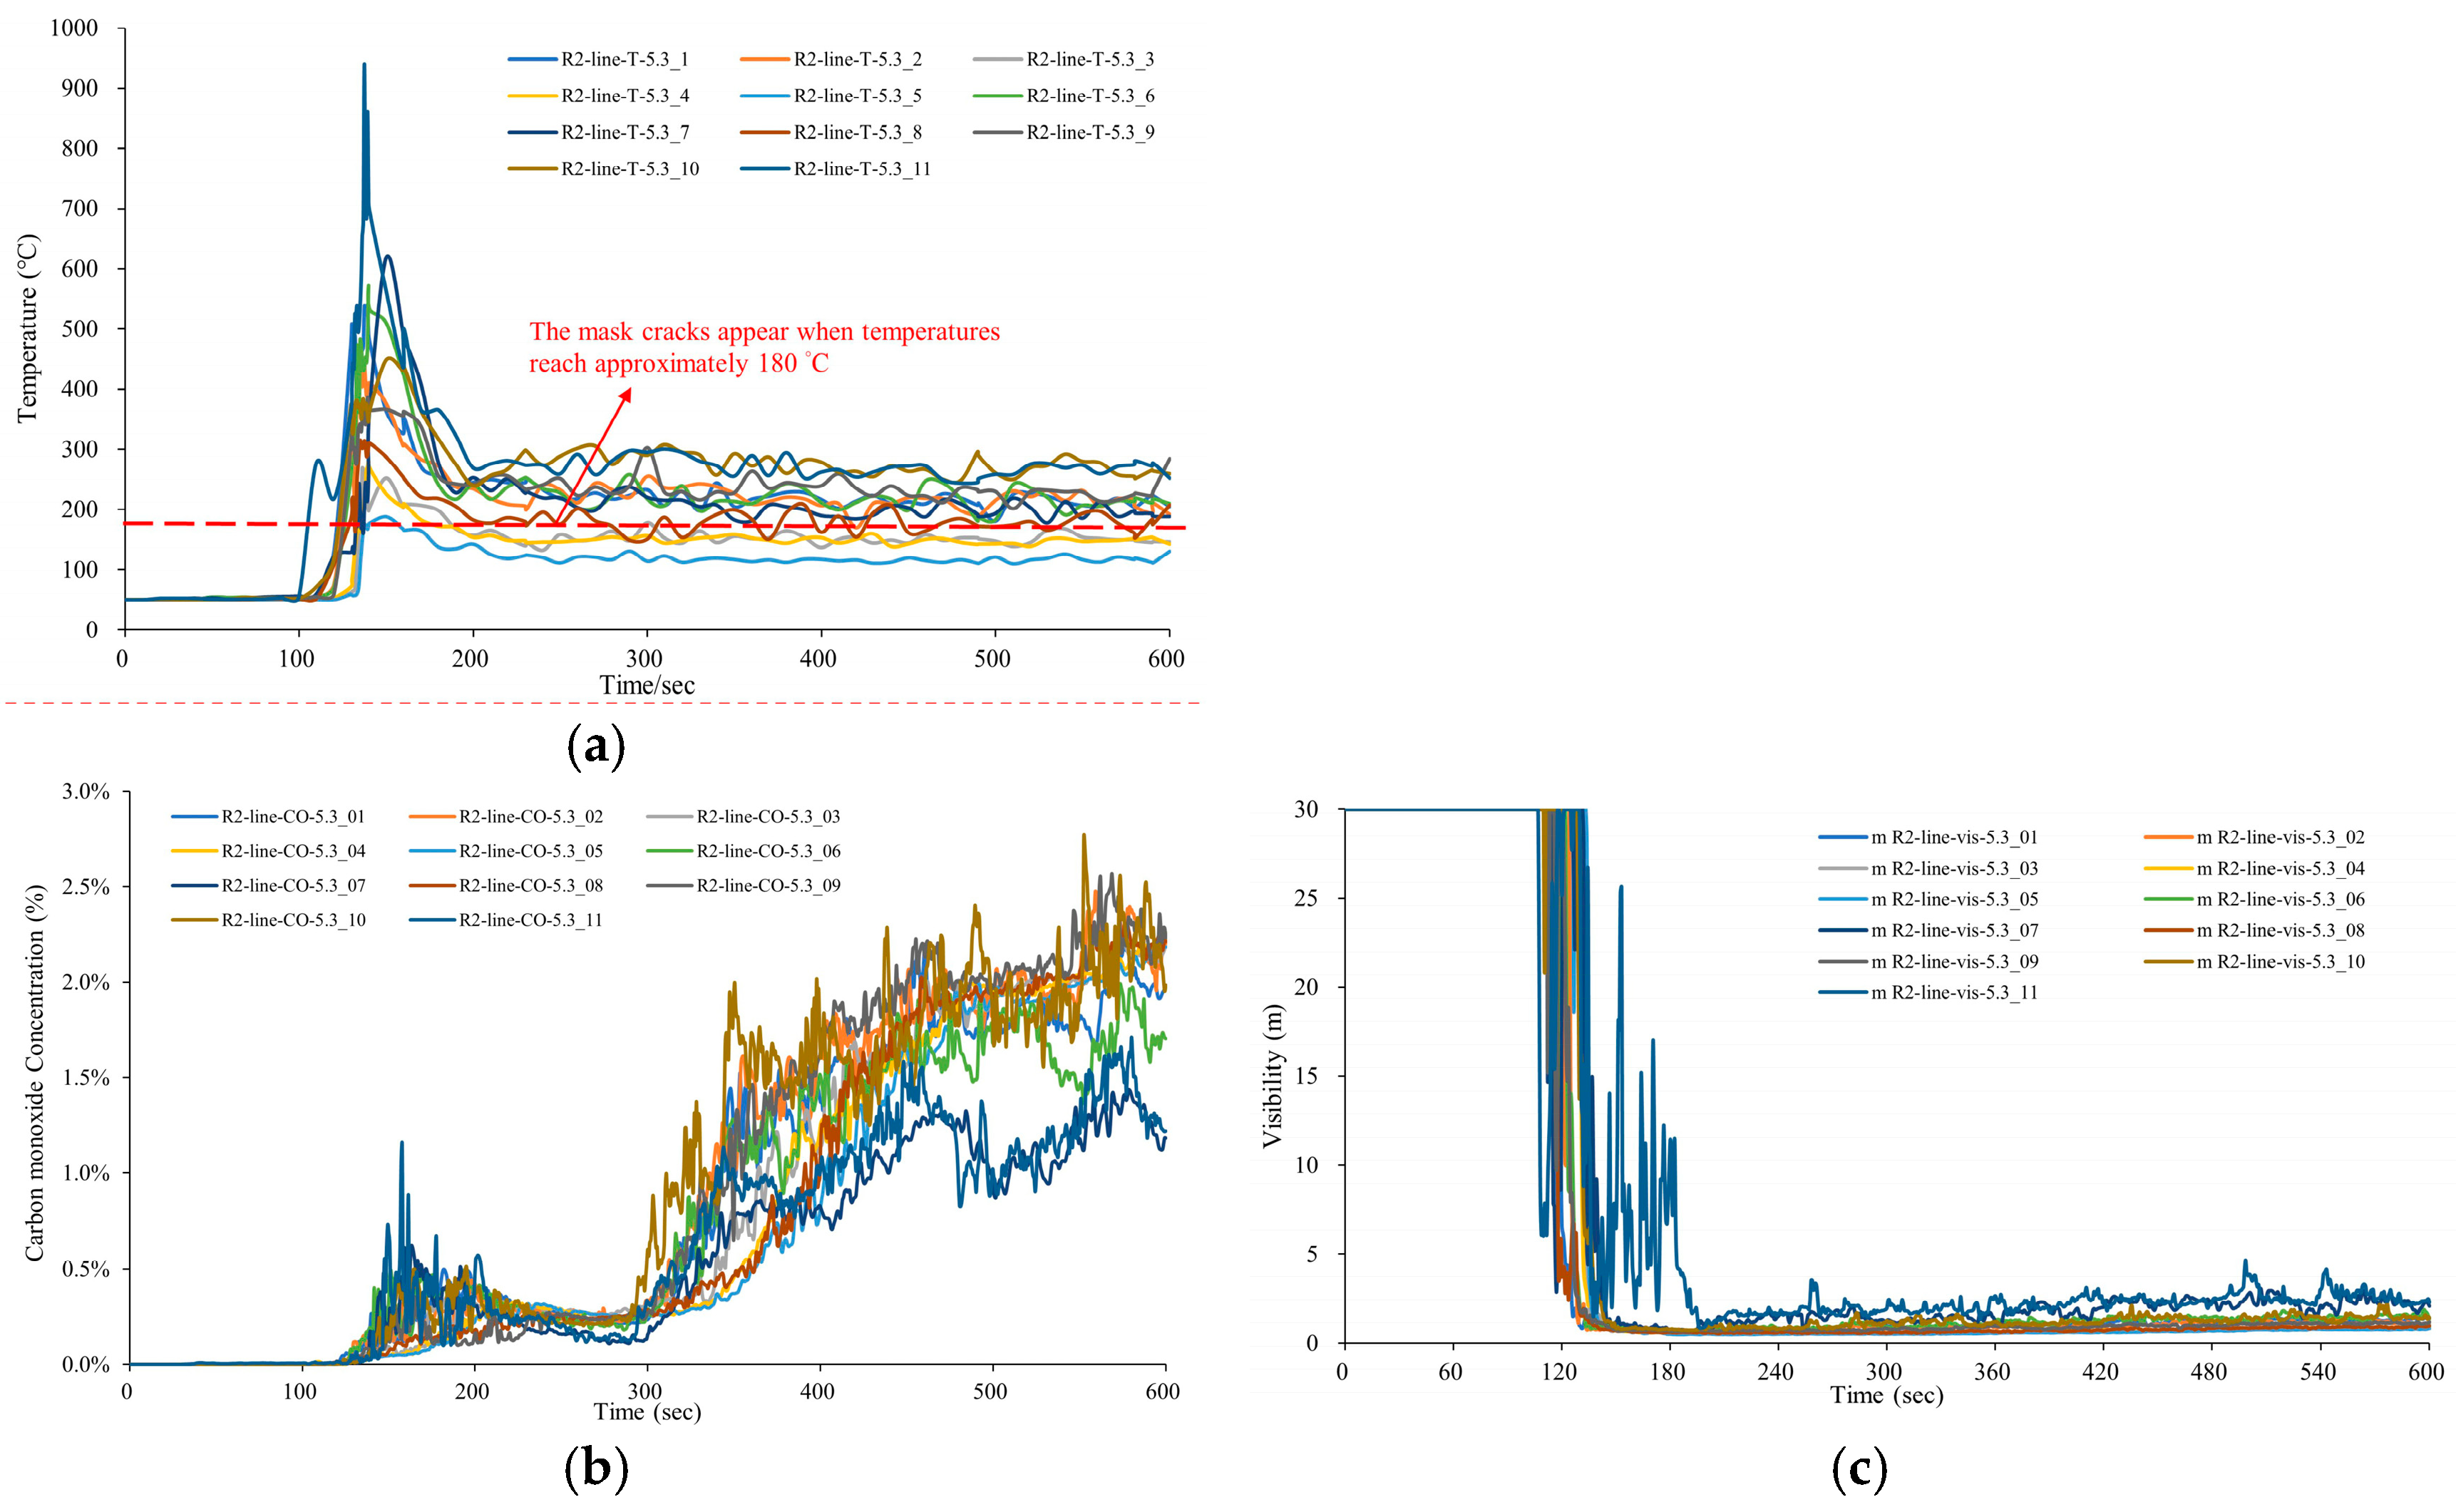
When the two firefighters entered the second floor of No. 92-6 to carry out their situational assessment duties, they would have been at or near the walkway of the second floor of No. 92-6. To test this in the simulation, 11 detection sensors were placed 1.5 m above the walkway, as shown in Figure 11a. When the pile of paper rolls outside the south side of No. 92-6 ignited (around 02:57 a.m.), a separate simulation was run, lasting 600 s (10 min) until 03:07 a.m. Between 100 and 200 s, the temperature of the 11 detection points above the surface of the second-floor walkway rose sharply. The maximum temperature was approximately 920 °C (Figure 13a). The floor temperature near the staircase leading down to the ground floor reached around 510 °C. In addition, the CO concentration at the detection point exhibited a constant increase, as shown in Figure 12b. The maximum concentration was around 3%. By 120 s into the simulation, visibility at the detection points dropped close to 0 m, as illustrated in Figure 12c. By this point, it had reached the fourth-level heat resistance limit for firefighters in fire conditions, as defined by the NIST classification [33]. Since the SCBA mask is the most vulnerable part of all firefighter protective equipment, firefighters had less than one minute of heat endurance, resulting in difficulty for the two firefighters to escape successfully.

Figure 13.
Computer simulation output for the sensors 1.5 m above the second-floor walkway at No. 92-6: (a) temperature change over time, (b) CO change over time, and (c) visibility change over time.
Fire can lead to promptly changing and unpredictable environmental conditions related to temperature, oxygen concentration, and heat radiation. In addition, there are threats from the structural failure of buildings and the thermal degradation of equipment. For example, in the United States, melting facepieces/lenses of SCBA is still a major cause of injury and death, as indicated by Mensch et al. [33]. According to SCBA experiments [34], masks that are NIST compliant can withstand radiant heat fluxes of between 2 and 15 kW m−2. At 15 kW m−2, the mask melts and produces holes in less than 5 min. At 8 kW m−2, the mask melts or produces holes after 20 min. Cracks also appear when temperatures reach approximately 180 °C, with bubbling occurring around 200 °C and holes appearing around 270 °C. For reference, the two firefighters in this situation were only wearing PPE and SCBA. Without the additional protection of hose lines, it would have been exceedingly dangerous for them to penetrate more than 50 m into the scene.
5. Conclusions and Recommendations
According to the official fire investigation report, the firefighters arrived at 01:53 a.m. and only set up eight hose lines—six on the north side of No. 92-7 and two on the west side. Figure 3 shows that to the east, west, and south of the fire scene was farmland and a height difference of 2 m between the ground level of the building and the surrounding area. This made it impossible to set up adequate hose lines to manage the situation. As a result, the fire at No. 92-7 spread to No. 92-6 via the south side, and this was the primary shortcoming of the response.
Full-scale experiments focusing on indoor fires have shown that when items such as rubber, textiles, and wood are stored in a room, thermal runaway conditions often occur when the room temperature reaches 300 to 420 °C. Research articles [35,36] have also shown that under normal circumstances, flashover conditions are reached when an interior upper floor temperature reaches 500 to 600 °C. In this case, the computer simulation showed that after the pile of paper rolls outside on the south side of No. 92-6 ignited, the fire broke a nearby window on the first floor in approximately 90 s and spread inside from there, as shown in Figure 12a. The interior of No. 92-6 was already filled with inflammable gas, so when the flames entered, the flammable gas in the space instantly ignited, causing full-scale combustion on the second floor of No. 92-6. At this point, the room temperature rose to 510 to 920 °C, triggering a flashover. This path of flame dispersion is similar to fire paths observed in other literature on the topic [37,38]. During attempts by firefighters to manage the blaze, emphasis was placed on the use of infrared cameras for environmental temperature measurement, which did not detect the problem of the accumulated combustible gas in the room. In similar situations in the future, firefighters should be aware of the notable threat that gas accumulation poses. Warning signs, such as a sudden decrease in visibility or other indicators of inflammable gases, should be vital indicators for immediate evacuation.
The official fire investigation report and a panel of fire experts concluded that radiant heat flux from the fire at No. 92-7 was the cause of the fire at No. 92-6. This study confirmed the cause of death for the two firefighters and did so using on-site investigations, interviews, calorimetric analysis/experiments, and a full-scale computer simulation. FDS also enables fire protection engineers to determine the effectiveness of various fire prevention measures. Understanding the causes, fire paths, and spread types is invaluable when developing functional safety protocols and optimal engineering solutions.
Author Contributions
Y.-H.H.: Conceptualization, Data curation, Formal analysis, Investigation, Methodology, Software, Writing—original draft. J.-H.C.: Conceptualization, Investigation, Project administration, Supervision, Validation, Writing—review and editing. C.-M.S.: Resources, Supervision, Validation, Writing—review and editing. All authors have read and agreed to the published version of the manuscript.
Funding
During the research period, the authors received a subsidiary budget from the National Fire Agency, Ministry of the Interior, Taiwan (Project number 1090-600-1571), and the National Science and Technology Council (project number NSTC 113-2625-M-274-001).
Data Availability Statement
No new data were created or analyzed in this study.
Acknowledgments
In addition, Maple Rainforest Disaster Prevention Technology Ltd. provided valuable information and experimental assistance. The authors express their sincere gratitude.
Conflicts of Interest
The authors declare that they have no known competing financial interests or personal relationships that could have appeared to influence the work reported in this paper.
Abbreviations
The following abbreviations are used in this manuscript:
| NIST | National Institute of Standards and Technology |
| CFD | Computational fluid dynamics |
| FDS | Fire dynamics simulator |
| DSC | Differential scanning calorimetry |
| TGA | Thermogravimetric analyzer |
| SCBA | Self-contained breathing apparatus |
| PPE | Personal protective equipment |
References
- Fahy, R.F.; Petrillo, J.T.; Molis, J.L. Firefighter Fatalities in the US–2019; NFPA Research: Orlando, FL, USA, 2020. [Google Scholar]
- Flanagan, M.J. A Look at the Deaths of Career and Volunteer Firefighters in America: Who Has the Higher Rate of Death? Master’s Thesis, Eastern Kentucky University, Richmond, KT, USA, 2013. [Google Scholar]
- Carey, B. On-duty firefighter deaths in detail. Fire Rescue Magazine, 4 January 2021. [Google Scholar]
- FOX 61 News; Truly a Hero: New Haven Firefighter Killed in House Fire Identified. 2021. Available online: https://www.fox61.com/article/news/local/new-haven-connecticut-fire-firefighters-investigation/520-261021e8-beb7-4fff-9545-5340d6257e57 (accessed on 16 July 2022).
- Guillaume, E.; Dréan, V.; Girardin, B.; Benameur, F.; Koohkan, M.; Fateh, T. Reconstruction of Grenfell Tower fire. Part 3—Numerical simulation of the Grenfell Tower disaster: Contribution to the understanding of fire propagation and behaviour during the vertical fire spread. Fire Mater. 2019, 44, 35–57. [Google Scholar] [CrossRef]
- Huang, Y.H. Using a fire dynamics simulator to reconstruct a fire scene in a hospital-based long-term care facility. J. Loss Prev. Process Ind. 2022, 80, 104863. [Google Scholar] [CrossRef]
- Vinay, V.; Raja, S.; Tauseef, S.M.; Varadharajan, S. Investigating the impact of oxygen concentration on fire dynamics using numerical simulation with FDS. Process Saf. Environ. Prot. 2023, 178, 195–203. [Google Scholar] [CrossRef]
- Baalisampang, T.; Saliba, E.; Salehi, F.; Garaniya, V.; Chen, L. Optimisation of smoke extraction system in fire scenarios using CFD modelling. Process Saf. Environ. Prot. 2021, 149, 508–517. [Google Scholar] [CrossRef]
- Hanifi, S.M.; Laal, F.; Ghashghaei, M.; Ahmadi, O.; Mandali, H. Providing a model to evaluate the spread of fire in a chemical warehouse using numerical simulation and Bayesian network. Process Saf. Environ. Prot. 2024, 183, 124–137. [Google Scholar] [CrossRef]
- National Fire Agency. Fire Statistics Annual Report; Ministry of the Interior, Executive Yuan: Taipei, Taiwan, 2024.
- McGrattan, K.; Hostikka, S.; McDermott, R.; Floyd, J.; Vanella, M.; Weinschenk, C.; Overholt, K. Fire dynamics simulator user’s guide. NIST Spec. Publ. 2013, 1019. [Google Scholar] [CrossRef]
- Beshir, M.; Mohamed, M.; Welch, S.; Rush, D. Modelling the effects of boundary walls on the fire dynamics of informal settlement dwellings. Fire Technol. 2021, 57, 1753–1781. [Google Scholar] [CrossRef]
- Cicione, A.; Beshir, M.; Walls, R.; Rush, D. Full-scale informal settlement dwelling fire experiments and development of numerical models. Fire Technol. 2019, 56, 639–672. [Google Scholar] [CrossRef]
- Alonso, A.; Lázaro, M.; Lázaro, P.; Lázaro, D.; Alvear, D. Assessing the influence of the input variables employed by fire dynamics simulator (FDS) software to model numerically solid-phase pyrolysis of cardboard. J. Therm. Anal. Calorim. 2019, 140, 263–273. [Google Scholar] [CrossRef]
- Yang, P.; Tan, X.; Xin, W. Experimental study and numerical simulation for a storehouse fire accident. Build. Environ. 2011, 46, 1445–1459. [Google Scholar] [CrossRef]
- National Fire Protection Association. NFPA 921: A Guide for Fire and Explosion Investigations, 2021st ed.; National Fire Protection Association: Orlando, FL, USA, 2021. [Google Scholar]
- Santos, B.R.V.; Urbina, M.M.; Souza, M.J.B.; Pedrosa, A.M.G.; Silva, A.O.S.; Sobrinho, E.V.; Castedo, R.V. Preparation and characterization of Pt-dealuminated Y zeolite by TG/DTA and TPR. J. Therm. Anal. Calorim. 2014, 119, 391–399. [Google Scholar] [CrossRef]
- Kalvachev, Y.; Zgureva, D.; Boycheva, S.V.; Barbov, B.; Petrova, N. Synthesis of carbon dioxide adsorbents by zeolitization of fly ash. J. Therm. Anal. Calorim. 2015, 124, 101–106. [Google Scholar] [CrossRef]
- Zhang, B.; Liu, S.H.; Chi, J.H. Thermal hazard analysis and thermokinetic calculation of 1,3-dimethylimidazolium nitrate via TG and VSP2. J. Therm. Anal. Calorim. 2018, 134, 2367–2374. [Google Scholar] [CrossRef]
- Huang, Y.H.; Chi, J.H.; Shu, C.M. Calorimetric investigation of a thermal hazard accident involving the heat insulation material in a crude oil piping system. J. Loss Prev. Process Ind. 2018, 56, 170–180. [Google Scholar] [CrossRef]
- ASTM E793; The standard test method for enthalpies of fusion and crystallization is differential scanning calorimetry. American Society for Testing and Materials (ASTM) International: West Conshohocken, PA, USA, 2018.
- ASTM E1131; Standard Test Method for Compositional Analysis by Thermogravimetry. ASTM International: West Conshohocken, PA, USA, 2020.
- Kevin, B.M.; Randall, J.M.; Craig, G.W.; Glenn, P.F. Fire Dynamics Simulator Technical Reference Guide, 6th ed.; Special Publication (NIST SP)—1018; National Institute of Standards and Technology: Gaithersburg, MD, USA, 2013; Volume 1. [CrossRef]
- Chi, J.H. A thermal analysis experiment and a fire dynamics simulator (FDS) were used to reconstruct an arson fire scene. J. Therm. Anal. Calorim. 2013, 113, 641–648. [Google Scholar] [CrossRef]
- Kwon, J.W.; Dembsey, N.A.; Lautenberger, C.W. Evaluation of FDS V.4: Upward flame spread. Fire Technol. 2007, 43, 255–284. [Google Scholar] [CrossRef]
- Wu, J.Y.; Lee, J.C.; Wu, Y.T.; Wu, S.H. Thermal analyses of four adsorption materials for environmental pollution by DSC and TG. J. Therm. Anal. Calorim. 2012, 112, 665–670. [Google Scholar] [CrossRef]
- Betting, B.; Varea, E.; Gobin, C.; Godard, G.; Lecordier, B.; Patte-Rouland, B. Experimental and numerical studies of smoke dynamics in a compartment fire. Fire Saf. J. 2019, 108, 102855. [Google Scholar] [CrossRef]
- Li, J.; Beji, T.; Brohez, S.; Merci, B. Experimental and numerical study of pool fire dynamics in an air-tight compartment focusing on pressure variation. Fire Saf. J. 2021, 120, 103128. [Google Scholar] [CrossRef]
- Hopkin, C.; Spearpoint, M.; Hopkin, D. A review of design values adopted for heat release rate per unit area. Fire Technol. 2019, 55, 1599–1618. [Google Scholar] [CrossRef]
- Caton, S.E.; Hakes, R.S.P.; Gorham, D.J.; Zhou, A.; Gollner, M.J. Review of pathways for building a fire spread in the wildland-urban interface Part I: Exposure conditions. Fire Technol. 2016, 53, 429–473. [Google Scholar] [CrossRef]
- Fu, M.; Weng, W.G.; Yuan, H.Y. Quantitative assessment of the relationship between radiant heat exposure and protective performance of multilayer thermal protective clothing during dry and wet conditions. J. Hazard. Mater. 2014, 276, 383–392. [Google Scholar] [CrossRef]
- Horn, G.P.; Kesler, R.M.; Kerber, S.; Fent, K.W.; Schroeder, T.J.; Scott, W.S.; Fehling, P.C.; Fernhall, B.; Smith, D.L. Thermal response to firefighting activities in residential structure fires: Impact of job assignment and suppression tactic. Ergon. J. 2017, 61, 404–419. [Google Scholar] [CrossRef] [PubMed]
- Mensch, A.E.; Braga, G.G.C.B.; Bryner, N.P. Fire Exposures of Firefighter Self-Contained Breathing Apparatus Facepiece Lenses; NIST Technical Note 1724; National Institute of Standards and Technology: Gaithersburg, MD, USA, 2011.
- Putorti, A., Jr.; Mensch, A.; Bryner, N.; Braga, G. Thermal Performance of Self-Contained Breathing Apparatus Facepiece Lenses Exposed to Radiant Heat Flux; NIST Technical Note 1785; National Institute of Standards and Technology: Gaithersburg, MD, USA, 2013. [CrossRef]
- Poulsen, A.; Bwalya, A.; Jomaas, G. Evaluation of the onset of flashover in room fire experiments. Fire Technol. 2012, 49, 891–905. [Google Scholar] [CrossRef]
- Weinschenk, C.; Madrzykowski, D.; Courtney, P. Impact of flashover fire conditions on exposed energized electrical cords/cables. Fire Technol. 2019, 56, 959–991. [Google Scholar] [CrossRef]
- Chen, C.; Nie, Y.; Zhang, Y.; Lei, P.; Jiao, W.; Wang, X. Experimental study on flame spread over poplar plywood in the inclined trench: Phenomenon of flame injection. J. Therm. Anal. Calorim. 2020, 146, 253–263. [Google Scholar] [CrossRef]
- Zhao, K.; Gollner, M.J.; Liu, Q.; Gong, J.; Yang, L. Lateral flame spread over PMMA under forced airflow. Fire Technol. 2019, 56, 801–820. [Google Scholar] [CrossRef]


Disclaimer/Publisher’s Note: The statements, opinions and data contained in all publications are solely those of the individual author(s) and contributor(s) and not of MDPI and/or the editor(s). MDPI and/or the editor(s) disclaim responsibility for any injury to people or property resulting from any ideas, methods, instructions or products referred to in the content. |
© 2025 by the authors. Licensee MDPI, Basel, Switzerland. This article is an open access article distributed under the terms and conditions of the Creative Commons Attribution (CC BY) license (https://creativecommons.org/licenses/by/4.0/).