Article

Explainable AI and Feature Engineering for Machine-Learning-Driven Predictions of the Properties of Cu-Cr-Zr Alloys: A Hyperparameter Tuning and Model Stacking Approach

1
Computer Science Department, Faculty of Computers and Information, Suez University, Suez P.O. Box 43221, Egypt
2
Department of Mechanical Engineering, Faculty of Engineering, Suez University, Suez P.O. Box 43221, Egypt
3
Department of Mechanical Engineering, College of Engineering, Imam Mohammad Ibn Saud Islamic University, Riyadh 11432, Saudi Arabia
4
Central Metallurgical Research & Development Institute (CMRDI), El-Tibbin-Helwan, Helwan 11421, Egypt
*
Authors to whom correspondence should be addressed.
Processes 2025, 13(5), 1451; https://doi.org/10.3390/pr13051451
Submission received: 2 April 2025 / Revised: 28 April 2025 / Accepted: 6 May 2025 / Published: 9 May 2025
(This article belongs to the Special Issue Heat Processing, Surface and Coatings Technology of Metal Materials)

Abstract

:
High-performance copper alloys are crucial for integrated circuit lead frames due to their high density, multifunctionality, and low cost. High-performance copper alloys typically address the competing issues of high strength and high electrical conductivity through alloying and processing control methods. However, the traditional methods for developing these alloys are time-consuming, expensive, and complex processes. This study utilizes Explainable AI by employing machine learning (ML) and deep learning (DL) techniques to predict the hardness (HRC) and electrical conductivity (mS/m) based on the alloy composition, including Cr, Zr, Ce, and La, and the processing parameters, namely the aging time, of Cu-Cr-Zr alloys. A comprehensive dataset of 47 experimental Cu-Cr-Zr alloy samples, derived from prior experimental studies, was analyzed using feature engineering, correlation analysis, and explainability methods such as SHapley Additive exPlanations (SHAP). Various ML models, including ensemble methods like XGBoost, CatBoost, and AdaBoost, were evaluated for their predictive performance. The feature importance analysis revealed that the aging time and Zr content significantly influence the hardness, followed by Ce content, while Cr and La contents reveal a weak contribution to hardness values. Electrical conductivity is predominantly controlled by aging time, with a weak negative influence of the alloying elements. These findings align well with metallurgical principles, where microstructural refinement and precipitation behavior dictate the hardness and conductivity of Cu-Cr-Zr alloys. Hyperparameter tuning and model stacking further enhanced the predictive accuracy, with the final stacked models achieving R2 scores of 0.8762 for hardness within a training time of 1.739 s and 0.8132 for electrical conductivity within a training time of 1.091 s. These findings demonstrate the effectiveness of ML-driven approaches in material property predictions, providing valuable insights for material design and property processing parameter optimization.

1. Introduction

Copper alloys are crucial to the integrated circuit (IC) industry, including electrodes and interconnects, due to their high thermal, electrical, and mechanical properties [1]. High thermal conductivity facilitates heat dissipation, while high electrical conductivity ensures efficient connections, the minimum power loss, and quick signal transfer. High mechanical strength and hardness are also crucial in preventing wear, cracking, and mechanical deformation under mechanical and thermal stress.
Material scientists face long-term challenges in developing strong, electrically conductive Cu-based alloys due to their contradictory properties, which undermine their widespread application [2,3,4,5].
In this study, the selection of Cr, Zr, Ce, and La as alloying elements was made based on their already established metallurgical relevance in Cu-based systems. Cr and Zr are well documented for enhancing mechanical properties by mean of solid solution strengthening and precipitation strengthening. The rare-earth elements Ce and La can help with microstructural stability and precipitation behavior. Their synergistic influence on electromechanical properties is yet to be widely investigated, especially with regard to aging treatments. This warrant focus on these four elements studied to better understand their individual and global roles in Cu-Cr-Zr systems via interpretable machine learning (ML) approaches.
Much effort has been made to assess the electromechanical characteristics of Cu-based alloys in an attempt to expedite the development process. The electromechanical properties of alloys are determined by their microstructures, which are impacted by their chemical composition and processing conditions [2,3].
One or more alloying elements, such as Fe, Co, Cr, Zr, Ce, Be, La, and Ti, can be added to copper alloys to enhance their electromechanical characteristics. Numerous studies have demonstrated that the alloying elements should have a minimal impact on the electrical conductivity and significantly change in their solid solubility from high temperatures to room temperature [1,2,3,4].
The processing conditions, particularly precipitation hardening treatment, have a strong impact on electromechanical properties. This treatment forms dispersed coherent phases precipitated in the Cu matrix throughout the aging process. These fine precipitates hinder dislocation motion, which improves Cu-based alloys’ hardness, tensile strength, and wear resistance while preserving their electrical conductivity. However, after extended aging, these precipitates become coarser and lose their coherency, which impairs the mechanical properties [2,3].
Even though sufficient advancements have been obtained in designing copper alloys, interpretable and accurate ML models for predicting the electromechanical properties of Cu-Cr-Zr alloys using limited experimental data have been inadequately explored in industry. The present study addresses this gap by concentrating on small-scale explainable modeling methods specifically designed for experimental datasets.
Cu-Cr-Zr alloys are environmentally friendly and nonmagnetic and are considered functional materials because of an appealing combination of their functional electrical and mechanical properties, as found in previous work [2,3] by the second and fourth authors. This qualifies Cu–Cr–Zr alloys for very large-scale integration into the next generation and calls for exceptional combinations of electromechanical properties.
Two stages make up the typical process of optimization of metallurgical properties. Depending on the composition and processing conditions, the microstructure is either produced or simulated in the initial stage. In the second stage, the microstructure is connected to the material’s properties [1,2,3,4,6].
To design and create novel materials with the desired properties, the conventional trial-and-error experimental work and research using computational simulations are complicated, time-consuming, and expensive [1,4,5,6]. Therefore, adopting a methodology that can be used to design and assess engineering alloys within a reasonable, efficient, and cost-effective approach is crucial [6].
Data-driven ML approaches have quickly emerged as a powerful tool for the development of new materials. An ML model is trained using databases from reported references and experimental observations in accordance with a certain algorithm. Without requiring in-depth knowledge of material engineering and processing, ML creates inference models that use material databases to learn the relationships between the composition, processing conditions, microstructures, and properties of materials. Thus, ML can boost the accuracy of predictions, speed up the development of new materials, optimize design more effectively, increase the efficiency of research, and facilitate interdisciplinary collaboration. In contrast to the traditional “post-analysis” approach, this enables a “pre-design” technique that designs materials before performing experiments, saving costs and time [1].
It is feasible to predict an alloy’s properties by taking into account its composition and processing conditions. Unfortunately, the black-box nature of many ML models limits their interpretability, leading to considerable deviation between predicted and experimental properties, suggesting that previously developed ML models have not been sufficiently generalizable. Inconsistent data points in the studied ranges and a lack of sufficient samples were probably the causes of this inaccuracy [5].
ML models that quantitatively describe the relationship between a Cu-Cr-Zr alloy’s composition and performance are limited due to the difficulty of feature representation.
The current work proposes a new prediction framework powered by a feature-engineering-aided ML model to overcome the above-mentioned constraints.
This approach seeks to establish quantitative inference mapping from the chemical composition and processing parameters to the electromechanical properties. This study leverages Explainable AI (XAI) techniques to uncover the contributions of different alloying elements and aging times, combined as features with hardness and electrical conductivity, known as the targeted properties, for a range of Cu-Cr-Zr alloys that have been experimentally studied and published by the second and fourth authors [2,3].
While prior studies [2,3] have established the effects of Cr and Zr on Cu-based alloys, the synergistic impact of rare-earth elements (Ce, La) and aging time on their electromechanical properties remains poorly understood. This gap underscores the need for a systematic analysis using XAI methods.
By integrating the feature engineering, model selection, hyperparameter optimization, and ensemble learning, the predictive accuracy was enhanced while ensuring the model’s transparency, ultimately aiding in material design and optimization.
The feature engineering effectively modifies the original feature set into robust factors of targeted properties with an accelerated computational process and boosted accuracy.

2. A Description of the Data

2.1. Feature Description

The electromechanical performance of Cu-Cr-Zr alloys depends on various compositional and process-specific parameters. In this study, the dataset was structured into two categories: input features (predictors) and output features (targets).

2.1.1. Input Features

These are the independent variables used to predict the material properties. The input features include the following:
  • Aging time (min): This represents the duration of the aging treatment in minutes. Heat treatment significantly influences both a material’s hardness and electrical conductivity by inducing microstructural changes. Its values range from 0 to 90 min.
  • Alloy composition (%): This represents the chemical composition of an alloy. This plays a critical role in determining its properties. Key elements include the following:
Cr (%): The chromium content (0.05–0.91%); Cr contributes to corrosion resistance and mechanical strength.
Zr (%): The zirconium content (0.05–0.98%); Zr refines the grain structure and enhances the mechanical properties.
Ce (%): The cerium content (0–0.12%); Ce affects grain refinement and wear resistance.
La (%): The lanthanum content (0–0.4%); La influences alloy stability and oxidation resistance.

2.1.2. Output Features

These are the dependent variables (targets) that the model aims to predict. The output features include the following:
  • Hardness (HRC): The primary mechanical property under investigation, measured in Rockwell Hardness C (HRC). Hardness is crucial in preventing wear and deformation under mechanical and thermal stresses in electromechanical applications. It is influenced by the alloying elements and aging time.
  • Electrical conductivity (mS/m): The target electrical property, measured in millisiemens per meter (mS/m). Electrical conductivity is essential for electromechanical applications to minimize the power loss and ensure quick signal transfer.

2.2. The Dataset and an Overview of the Feature Analysis

This research made use of a metallurgical dataset of 47 individual samples derived from experimental alloy formulations [2,3]. This dataset covers broad variations in the composition, the aging times of processing, and different ranges of hardness and electrical conductivity.
This study, differently from the previous study, adopted exploratory data analysis (EDA) techniques to investigate the data’s structure and main features. To identify relationships among variables and statistically summarize and correlate them, data visualization techniques were applied.
Feature engineering was carried out to ameliorate the data quality and enhance the predictive capability, including the following stages:
  • Feature creation: Both direct and indirect features were created to capture various relationships among the variables, such as interaction terms. Specifically, pairwise interactions between the alloying elements (Cr, Zr, Ce, La) and processing parameters (aging time) were generated to model their synergistic effects. Representative examples such as AgingTime × Ce and Cr × Zr were selected based on the feature importance analysis.
  • Feature selection: A mixture of correlation analysis, SHapley Additive exPlanations (SHAP)-based feature importance, and ML-driven feature importance methods was combined to select the relevant predictors. This ensured an appropriate trade-off between the model’s complexity and interpretability.
  • Data standardization: The dataset was standardized according to the standard scale method [7] so that every feature could be most equitably scaled across the domains. This was to ensure that one feature did not overshadow all others in the learning process. The transformation was defined by Equation (1), where M is the mean (Equation (2)) and SD is the standard deviation (Equation (3)):
X s t d = x M S D
M = 1 N i = 1 N x i
S D = 1 N i = 1 N x i M 2
Specifically, feature creation comprises the generation of interactions between the alloying elements and processing parameter types. Notable examples below are the following:
  • AgingTime × Ce: This includes the combined effect of the Ce content and heat treatment on the microstructural precipitation and strengthening process;
  • Cr × Zr: This testifies to the possible synergy of chromium and zirconium in grain refinement and solid solution strengthening.
Features were generated purely as the outcome of domain knowledge and earlier metallurgical experiments, aiming to capturing the non-linear relationships that governed hardness and electrical conductivity. Each feature was tested via SHAP and the correlation analysis, ensuring its predictive relevance. Only features that contributed positively to the model performance were kept in the final predictive models for further use.
The dataset had no missing values, and all 47 samples were analyzed. For outlier detection, the interquartile range (IQR) method was applied; however, no data points were removed due to the small sample size and the need to maintain natural experimental variability. An 80:20 train–test split was applied, and all of the models were validated using five-fold cross-validation to minimize overfitted outcomes while enhancing generalization. Hence, this preprocessing pipeline provided for consistent modeling outputs that were reproducible and enhanced the overall robustness of the predictive framework.
By incorporating SHAP with different ML feature importance analyses and correlation studies, this study comprehensively understood the dataset and then predicted hardness and electrical conductivity extremely well.

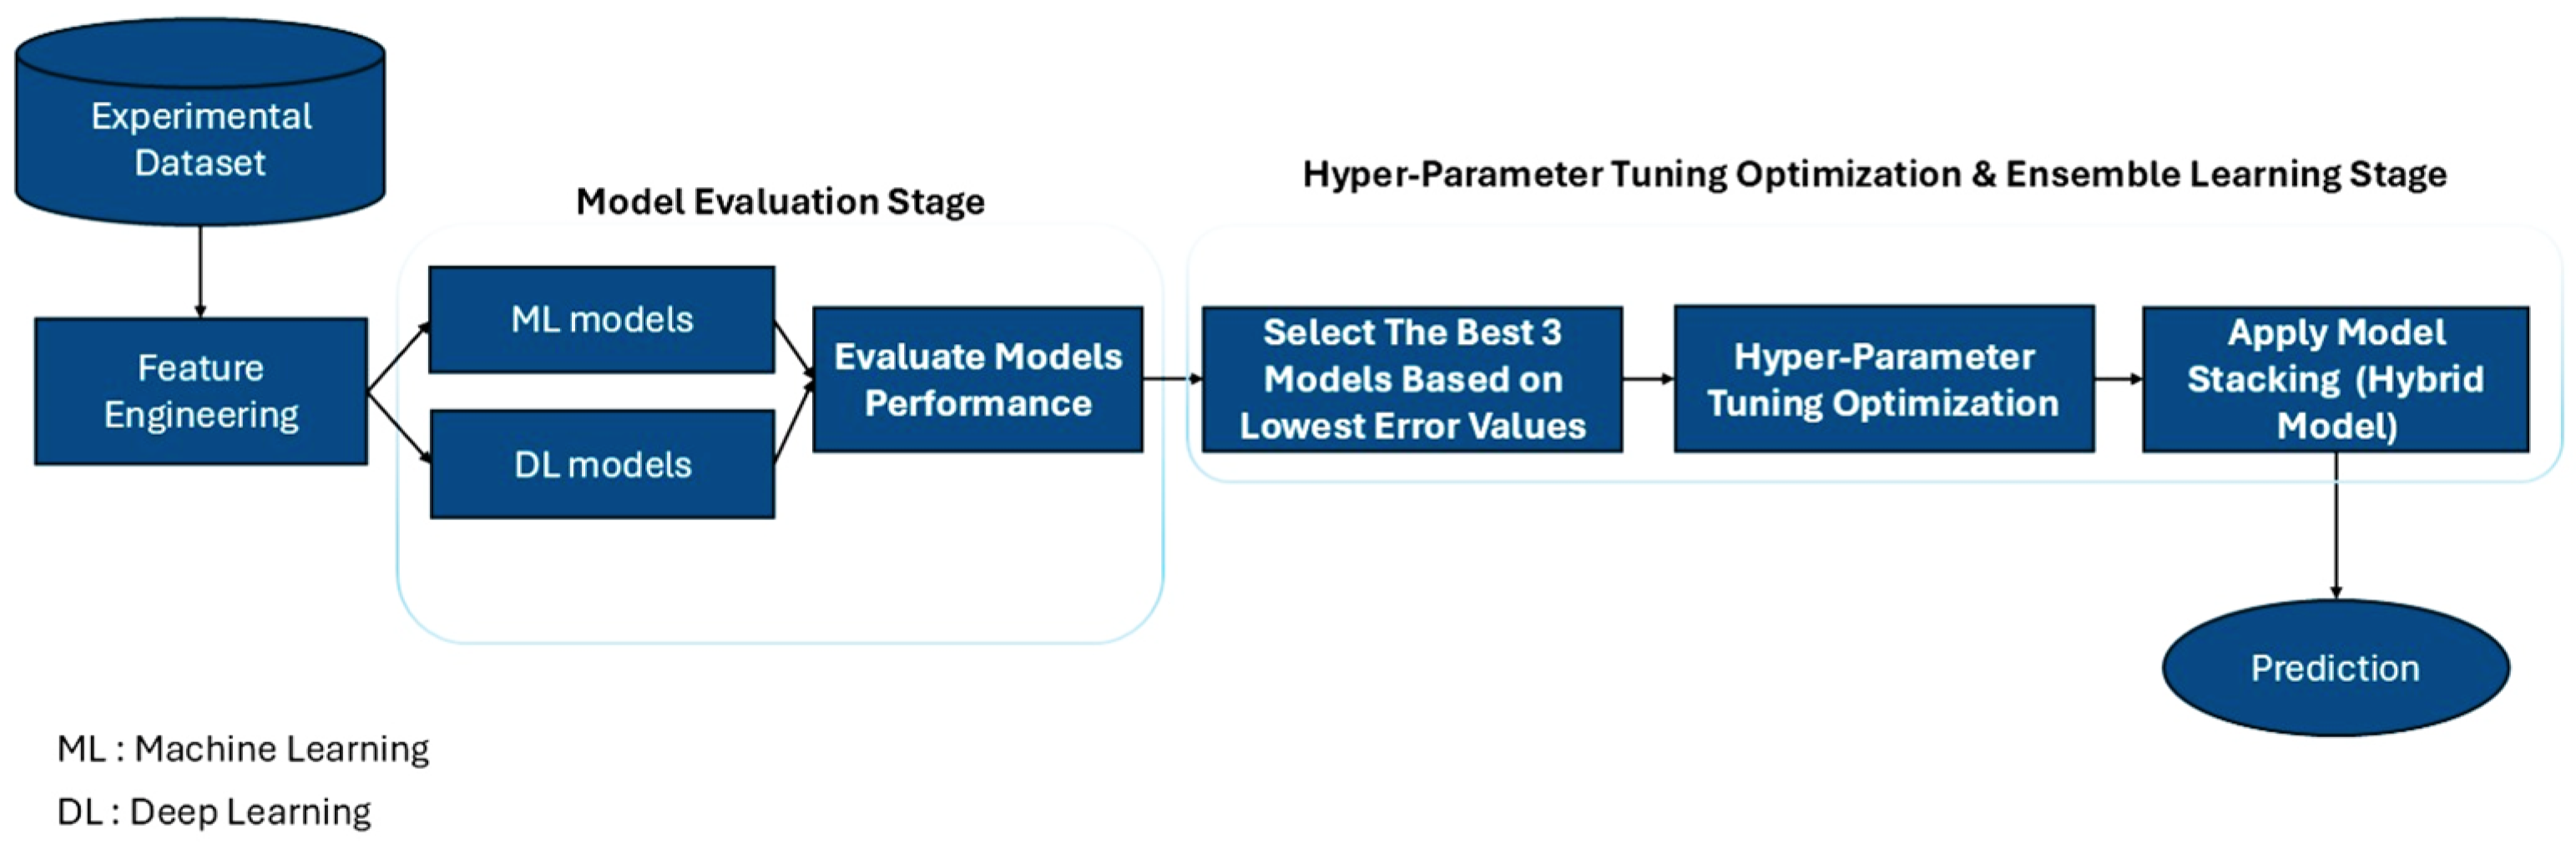
3. The Modeling Framework and Methodology

3.1. Overview of Machine Learning and Deep Learning Algorithms

In the context of this study, ML and DL modeling algorithms find their way into predictive modeling for the extraction of complex relationships between alloy composition, processing parameters, and material properties. Selecting the proper algorithms is directly related to acquiring accurate and generalizable predictions of the hardness and electrical conductivity of Cu-Cr-Zr alloys. A brief overview is provided here of the major ML and DL algorithms implemented in this work, along with their relevance to the problem that these methods attempted to address.
In this study, a set of 21 models was employed (18 ML and 3 DL) to obtain good coverage of the predictive performance assessed within the particular paradigm of the algorithms used. These models were as follows:
  • Linear models (e.g., Ridge, Lasso, ElasticNet) were included to provide interpretable baselines;
  • Tree models (e.g., decision trees, random forest, extra trees) were included due to their robustness when dealing with non-linear relationships and feature interactions;
  • Boosting models (e.g., XGBoost, LightGBM, CatBoost, AdaBoost, Gradient Boosting) were included due to their current state-of-the-art status with respect to predictions in tabular data;
  • Support vector machines and K-nearest neighbors were applied to test the performance concerning margin-based and instance-based learning paradigms;
  • DL models (MLP, CNN, and LSTM) were added to serve as a reference and assess the future scalability potential, despite the knowledge that their use with small datasets is not optimal.
This variety allowed for an extensive comparison of traditional and advanced methods and showed which algorithmic families could address small, structured experimental datasets like that used in this study better.

3.1.1. Machine Learning Algorithms

This study applied an array of ML algorithms which included traditional regression methods and some classical ensemble methods. These methods were assessed for their capacity to predict the material properties from the compositional and processing features. A detailed description of the 18 ML models implemented in this study is given below:
The gradient boosting regressor (GBR): The GBR works with weak learners in an iterative manner to reduce the error in the predictions and thereby enhance the strength of the predictions. Hence, it is one of the most potent models for predicting materials’ properties due to its capacity to deal with very complicated, non-linear datasets and its focus on rectifying the errors of its predecessors [8].
The random forest (RF) regressor: RF is simple, combining many decision trees into an ensemble model. The results are reducing overfitting and increasing the predictive accuracy, especially when a dataset has complex feature interactions. The robustness of RF and its adeptness in using large datasets are why many forecasters end up choosing it for their tasks [9].
The decision tree (DT) Regressor: A DT is tree-based and splits the data into separate sets based on thresholds of features to capture non-linear patterns quite effectively. Although it is simple and provides interpretability, it is prone to overfitting if not pruned and is therefore not generalizable to unseen data [10].
The AdaBoost (AdaBoost) Regressor: AdaBoost is a weighted boosting algorithm that focuses on misclassified samples and continues improving the performance of the model. Its inner rotation means that each next model tries to make up for the deficiencies found in earlier models [11].
The Extra Trees (ET) Regressor: ET goes one step further and extends the concept of RF by introducing additional randomness into the tree-building process. It is extra random and makes the individual trees more different, generalizes better, and reduces variance properties [12].
The Extreme Gradient Boosting (XGBoost) Regressor: XGBoost is the most optimized implementation of the gradient-boosting algorithm, said to be scalable and able to handle missing values effectively. In addition to being famous for its speed, it is famed for its aptness within structured/tabular datasets [13].
The Categorical Boosting (CatBoost) Regressor: This is especially useful when training on data that have categorical features, as it allows for ordered boosting. During this, the target does not leak into the training data, and feature interactions are taken care of smoothly. It is very appropriate for mixed types of data [14].
Bayesian Ridge (BR): BR assumes prior distributions for the coefficients, and it is a probabilistic approach to regression. This guarantees steady predictions, even in adverse conditions, because this method is robust to low sample sizes or little prior knowledge of the data [15].
Elastic Net (EN): Elastic Net is a synthesis of the L1 and L2 regularization methods, differing in favor of the feature selection and coefficient shrinkage, respectively; it works wonders for datasets containing correlated features, making it the go-between for Ridge and Lasso, which may deliver poor statistics when used separately [16].
The Huber regressor (HR): The HR is very effective against noise in a dataset, where the HR has typically been used due to its mechanics of switching from L1 loss to L2 according to a certain error size, with the ability to switch back for both loss types [17].
The K-nearest neighbors (KNN) regressor: KNN is a non-parametric design that estimates the target values based on the nearest training examples in the feature space. It is simple to understand and effective in capturing localized patterns, meaning it is always the best choice in cases where the connection between the features and the target variable must be defined by the local neighborhood data [11].
Lasso regression (LASSO): Lasso regression applies L1 regularization to shrinking the coefficients of less important features to zero, thus performing feature selection by itself. Therefore, this property makes Lasso a strong candidate for handling high-dimensional datasets where the selection of the features is highly important to enhancing the performance of the model [11].
Linear regression (LR): LR is a basic model that is useful for this work. It assumes a linear relationship between the input features and the target variable, making it most suited to datasets where such dependencies indeed exist. Despite its simplicity, LR helps to create a benchmark for the comparison of more complex models to be built and further establishes the minimum expectations in terms of performance [18].
Orthogonal Matching Pursuit (OMP): OMP is a sparse approximation that iteratively selects features to approximate the target variable. It works very well in datasets in which only a small proportion of the features contributes significantly to the output [19].
The Passive Aggressive regressor (PAR): The PAR is an online learning algorithm that maintains a high velocity in updating the model parameters for errors that exceed a certain threshold. Given this adaptability, it is useful for streaming applications [20].
Ridge regression (RR): RR provides traditional LR with L2 regularization charged on large coefficients to penalize overfitting. This is especially useful for problems where the input features are multicollinear; here, traditional LR may have difficulties [11].
The Dummy regressor (Dummy): This acts as a baseline model using simple strategies for the predictions such as the mean or median. Also, Dummy serves as a reference point for performance evaluations between simple models and more complex ones [21].
Light Gradient Boosting Machine (LightGBM): LightGBM is yet another gradient boosting framework that features efficiency and speed in the splitting. It uses histogram-based splitting and applies leaf-wise growth strategies to improve the performance on large datasets [22].

3.1.2. Deep Learning Algorithms

DL algorithms represent a portion of ML techniques that use artificial neural networks (ANNs) to develop a multi-layer network model for taking care of the complex, intricate, non-linear relationships in a given dataset. This research aims to test three leading DL architectures in the prediction of the electromechanical properties of Cu-Cr-Zr alloys. Each architecture was selected on the basis of its theoretical strength for processing specific data in specific tasks.
Convolutional Neural Networks (CNNs): These neural networks were specifically devised for image-based applications, and they assimilate spatial hierarchies and local regularities in their convolutional layers [23]. Typical implementations include applications such as image classification or object detection. However, there are no major uses for CNNs in tabular datasets. In this study, CNNs were evaluated for discovering possible hidden patterns in the Cu-Cr-Zr alloy composites and their processing parameters. The lack of a spatial or hierarchical structure within the dataset proved to render the CNNs ineffective, leading to their poor prediction performance.
Long Short-Term Memory Networks (LSTMs): LSTM are specialized varieties of recurrent neural networks (RNNs) whose design is exact in modeling magnets that have memory states across long time dependencies [24]. Such networks are considered important in time-series forecasting, as well as for tasks in natural language processing. Still, even after showing highly temporal dynamics, LSTMs demonstrated very poor generalization in this study; the reason for this is possibly the lack of either sequential or temporal features in the dataset. In addition, because of the static nature of the alloy composition and processing parameters, LSTMs were not applicable.
Multi-Layer Perceptrons (MLPs): MLPs are classified as feedforward artificial neural networks composed of an input layer, one or more hidden layers, and an output layer. MLPs can model the intricate, non-linear relationships between input features and target variables through the mechanism of backpropagation, along with non-linear activation functions [25]. MLPs are extremely suitable for high-dimensional datasets involving complex feature interactions. However, in this study, the predictive accuracy of the MLPs observed was also low due to certain factors such as the small size of the dataset and difficulty in training deep networks using sparse data. The black-box nature of MLPs often restricts their interpretability, which is another important consideration in material science applications, as knowing the feature–property relations is essential.
Although we were impressed by their theoretical capabilities, the DL models that were evaluated in this study were unable to demonstrate a superior performance over that of the traditional ML and ensemble approaches. This highlights the importance of the dataset’s characteristics in terms of its size and feature structure to the suitability of the DL algorithm. It further illustrated that there is no preprocessing method sufficient for or dataset size large enough for tapping into the full capability of such DL models in material property prediction tasks. Future research could opt for strategies like transfer learning or synthetic data augmentation to address such limitations so as to optimize the application of DL to metallurgy.

3.1.3. Rationale for the Algorithm Selection

Algorithm selection represents a trade-off between prediction accuracy, computational efficiency, and interpretability. The traditional regression models served as good baselines, while more advanced methods exhibited a superior performance in terms of detecting the complex relationships lying within the data. DL models were also invited to the table, emphasizing the need to try different methodologies even if the initial results leave something to be desired.
Thus, this robust algorithmic framework leveraged the strengths of different approaches; hence, it improved the reliability and usability of the predictive models.

3.2. Data Preprocessing and Preparation

The steps of feature engineering were employed before training to ensure good quality and consistency in the data. Interaction terms between the elements were introduced during feature creation to handle the complex relationships. Feature selection was conducted using a correlation analysis, SHAP-based feature importance, and ML feature importance techniques to keep only the most relevant predictors. The data were also standardized using the standard scale method to achieve a uniform scale within the features so that no single feature could dominate the learning process.
Having split the dataset into training (80%) and testing (20%) subsets, five-fold cross-validation was applied to enhance the generalization and reduce overfitting.

3.3. The Model Selection and Training

An ensemble of 18 ML models, along with an additional 3 DL models, was considered in the predictive framework for estimating hardness and electric conductivity. Each model was assessed using the R-square (R2), the Root Mean Square Error (RMSE), and the Mean Absolute Error (MAE). The three topmost performing models were ultimately selected for further optimization and ensemble learning.

3.4. Model Evaluation and Cross-Validation

Five-fold cross-validation is said to be the best in generalizing for robustness. It systematically divides the dataset into K subsets (folds), training on K-1 but testing on the last fold. The whole process is repeated K times, in which case each fold acts as a test set once. This approach gives a more reliable measure of the model’s performance by reducing variance due to dataset partitioning.

3.5. Hyperparameter Optimization

The hyperparameters of the selected models were fine-tuned using Grid Search [26] and Bayesian Optimization [27] in order to enhance the predictive accuracy. The optimal set of hyperparameters was selected through reference to the cross-validation performance, achieving a good trade-off between the model’s complexity and generalization.

3.6. Ensemble Learning and Model Stacking

The top three models were stacked together to enhance the predictive performance through a hybrid ensemble learning method, whereby stacking attempts to minimize the prediction errors of the individual models by combining their inputs [28]. With such a design, the stacking framework is capable of improving the generalization through the utilization of the complementary strengths of the individual models, as shown in Figure 1.

4. Analysis of Feature Importance

The analysis of the feature importance gave a clear picture of the influences of the various alloying elements and processing parameters on the hardness and electrical conductivity of the alloys studied. The present exhaustive evaluation uses SHAP values, feature importance rankings based on ML models, and a correlation analysis.
The correlation matrix represented in Figure 2 elucidates the relationships between the most pertinent variables, with Cr, Zr, Ce, La, aging time, hardness, and electrical conductivity being oppositely correlated depending on the strengths of the relationship involved.

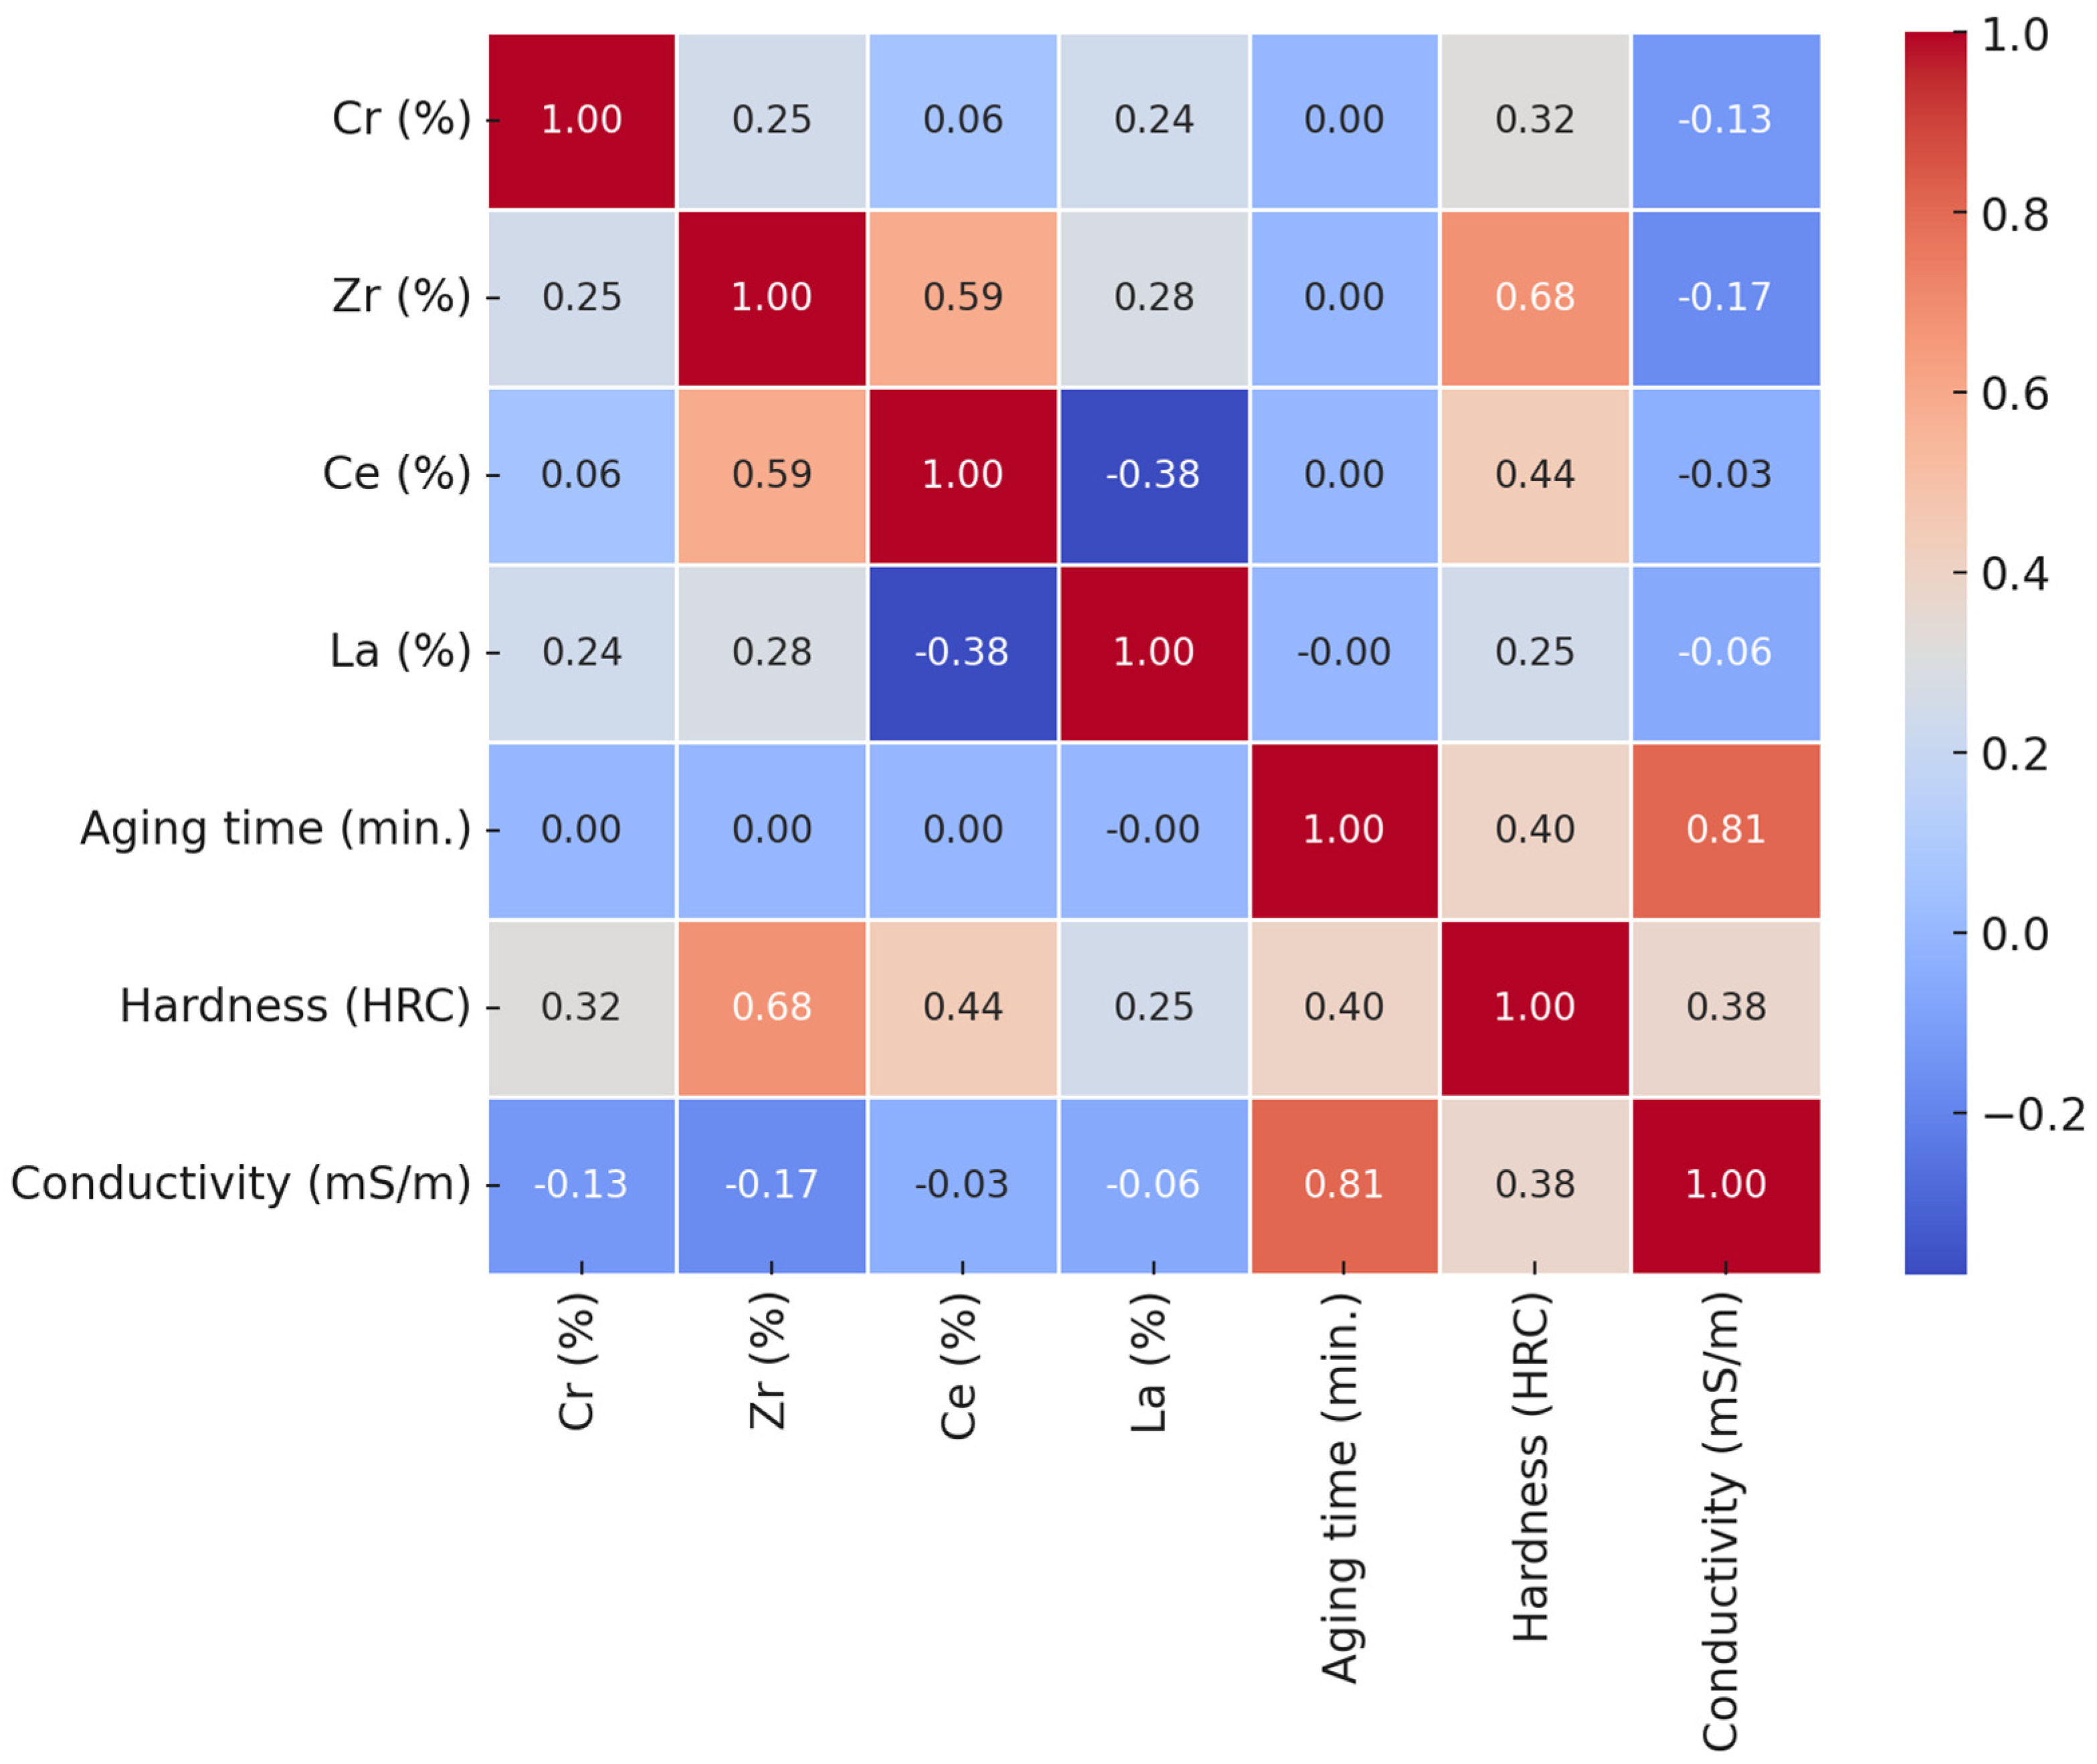
4.1. The Correlation Analysis

The correlation matrix presents the interactions between the material properties and input variables. The results are then divided into hardness versus electrical conductivity to stress their different dependencies on the alloy composition and processing parameters.

4.1.1. Hardness

The correlation matrix highlights the following key interactions for hardness:
Zr (%) and Hardness (0.68): A strong positive correlation, confirming its significant strengthening effect;
Ce (%) and Hardness (0.44): A moderate correlation, suggesting a minor contribution to strengthening;
Aging Time and Hardness (0.40): Aging time plays a notable role in the development of hardness.
Cr (%) and Hardness (0.32): A weak correlation, suggesting a low contribution to strengthening;
La (%) and Hardness (0.25): A weak correlation, suggesting a minor contribution to strengthening.
These results are in agreement with the point of view of metallurgical concepts. Zr (%) has a strong influence on hardness due to its role in refining the microstructure; dissolving in the Cu matrix, which promotes solid solution strengthening; and forming fine, coherent precipitates that enhance the hardness via precipitation hardening. Research confirms that even at higher Zr concentrations, its impact on hardness remains positive [2,3].
Ce (%) has a moderate impact on hardness, as it dissolves in the Cu matrix to promote solid solution strengthening. At low concentrations, Ce also forms fine, coherent precipitates that impede dislocation movement, further enhancing hardness.
Aging time significantly contributes to hardness by enabling the formation of precipitates that hinder dislocation motion through precipitation hardening. However, excessively long aging times result in coarsening and loss of coherency in the precipitate, leading to a deterioration in hardness.
On the other hand, Cr (%) and La (%) have low solubility in the Cu matrix, resulting in weak contributions to solid solution strengthening. At higher concentrations, these elements form large, incoherent precipitates which negatively affect hardness.

4.1.2. Electrical Conductivity

The correlation matrix highlights the following key interactions for electrical conductivity:
  • Aging time and electrical conductivity (0.81): The strongest correlation, indicating that this heat treatment is the primary driver of electrical conductivity;
  • Cr, Zr, Ce, La vs. electrical conductivity: Weak negative correlations suggest these alloying elements have little effect on the electrical conductivity.
According to the metallurgical point of view, these results are consistent. Aging time has a very strong impact on electrical conductivity. During aging, precipitates form in the Cu matrix, reducing the solubility of the alloying elements and decreasing electron scattering, thereby enhancing the electrical conductivity. Longer aging times promote this effect, further improving the conductivity.
The weak negative influence of the alloying elements (Cr, Zr, Ce, La) on electrical conductivity is attributed to their dissolution in the Cu matrix, which increases electron scattering and harms conductivity. These effects depend on the solubility limits of the respective elements in the Cu matrix.

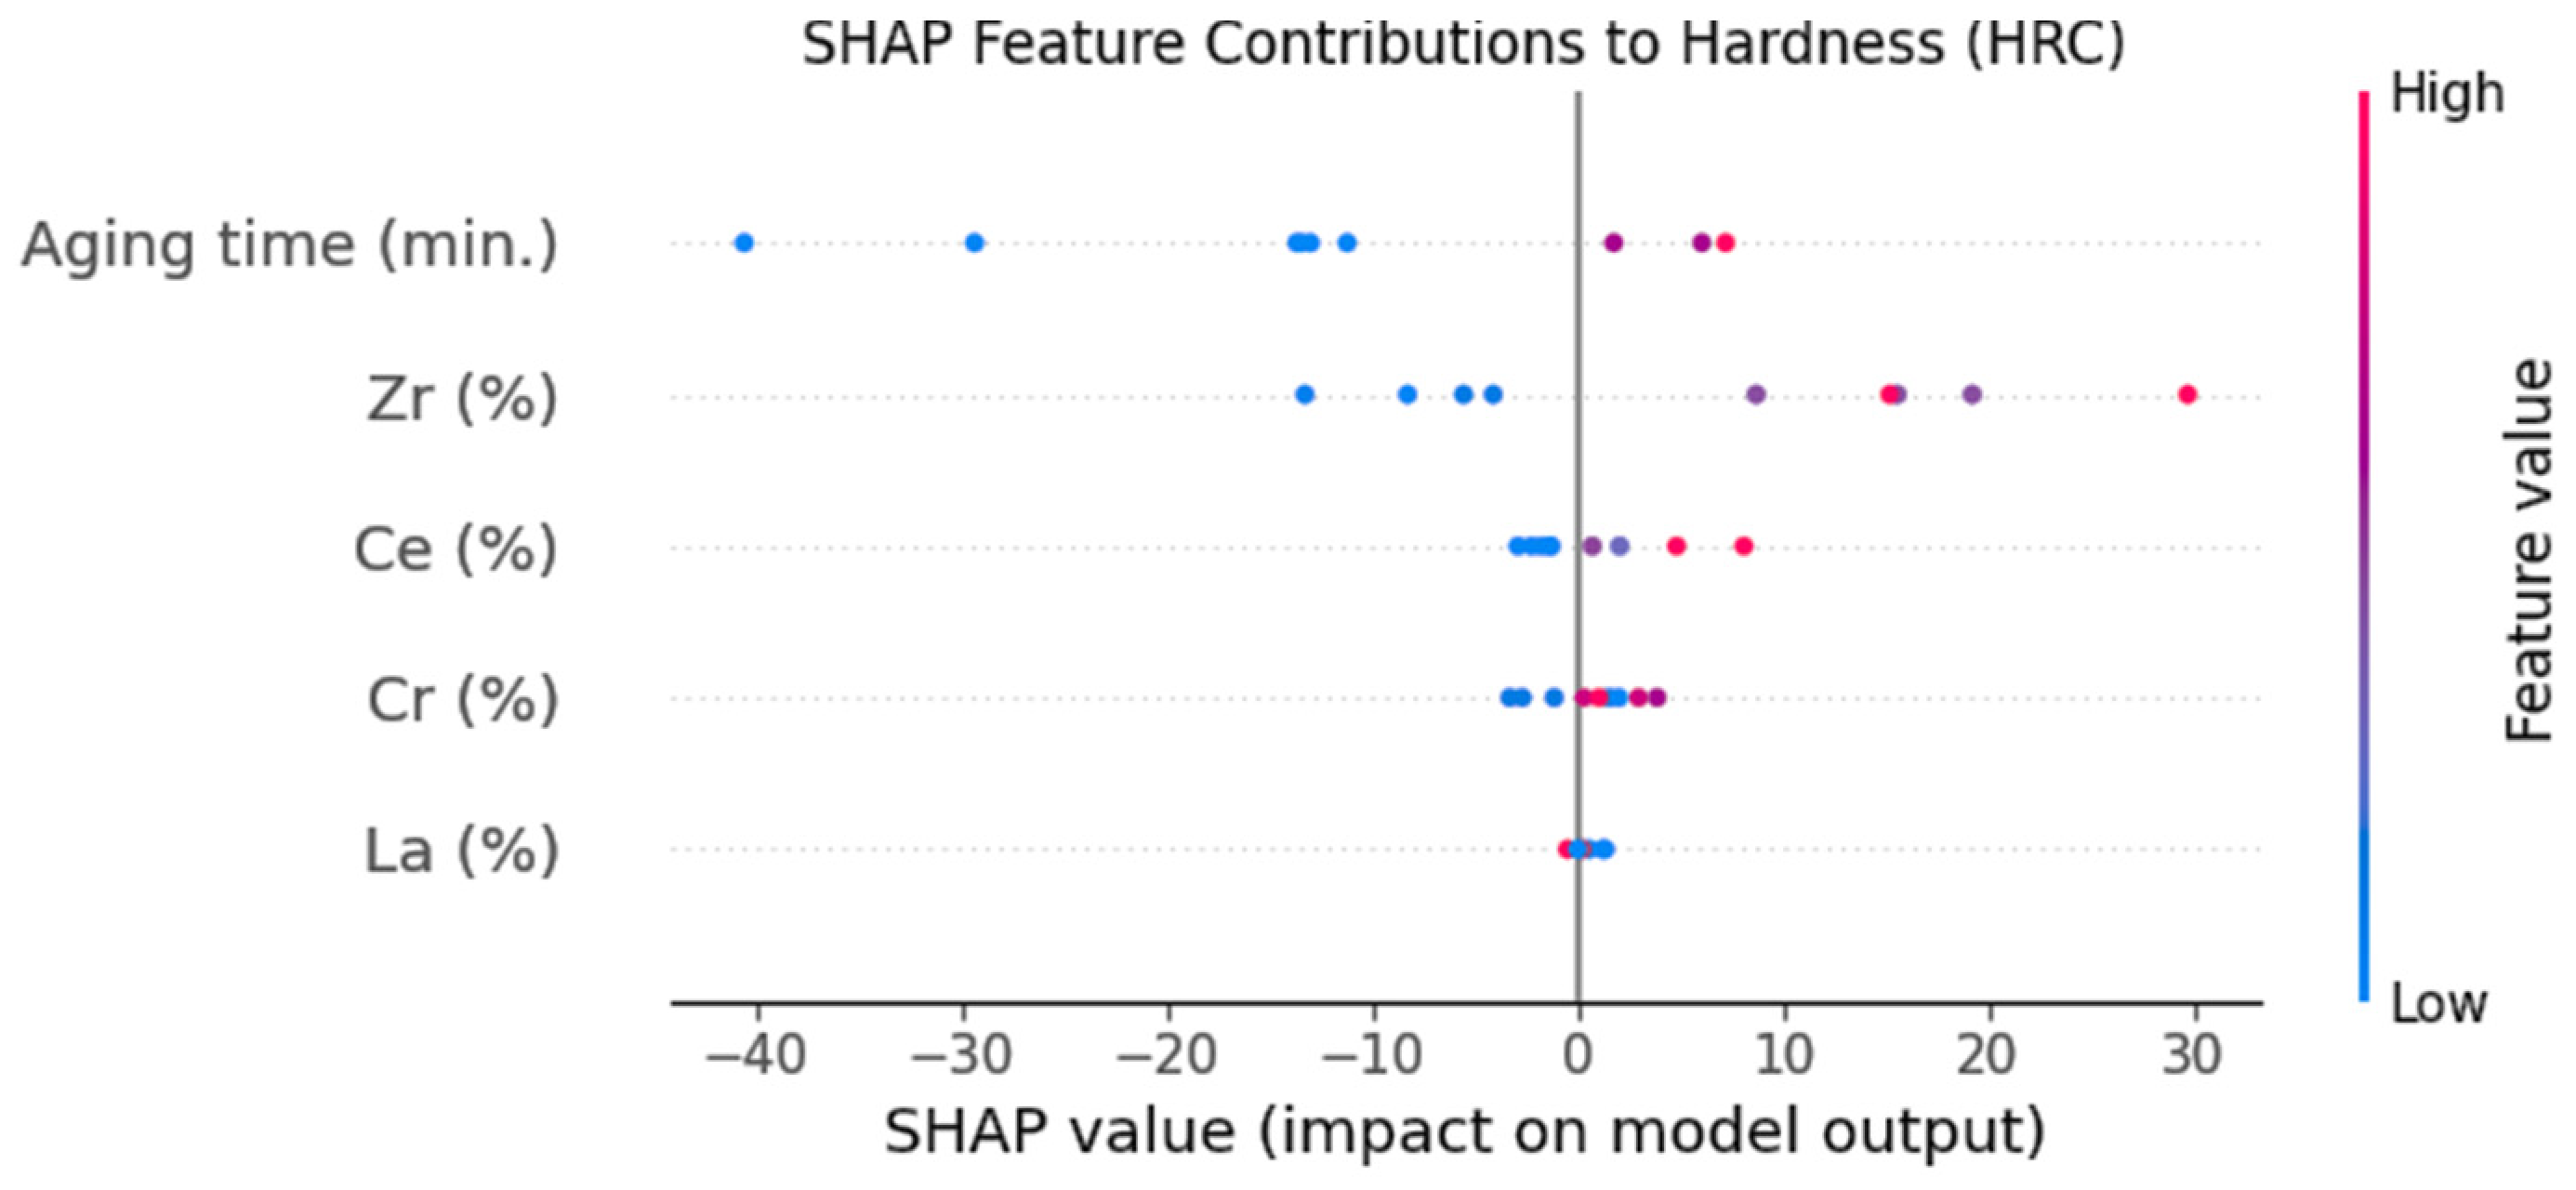
4.2. Hardness Predictions

The SHAP feature importance analysis (Figure 3) indicates that aging time and Zr content are the two most influential factors affecting hardness. Cr, Ce, and La show relatively minor contributions. The results of the SHAP feature importance analysis confirm the results of the correlation analysis and the metallurgical concepts.
The ML-based feature importance plots (Figure 4) from various models, including ET, XGBoost, GBR, and AdaBoost, confirm similar trends. Zr and aging time consistently emerge as the dominant features, while Cr, Ce, and La exhibit lower importance scores across all models.

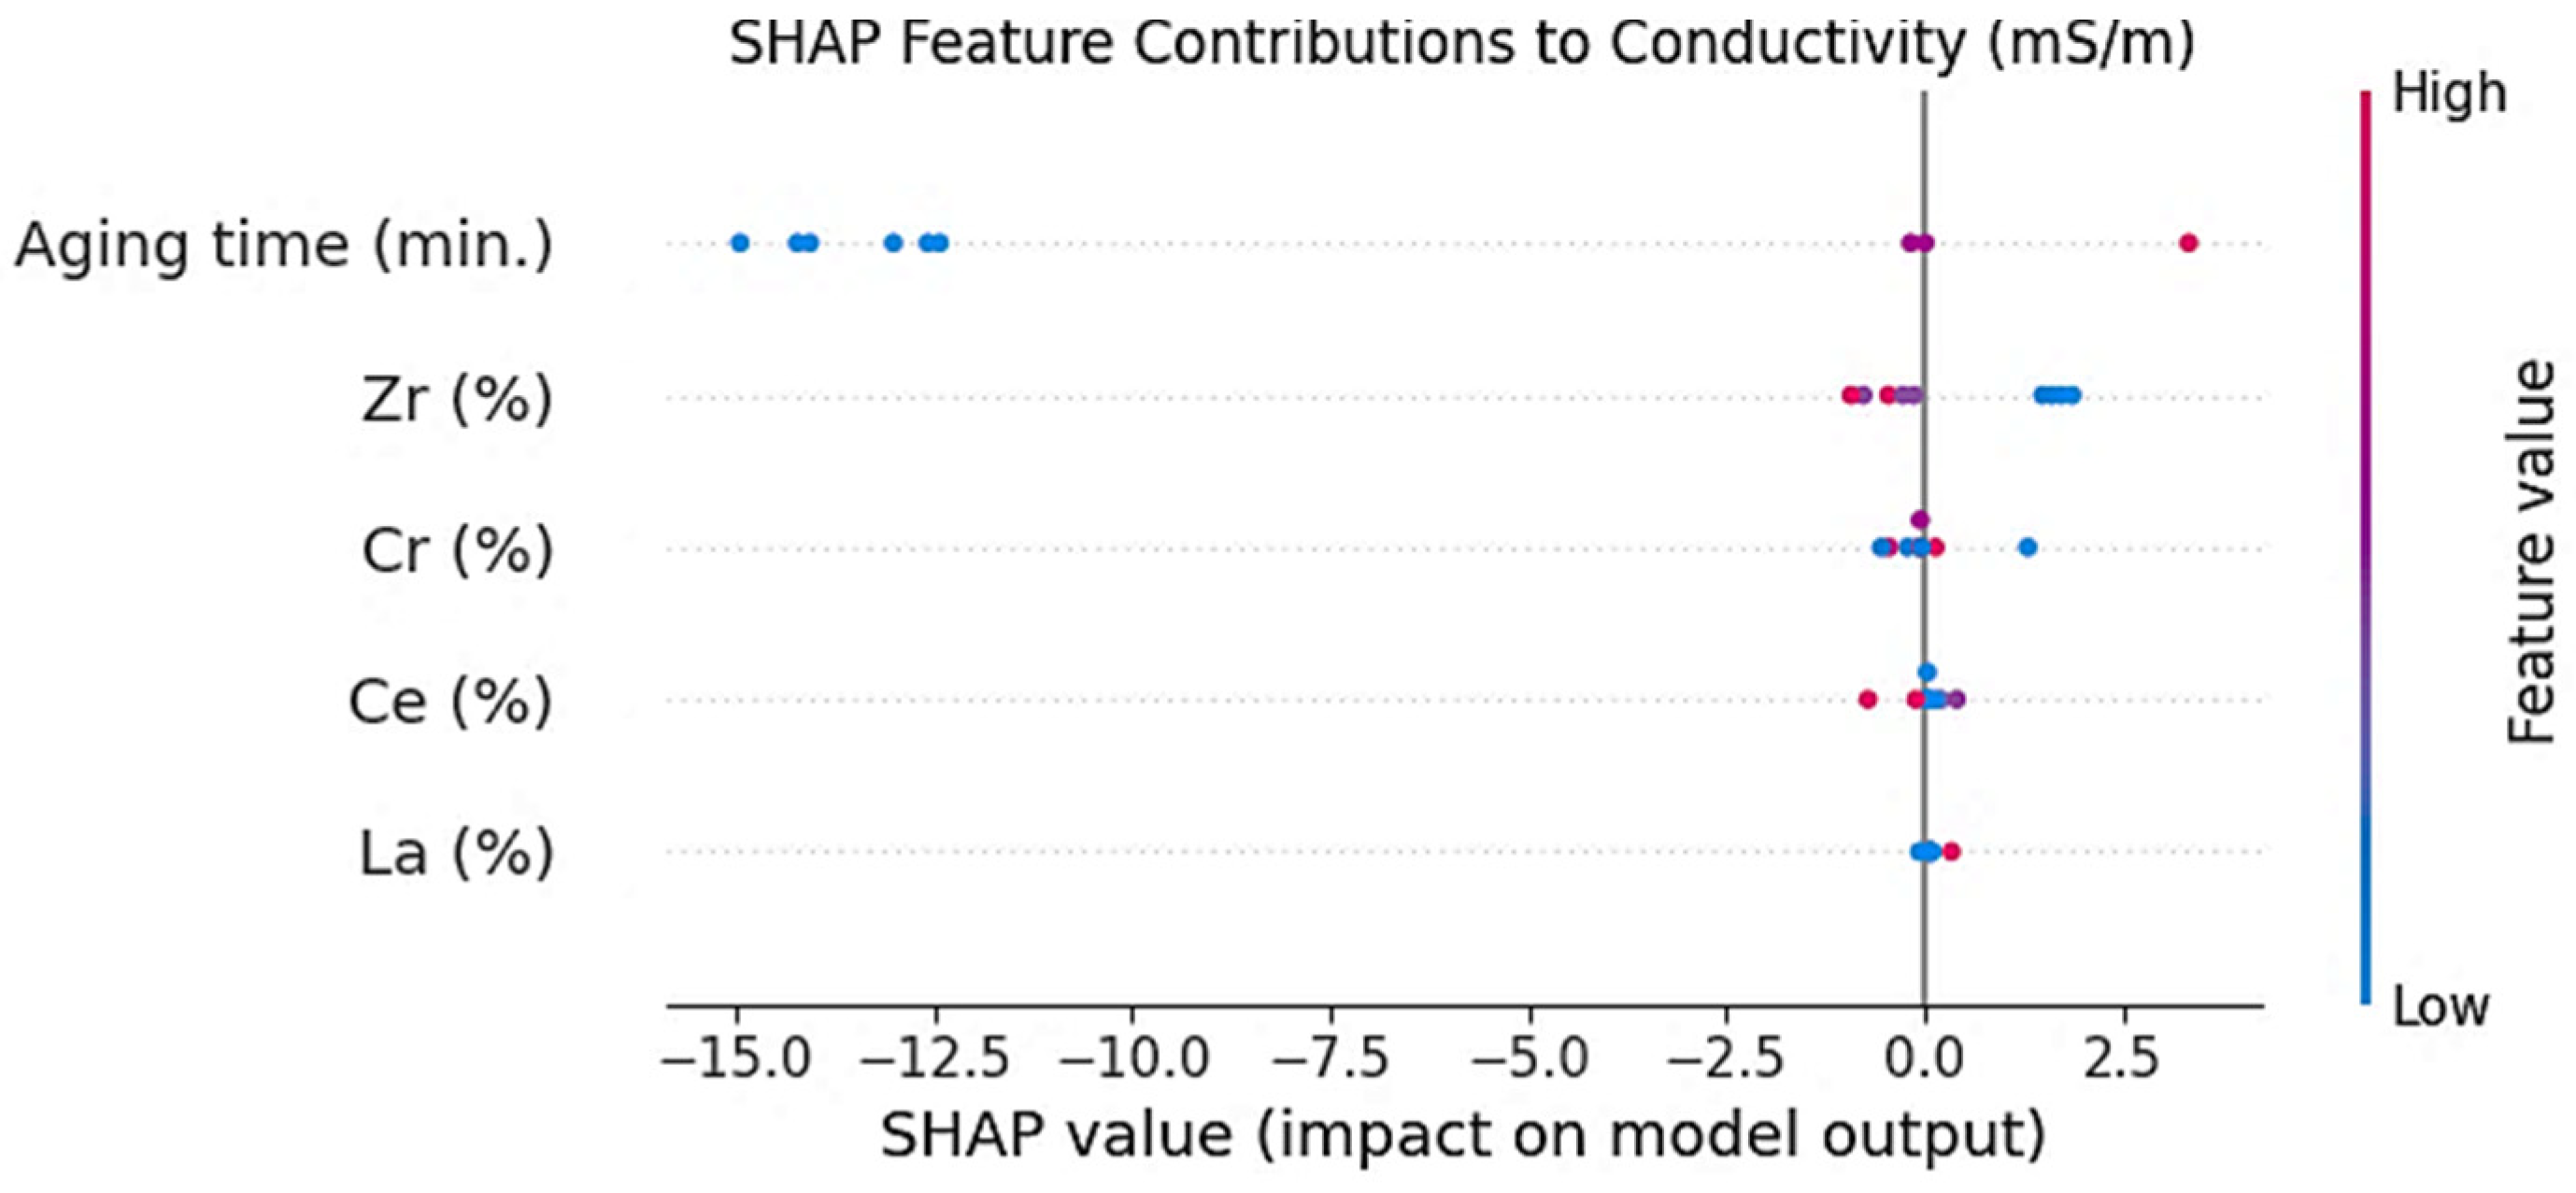
4.3. Electrical Conductivity Predictions

The SHAP analysis for electrical conductivity (Figure 5) reveals that aging time overwhelmingly determines the electrical conductivity, with minimal contributions from Cr, Ce, Zr, and La. The results of the SHAP feature importance analysis confirm the results of the correlation analysis and the metallurgical concepts.
The feature importance results from the ML models (Figure 6) reinforce this observation, showing aging time as the dominant factor, followed by a minimal influence from the alloying elements. This aligns with metallurgical principles, where the electrical conductivity is highly sensitive to the microstructural changes induced by aging treatments.
Table 1 compares the SHAP rankings with the Pearson’s correlation coefficients for both hardness and electrical conductivity to quantitatively assess the agreement between the SHAP-based and traditional correlation analyses in terms of the feature importance. Regarding hardness, both the SHAP and correlation analyses attribute the influence to Zr and aging time first and then place Ce moderately higher. Cr and La contribute less. For electrical conductivity, aging time ranks first for both techniques; the alloying elements present weak negative correlations and low SHAP scores. This accordance between the correlation values and SHAP-based ranks supports the robustness of such feature importance analyses and reinforces the metallurgical validity of these findings.
This study demonstrates the integration of SHAP with machine-learning-based approaches and traditional correlation analyses in order to provide a comprehensive and explainable framework for identifying the key features that affect hardness and electrical conductivity in Cu-Cr-Zr alloys to support data-driven material design and property optimization.
SHAP serves as an excellent means of achieving insights into a model’s interpretability, but nevertheless, its assumptions should be taken into account. SHAP is constricted under additive feature attribution principles and conditional independence, which limit how closely such a method can depict the behavior of a complex non-linear model such as XGBoost or CatBoost with strong interactions or multicollinearity. Thus, SHAP explanations should be used prudently in situations where such assumptions are violated. Nonetheless, the consistency of the current work based on the SHAP importance against the findings of the correlation analysis and metallurgical knowledge reinforces the reliability of the interpretations.

5. Performance Evaluation

The power of the ML and DL models for predicting hardness and electrical conductivity was strictly evaluated and compared using three widely accepted statistical metrics, the R2, RMSE, and MAE, with Equations (4)–(6) [29]. These metrics explain how well the models perform against reference test data in terms of their accuracy and reliability.
R 2 = 1 i = 1 K Z i Z i 2 i = 1 K Z i Z ¯ 2
R M S E = i = 1 K ( Z i Z i ) 2 K
M A E = i = 1 K Z i Z i K
where K = the number of observations; Z = the observed target/reference values; Z′ = the predicted values; and Z ¯ = the mean of the observed target values. That is, the closer R2 nears 1, the closer the observed values are to the values predicted by the model; it proves a better fit overall. In comparison, lower values for the RMSE and the MAE are interpreted as representing lower prediction errors and higher accuracy.
The RMSE is a more comprehensive measure of the magnitude of an error, relating to the squared differences, while the MAE can provide the average absolute error, offering an interpretation that is quite simple. A much greater value for the RMSE when compared to that for the MAE demonstrates that the data contain a couple of predictions that are highly eccentric and throw unique errors. This is because the RMSE squares large errors and therefore exaggerates their effect, while the MAE treats all errors without amplification. So, a good difference shows a high bounce in the error distribution: accurate predictions on one side and inaccurate predictions on the other. Such wide variability indicates many potential difficulties, including outliers and the failure of the model to take the appropriate action under certain data arrangements. By employing these metrics, the comparative performance of the studied models was effectively quantified, ensuring a robust evaluation framework for identifying the optimal approach to predicting hardness and electrical conductivity.

6. Results

6.1. The Initial Predictions of Hardness and Electrical Conductivity Without Feature Engineering and Selection

In the first phase of the current analysis, predictive modeling of the hardness and electrical conductivity using the raw dataset without applying feature engineering or feature selection techniques was conducted. This baseline assessment established a performance benchmark for subsequent refinements. Several ML and DL models were evaluated using standard metrics, including the R2, RMSE, MAE, and training time (seconds).

6.1.1. The Hardness Prediction Performance

The predictive modeling for hardness was conducted using multiple ML and DL models. The results indicated that AdaBoost achieved the best performance, with an R2 of 0.6806, an RMSE of 21.8244, and an MAE of 15.9758. The ensemble learning methods, particularly AdaBoost, ET, and CatBoost, consistently outperformed the traditional regression models such as LR and RR. However, the DL models (CNN, LSTM) exhibited a poor predictive performance, characterized by negative R2 scores and high error values, as shown in Table 2.
In the results shown in Table 2, a noticeable gap between the RMSE and the MAE highlights the influence of significant prediction outliers. The RMSE’s sensitivity to large errors, compared to the more moderate response of the MAE, suggests that certain alloy samples exhibited challenging prediction behaviors, likely due to the complex, non-linear relationships between the input features and hardness. This variability suggests that some models had a limited performance for a subsection of the data. For instance, the CNN and LSTM models have very high RMSE values when compared to the MAEs, indicating pronounced sensitivity to outliers or that they do not generalize well. Significant RMSE-MAE gaps further suggest the need for outlier detection, data preprocessing, and feature engineering to minimize the variability in the error. The tree-based ensembles (e.g., AdaBoost, ET, and CatBoost) learned better from the data than the DL models (e.g., CNNs, LSTM), indicating that structured/tabular datasets work much better for traditional ML algorithms without feature engineering. Overall, these differences are significant since any evaluation of the robustness of a model and areas for improvement in hardness predictions for Cu-Cr-Zr alloys must involve using both metrics in conjunction with R2.

6.1.2. The Electrical Conductivity Prediction Performance

A similar approach was employed for predicting electrical conductivity, with CatBoost emerging as the most effective model, achieving an R2 score of 0.6452, an RMSE of 3.2322, and an MAE of 2.4843. As observed for the hardness predictions, the ensemble models such as XGBoost, GBR, and RF outperformed the LR techniques, while the DL models (CNNs, LSTM, and MLP) exhibited suboptimal results, with negative R2 scores, as seen in Table 3.
As observed in Table 3, the relatively small difference between the RMSE and the MAE indicates a more consistent error distribution across the samples for electrical conductivity. Unlike hardness, extreme deviations were less frequent, suggesting that the underlying relationship between aging time and conductivity is more straightforward and predictable. This evenness, in turn, indicates that difficulties in predicting electrical conductivity arise from general difficulties in modeling the underlying relationships and are not specific aberrations. It is therefore important to pay due attention to feature engineering and careful model selection if good prediction accuracy and robustness in estimating the electrical conductivity of Cu-Cr-Zr alloys are to be realized.

6.1.3. Implications and Next Steps

These initial findings highlight the efficacy of ensemble models over conventional regression and DL models. However, the moderate R2 scores suggested room for improvement. The subsequent analysis incorporated feature engineering and feature selection techniques to enhance their predictive accuracy.

6.2. Predictions with Feature Engineering and Selection

To improve the predictive performance, a feature importance analysis was used for feature selection. The selected features for hardness included AgingTime_Ce (AgingTime*Ce), Cr, Zr, and Aging_time, while those for electrical conductivity were Cr_Zr (Cr*Zr) and Aging_time. These interaction terms were selected from a systematically generated set of pairwise interactions between the alloying elements and aging time, derived from the feature engineering efforts discussed in Section 2.2, based on metallurgical insights and data-driven correlation patterns. The predictive performance of the models was then re-evaluated.

6.2.1. The Hardness Prediction Performance After Feature Engineering

Following feature engineering, XGBoost achieved the highest R2 score (0.7755) and the lowest RMSE (18.2959) and MAE (13.2117). Other top-performing models included the DT and CatBoost, which demonstrated significant improvements over the baseline results (Table 4).
After feature engineering, although the predictive accuracy improved markedly (Table 4), a substantial RMSE–MAE gap persisted. This suggests that while the model captured the general patterns across the dataset effectively, a subset of samples continued to present difficulties, reinforcing the intrinsic complexity associated with predicting the hardness of Cu-Cr-Zr alloys. Despite extensive feature engineering and careful feature selection, certain errors remained, highlighting the challenges involved in achieving uniformly accurate predictions across all cases. These inconsistencies underscore the need for additional preprocessing or the use of more sophisticated modeling strategies to handle edge cases and extreme values more robustly. Although ensemble methods such as XGBoost and decision trees demonstrated a strong overall performance, the persistent differences between the RMSE and the MAE emphasized the importance of addressing outliers to achieve more consistent and reliable forecasts for hardness estimations in Cu-Cr-Zr alloys.

6.2.2. The Electrical Conductivity Prediction Performance After Feature Engineering

For electrical conductivity, CatBoost emerged as the most effective model, achieving an R2 score of 0.7399, with RMSE and MAE values of 2.5616 and 2.0736, respectively. These improvements underscore the role of feature selection in enhancing model performance (Table 5).
Table 5 demonstrates the narrow margin between the RMSE and MAE values, reflecting relatively stable predictive behavior for electrical conductivity. The limited influence of extreme errors suggests that feature engineering further strengthened the models’ ability to capture the primary factors governing conductivity. Such an indication shows that the problems in predicting electrical conductivity arise from more generalized difficulties in modeling the relations than isolated anomalies. This finding then emphasizes the improvement in the predictive accuracy and stability of the estimations of the electrical conductivity of Cu-Cr-Zr alloys with feature engineering and meticulous model selection.
Moreover, the low differences in terms of RMSE-MAE for conductivity relative to those for hardness were due to the relatively simple and more predictable nature of the associations of the target variables with electrical conductivity, as opposed to the complex, multifactor ones for hardness. This difference highlights how target-variable-dependent modeling approaches should be applied.

6.2.3. Key Takeaways

XGBoost performed best for hardness while CatBoost was most effective for electrical conductivity in terms of high accuracy and short training times.
Feature engineering and selection improved the models’ performance, as evidenced by the higher R2 scores and lower error values.
The DL models remained ineffective, reinforcing the need for either larger datasets or specialized preprocessing techniques.

6.3. Hyperparameter Tuning for Performance Optimization

Hyperparameter tuning was performed for the top-performing models, including XGBoost, CatBoost, AdaBoost, and DT. The results revealed significant performance gains, with XGBoost achieving an R2 of 0.8222 for hardness and CatBoost attaining an R2 of 0.8080 for electrical conductivity (Table 6 and Table 7). These improvements emphasize the necessity of hyperparameter optimization in predictive modeling.
At the end of the hyperparameter tuning, the gap between the RMSE and the MAE remained wide for hardness but not for the conductivity predictions. It suggested that the tuning improved the general model fitting but still greatly influenced the hardness evaluations due to the sample-specific complexities and outlier behaviors. On the other hand, the smaller RMSE-MAE distance for the conductivity predictions suggests that conductivity is determined by less complex relationships and has fewer extreme values. In conclusion, hyperparameter optimization improved the predictive accuracy for both properties, but with the nature of the modeling, the challenges for hardness were more pronounced due to its multifactorial dependencies.

6.4. Model Stacking for Enhancement of the Final Predictions

A model stacking approach was implemented by integrating XGBoost, CatBoost, and DT for hardness and CatBoost, AdaBoost, and DT for electrical conductivity. The stacked models achieved the best performance (Table 8).
As presented in Table 8, the stacked models achieved notable improvements; however, the persistence of a larger RMSE-MAE gap in the hardness predictions underscored the continued impact of complex microstructural phenomena that were not fully captured by the available features. In contrast, the conductivity predictions exhibited a tighter RMSE-MAE alignment, affirming the effectiveness of the modeling strategy for this target property.
All of these results emphasize the requirement to model the differences for each target variable since they may not be addressed well by using a generic approach. Through feature engineering and hyperparameter tuning, the models were made far more robust, but still, extreme errors occurred for the hardness predictions, thus indicating that advanced techniques in preprocessing are necessary for edge cases. In addition to this, the associated costs are magnified in terms of the trade-off between increasing the predictive performance with model stacking and the time spent on training. An increase in the training time involves the additional computational cost of installing several base models into a meta-model and compounding their predictions.
A residual analysis was performed to assess the prediction quality for hardness and electrical conductivity using residual plots (Figure 7 and Figure 8). These plots show the difference between the observed and predicted values.
The moderate dispersion in the electrical conductivity residuals (Figure 7) with no evident trend suggests reasonably unbiased predictions across the range of predicted values. A few points, however, are noticeably far from the zero line, indicating isolated instances of prediction errors across conditions that were possibly under-represented in the dataset.
The residual analysis of hardness (Figure 8) shows more variance, with several outliers showing large positive deviations, particularly in the mid- to high value range. This, again, corroborates the earlier observation that hardness is inherently more challenging to model well under the current conditions in the data. This pattern indicates either heteroscedasticity or more complex non-linear behavior that simpler stacking models may fail to capture, reinforcing the need for better preprocessing or transformation methods.
To test the accuracy of the final stacking model, a bootstrap uncertainty analysis was performed using 1000 resampling iterations on the test data. Table 9 presents the mean performance metrics and the 95% confidence intervals for hardness and electrical conductivity.
The hardness prediction results show a wide distribution of confidence interval estimations, especially in the R2 and MAE, which indicates that the prediction output is highly variable. This agrees with earlier observations regarding the difficulties in modeling hardness. In contrast, conductivity apparently exhibits more stability, as the predictions are bound by narrower confidence intervals. These results reinforce the importance of incorporating an uncertainty analysis into performance reporting, especially under small-sample constraints.
These results confirm the successful performance of stacking models in augmenting the predictions of the accuracy and generalization capability and thereby providing a strong framework for material property predictions.

7. Discussion and Future Work

7.1. The Impact of the Proposed Framework on Material Property Predictions

Cu-Cr-Zr alloys with high multifunctionality and low costs are crucial for integrated circuit lead frames. The electromechanical properties of these alloys are significantly influenced by the alloy composition and processing parameters. However, predicting these properties using traditional ML techniques remains challenging due to the limited volume and diversity of the available data.
To address this limitation, this study analyzed an experimental dataset of 47 Cu-Cr-Zr alloy samples using feature-engineering-aided ML, DL, and ensemble learning techniques.
The results of the correlation analysis and the SHAP feature importance analysis reveal strong agreement regarding the feature importance for both hardness and electrical conductivity. Moreover, these results are consistent with metallurgical principles. This demonstrates the strong agreement and reliability of these methods in analyzing the feature importance.
Based on the feature importance analysis, aging time and Zr content have the greatest contributions to hardness, followed by Ce content. The Cr and La contents have a smaller impact on the hardness values. The main factor influencing electrical conductivity is aging time, with the alloying elements having a detrimental effect.
By incorporating the alloy composition and aging time as inputs, the proposed framework successfully predicted hardness and electrical conductivity with high accuracy.
The predictions of these electromechanical properties were made applying and omitting feature engineering and selection in order to address the impact of feature engineering on the accuracy and training times of the different models. Hyperparameter tuning was employed for further performance optimizations. Finally, model stacking was conducted to boost the final accuracy and processing times.
Feature engineering and selection significantly improved the model performance through increasing the accuracy in terms of the R2 value from 0.6806 within a training time of 0.327 s using the AdaBoost ML model to 0.7755 within a training time of 0.204 s using the XGBoost model for the hardness prediction, while increasing the accuracy in terms of the R2 value from 0.6452 within a training time of 0.338 s to 0.7399 within a training time of 0.3 s using the CatBoost model for the electrical conductivity predictions. This highlights the importance of selecting relevant predictors through feature engineering.
With respect to the accuracy and training times, XGBoost followed by the DT excelled in predicting hardness, whereas CatBoost was the most successful for predicting electrical conductivity. The DL models, including the CNNs, LSTMs, and MLPs, were ineffective in the current study; this was likely due to the dataset’s size constraints.
Hyperparameter tuning further enhanced the accuracy and training times of the ensemble models up to an R2 value of 0.8222 within a training time of 0.29 s using the XGBoost model, up to an R2 value of 0.7824 within a training time of 0.317 s using the CatBoost model, and up to an R2 value of 0.7714 within a training time of 0.02 s using the DT model for hardness predictions. For the electrical conductivity predictions, hyperparameter tuning improved the accuracy and training times of the ensemble models up to an R2 value of 0.8080 within a training time of 0.217 s using the CatBoost model, up to an R2 value of 0.7827 within a training time of 0.5 s using the AdaBoost model, and up to an R2 value of 0.6597 within a training time of 0.017 s using the DT model.
The most promising results were achieved by employing stacking models, which outperformed the individual models in predicting electrical conductivity and hardness. The proposed stacked models achieved R2 scores of 0.8762 within a training time of 1.739 s for hardness and 0.8132 within a training time of 1.091 s for electrical conductivity.
It is indeed true that the interpretation of the variations in the RMSE and MAE across the different models and framework levels significantly contributes to our understanding of the error distributions and model behavior, emphasizing the advantages of the proposed methodology. The larger discrepancy in the RMSE-MAE values for the hardness predictions indicates outliers or extreme errors since its presence results from an added, complex interplay of factors such as the alloy composition and processing parameters. They also point out the inherent difficulty in modeling hardness because of its multifactorial dependencies. In the case of electrical conductivity, the small RMSE-MAE gap suggests that the distribution of the errors tends to be more uniform, with rare extreme outliers, which conforms with the simpler and relatively predictable relationship between aging time and conductivity. Within this consideration lies the difference in the properties’ complexities and the ability to address challenges with feature engineering and model stacking. Through systematic modeling improvements (feature selection, hyperparameter tuning, and ensemble learning), the proposed framework significantly reduced the error variance and augmented the predictive power. All of this deepens our understanding of material property relations alongside increasing the reliability of predictions.
The training dataset is small, with 47 samples. This makes the chances of overfitting high, thus posing a risk to the generalization of the trained models. The five-fold cross-validation method was applied to counter the effects of overfitting; however, the small sample size does not robustly support the conclusions statistically. Data augmentation methods, in our view, should be utilized in the next stage of the research to compensate for this shortcoming, including generating synthetic samples using the SMOTE (Synthetic Minority Over-Sampling Technique) or variational autoencoders. Bootstrapping methods could also be developed to achieve more robust estimations of model performance and variance. Expanding the experimental dataset and validating model predictions on unseen samples will be fundamental steps to increase model reliability and industrial applicability.
Finally, this study demonstrates the potential of XAI for material engineering, offering a transparent and interpretable approach to property predictions. The proposed forward models from the composition to the properties not only could accelerate the design of new Cu-based alloys but also could enable efficient screening of promising candidates for high-performance applications.

7.2. Future Research Directions

Some potential future increasingly focused directions for modeling Cu-Cr-Zr alloys and other similar metallurgical systems stem from the findings and limitations identified within this study:
  • Larger and more diverse datasets: A greater quantity and variety of types of data would equate to significantly better robustness, as well as generalization of ML/DL models into edge case behaviors, thereby reducing the prediction uncertainty.
  • Transfer learning: With transfer learning, the learning efficiency and potential of small-data models can be supplemented with prior learned representations through the transfer of knowledge acquired through the application of a larger material science dataset.
  • Generative modeling: Using variational autoencoders (VAEs) and Conditional Generative Adversarial Networks (cGANs), among other methods, the authors could synthetically augment the dataset with realistic but novel alloy compositions and their corresponding property patterns.
  • Physics-informed modeling: Adopting Physics-Informed Neural Networks (PINNs) allows metallurgical laws (e.g., solid solution strengthening, grain boundary effects) to be embedded directly into the learning process, thereby improving both the accuracy and physical consistency.
  • Multi-objective optimization is essential since in reality, any alloy is designed based on multiple conflicting properties. Non-dominated Sorting Genetic Algorithm II (NSGA-II), Bayesian multi-objective optimization, and many such tools could help with reaching comparative solutions suited to each threshold performance across more criteria.
  • Uncertainty-aware learning: Introducing predictive uncertainty via Bayesian models, quantile regression, or Monte Carlo dropout would make the model outputs markedly more trustworthy, especially in experimental or safety-critical scenarios.
  • Real-time and industrial deployments: Extending this framework for integration with real-time systems in manufacturing or quality control pipelines could help bring predictive alloy modeling into practical industrial use.
Such explainability is already present in this work in the form of the SHAP analysis, partial dependence plots, and SHAP force plots, but it remains one of the core elements of future efforts toward transparency, validation, and adoption of ML in material science.

8. Conclusions

The existing research was limited to a small metallurgical dataset comprising only 47 experimental Cu-Cr-Zr alloy samples, thus presenting a challenge for achieving a high prediction accuracy. A novel explainable ML framework was proposed through this research to address this challenge and improve the performance and interpretability of the traditional methods. The proposed framework uses feature-engineering-aided ML, ensemble learning, model stacking, and visual explainability techniques.
The first part of this work presented correlation and SHAP feature importance analyses; the major conclusions and observations made are as follows:
  • Strong agreement was observed between hardness and electrical conductivity in the correlation and SHAP feature importance analyses, with metallurgical concepts bringing strong support for their reliability.
  • According to the feature importance analysis, the elements that contribute the most to hardness are Zr content and aging time, whereas second place goes to the Ce content. By contrast, lower contributions to the hardness values come from the Cr and La components.
  • Aging time has the largest effect on electrical conductivity, whereas the alloying elements have a minor weak negative effect.
The second part of this research explored 18 ML models in conjunction with 3 DL models for predicting the hardness (HRC) and electrical conductivity (mS/m) of Cu-Cr-Zr alloys as a function of the alloy composition (Cr, Zr, Ce, and La) and corresponding processing parameters like the aging time. Such property predictions were made both with and without the intervention of feature engineering. Thereafter, hyperparameter tuning was employed, together with a residual analysis for performance optimization and deeper model diagnostics. Finally, model stacking was performed for further improvements in the final predictions. The following conclusions can be drawn:
  • Feature engineering and selection increased the models’ performance to a very large extent, indicating the need for relevant predictors;
  • In terms of high accuracy and quick training times, XGBoost performed well for hardness, but CatBoost was the most successful for electrical conductivity;
  • Hyperparameter tuning showed further improvements in the accuracy over that of the ensemble models;
  • Model stacking proved to be more efficient than the use of single models for hardness and electrical conductivity predictions;
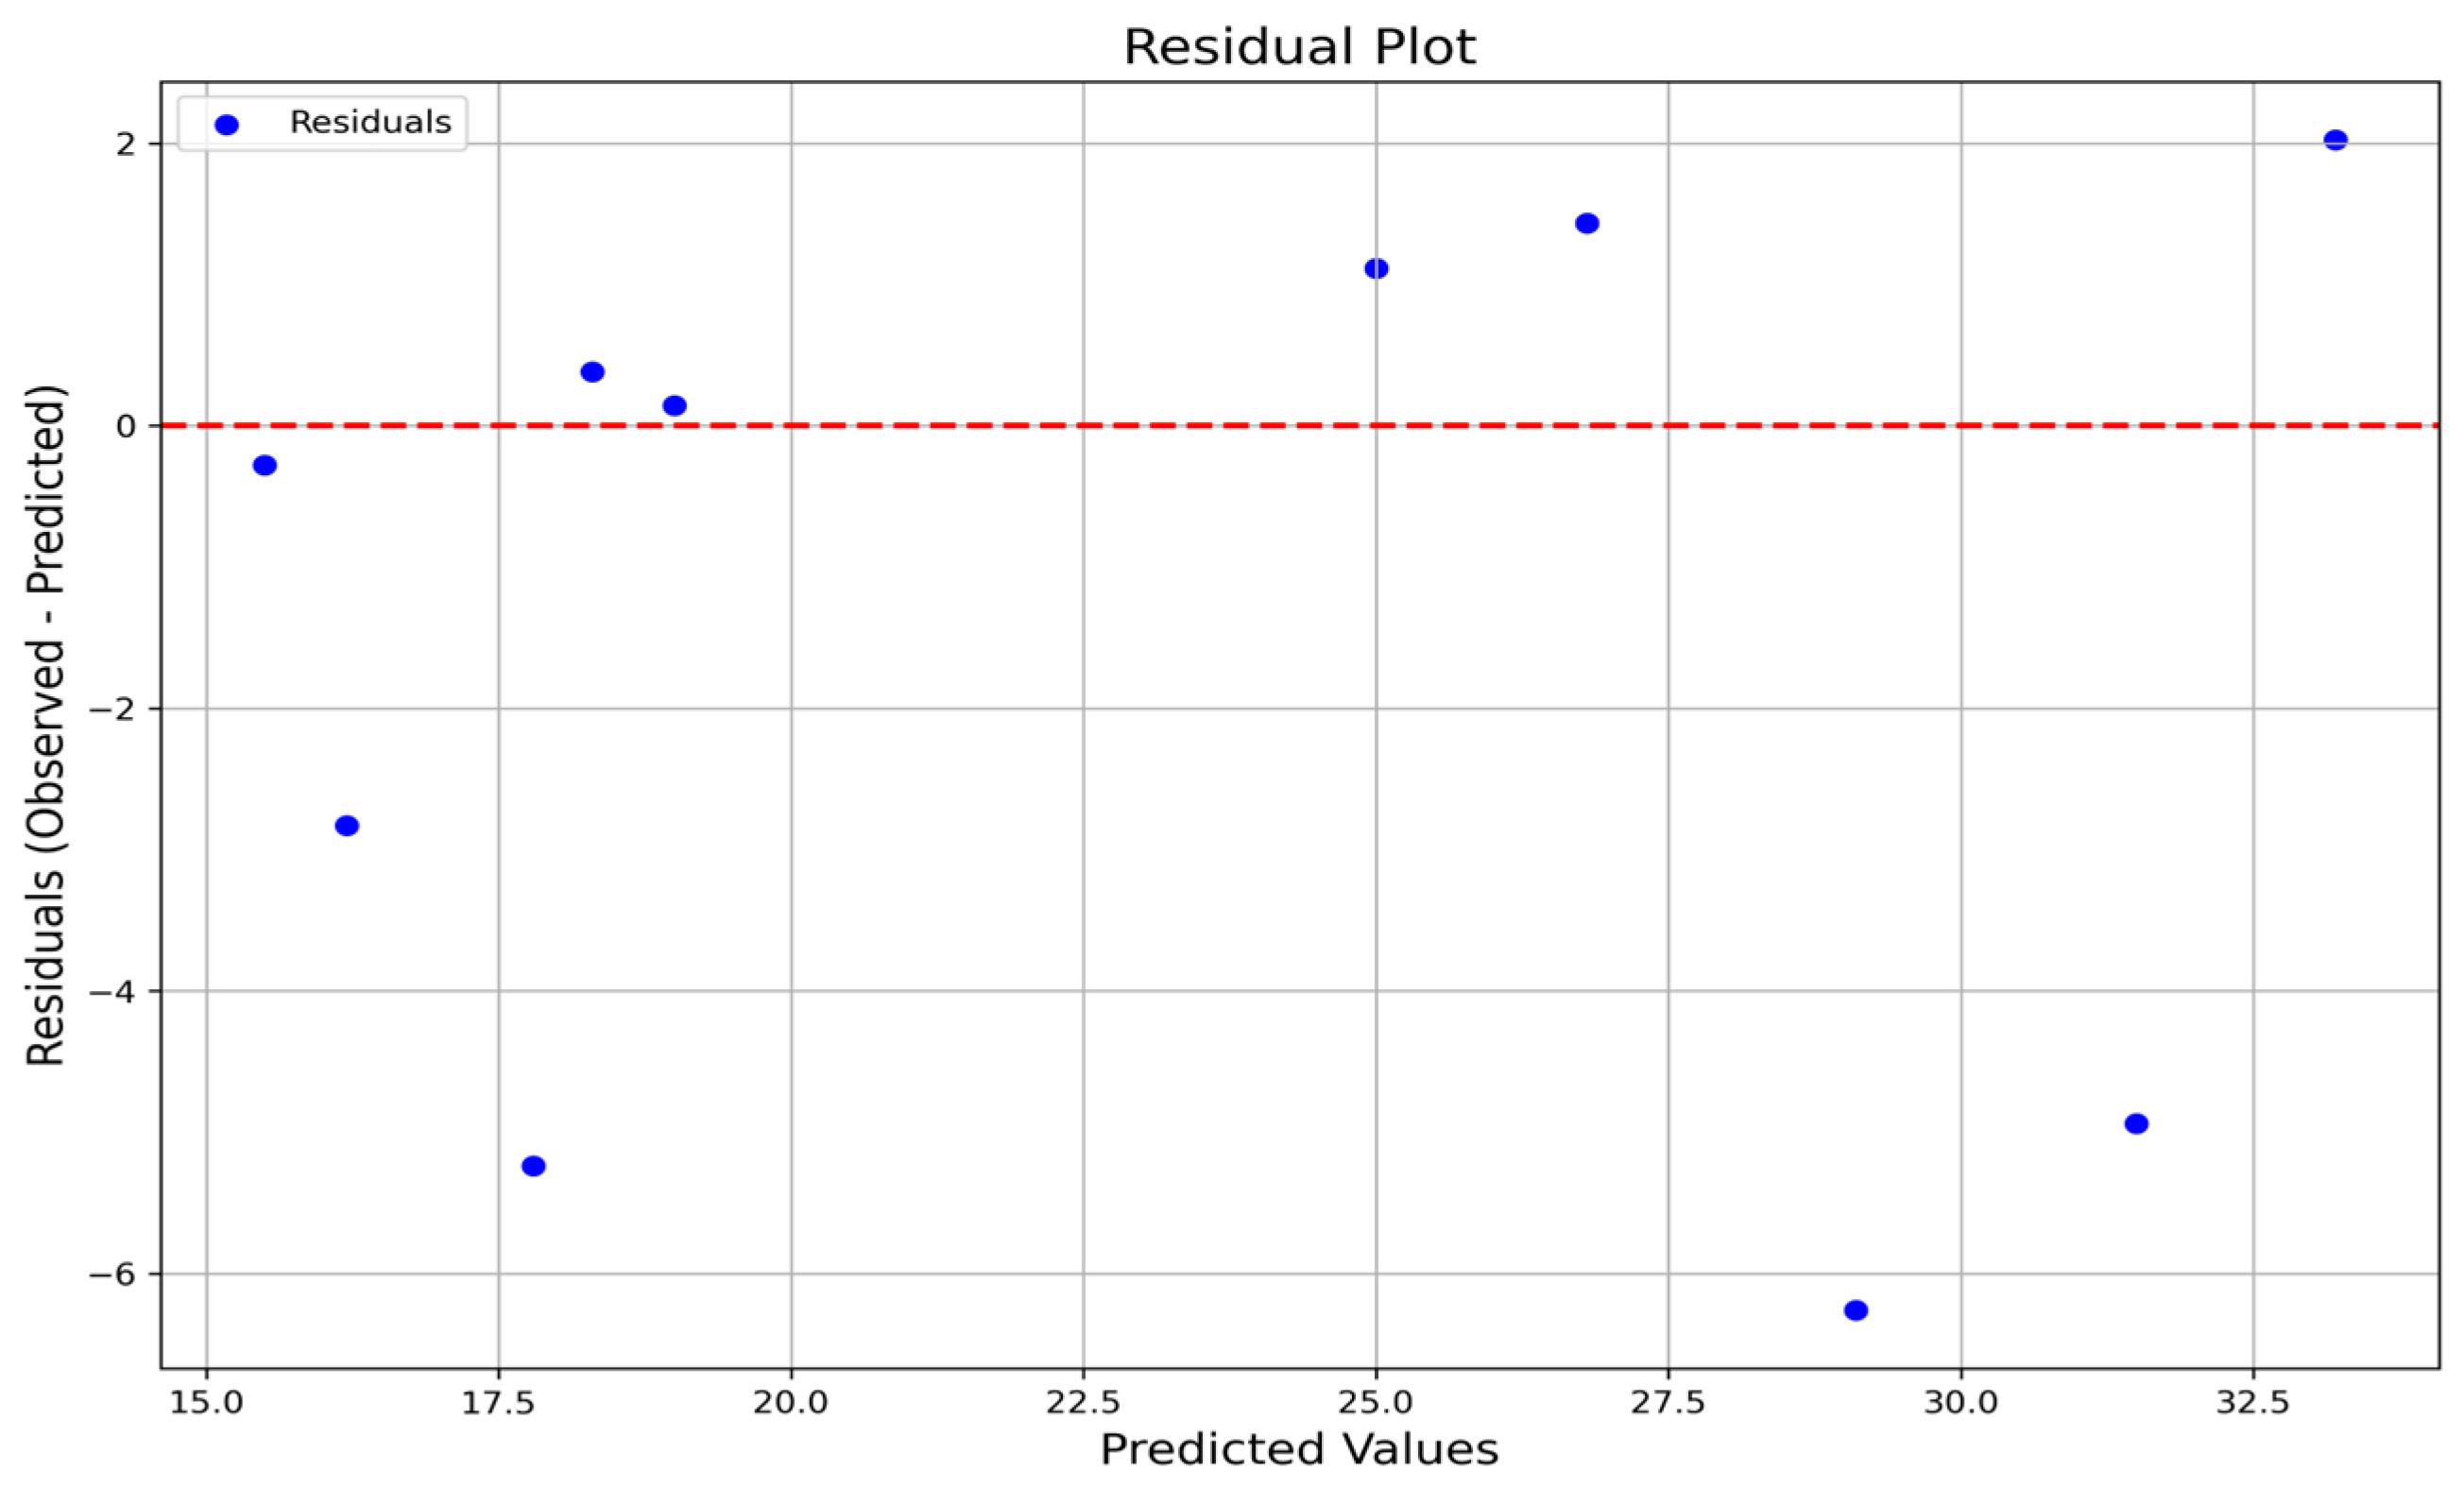
  • The residual analysis confirmed that the current data regime was more complicated and showed more significant deviations and indications of heteroscedasticity for hardness;
  • Model stacking yielded the best results, outperforming the individual models in both hardness and electrical conductivity predictions;
  • The effectiveness of the new stacked models can be seen in R2 scores of 0.8762 for hardness and 0.8132 for electrical conductivity;
  • The DL models could not deliver good results due to the size limitations of the dataset.
Future work will encompass several advanced developments, including using transfer learning to derive insights from broader material datasets; embedding generative models such as VAEs and cGANs as a means to synthetically expand the data; and creating PINNs that will embed metallurgical knowledge into the learning process. The competing targets of hardness and conductivity will be traded against each other through multi-objective optimization using algorithms such as NSGA-II. In addition, uncertainty-aware models will be honed to characterize the capacity for predictive confidence. Such advances will provide insights into a more robust, explainable, and reliable predictive framework within material engineering.

Author Contributions

M.A.A., writing—review and editing; conceptualization; software; visualization; methodology; formal analysis. R.R., writing—review and editing; project administration; conceptualization; methodology. S.A., supervision; resources; funding acquisition. M.I., supervision; resources. All authors have read and agreed to the published version of the manuscript.

Funding

This work was supported and funded by the Deanship of Scientific Research at Imam Mohammad Ibn Saud Islamic University (IMSIU) (grant number IMSIU-DDRSP2503).

Data Availability Statement

The data will be made available upon request.

Conflicts of Interest

The authors declare no conflict of interest.

References

  1. Wang, C.; Fu, H.; Jiang, L.; Xue, D.; Xie, J. A property-oriented design strategy for high performance copper alloys via machine learning. Npj Comput. Mater. 2019, 5, 87. [Google Scholar] [CrossRef]
  2. Ibrahim, M.; Reda, R. Tailoring the Composition of the Functional Cu–Cr–Zr–La/Ce Alloys for Electromechanical Applications. Mater. Sci. Technol. 2023, 39, 209–235. [Google Scholar] [CrossRef]
  3. Ibrahim, M.; Moussa, M.E.; Reda, R. Upgrading the Performance of Functional Cu–Cr–Zr Alloys for Resistance Welding Electrodes. Mater. Sci. Technol. 2022, 38, 484–498. [Google Scholar] [CrossRef]
  4. Zhao, S.; Li, N.; Hai, G.; Zhang, Z. An improved composition design method for high-performance copper alloys based on various machine learning models. AIP Adv. 2023, 13, 025262. [Google Scholar] [CrossRef]
  5. Hu, M.; Tan, Q.; Knibbe, R.; Wang, S.; Li, X.; Wu, T.; Jarin, S.; Zhang, M.-X. Prediction of Mechanical Properties of Wrought Aluminium Alloys Using Feature Engineering Assisted Machine Learning Approach. Met. Mater. Trans. A 2021, 52, 2873–2884. [Google Scholar] [CrossRef]
  6. Zhang, Y.; Dang, S.; Chen, H.; Li, H.; Chen, J.; Fang, X.; Shi, T.; Zhu, X. Advances in machine learning methods in copper alloys: A review. J. Mol. Model. 2024, 30, 398. [Google Scholar] [CrossRef]
  7. Gal, M.S.; Rubinfeld, D.L. Data standardization. N. Y. Univ. Law Rev. 2019, 94, 30. [Google Scholar] [CrossRef]
  8. Friedman, J.H. Greedy function approximation: A gradient boosting machine. Ann. Stat. 2001, 29, 1189–1232. [Google Scholar] [CrossRef]
  9. Breiman, L. Random forests. Mach. Learn. 2001, 45, 5–32. [Google Scholar] [CrossRef]
  10. Udousoro, I.C. Machine Learning: A Review. Semicond. Sci. Inf. Devices 2020, 2, 5–14. [Google Scholar] [CrossRef]
  11. Sarker, I.H. Machine Learning: Algorithms, Real-World Applications and Research Directions. SN Comput. Sci. 2021, 2, 160. [Google Scholar] [CrossRef] [PubMed]
  12. Geurts, P.; Ernst, D.; Wehenkel, L. Extremely randomized trees. Mach. Learn. 2006, 63, 3–42. [Google Scholar] [CrossRef]
  13. Chen, T.; Guestrin, C. XGBoost: A scalable tree boosting system. In Proceedings of the 22nd ACM SIGKDD International Conference on Knowledge Discovery and Data Mining (KDD), San Francisco, CA, USA, 13–17 August 2016; pp. 785–794. [Google Scholar] [CrossRef]
  14. Prokhorenkova, L.; Gusev, G.; Vorobev, A.; Dorogush, A.V.; Gulin, A. CatBoost: Unbiased boosting with categorical features. Adv. Neural Inf. Process. Syst. 2018, 31, 6638–6648. [Google Scholar] [CrossRef]
  15. Bharadiya, J.P. A Review of Bayesian Machine Learning Principles, Methods, and Applications. Int. J. Innov. Res. Sci. Eng. Technol. 2023, 8, 2033–2038. [Google Scholar] [CrossRef]
  16. Zou, H.; Hastie, T. Regularization and variable selection via the elastic net. J. R. Stat. Soc. Stat. Methodol. Ser. B 2005, 67, 301–320. [Google Scholar] [CrossRef]
  17. Feng, Y.; Wu, Q. A statistical learning assessment of Huber regression. J. Approx. Theory 2022, 273, 105660. [Google Scholar] [CrossRef]
  18. Atiea, M.A.; Shaheen, A.M.; Alassaf, A.; Alsaleh, I. Enhanced solar power prediction models with integrating meteorological data toward sustainable energy forecasting. Int. J. Energy Res. 2024, 2024, 8022398. [Google Scholar] [CrossRef]
  19. Śmigiel, S. ECG Classification Using Orthogonal Matching Pursuit and Machine Learning. Sensors 2022, 22, 4960. [Google Scholar] [CrossRef]
  20. Crammer, K.; Dekel, O.; Keshet, J.; Shalev-Shwartz, S.; Singer, Y. Online passive-aggressive algorithms. J. Mach. Learn. Res. 2006, 7, 551–585. [Google Scholar]
  21. Pedregosa, F.; Varoquaux, G.; Gramfort, A.; Michel, V.; Thirion, B.; Grisel, O.; Blondel, M.; Prettenhofer, P.; Weiss, R.; Dubourg, V.; et al. Scikit-learn: Machine learning in Python. J. Mach. Learn. Res. 2011, 12, 2825–2830. [Google Scholar] [CrossRef]
  22. Ke, G.; Meng, Q.; Finley, T.; Wang, T.; Chen, W.; Ma, W.; Ye, Q.; Liu, T. LightGBM: A highly efficient gradient boosting decision tree. Adv. Neural Inf. Process. Syst. 2017, 30, 3146–3154. [Google Scholar]
  23. Atiea, M.A.; Adel, M. Transformer-based Neural Network for Electrocardiogram Classification. Int. J. Adv. Comput. Sci. Appl. 2022, 13, 357–363. [Google Scholar] [CrossRef]
  24. de Andrade, C.H.T.; de Melo, G.C.G.; Vieira, T.F.; de Araújo, Í.B.Q.; Martins, A.d.M.; Torres, I.C.; Brito, D.B.; Santos, A.K.X. How Does Neural Network Model Capacity Affect Photovoltaic Power Prediction? A Study Case. Sensors 2023, 23, 1357. [Google Scholar] [CrossRef]
  25. Chan, K.Y.; Abu-Salih, B.; Qaddoura, R.; Al-Zoubi, A.M.; Palade, V.; Pham, D.-S.; Del Ser, J.; Muhammad, K. Deep neural networks in the cloud: Review, applications, challenges and research directions. Neurocomputing 2023, 545, 126327. [Google Scholar] [CrossRef]
  26. Shekar, B.H.; Dagnew, G. Grid search-based hyperparameter tuning and classification of microarray cancer data. In Proceedings of the 2nd International Conference on Advanced Computational and Communication Paradigms (ICACCP), Gangtok, India, 25–28 February 2019. [Google Scholar] [CrossRef]
  27. Frazier, P.I. A Tutorial on Bayesian Optimization. arXiv 2018, arXiv:1807.02811. [Google Scholar]
  28. Barton, M.; Lennox, B. Model stacking to improve prediction and variable importance robustness for soft sensor development. Digit. Chem. Eng. 2022, 3, 100034. [Google Scholar] [CrossRef]
  29. Shcherbakov, M.V.; Brebels, A.; Shcherbakova, N.L.; Tyukov, A.P.; Janovsky, T.A.; Kamaev, V.A. A survey of forecast error measures. World Appl. Sci. J. 2013, 24, 171–176. [Google Scholar]
Figure 1. Proposed ML and DL framework for material property prediction.
Processes 13 01451 g001
Figure 2. A correlation matrix of the composition, aging time, and electromechanical properties of the Cu-Cr-Zr alloys.
Processes 13 01451 g002
Figure 3. Feature importance analysis for hardness using SHAP.
Processes 13 01451 g003
Figure 4. Feature importance analysis for hardness using ML.
Processes 13 01451 g004
Figure 5. Feature importance analysis for electrical conductivity using SHAP.
Processes 13 01451 g005
Figure 6. Feature importance analysis for electrical conductivity using ML.
Processes 13 01451 g006
Figure 7. The residual plot showing the observed–predicted errors for the electrical conductivity predictions.
Processes 13 01451 g007
Figure 8. A residual plot showing the observed–predicted errors for the hardness predictions.
Processes 13 01451 g008
Table 1. Comparison of SHAP ranking vs. Pearson’s correlation coefficients.
FeatureSHAP
Importance Rank (Hardness)
Pearson’s Correlation
with Hardness
SHAP Importance Rank (Conductivity)Pearson’s
Correlation with Conductivity
Aging Time1+0.401+0.81
Zr (%)2+0.683−0.22
Ce (%)3+0.444−0.16
Cr (%)4+0.322−0.21
La (%)5+0.255−0.17
Table 2. Model performance for hardness predictions without feature engineering.
ModelR2RMSEMAETime (s)
AdaBoost0.680621.824415.97580.327
ET0.647522.925813.88880.438
CatBoost0.643923.043816.02841.331
XGBoost0.642323.096515.97620.208
DT0.609124.144316.17770.007
GBR0.607524.192517.55090.222
RF0.607424.196416.56530.611
BR0.522426.687424.8390.011
EN0.50227.250924.88310.008
Ridge0.490627.560324.87340.008
PAR0.476427.941226.55330.008
HR0.446628.727425.11020.029
LASSO0.427829.210624.53640.008
LR0.42729.230524.58340.01
KNN0.394830.040325.740.01
MLP0.039137.852832.11373.743
Dummy−0.000538.625633.99510.005
LightGBM−0.000538.625633.99510.181
OMP−0.016738.93730.97790.008
CNN−9.4075124.5748118.43721.359
LSTM−9.4705124.9516118.83773.447
Table 3. Model performance for electrical conductivity prediction without feature engineering.
ModelR2RMSEMAETime (s)
CatBoost0.64523.23222.48430.338
AdaBoost0.63034.68673.76560.381
GBR0.62064.74783.82110.244
DT0.61464.78493.9250.007
RF0.60144.86663.18530.611
LASSO0.42315.8545.31560.009
XGBoost0.41455.89153.59580.269
ET0.26943.59032.78230.092
EN0.04875.46444.30680.022
RR0.01575.23864.43150.022
LR0.01175.27664.47681.32
BR0.00955.30464.42640.028
OMP−0.00385.06994.10330.024
PAR−0.04766.1215.06130.02
HR−0.15395.62344.74260.024
MLP−0.48665.52284.72833.644
KNN−0.55677.04265.33220.034
LightGBM−0.59317.71156.33720.36
Dummy−0.59317.71156.33720.022
CNN−10.943126.637325.49121.469
LSTM−11.099626.811325.68064.003
Table 4. Model performance for hardness prediction with feature engineering and selection.
ModelR2RMSEMAETime (s)
XGBoost0.775518.295913.21170.204
DT0.767618.613813.02220.007
CatBoost0.742119.61214.15811.263
AdaBoost0.734719.89114.74870.327
ET0.715820.58712.84660.435
RF0.664322.372215.62680.608
GBR0.6223.803518.49990.213
BR0.54126.162821.23710.011
EN0.529726.480321.33020.008
RR0.510627.014321.44750.008
HR0.474927.982421.52820.027
LASSO0.446428.731221.86880.008
LR0.44428.793221.85150.01
KNN0.440328.888622.83120.009
PAR0.336231.462322.8410.008
OMP0.118436.257125.65820.008
MLP0.005838.502728.70223.912
Dummy−0.000538.625633.99510.005
LightGBM−0.000538.625633.99510.144
CNN−9.4266124.6896118.53041.358
LSTM−9.4755124.9814118.86563.911
Table 5. Model performance for electrical conductivity prediction with feature engineering and selection.
ModelR2RMSEMAETime (s)
CatBoost0.73992.56162.07360.3
DT0.65453.70522.93620.022
AdaBoost0.64943.38312.57180.05
GBR0.63833.49922.75240.05
RF0.60643.50052.690.118
LASSO0.45245.13874.00450.022
XGBoost0.43535.68833.07410.196
MLP0.37656.08624.98533.327
ET0.27373.67072.84670.09
KNN0.18444.38023.38350.028
RR0.06744.96344.09930.02
EN0.06545.40554.13950.02
BR0.06354.97964.1030.024
LAR0.0454.97714.15580.018
OMP−0.00385.06994.10330.026
PAR−0.02585.35784.36110.02
HR−0.03975.32324.23470.024
LightGBM−0.59317.71156.33720.386
Dummy−0.59317.71156.33720.02
CNN−11.017526.720225.59211.4
LSTM−11.117426.83125.70013.513
Table 6. Model performance for hardness predictions after hyperparameter tuning.
ModelR2RMSEMAETime (s)
XGBoost0.822216.282212.28390.29
CatBoost0.782418.014113.74230.317
DT0.771418.863914.83550.02
Table 7. Model performance for electrical conductivity predictions after hyperparameter tuning.
ModelR2RMSEMAETime (s)
CatBoost0.80803.19642.05060.217
AdaBoost0.78273.60622.56550.5
DT0.65973.70522.93620.017
Table 8. Model performance for hardness and electrical conductivity predictions after model stacking.
ModelR2RMSEMAETime (s)
Hardness Stacked Model0.876213.586010.95561.739
Electrical Conductivity Stacked Model0. 81322.97622.03411.091
Table 9. Bootstrapped performance metrics with 95% confidence intervals for stacked models.
MetricMean (Hardness)95% CI (Hardness)Mean (Conductivity)95% CI (Conductivity)
R20.87[0.384, 0.940]0.81[0.467, 0.859]
MAE10.96[6.582, 18.180]2.03[1.500, 2.520]
RMSE13.59[8.427, 20.795]2.98[2.100, 3.420]
Disclaimer/Publisher’s Note: The statements, opinions and data contained in all publications are solely those of the individual author(s) and contributor(s) and not of MDPI and/or the editor(s). MDPI and/or the editor(s) disclaim responsibility for any injury to people or property resulting from any ideas, methods, instructions or products referred to in the content.

