Abstract
Wellbore instability is a major constraint in large-scale shale oil extraction. This study focuses on the shale–sandstone interbedded shale oil reservoirs in the Chang 7 area, delving into the evolutionary principles governing wellbore stability in horizontal drilling operations within these formations. A geological feature analysis of shale–sandstone reservoir characteristics coupled with rigorous mechanical experimentation was undertaken to investigate the micro-mechanisms underpinning wellbore instability. The Mohr–Coulomb failure criterion applicable to sandstone and the multi-weakness planes failure criterion of shale were integrated to analyze the stress distribution of surrounding rocks within horizontal wells, facilitating the computation of collapse pressure and fracture pressure. A finite element model of wellbore stability in shale–sandstone horizontal drilling was established, and then we conducted a comprehensive analysis of the impacts of varying elastic moduli, Poisson’s ratio, and in-situ stress on wellbore stability. The findings reveal that under varying confining pressures, the predominant failure mode observed in most sandstone samples is characterized by inclined shear failure, coupled with a reduced incidence of crack formation. The strength of shale escalates proportionally with increasing confining pressure, resulting in a reduced susceptibility to failure along its inherent weak planes. This transition is characterized by a gradual shift from the prevalent mode of longitudinal splitting towards inclined shear failure. As the elastic modulus of shale rises, the discrepancy between circumferential and radial stresses decreases. In contrast, with the increasing elastic modulus of sandstone, the gap between circumferential and radial stresses widens, potentially inducing potential instabilities in the wellbore. An increase in sandstone’s Poisson’s ratio corresponds to a proportional increase in the difference between circumferential and radial stresses. Under reverse fault stress regimes, wellbore collapse and instability are predisposed to occur. Calculations of collapse pressure and fracture pressure reveal that the safety density window is minimized at the interface between shale and sandstone, rendering it susceptible to wellbore instability. These research findings offer significant insights for the investigation of wellbore stability in interbedded shale–sandstone reservoirs contributing to the academic discourse in this field.
1. Introduction
Wellbore instability in drilling engineering is a global technical challenge and one of the core issues in achieving safe and efficient drilling operations. It has been proved that the entire big shale oil field has geological reserves over 10 × 108 t in the Chang 7 section of the Ordos Basin [1,2]. Therefore, shale oil has become a key field in unconventional oil and gas exploration and development. Maintaining wellbore stability during reservoir exploitation is a focal concern in the field of petroleum engineering. In the development of shale oil in the Chang 7 area, complexity arises from the interlayering of shale and sandstone along the vertical axis of the reservoir accompanied by highly developed weak structural planes between layers. This complexity often leads to challenging downhole conditions such as drilling obstruction and sticking during drilling operations in the Chang 7 area. The enlargement rate of wellbores is notably high, contributing to severe wellbore collapse phenomena. Consequently, these issues result in prolonged drilling cycles and elevated drilling costs.
Compared to other major shale oil basins in China, such as the Songliao and Junggar Basins, the Long 7 section shale oil reservoir in the Ordos Basin has unique geological characteristics and resource potential. The reservoirs in Songliao and Junggar are more homogeneous, while the Long 7 section is more complex, with interbedded shale and sandstone layers. This gives the Long 7 section diverse development potential. The shale oil in Ordos is mainly found in deep geological structures, offering more space for exploitation. Yang et al. [3] noted that while significant progress has been made in Songliao and Junggar, the Ordos Basin stands out for its superior oil and gas quality, especially its oil quality and gas-to-oil ratio. Therefore, the development potential of the Long 7 section in Ordos is unmatched by other basins in terms of extraction efficiency and cost reduction.
In response to the challenge of wellbore instability, scholars both domestically and abroad have conducted extensive research yielding significant results. Cheng et al. [4] and Wang et al. [5] developed a multi-field coupling model for fluid–solid transition of shale which is used for stress analysis under various field couplings. A model to quantify the influence of chemical effects on rock strength was established. Niandou et al. [6] and Masri et al. [7] conducted laboratory mechanical experiments on shale with different bedding angles. They not only investigated the conventional triaxial compression mechanical experimental characteristics of shale but also carried out cyclic loading, unloading tests, and temperature variations. Dewhurst et al. [8] and Kuila et al. [9] delved into the anisotropic characteristics of shale. The former focused on physical, geomechanical, and mechanical properties of shale, while Kuila investigated acoustic wave velocity reactions under different in-situ stress levels. Chen et al. [10], Li et al. [11], and Chen et al. [12] applied anisotropic strength criteria to address wellbore instability issues, comprehensively considering the influence of factors such as drilling orientation, weak plane inclination, and drilling fluid type on wellbore collapse pressure of shale formation. Wen et al. [13], Jin et al. [14], Ding et al. [15], and Yu et al. [16] tested the indoor rock mechanical parameters of shale, as well as the results of shale hydration analysis and shale failure criteria. They studied the mechanism of wellbore instability in hard and brittle mud shale under the action of mechanical–chemical coupling and proposed calculation methods for wellbore collapse pressure at different drilling times. Liu et al. [17] and Ma et al. [18] integrated poroelastic mechanics and weak plane strength theories, and they comprehensively considered the influence of bedding plane occurrence, well trajectory, hydration damage, and slight weakening of bedding planes on shale strength. A stability analysis model for shale formation wellbore was established. Lee et al. [19] and Ding et al. [20] considered in-situ stress and formation weak planes impact on wellbore stability. Through coordinate transformation relationships, they translated weak plane stresses and applied them to rock strength failure criteria, establishing a mathematical analysis model for the stability of the surrounding rock around the wellbore.
Al-Bazali et al. [21] and Qiu et al. [22] based their work on the fluid–solid transition multi-field coupling theory. The former focused on stratified sand shale formations modifying the single weak plane theory to establish a wellbore stress distribution model. The latter considered the strength degradation caused by rock water absorption and diffusion, developed a multiphysical field coupling finite element model for the stability of underbalanced horizontal wellbore in argillaceous siltstone reservoirs, and validated it through verification studies. Zhang et al. [23] investigated the wellbore instability mechanism in tight sandstone formations during gas drilling based on the principle of energy dissipation through triaxial compression tests. Wang et al. [24] analyzed horizontal well stability in unconsolidated sandstone formations using the finite element method which considered the impact of mud cake. Darvishpour et al. [25] established a finite element volumetric model of the wellbore using FLAC3D 7.0 software for Asmari sandstone and simulated the formation of wellbore plastic deformation zones. They determined the safe mud weight limits for sandstone. Cao et al. [26] studied the creep properties of sandstone formations in the oilfield due to the phenomenon of diameter reduction caused by creep. By conducting indoor creep experiments using sandstone cores, they determined the creep rate of sandstone under different in-situ stresses and fitted the experimental results using the Nishihara model. They also calculated the safe drilling period for the sandstone diameter reduction section. Zhao et al. [27] conducted stress sensitivity experiments on unconsolidated sandstone reservoir rocks and obtained a relationship model between physical property parameters and effective stress. They analyzed formation response characteristics during drilling, comparing instability conditions considering stress sensitivity. Tan et al. [28] studied the unconsolidated sandstone reservoir in a certain oilfield in the Bohai Sea, establishing calculation models for collapse pressure and fracture pressure in depleted reservoirs. By calculating the collapse pressure and fracture pressure of directional wells before and after pressure depletion, they provided insights for drilling design adjustments. Wang et al. [29] treated the unconsolidated sandstone reservoir as a porous medium and considered the effects of various factors such as temperature changes and wellbore seepage. They studied the impact of these factors on the drilling fluid safe window.
However, despite the substantial focus on reservoir stability in diverse formations, scholarly inquiry into shale–sandstone interbedded reservoirs has been relatively scant. This paper studies the triaxial compression failure characteristics of shale–sandstone interbedded shale oil formations in the Chang 7 area. Sandstone and shale were subjected to different failure criteria, and the stress state of the surrounding rock of the wellbore was analyzed. Based on experimental results, an appropriate numerical model was established, and the effects of multiple factors on wellbore stability were investigated. The mechanisms and patterns of wellbore instability in shale–sandstone interbedded shale oil reservoirs are revealed, providing valuable guidance for the drilling design of such reservoirs.
2. Characteristics Analysis of Shale Oil Reservoirs in the Changqing Area
Shale oil is an emerging and important type of unconventional energy that has become the focus of global unconventional oil and gas resources exploration and development. Compared to the marine shale oil developments in the United States, China’s terrestrial shale oil reserves are abundant and promising, and they are mainly distributed in terrestrial basins such as the Junggar, Ordos, Songliao, and Bohai Bay basins [30]. According to the estimation by the Ministry of Natural Resources, China’s shale oil geological resource potential is 3.9746 × 10¹⁰ t, with recoverable resources of 3.498 × 10⁹ t, making it a key area for future oil and gas exploration [31]. The Changqing Oilfield’s Mesozoic Yanchang Formation, specifically the Chang 7 area, has developed a widely distributed mud shale-fine-grained sandstone deposit. It serves as the main hydrocarbon source rock for Mesozoic reservoirs and is also an important area for shale oil exploration and development. According to lithology combination, source, and reservoir configuration, the Chang 7 shale oil mainly develops into three types: interlayered, lamellar, and muddy-lamellar. The object of this study is shale–sandstone–shale, with the sandstone being of the lamellar type. As indicated in Table 1, the Chang 7 shale oil development area in the Ordos Basin is primarily targeted at mud shale interbedded with multi-period thin-bedded siltstone, with a sand ratio more than 20% and individual sand body thickness generally less than 10 m. Lamellar shale oil reservoirs develop millimeter-to-centimeter-scale siltstone and mud shale complexes with lamellar structures, which are the main development targets after 2030. The sand ratio is 5–20%, and the thickness of individual sand bodies is 2–4 m. For the muddy-lamellar shale oil reservoirs, the deep lake black shale is dominant, with medium to high maturity being the important area for current risk exploration, and medium to low maturity being the main target for in-situ conversion. The sand-to-strata ratio is generally less than 5%, and the thickness of individual sand bodies is less than 2 m. The interbedded shale oil in Qingcheng is deposited by multi-period gravity flows, with the lake basin margin in Northern Shaanxi being delta front deposits. Compared to other layers in the Changqing Oilfield, the Chang 7 reservoir has strong heterogeneity, dense lithology, poor physical properties, and similar pressure coefficients. However, it has advantages such as high oil saturation and good crude oil properties, demonstrating the Changqing Oilfield’s Ordos Basin Chang 7 area shale oil’s good exploration potential. The parameters listed in Table 1 were obtained from field data collected directly from the study area.

Table 1.
Classification of Chang 7 Shale Oil in the Ordos Basin.
3. Methodological Approach: Triaxial Stress Testing and Rock Failure Criteria
3.1. Triaxial Stress Test of Reservoir Rocks
Mechanical testing serves as a foundational step in determining rock mechanical parameters, which are essential for investigating the stability of shale–sandstone horizontal wellbores. Understanding the basic mechanical properties of reservoir rocks is imperative for establishing an appropriate mechanical model. In an oilfield site, every point within the formation experiences a triaxial compressive stress state. The drilling process involves the replacement of rock with drilling fluid, disrupting the equilibrium and inducing stress redistribution around the wellbore. This phenomenon results in stress concentration in the vicinity of the wellbore, rendering it susceptible to instability during drilling operations. Therefore, obtaining rock mechanical parameters under triaxial stress is crucial for the comprehensive study of wellbore stability.
The equipment apparatus utilized in this study is the GCTS-3000 rock mechanics testing system (The GCTS-3000 is manufactured by GCTS Testing Systems (sourced from Tempe, AZ, USA), a company specializing in geotechnical and rock mechanics testing equipment), depicted in Figure 1. Shale and sandstone specimens were subjected to testing under varying confining pressures of 0 MPa, 15 MPa, and 30 MPa, with three repetitions per group to reduce experimental errors. The testing machine features independent closed-loop servo control systems for axial pressure, confining pressure, pore water pressure, and temperature. It allows for the direct measurement of parameters such as failure strength, elastic modulus, and Poisson’s ratio in a single test. The mainframe of the apparatus adopts a portal frame structure, featuring an axial pressure capacity of 3000 KN, confining pressure capacity of 200 MPa, pore water pressure capacity of 200 MPa, maximum temperature of 200 °C, and specimen diameter range spanning from 25 mm to 100 mm. The minimum sampling time interval is set at 20 ms. The testing system enables a wide variety of tests including uniaxial compression, triaxial compression, indirect tension, fatigue, creep, and relaxation, and it can simulate the stress, pore pressure, and temperature conditions of deep underground rock masses. Moreover, it also has the capability to test ultra-low rock permeability under high-temperature and high-pressure conditions. During experimentation, displacement sensors are employed to measure the axial and circumferential deformation of the specimen, with circumferential deformation measured using a circumferential point-type extensometer. The loading protocol is controlled by axial displacement, initially preloading the specimen at a rate of 5 mm/min. Upon reaching a loading force of 1 KN, the displacement loading rate is reset to 0.1 mm/min.
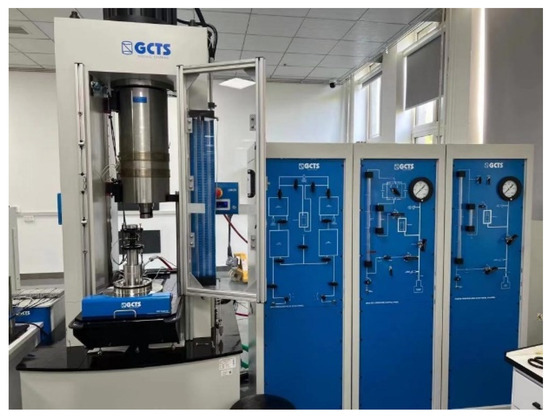
Figure 1.
GCTS Rock Mechanics Testing System.
Figure 2 illustrates the failure modes observed in shale and sandstone samples under varying confining pressure conditions. Comparative analysis reveals that sandstone samples predominantly exhibit inclined shear failure with limited macro cracks and a predominantly singular crack morphology across different confining pressures. In contrast, shale samples exhibit more complex failure modes. At 0 MPa, shale predominantly experiences longitudinal splitting, characterized by the presence of interconnected and extended macro cracks alongside localized shear cracks which lead to a heightened prevalence of intricate crack morphologies. As the confining pressure increases, the increase in resistance to longitudinal crack propagation results in a gradual transition of shale failure mode from longitudinal to inclined shear failure that reflects an escalation in rock plasticity. When the confining pressure reaches 30 MPa, there are still local shear microcracks around the macro cracks, although shale mainly fails in an inclined shear manner. Overall, shale exhibits stronger characteristics of brittle failure across different confining pressure conditions.
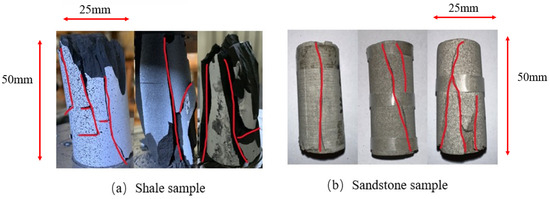
Figure 2.
Rock failure modes under triaxial stress.
The compressive strength, elastic modulus, and Poisson’s ratio of shale and sandstone under triaxial stress conditions are presented in Table 2. Experimental findings reveal that as the confining pressure increases from 0 MPa to 30 MPa, the average compressive strength of the sandstone samples increases from 96.52 MPa to 271.3 MPa, while the compressive strength of the shale samples increases from 25.12 MPa to 99.11 MPa. Notably, sandstone consistently demonstrates significantly higher compressive strength compared to shale across varying confining pressures. Regarding elastic parameters, s, the shale exhibits a higher elastic modulus and a lower Poisson’s ratio under different confining pressure, indicating that the shale samples have a greater capacity for brittle failure compared to the sandstone samples.
Table 2.
Rock triaxial compressive strength test data.
3.2. Rock Strength Failure Criteria
The establishment and selection of rock failure criteria serve the primary purpose of elucidating the rock failure process and uncovering the underlying mechanisms. In the selection of different criteria, due consideration must be given to the specific conditions of the rock formation under investigation, aiming to explore their applicability and thereby ensure the objectivity and accuracy of the strength criteria. In this study, two criteria have been employed: the Mohr–Coulomb (M–C) criterion and the multi-weak-plane strength criterion for shale formations. These are used to conduct research and achieve the optimization of the failure criteria for shale–sandstone interbedded reservoirs.
3.2.1. M–C Criterion
According to the analysis of sandstone failure modes in Section 2, sandstone is mainly controlled by shear failure. Therefore, in the analysis of sandstone wellbore stability, the Mohr–Coulomb strength failure criterion is mainly used for research. Qiu et al. [22] and Xie [32] both used the Mohr–Coulomb criterion to describe the strength and failure characteristics of sandstone.
According to the Mohr–Coulomb strength theory, the shear stress on the shear plane needs to overcome the rock’s inherent shear strength value when rock fails. This is called cohesion stress. This relationship can be expressed by the following equation:
Equation (1) is known as the Mohr–Coulomb strength criterion and can be determined by triaxial compressive strength experiments with two or more different perimeter pressures; it can also be represented by a straight line on and coordinate graph. Therefore, Equation (1) can be rewritten as Equation (2) below by using the principal stresses and :
Format:
Among others:
Or:
where, is the internal friction coefficient of the rock, ; is the shear stress, MPa; is the maximum principal stress, MPa; is the minimum principal stress, MPa; is the uniaxial compressive strength, MPa; is the angle between the shear plane and the maximum principal stress , (°); is the cohesive force, MPa; and is the angle of internal friction, (°).
As shown in Figure 3, the stress circle plotted from the data related to sandstone in the triaxial compression experiments is tangent to the envelope. It indicates that the sandstone conforms to the Mohr–Coulomb (M–C) criterion.
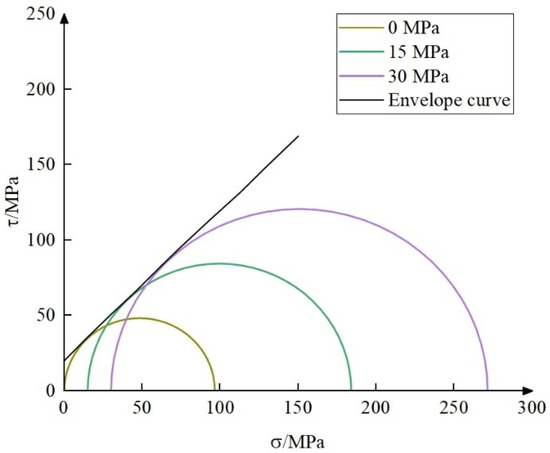
Figure 3.
Sandstone Mohr stress circles.
3.2.2. Strength Criterion for Multiple Weak Surfaces in Shale Formation
The formations exhibit strong heterogeneity due to the development of weak planes and bedding planes in shale formations. Consequently, traditional prediction models that only consider homogeneous strata or a single weak plane are unable to accurately calculate an appropriate drilling fluid safety density window. The weak plane model proposed by Jager is only suitable for shales with a single weak plane. To correct the weak plane model, we select any weak plane for analysis. The normal stress and shear stress on this structural plane is, respectively, as follows:
where, is the maximum principal stress, MPa; is the minimum principal stress, MPa; and is the angle between the structural plane normal and the direction of the maximum principal stress, (°).
Weak plane strength theory Mohr–Columb criterion are
In Equation (7), is the cohesive force, MPa; and is the angle of internal friction, (°).
By combining Equations (6) and (7), the strength criterion for the weak plane of the rock can be deduced as follows:
Based on the Mohr–Coulomb criterion, whether the rock fails along the matrix or the weak plane is determined by . The extreme upper and lower bounds of are shown in Equation (9). The condition for rock failure along the weak plane is: , and when is substituted into Equation (8), the relationship holds true. If is not within the angle range specified by Equation (9) and does not satisfy Equation (9), then the rock fails along the matrix. In this case, the conventional Mohr–Coulomb criterion of Formula (10) is used for calculation.
In Equation (10), is the cohesive force of the rock body, MPa; is the internal friction angle of rock body, (°); and is the angle between the normal to the failure plane and the maximum principal stress, (°).
As shown in Figure 4, the stress circle drawn from the shale-related data in the triaxial compression experiments is tangent to the envelope, which can be seen to be in line with the shale multi-weak surface strength criterion.
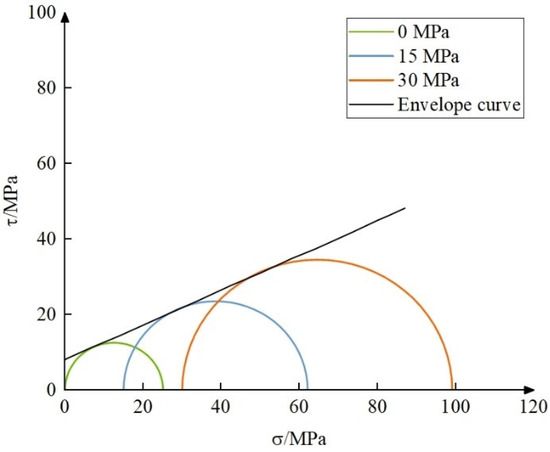
Figure 4.
Shale Mohr stress circles.
4. Analysis of Stress State in the Wellbore Surrounding Rock
During the drilling operations, the forces exerted around the wellbore undergo significant changes. These alterations in the stress state hold paramount significance, as pronounced stress variations can precipitate wellbore instability. In the derivation of the forces surrounding the well, the following foundational assumptions are posited:
- (1)
- The formation is transversely isotropic and behaves as a linear elastic medium;
- (2)
- The plane strain condition is satisfied, which is used to calculate the stress distribution around the borehole;
- (3)
- The medium is uniform and continuous.
On an infinite plane, a circular hole is subjected to uniform internal pressure, and at the same time, at infinity on this plane, there are two horizontal stresses acting, and there is overburden pressure in the vertical direction. The stress state of the wellbore rock can be represented by radial stress , circumferential stress , vertical stress , and shear stress .
The stress distribution of the surrounding rock in a vertical wellbore can be expressed as follows:
On the wellbore wall, if , then Equation (11) can be simplified to
where is radial stress, MPa; is circumferential stress, MPa; is vertical stress, MPa; is shear stress, MPa; is drilling fluid column pressure, MPa; is maximum horizontal crustal stress, MPa; is minimum horizontal crustal stress, MPa; is overburden formation stress, MPa; is wellbore radius, m; is maximum wellbore radius, m. is Poisson’s ratio; is effective stress coefficient; and is pore pressure, MPa.
The rock in the formation is in a state of stress equilibrium in its original state. When the formation is drilled to create a borehole, the drilling fluid pressure replaces the support provided by the drilled rock layers, breaking the equilibrium and causing the stress around the well to be redistributed. If the bottomhole pressure is insufficient to support the surrounding rock of the wellbore, it can lead to the collapse and fall of the wellbore wall. Wellbore wall failure refers to the phenomenon where the surrounding rock of the wellbore is unable to withstand the bottomhole pressure, resulting in the fracturing of the wellbore wall. Accurate calculation of the formation collapse pressure and fracture pressure and a clear understanding of the safe drilling fluid density window can effectively predict the occurrence of wellbore collapse and fracturing.
The formation collapse pressure is
The formation fracture pressure is
where is for the shale collapse pressure, MPa; is for the sandstone collapse pressure, MPa; is for the shale maximum crustal stress, MPa; is for the shale minimum crustal stress, MPa; is for the sandstone maximum crustal stress, MPa; is for the sandstone minimum crustal stress, MPa; is for the shale cohesion, MPa; is for the sandstone cohesion, MPa; is for the effective stress coefficient; is for the pore pressure, MPa; is for the shale fracture pressure, MPa; is for the sandstone fracture pressure, MPa; is for the tensile strength of the shale, MPa; and is for the sandstone tensile strength, MPa.
5. Discussion on Wellbore Stability in Shale–Sandstone Interbedded Reservoirs
5.1. Numerical Model of Shale–Sandstone Interlayer Reservoirs
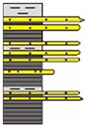
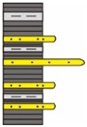
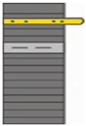
As shown in Figure 5, the overall dimensions of the shale–sandstone interbedded wellbore model are 10 m × 10 m × 10 m. The sample consists of a three-layer structure, including two layers of shale and one layer of sandstone, with a shale thickness of 4 m and a sandstone thickness of 2 m. A wellbore device is preset in the middle of the sample, which is 10 m in length and 1.2 m in diameter. The triaxial compression test system can apply horizontal maximum principal stress (), horizontal minimum principal stress (), and vertical stress () to the experimental model in the x, y, and z directions, respectively, to simulate the wellbore stability issues in horizontal wells within shale–sandstone interbedded formations. To analyze the laws of wellbore collapse instability, the basic parameters of the shale–sandstone interbedded strata, as shown in Table 3, are used to study the stress distribution around the shale interbedded reservoir wellbore. In this study, different values for Poisson’s ratio and Young’s modulus were assigned to the shale and sandstone layers based on their specific mechanical properties. Specifically, Poisson’s ratio and Young’s modulus values for each layer were selected based on published experimental data for similar rock types in the region. These values were carefully chosen to reflect the different elastic properties of the shale and sandstone layers. Shale typically exhibits a lower modulus and a higher Poisson’s ratio compared to sandstone, which was taken into account in the simulation. This approach ensured that the heterogeneity of the reservoir was properly represented.
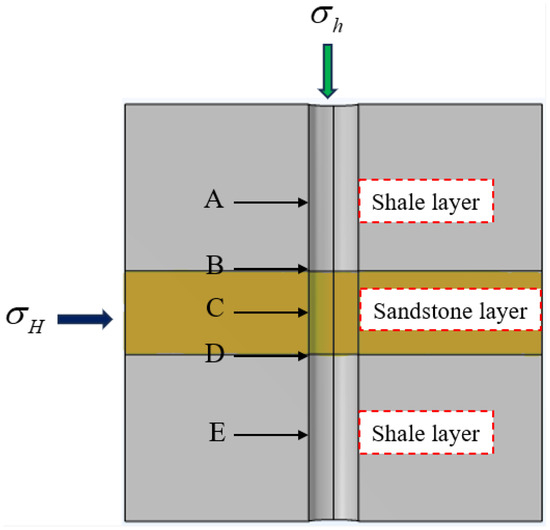
Figure 5.
Geometric structure of shale–sandstone interbedded wellbore model.
Table 3.
Basic data of shale–sandstone strata.
Different strength failure criteria are used for different rock reservoirs, and the effect of varying elastic moduli, Poisson’s ratios, and in-situ stresses on wellbore stability are discussed below.
5.2. The Influence of Different Elastic Moduli of Shale–Sandstone on Wellbore Stability
This section investigates the influence of different shale elastic moduli on wellbore stability in shale–sandstone interbedded reservoirs within the Chang 7 area, while holding the sandstone elastic modulus constant. Similarly, it examines the impact of varying sandstone elastic moduli on wellbore stability while maintaining the shale elastic modulus constant. Specifically, reference points A, B, C, D, and E correspond to the midpoint of the upper shale, the interface between the upper shale and the tsandstone, the midpoint of the sandstone, the interface between the sandstone and the lower shale, and the midpoint of the lower shale, respectively. Based on a finite element numerical model, this section simulates the radial stress distribution of the wellbore under different shale elastic moduli. Analyzing the patterns in Figure 6 reveals that the radial stress in shale and sandstone is closely related to the size of the elastic modulus. As the shale elastic modulus increases, the radial stress in shale (at points A and E) also increases. Taking point A as an example, the radial stress in shale increases from 186 MPa to 193 MPa. It can be inferred that changes in the shale elastic modulus cause a redistribution of the stress around the wellbore, thereby affecting the stability of the wellbore. From Figure 6, it can be observed that the maximum stress on the wellbore occurs near the horizontal direction of the wellbore, which is the direction of the minimum principal stress. Wellbore instability typically starts at the wellbore wall. When the difference between the circumferential stress () and the radial stress () on the wellbore wall is too large, that is, the greater the difference between and , the Mohr–Coulomb criterion judges that the rock at this point will be destroyed, and the wellbore wall is prone to instability.
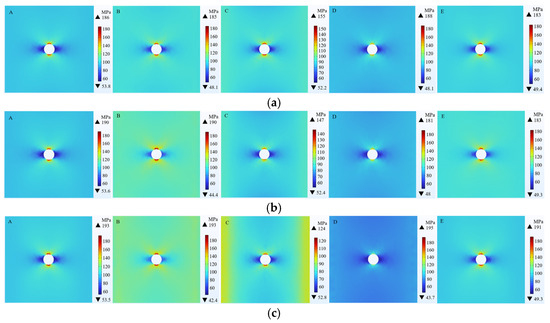
Figure 6.
Radial stress distribution with different shale elastic modulus. (a) Shale elastic modulus is 25 GPa, sandstone elastic modulus is 18 GPa; (b) Shale elastic modulus is 30 GPa, sandstone elastic modulus is 18 GPa; (c) Shale elastic modulus is 35 GPa, sandstone elastic modulus is 18 GPa.
As shown in Figure 7, the influence of different elastic moduli of shale and sandstone on wellbore stability is illustrated. Three sets of experiments were conducted with the sandstone elastic modulus fixed at 18 GPa, while the shale elastic modulus was set at 25 GPa, 30 GPa, and 35 GPa, respectively. It can be observed that the difference between and shows a decreasing trend with the value decreasing from 36 MPa to 26 MPa. The risk of wellbore instability was reduced. Similarly, when the shale elastic modulus was set as 30 GPa and the sandstone elastic modulus was set at 15 GPa, 18 GPa, and 21 GPa, three additional experiments were conducted. From Figure 7, it can be seen that the difference between and presents an increasing trend with the value increasing from 27 MPa to 35 MPa. It can be inferred that the wellbore was more prone to collapse and instability. Therefore, changes in the sandstone elastic modulus can increase the risk of wellbore instability.
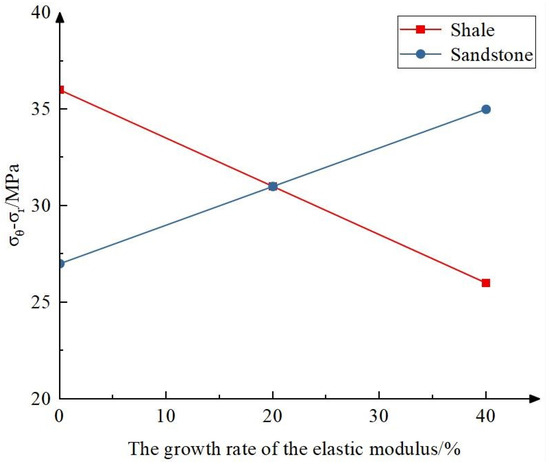
Figure 7.
The influence of different elastic modulus on wellbore stability.
Three sets of experiments were conducted on the shale–sandstone interbedded shale oil reservoirs in the Chang 7 area based on different elastic modulus of shale and sandstone. Under different confining pressures of 0 MPa, 15 MPa, and 30 MPa, the collapse pressure and fracture pressure were calculated. As shown in Figure 8, taking points A, B, C, D, and E as example, these correspond to the midpoint of the upper shale, the interface between the upper shale and the sandstone, the midpoint of the sandstone, the interface between the sandstone and the lower shale, and the midpoint of the lower shale, respectively. As can be seen from Figure 7, the safety density window at points B and D is relatively narrow, indicating that the interface between the shale and the sandstone is prone to wellbore collapse and instability. The sandstone section at point C has a larger safety density window compared to the shale sections at points A and E making it less prone to wellbore instability.
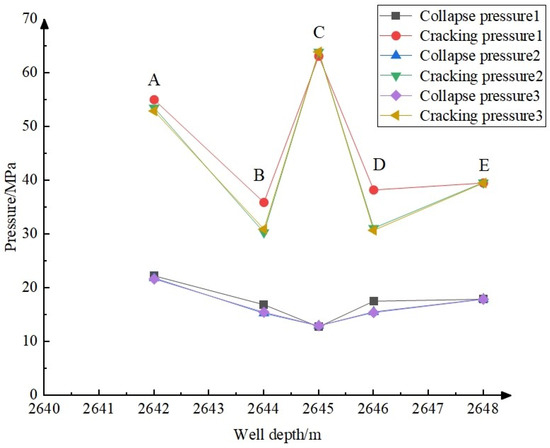
Figure 8.
Collapse and fracture pressures at different well depths (based on different elastic modulus of shale and sandstone).
5.3. The Influence of Different Poisson’s Ratios of Shale–Sandstone on Wellbore Stability
In the shale–sandstone interbedded reservoirs within the Chang 7 area, an investigation into the influence of different sandstone Poisson’s ratios on wellbore stability is conducted, while maintaining a constant shale Poisson’s ratio. Additionally, the impact of varying shale Poisson’s ratios on wellbore stability is explored, with the sandstone Poisson’s ratio held constant. Reference points A, B, C, D, and E denote specific locations: these correspond to the midpoint of the upper shale, the interface between the upper shale and the sandstone, the midpoint of the sandstone, the interface between the sandstone and the lower shale, and the midpoint of the lower shale, respectively. Based on a finite element numerical model, this paper simulates the stress distribution of the wellbore, specifically the circumferential stress, under different sandstone Poisson’s ratios. Analyzing the patterns in Figure 9 reveals that the sandstone circumferential stress is closely related to the size of the elastic modulus. As the elastic modulus increases, the sandstone’s circumferential stress (at points B, C, and D) also increases. Taking point B as an example, the sandstone circumferential stress increases from 83.6 MPa to 102 MPa. It can be inferred that changes in the sandstone Poisson’s ratio cause a redistribution of the stress around the wellbore, thereby affecting the stability of the wellbore. From Figure 10, it can be observed that the maximum stress on the wellbore appears near the horizontal direction of the wellbore, which is the direction of the minimum principal stress. Wellbore instability typically starts at the wellbore. When the difference between the circumferential stress () and the radial stress () on the wellbore wall is too large, the greater the difference between and . According to the Mohr–Coulomb criterion, it is determined that the rock here will be damaged and the wellbore is prone to instability.
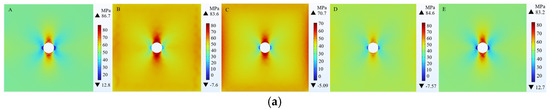
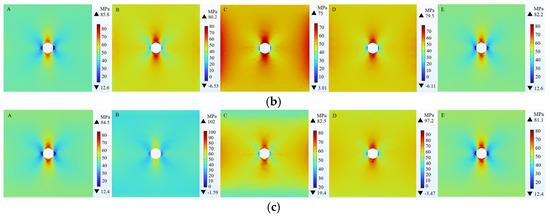
Figure 9.
Circumferential stress distribution with different sandstone Poisson’s ratios. (a) Shale Poisson’s ratio is 0.3, sandstone Poisson’s ratio is 0.3; (b) Shale Poisson’s ratio is 0.3, sandstone Poisson’s ratio is 0.36; (c) Shale Poisson’s ratio is 0.3, sandstone Poisson’s ratio is 0.42.
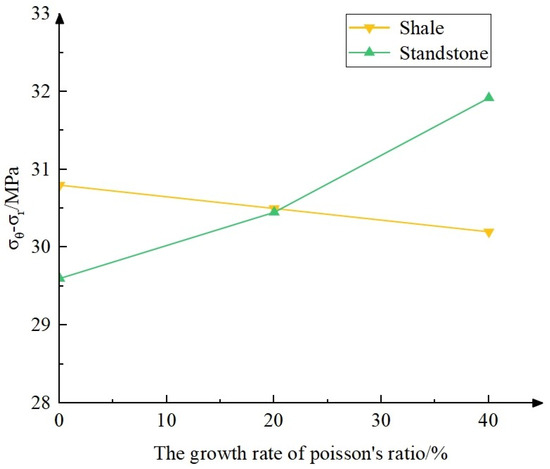
Figure 10.
The influence of different Poisson’s ratios on wellbore stability.
As shown in Figure 10, the influence of different Poisson’s ratios of shale and sandstone on wellbore stability is illustrated. Three sets of experiments were conducted with the sandstone Poisson’s ratio fixed at 0.36, while the shale Poisson’s ratio was set at 0.25, 0.3, and 0.35, respectively. From Figure 10, it can be observed that the difference between and decreased from 30.8% to 30.2%. It showed an overall decreasing trend, but the magnitude of the difference between the two remained largely unchanged, which indicates that the change in shale Poisson’s ratio has little effect on wellbore stability. Similarly, when the shale Poisson’s ratio was 0.3, and the sandstone Poisson’s ratio was set at 0.3, 0.36, and 0.42, from Figure 10, it can be seen that the difference between and increased from 29.6 MPa to 32 MPa, showing an increasing trend. It can be inferred that as the sandstone Poisson’s ratio increases, the risk of wellbore instability also increases.
Experiments were conducted on shale–sandstone interbedded shale oil reservoirs within the Chang 7 area, under varying confining pressures of 0 MPa, 15 MPa, and 30 MPa, employing different Poisson’s ratios for shale and sandstone. Collapse pressure and fracture pressure were subsequently calculated. Figure 11 illustrates these analyses, with points A, B, C, D, and E representing specific locations: the midpoint of the upper shale, the interface between the upper shale and the sandstone, the midpoint of the sandstone, the interface between the sandstone and the lower shale, and the midpoint of the lower shale, respectively. As can be seen from the figure, the safety density window at points B and D is relatively narrow, suggesting a propensity for wellbore collapse and instability at the shale–sandstone interface. Conversely, the sandstone section at point C exhibits a broader safety density window compared to the shale sections at points A and E, indicating a lesser susceptibility to wellbore instability.
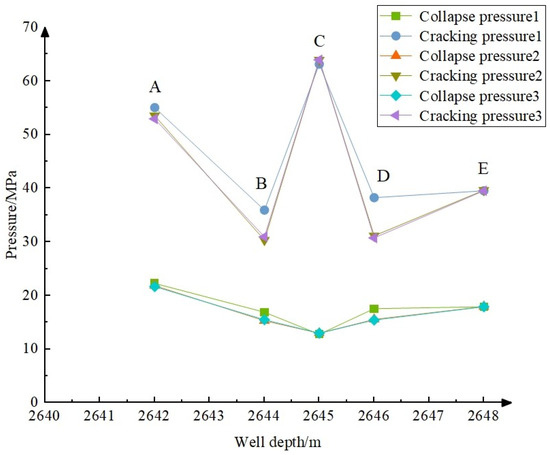
Figure 11.
Collapse and fracture pressures at different well depths (employing different Poisson’s ratios for shale and sandstone).
5.4. The Influence of Different Crustal Stresses on Wellbore Stability in Shale–Sandstone Reservoirs
This section evaluates wellbore stability rules under three typical crustal stress mechanisms, delineated in Table 4, representing the crustal stress parameters under normal fault , strike-slip fault , and reverse fault conditions. The wellbore stability rules are analyzed based on numerical simulations, and the results are presented in Figure 12, Figure 13 and Figure 14. Taking points A and C as examples, which correspond to the shale layer and the sandstone layer, respectively, it is evident from the figures that the crustal stress state has a significant impact on wellbore stability. The stress distribution rules vary under different stress mechanisms, and the numerical differences under corresponding parameters are also substantial. Therefore, particular attention should be paid to the accurate acquisition of crustal stress parameters in wellbore stability analysis. Some stresses are shown as illustrated.
Table 4.
Parameters under different crustal stress types.
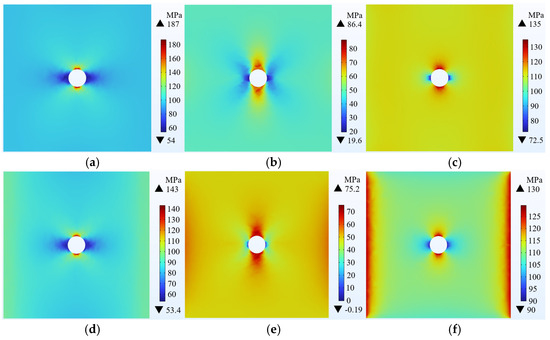
Figure 12.
Normal fault stress distribution. (a) Shale radial stress; (b) Shale circumferential stress; (c) Shale vertical stress; (d) Sandstone radial stress; (e) Sandstone circumferential stress; (f) Sandstone vertical stress.
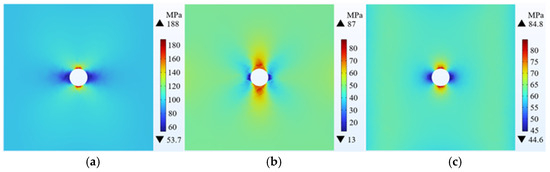
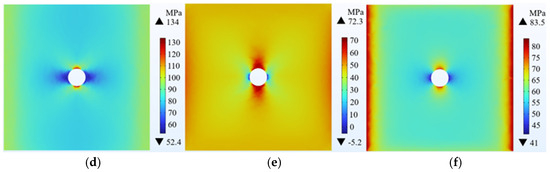
Figure 13.
Strike-slip fault stress distribution. (a) Shale radial stress; (b) Shale circumferential stress; (c) Shale vertical stress; (d) Sandstone radial stress; (e) Sandstone circumferential stress; (f) Sandstone vertical stress.
Figure 14.
Reverse fault stress distribution. (a) Shale radial stress; (b) Shale circumferential stress; (c) Shale vertical stress; (d) Sandstone radial stress; (e) Sandstone circumferential stress; (f) Sandstone vertical stress.
For instance, Figure 12 delineates the stress distribution under normal fault mechanisms, wherein the radial stress () in shale ranges from a minimum of 54 MPa to a maximum of 187 MPa, while the circumferential stress () spans from a minimum of 19.6 MPa to a maximum of 86.4 MPa. In sandstone, the radial stress () ranges from a minimum of 53.4 MPa to a maximum of 143 MPa, with the circumferential stress () varying from a minimum of −0.19 MPa to a maximum of 75.2 MPa.
For instance, Figure 13 delineates the stress distribution under strike-slip fault mechanisms, wherein the radial stress () in shale ranges from a minimum of 53.7 MPa to a maximum of 188 MPa, while the circumferential stress () spans from a minimum of 13 MPa to a maximum of 87 MPa. In sandstone, the radial stress () ranges from a minimum of 52.4 MPa to a maximum of 134 MPa, with the circumferential stress () varying from a minimum of −5.2 MPa to a maximum of 72.3 MPa.
For instance, Figure 14 delineates the stress distribution under reverse fault mechanisms, wherein the radial stress () in shale ranges from a minimum of 50.3 MPa to a maximum of 197 MPa, while the circumferential stress () spans from a minimum of 11.8 MPa to a maximum of 88.6 MPa. In sandstone, the radial stress () ranges from a minimum of 50.1 MPa to a maximum of 148 MPa, with the circumferential stress () varying from a minimum of −5.99 MPa to a maximum of 73.9 MPa.
Based on finite element numerical simulation, Figure 15 illustrates the impact of three typical in-situ stress mechanisms on the stress distribution around the borehole. The vertical axis represents stress, and the horizontal axis represents the distance from the wellbore. The analysis indicates that, compared to the normal faulting and strike-slip faulting stress mechanisms, there is a significant difference between and under the reverse faulting stress mechanism, which makes it easier for wellbore instability to occur during the drilling process.
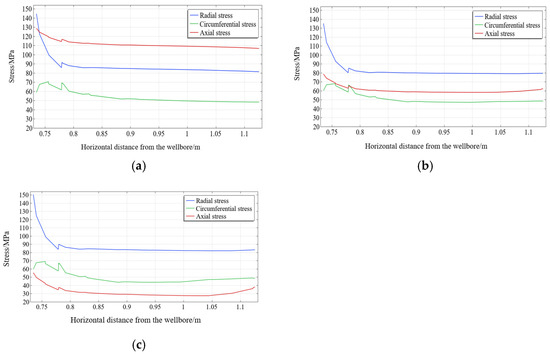
Figure 15.
Stress distribution around the borehole under three typical in-situ stress mechanisms. (a) Stress distribution under normal faulting mechanism; (b) Stress distribution under strike-slip faulting mechanism; (c) Stress distribution under reverse faulting mechanism.
5.5. Potential Applicability to Other Shale–Sandstone Interbedded Reservoirs
While this study primarily focuses on the wellbore stability of shale–sandstone interbedded reservoirs in the Chang 7 Member of the Ordos Basin, the findings offer insights that could be extended to similar unconventional reservoirs. The results and methodologies presented here—particularly the mechanical property tests, stress distribution models, and failure criteria—are not confined to the Chang 7 formation but could also apply to other interbedded shale–sandstone reservoirs. For example, other reservoirs, such as those in the Songliao Basin or the Junggar Basin, which also feature significant shale–sandstone interbedding, may exhibit similar mechanical behaviors under varying conditions of confining pressure, elastic modulus, and Poisson’s ratio. The Mohr–Coulomb failure criterion, which was found effective for analyzing sandstone failure, can also be applied to other sandstone-rich interbedded reservoirs, providing a useful tool for analyzing stability in those formations. Moreover, the influence of in-situ stresses, such as normal, strike-slip, and reverse fault mechanisms, has been shown to significantly affect wellbore stability in the Chang 7 shale–sandstone system. This aspect could be critical for wellbore design in other regions where faulting mechanisms play a significant role. Further studies could examine whether the trends observed in the Chang 7 formation hold for other shale–sandstone interbeds with different geomechanical properties. By expanding this study to include a variety of shale–sandstone interbedded reservoirs, researchers can build on the findings to develop more generalized models for wellbore stability. This would contribute to the advancement of drilling operations and risk mitigation strategies in unconventional oil and gas reservoirs worldwide.
6. Conclusions
- (1)
- Under triaxial compression conditions, an increase in confining pressure leads to a shift in the failure characteristics of sandstone specimens towards inclined plane shear failure. This failure mode is primarily characterized by a limited number of macroscopic cracks, exhibiting a uniform morphological configuration. In contrast, shale specimens exhibit a noticeable transition in failure mode, progressing from longitudinal splitting to inclined plane shear as confining pressure increases. The research results indicate these changes in failure behavior.
- (2)
- The study investigated the effect of different elastic modulus between shale and sandstone on wellbore stability. As the elastic modulus of shale increased, the difference between and decreased from 36 MPa to 26 MPa. Conversely, when the elastic modulus of sandstone increased, the difference between and increased from 27 MPa to 35 MPa making the wellbore more prone to instability.
- (3)
- The analysis investigated the impact of varying Poisson’s ratios between shale and sandstone on wellbore stability. With an increase in the Poisson’s ratio of shale, the difference between and decreased from 30.8% to 30.2%. It was observed that changes in the Poisson’s ratio of shale had almost no impact on wellbore stability. However, when the Poisson’s ratio of sandstone increased, the difference between and increased from 29.6 MPa to 32 MPa. This observation suggests a direct correlation between an increase in the Poisson’s ratio of sandstone and an elevated risk of wellbore instability.
- (4)
- The collapse pressure and fracture pressure for shale–sandstone were computed across varying elastic modulus and Poisson’s ratios to determine the safe density window. It can be seen that at points B and D, where the shale–sandstone interface is located, the safe density window is smaller to make it more prone to wellbore instability compared to points A, C, and E.
- (5)
- Furthermore, upon analyzing wellbore stability patterns under normal faulting, strike-slip faulting, and reverse faulting crustal stress mechanisms, the analysis indicates that the difference between radial and circumferential stresses becomes significantly larger under the reverse faulting crustal stress mechanism. This notable disparity underscores an increased risk of wellbore collapse and instability.
Author Contributions
Conceptualization, G.W. and X.W.; methodology, L.Z.; software, L.Z.; validation, Y.S.; formal analysis, C.K.; investigation, Y.S.; resources, Y.S.; data curation, writing—original draft preparation, X.K.; writing—review and editing, H.L. and Y.S.; visualization, X.K.; supervision, H.L.; project administration, Y.S.; funding acquisition, Y.S. All authors have read and agreed to the published version of the manuscript.
Funding
The work presented in this paper was financially supported by the First-Class Discipline Collaborative Innovation Program of Heilongjiang Province (Grant No. LJGXCG2024-F02) and the Key Research and Development Program of Heilongjiang Province (Grant No. 2024ZX09C01). The Postdoctoral Special Funding of Heilongjiang Province (LBH-TZ2301) is also gratefully acknowledged.
Data Availability Statement
The data used to support the findings of this study are all shown in uploaded manuscript.
Conflicts of Interest
Authors Yu Suo, Cuilong Kong and Guiquan Wang were employed by Daqing Oilfield Production Technology Institute, Daqing Oilfield Limited Company; Authors Xiaoguang Wang and Lingzhi Zhou were employed by Daqing Oilfield Downhole Services Company. The remaining authors declare that the research was conducted in the absence of any commercial or financial relationships that could be construed as a potential conflict of interest.
References
- Fu, S.T.; Jin, Z.J.; Fu, J.H.; Li, S.X.; Yang, W.W. Transformation of understanding from tight oil to shale oil and significance of exploration and development in section 7 of Yanchang Group in Ordos Basin. J. Pet. 2021, 42, 561–569. [Google Scholar]
- Fu, J.; Li, S.; Niu, X.; Deng, X.; Zhou, X. Geological characteristics and progress of exploration and development of shale oil in the long 7 section of the Mesozoic Yanchang Formation in the Ordos Basin. China Pet. Explor. 2019, 24, 601–614. [Google Scholar]
- Yang, Y.; Zheng, X.; Xiao, Y.; Lei, Z.; Xing, H.; Xiong, T.; Liu, M. Progress in exploration and development of high-mature shale oil of PetroChina. China Pet. Explor. 2023, 28, 23. [Google Scholar]
- Cheng, Y.F.; Wang, J.Y.; Zhao, Y.Z.; Shen, M.C. Strength analysis of mud shale formation under multi-field coupling. J. Rock Mech. Eng. 2006, 25, 1912–1916. [Google Scholar]
- Wang, J.Y.; Cheng, Y.F.; Zhao, Y.Z.; Jiang, J.H.; Shen, M.C.; Guo, Y.F. Prediction of safe density window for drilling fluids in mud-shale formations under multi-field coupling. Drill. Complet. Fluids 2007, 24, 1–3. [Google Scholar]
- Niandou, H.; Shao, J.F.; Henry, J.P.; Fourmaintraux, D. Laboratory investigation of the mechanical behaviour of Tournemire shale. Int. J. Rock Mech. Min. Sci. 1997, 34, 3–16. [Google Scholar] [CrossRef]
- Masri, M.; Sibai, M.; Shao, J.F.; Mainguy, M. Experimental investigation of the effect of temperature on the mechanical behavior of Tournemire shale. Int. J. Rock Mech. Min. Sci. 2014, 70, 185–191. [Google Scholar] [CrossRef]
- Dewhurst, D.N.; Siggins, A.F.; Kuila, U.; Clennell, M.B.; Raven, M.D.; Nordgard-Bolas, H.M. Rock Physics, Geomechanics and Rock Properties in Shales—Where are the Links? In SHIRMS 2008: Proceedings of the First Southern Hemisphere International Rock Mechanics Symposium, Perth, Australia, 16–19 September 2008; Australian Centre for Geomechanics: Perth, Australia, 2008; pp. 461–474. [Google Scholar]
- Kuila, U.; Dewhurst, D.N.; Siggins, A.F.; Raven, M.D. Stress anisotropy and velocity anisotropy in low porosity shale. Tectonophysics 2011, 503, 34–44. [Google Scholar] [CrossRef]
- Chen, X.; Yang, Q.; He, M.C.; Li, K.F. Consider the wellbore stability analysis of the anisotropic strength of deep rock mass. J. Rock Mech. Eng. 2005, 16, 2882–2888. [Google Scholar]
- Li, J.; Liu, G.H.; Chen, M. Orthotropic anisotropic formation wellbore surrounding rock stress new model. J. Rock Mech. Eng. 2011, 30, 2481–2485. [Google Scholar]
- Chen, X.; Tan, C.P.; Detournay, C. A study on wellbore stability in fractured rock masses with impact of mud infiltration. J. Pet. Sci. Eng. 2003, 38, 145–154. [Google Scholar] [CrossRef]
- Wen, H.; Chen, M.; Jin, Y.; Wang, K.; Xia, Y.; Dong, J.N.; Niu, C.C. Research on the mechanical-chemical coupling of wellbore stability in brittle mud shale inclined segments. Pet. Explor. Dev. 2014, 41, 748–754. [Google Scholar] [CrossRef]
- Jin, Y.; Bo, K.H.; Zhang, Y.Z.; Lu, Y.H. Progress and considerations in the study of mechanical-chemical coupling for wellbore stability in deep, brittle mud shale. Oil Drill. Technol. 2023, 51, 159–169. [Google Scholar]
- Ding, Y.; Liu, X.J.; Luo, P.Y.; Liang, L.X. Study on the stability of wellbore in brittle mud shale formations. China Offshore Oil Gas 2018, 30, 142–149. [Google Scholar]
- Yu, B.; Yan, C.; Nie, Z. Chemical effect on wellbore instability of Nahr Umr shale. Sci. World J. 2013, 2013, 931034. [Google Scholar] [CrossRef]
- Liu, X.J.; Zeng, W.; Liang, L.X.; Xiong, J. Analysis of the impact of shale bedding on wellbore stability. China Saf. Prod. Sci. Technol. 2016, 12, 88–92. [Google Scholar]
- Ma, T.S.; Chen, P. Stability analysis of bedded shale in horizontal wells. J. Cent. South Univ. (Nat. Sci. Ed.) 2015, 46, 1375–1383. [Google Scholar]
- Lee, H.; Ong, S.H.; Azeemuddin, M.; Goodman, H. A wellbore stability model for formations with anisotropic rock strengths. J. Pet. Sci. Eng. 2012, 96, 109–119. [Google Scholar] [CrossRef]
- Ding, L.Q.; Wang, Z.Q.; Lu, J.G.; Sun, Y.D. Stability model of inclined wells in bedded formations based on the surrounding rock’s Mogi-Coulomb strength criterion. J. Rock Mech. Eng. 2017, 36, 622–632. [Google Scholar]
- Al-Bazali, T.M.; Zhang, J.; Wolfe, C.; Chenevert, M.E.; Sharma, M.M. Wellbore instability of directional wells in laminated and naturally fractured shales. J. Porous Media 2009, 12, 119–130. [Google Scholar] [CrossRef]
- Qiu, Y.; Ma, T.S.; Chen, Y.J.; Y, Y.; Deng, C.S. Evolutionary laws of wellbore stability in unbalanced horizontal wells in argillaceous siltstone reservoirs. J. Cent. South Univ. (Nat. Sci. Ed.) 2023, 54, 967–983. [Google Scholar]
- Zhang, W.; Liu, X.J.; Liang, L.X.; Xiong, J. Experimental study on the stability of boreholes in gas drilling in tight sandstone formations. Oil Drill. Technol. 2023, 51, 37–45. [Google Scholar]
- Wang, X.; Sterling, R.L. Stability analysis of a borehole wall during horizontal directional drilling. Tunn. Undergr. Space Technol. 2007, 22, 620–632. [Google Scholar] [CrossRef]
- Darvishpour, A.; Seifabad, M.C.; Wood, D.A.; Ghorbani, H. Wellbore stability analysis to determine the safe mud weight window for sandstone layers. Pet. Explor. Dev. 2019, 46, 1031–1038. [Google Scholar] [CrossRef]
- Cao, Y.; Wei, B.H.; Deng, J.G.; Yan, C.L.; Yuan, J.L. Analysis of wellbore stability in sandstone formations. Sci. Technol. Her. 2014, 32, 34–36. [Google Scholar]
- Zhao, B.; Hui, J.T.; Xu, Y.; Wang, J.; Sun, Y.Z.; Wang, J. Stress sensitivity of unconsolidated sandstone and its impact on borehole collapse. China Sci. Technol. Pap. 2020, 15, 980–986. [Google Scholar]
- Tan, Q.; Deng, J.G.; Yu, B.H. Study on Borehole Stability of Unconsolidated Sandstone in Depleted Reservior. Adv. Mater. Res. 2013, 616, 720–725. [Google Scholar] [CrossRef]
- Wang, B.Y.; Wei, B.H.; Dang, J.G. Study on the influence of temperature and seepage on the drilling fluid density window in unconsolidated sandstone reservoirs. Drill. Complet. Fluids 2005, 22, 40–42. [Google Scholar]
- Wang, Q.R.; Tao, S.Z.; Guan, P. Progress of Shale Oil research, exploration and development in Continental Basins of China. Nat. Gas Geosci. 2020, 31, 417–427. [Google Scholar]
- Zhou, Z.; Yan, Y.; Ren, S.; Qiao, D.; Guo, T.; Wang, H. Prospects and strategic recommendations for shale oil exploration in the Songliao Basin. China Min. Ind. 2017, 26, 171–174. [Google Scholar]
- Xie, J. Study on Borehole Stability of Horizontal Well in Unconsolidated Sandstone. Bachelor’s Thesis, Changjiang University, Jinzhou, China, 2021. [Google Scholar]
Disclaimer/Publisher’s Note: The statements, opinions and data contained in all publications are solely those of the individual author(s) and contributor(s) and not of MDPI and/or the editor(s). MDPI and/or the editor(s) disclaim responsibility for any injury to people or property resulting from any ideas, methods, instructions or products referred to in the content. |
© 2025 by the authors. Licensee MDPI, Basel, Switzerland. This article is an open access article distributed under the terms and conditions of the Creative Commons Attribution (CC BY) license (https://creativecommons.org/licenses/by/4.0/).