Abstract
To investigate the methane adsorption characteristics in different types of kerogen, microscopic models for three kerogen types—sapropelic (Type I), mixed (Type II), and humic (Type III)—were developed in this paper based on the paradigm diagram. Using Materials Studio 2020 software, a combination of molecular dynamics and Monte Carlo adsorption simulations was employed to examine the kerogen from the molecular structure to the cellular structure, with an analysis rooted in thermodynamic theory. The results indicated that the elemental composition of kerogen significantly influenced both the heat of adsorption and the adsorption position, with sulfur (S) having the greatest effect. Specifically, the C-S bond shifted the methane adsorption position horizontally by 0.861 Å and increased the adsorption energy by 1.418 kJ. Among the three types of kerogen crystals, a relationship was observed among the adsorption amount, limiting adsorption energy, and specific adsorption energy, with Type I < Type II < Type III. Additionally, the limiting adsorption energy was greater than the specific adsorption energy. The limiting adsorption energy of Type Ⅲ was only 28.436 kJ/mol, which indicates that methane is physically adsorbed in the kerogen. Regarding the diffusion coefficient, the value of 0.0464 Å2/Ps in the micropores of Type I kerogen was significantly higher than that in Types II and III, though it was much smaller than the diffusion coefficient observed in the macropores. Additionally, adsorption causes volumetric and effective pore volume expansion in kerogen crystals, which occurs in two phases: slow expansion and rapid expansion. Higher types of kerogen require a larger adsorption volume to reach the rapid expansion phase and expand more quickly. However, during the early stage of adsorption, the expansion rate is extremely low, and even a slight shrinkage may occur. Therefore, in shale gas extraction, it is crucial to design the extraction strategy based on the content and adsorption characteristics of the three kerogen types in order to enhance shale gas production and improve extraction efficiency.
1. Introduction
Shale gas, as an unconventional natural gas resource, is characterized by abundant reserves, low carbon emissions, and high energy efficiency [1]. It is recognized as a globally significant strategic energy reserve and a key alternative to conventional oil and gas resources [2]. The United States leads the world in shale gas production. According to data from the U.S. NOVI platform, global shale gas production reached 805.8 billion cubic meters in 2021, with the U.S. accounting for approximately 94.7% of the total output. China, with over 36 trillion cubic meters of recoverable shale gas resources, ranks first globally, holding more than 20% of the world’s recoverable reserves. However, in the same year, China’s actual shale gas production was only 22.8 billion cubic meters, representing less than 3% of the global total [3]. This stark contrast highlights the significant challenges China faces in shale gas exploration and development.
The primary component of shale gas is methane, which exists in shale primarily in adsorbed or free states, with the adsorbed state accounting for up to 85% of the total [4]. Kerogen, the predominant carbonaceous material in shale, consists of over 90% carbon (C), hydrogen (H), and oxygen (O), along with trace amounts of nitrogen (N), phosphorus (P), and sulfur (S). Kerogen is typically classified into three types [5]: Type I (Sapropelic kerogen): it contains abundant aliphatic chains, a small number of aromatic rings, and side-chain heteroatoms. The H/C ratio is typically greater than 1.5, and the O/C ratio is less than 0.1. Its pore structure is underdeveloped, consisting primarily of micropores with uneven distribution and low specific surface area. The density ranges between 0.8 g/cm3 and 1.0 g/cm3. Type II (Mixed kerogen): it contains fewer aliphatic components and a relatively high number of heteroatom functional groups, primarily lipid-based. The H/C and O/C ratios lie between those of Type I and Type III kerogen. The density typically ranges from 1.0 g/cm3 to 1.2 g/cm3. Type III (Humic kerogen): it consists mainly of aromatic rings and aliphatic chains, with a high proportion of aromatic rings. The O/C ratio ranges from 0.2 to 0.3, and the H/C ratio is less than 1. The density is usually greater than 1.1 g/cm3, with well-developed and complex pore structures, including micropores, mesopores, and macropores.
The elemental composition, functional groups, and pore structure of kerogen significantly influence its methane adsorption behavior. Recent studies have increasingly focused on using realistic kerogen models to investigate methane adsorption characteristics. For instance, Tesson et al. [6] conducted adsorption simulations on Type II-A kerogen using GCMC-MD methods, revealing that the diffusion coefficient of methane decreases by two orders of magnitude from the center of slit pores to the surface and organic matrix. They also proposed a potential coupling relationship between gas adsorption and kerogen matrix structural deformation. Huang et al. [7] employed molecular dynamics and Monte Carlo simulations to construct kerogen models (primarily Type II) with varying pore sizes from the Longmaxi Formation. Their analysis indicated that methane preferentially adsorbs at the kerogen surface due to wall effects, with sulfur-containing groups serving as the primary adsorption sites. Lin et al. [8] investigated methane adsorption in rough Type II kerogen nano-fractures, demonstrating that fracture roughness significantly affects methane adsorption behavior, with adsorption sites predominantly located in concave regions. Ho et al. [9] used MD-GCMC methods to study methane adsorption in Type II-D kerogen models, showing that kerogen expansion increases with pressure, reaching a maximum of less than 5.4% at 300 K and 192 atm. Sui et al. [10] studied Type II-A kerogen and found that the maximum methane-induced expansion was 4.45% at 340 K and 148 atm. Shi et al. [11] investigated the adsorption and diffusion characteristics of Type II kerogen, demonstrating that the methane diffusion coefficient decreases with increasing burial depth. Li et al. [12] simulated methane adsorption in Type II kerogen models, concluding that methane in small pores primarily exists in the adsorbed state, with almost no free state.
Despite these advancements, most studies have focused on modeling a single type of kerogen, particularly Type II, without considering the differences in adsorption performance among Type I, Type II, and Type III kerogen. Additionally, research on kerogen deformation induced by adsorption has primarily focused on volume expansion, neglecting changes in internal pore structures. Furthermore, most adsorption studies characterize adsorption behavior solely based on adsorption capacity, overlooking differences in adsorption heat. However, different types of kerogen exhibit distinct adsorption behaviors due to variations in thermal maturity, chemical composition, and pore characteristics. Investigating these behaviors can systematically reveal the nature of kerogen adsorption capacity and provide scientific insights into gas storage characteristics under different reservoir conditions. Adsorption-induced deformation directly affects stress distribution, pore structure changes, and permeability evolution in reservoirs. Adsorption heat, the energy difference between adsorbed and free states, determines the proportion of adsorbed and free gas and is one of the key factors contributing to the low permeability of shale gas reservoirs [13]. Generally, higher adsorption heat makes shale gas easier to adsorb but harder to desorb.
Therefore, in this paper, we constructed microscopic cellular models of humic, mixed, and sapropelic types of kerogen, which differ from the traditional simplified structural models of graphene and the slit model of kerogen. Methane adsorption, adsorption energy, volume deformation effects, pore deformation effects, and diffusion coefficients were simulated. The results reveal the differences in adsorption characteristics among different kerogen types and compare them with previous studies. By integrating the actual conditions of typical shale formations in China, the adsorption behaviors of different kerogen types under varying reservoir pressures and temperatures are analyzed. This provides a more applicable theoretical foundation for shale gas development, particularly in optimizing gas reservoir development strategies for different kerogen types, offering significant practical implications.
2. Model Construction Method
2.1. Simulation of Kerogen Small Molecular Fragments
The presence of oxygen (O), nitrogen (N), and sulfur (S) elements in kerogen molecules significantly influences their adsorption behavior. To investigate these effects, a small number of benzene rings were extracted from a graphene molecular layer, and functional groups such as carboxyl and hydroxyl groups were constructed using O, N, and S elements to replace carbon (C) or hydrogen (H) atoms in the benzene rings. These modified fragments served as small molecular segments of kerogen, enabling the study of the impact of different elements on adsorption behavior. Molecular dynamics simulations were employed to optimize the small molecular fragments, and the Monte Carlo method was used to calculate the adsorption of a single methane molecule on the kerogen small molecular fragments (Figure 1). The simulation results are summarized in Table 1.
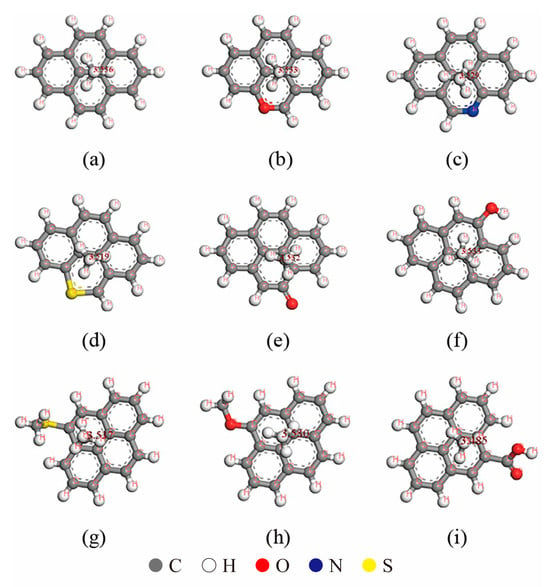
Figure 1.
Adsorption of methane on kerogen small molecular fragments with different elements and functional groups: (a) C16H10, (b) C15H9O, (c) C15H9N, (d) C15H9S, (e) C16H9O, (f) C15H10O, (g) C17H12S, (h) C17H12O and (i) C17H10O2.

Table 1.
Simulation results of methane adsorption on small molecular kerogen fragments.
When the fragment contained only C and H elements, the methane molecule was positioned 3.536 Å away from the benzene ring. However, when C atoms in the benzene ring were replaced by O, N, or S elements to form new functional groups, the adsorption position and distance of methane exhibited notable changes. Among these elements, S caused the largest vertical displacement of methane, approximately 0.017 Å. When H atoms on the benzene ring were replaced by external functional groups, the C-S bond had the most significant influence on methane adsorption, resulting in a horizontal displacement of 0.861 Å. The C=O bond induced a horizontal displacement of approximately 0.603 Å, while the carboxyl and C-O bonds caused horizontal displacements of approximately 0.599 Å and 0.436 Å, respectively.
In terms of adsorption energy, the nitrogen (N) and oxygen (O) elements in the benzene ring of kerogen, as well as the oxygen (O) element in hydroxyl groups, exhibit a minor influence on adsorption energy. Notably, the oxygen (O) element in the benzene ring even slightly reduces the adsorption energy. In contrast, functional groups such as sulfur (S) in the benzene ring, C=O bonds, C-O bonds, C-S bonds, and carboxyl groups all contribute to an increase in adsorption energy. Among these, the C-S bond has a significantly greater effect on enhancing adsorption energy compared to other functional groups, being the only small fragment that elevates the adsorption energy above 10 kJ. These results demonstrate that different functional groups exert a notable impact on adsorption characteristics [14]. Consequently, for different types of kerogen, the adsorption characteristics of methane vary significantly due to differences in elemental content and structural composition.
Furthermore, it is observed that the adsorption energy of small kerogen fragments is relatively low. This phenomenon can be attributed to the limited number of molecules in the fragments and their predominantly planar structure. Compared to the complex, irregular pore structures of real kerogen unit cells, planar structures possess a lower specific surface area and fewer active sites, resulting in reduced adsorption energy. Therefore, to better understand the influence of different kerogen types on adsorption energy, a three-dimensional realistic molecular model of kerogen was subsequently constructed for further investigation.
2.2. Simulation of Kerogen Unit Cells
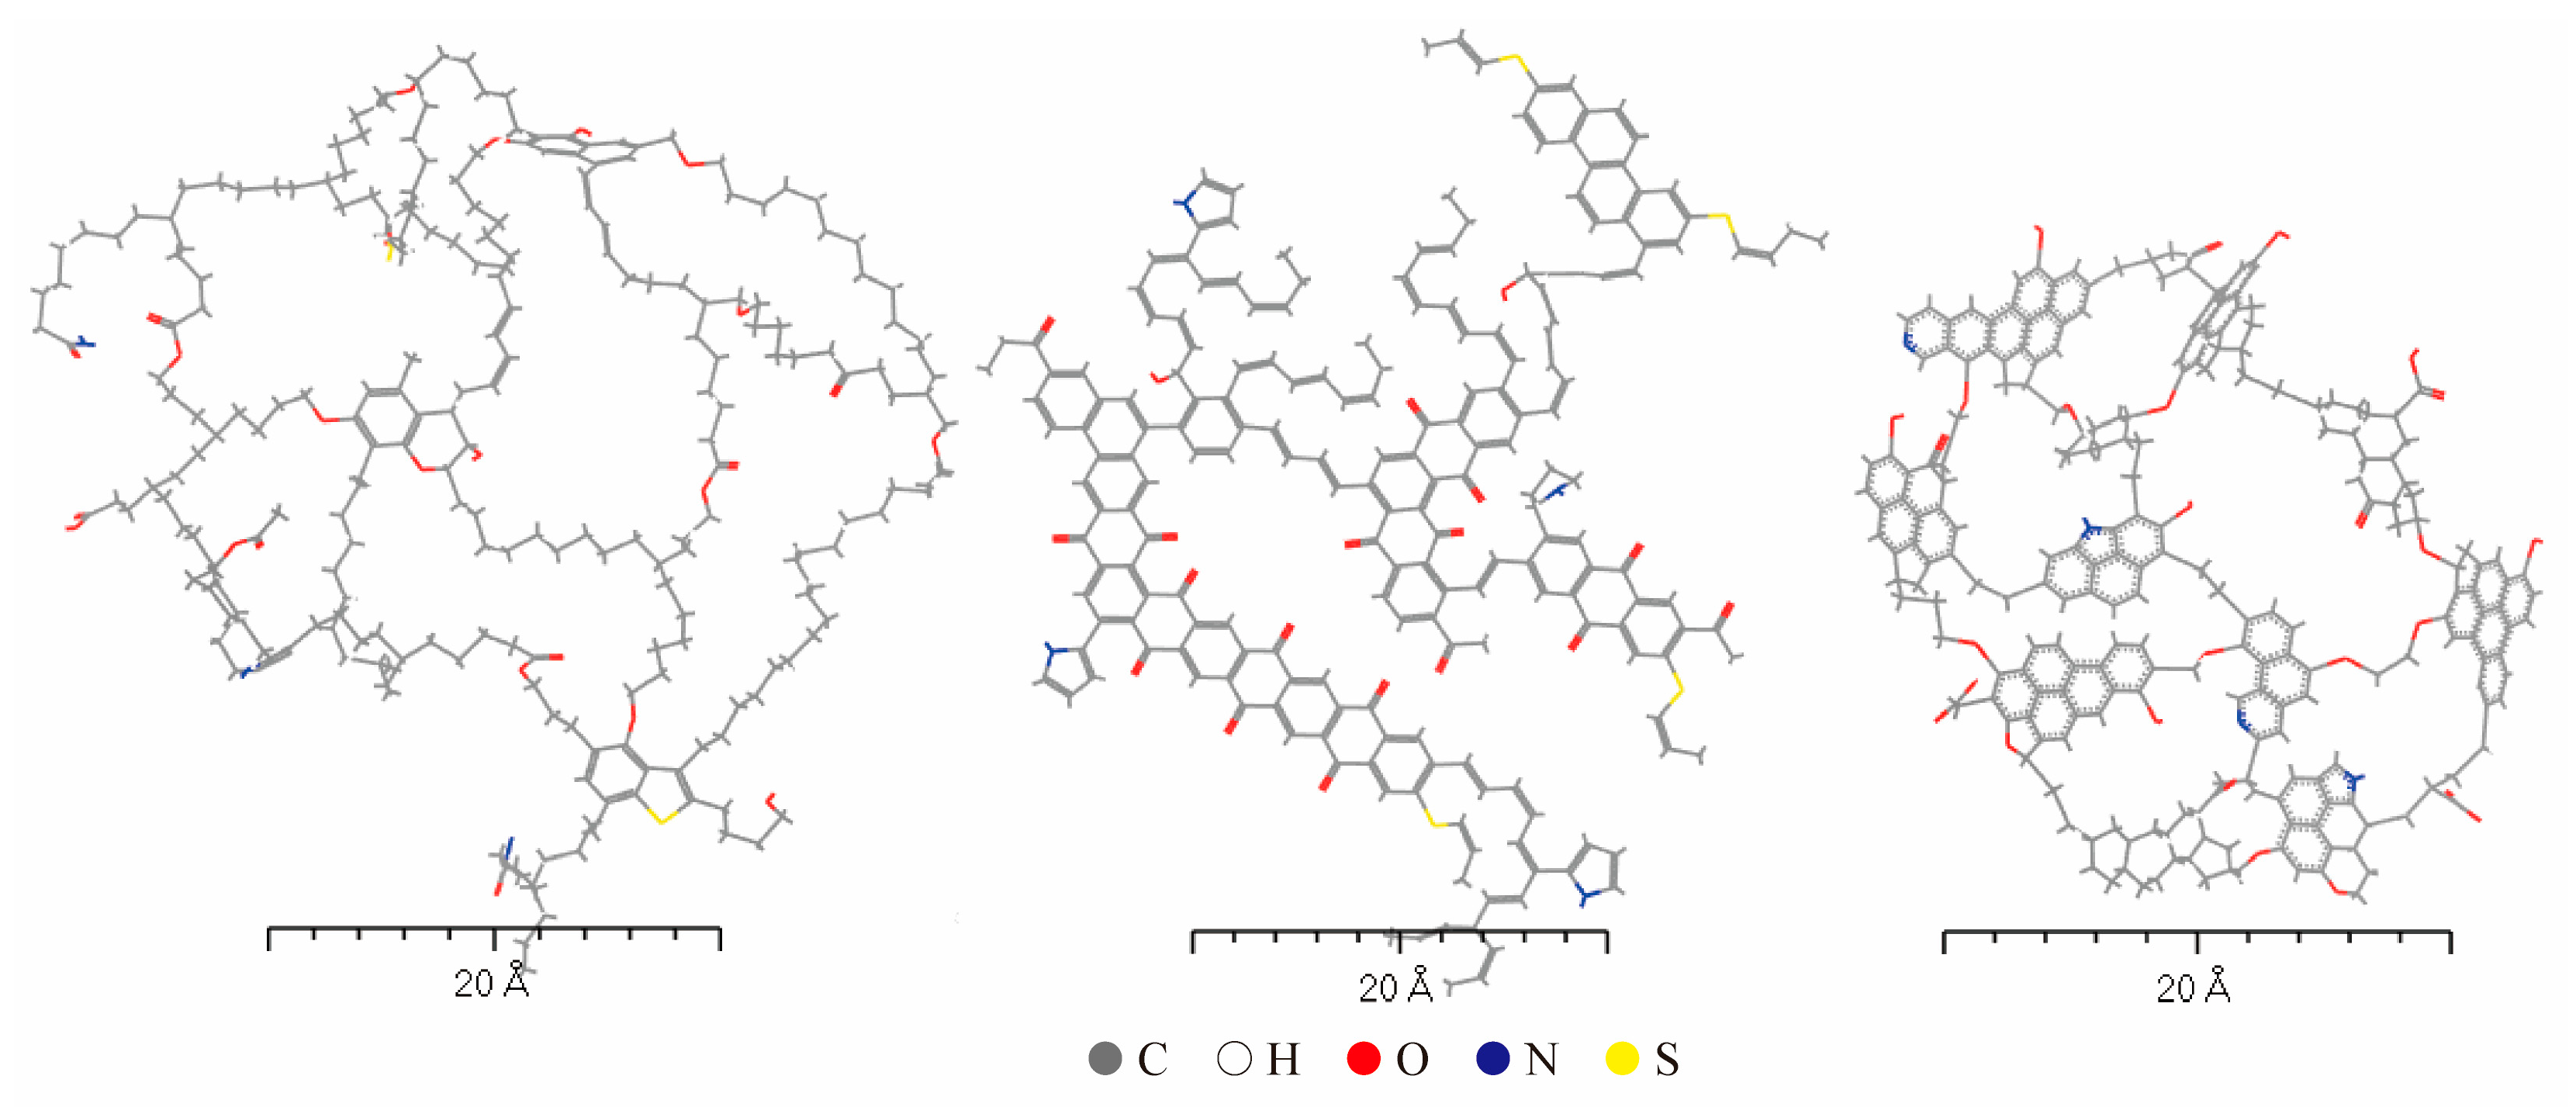
The properties of kerogen molecules vary significantly depending on their formation environment and source. Even when the molecular weight of the model exceeds 10,000, it remains insufficient to systematically and comprehensively describe kerogen. Therefore, when constructing models, it is neither practical nor necessary to account for every detail. Instead, average molecular structures are typically employed to represent the physicochemical properties and structural characteristics of kerogen. In this study, based on the relevant literature, average molecular structures of sapropelic (Type I) [15], mixed (Type II) [16], and humic (Type III) [17] kerogen were constructed, as illustrated in Figure 2. Among them, the sapropelic kerogen comes from the Longkou mine in Shandong, China, which is an immature shale, with plankton, lignin, and other fatty organic substances as its main constituents. The mixed kerogen comes from the Longmaxi Formation shale mines in Sichuan. The organic matter composition of the shale in this area is mainly dominated by Type II kerogen, formed by the mixed deposition of both aquatic organisms and terrestrial plants, influenced by tidal and river conditions. Humic kerogen is an immature organic matter shale typical of an Asian mine, deposited in a post-Jurassic deltaic environment, and its composition is dominated by organic matter-rich terrestrial vegetation, soils, and sediments, forming Type III kerogen.
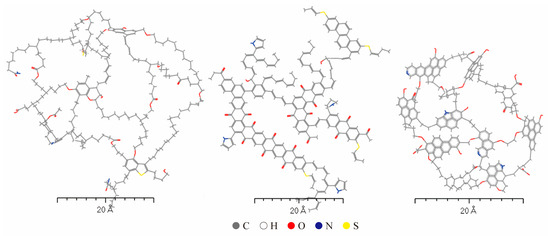
Figure 2.
Average molecular models of Type I, Type II, and Type III kerogen (from left to right).
The average molecular formulas for these kerogen types are , , and . Elemental analysis and functional group data were obtained using X-ray photoelectron spectroscopy (XPS) or carbon nuclear magnetic resonance (CNMR). Based on the elemental ratios, the total number of carbon atoms (ranging from 150 to 250) and the number of aromatic carbon atoms were determined, followed by the allocation of hydrogen, oxygen, sulfur, and nitrogen atoms. These atoms were then assigned to their corresponding functional groups based on nearest-neighbor elemental analysis results. The gNMR 4.0 software was then used to continuously simulate and adjust the constructed average molecular model until the simulated NMR spectrum closely matched the experimental results. The model parameters are shown in Table 2.
Table 2.
Parameters of different types of shale kerogen.
The average molecular models of the aforementioned kerogen types were structurally optimized using the Forcite module. The COMPASS II force field was selected, with electrostatic and van der Waals interactions calculated using the Ewald and atom-based methods, respectively. The simulation was run for 50,000 steps to achieve the lowest energy configuration. Subsequently, 10 optimized average molecular models of kerogen were selected, and unit cells were constructed using the Amorphous Cell module based on the Monte Carlo method with random distribution. The initial density of the unit cells was set to 0.5 g/cm3, the temperature was maintained at 298 K, and periodic boundary conditions were applied.
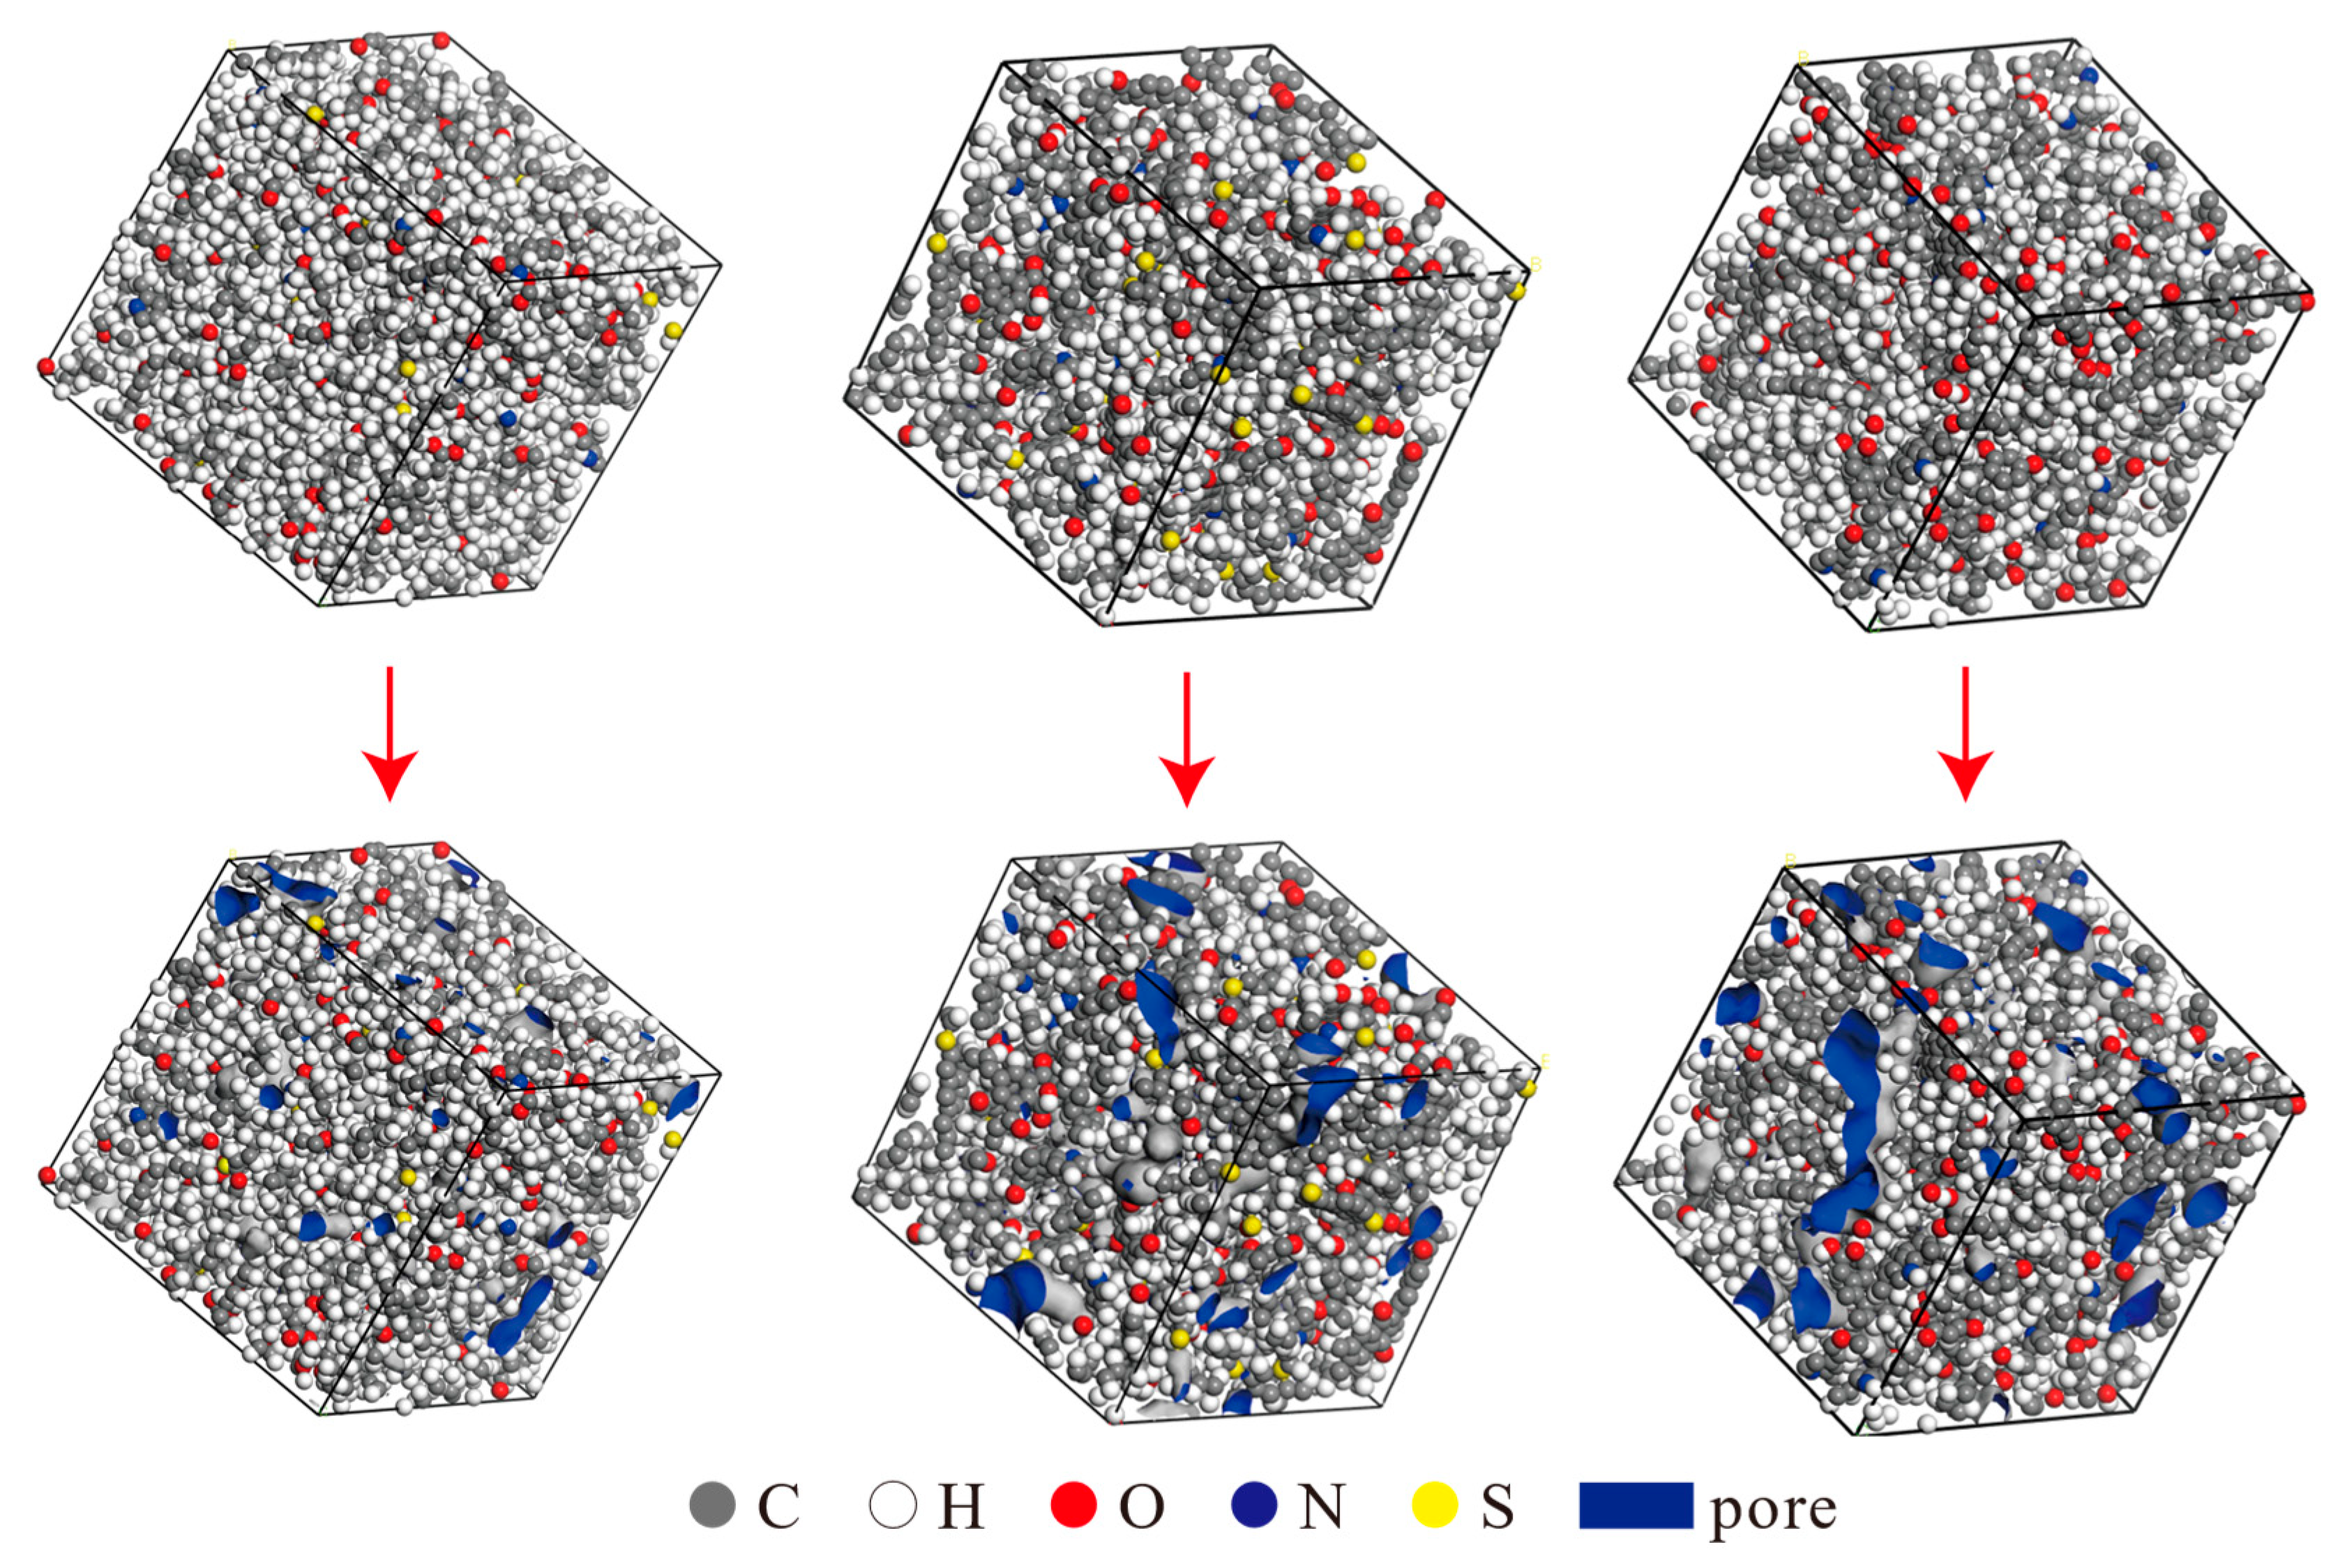
The constructed three-dimensional unit cell models were further optimized using the Forcite module to minimize energy. The final densities of the unit cells were determined using the Dynamics function in the Forcite module. The resulting densities were 0.997 g/cm3 for Type I kerogen, 1.124 g/cm3 for Type II kerogen, and 1.162 g/cm3 for Type III kerogen, which align well with the actual density ranges of the corresponding kerogen types. The models were then subjected to relaxation and annealing using the Forcite module to obtain the final equilibrium structures, as illustrated in Figure 3 (top). Unlike the simplified model of graphene, this model is constructed strictly based on the actual elemental ratio of kerogen and uses molecular dynamics optimization to ensure that the model’s density matches that of real kerogen molecules. Furthermore, the model fully retains the irregular pore distribution characteristics of kerogen, avoiding issues such as narrow-pore models with simplified pore shapes that lead to a single pore type and a density lower than the actual situation. Additionally, the kerogen unit cell model in this paper focuses on the tiny pores within the kerogen matrix rather than the intermolecular slit-like gaps, which better aligns with the research needs of shale gas occurrence mechanisms. All subsequent simulations in the paper are based on this model.

Figure 3.
Three-dimensional unit cells and corresponding pore distributions of Type I, Type II, and Type III kerogen (from left to right).
Figure 3 (below) shows the pore distribution map of the kerogen unit cell. The pore parameters were measured using the molecular probe method. Since the diameter of methane is approximately 3.8 Å, it is commonly accepted that pore diameters larger than 4 Å are considered effective pore sizes, so the Connolly radius was selected to be 2 Å. The parameter values are shown in Table 3. The results indicate that, from Type I to Type III kerogen, the pore size distribution exhibits a trend of transitioning from smaller to larger sizes, which is consistent with the geological evolution of kerogen and confirms the reliability of the model. The unit cell structure is reasonable, and therefore, all subsequent simulations were based on this optimized unit cell structure.
Table 3.
Unit cell structure parameters of three-dimensional kerogen.
3. Simulation Process
3.1. Grand Canonical Monte Carlo Method
The simulation involved constructing models using molecular dynamics and performing adsorption simulations using the Grand Canonical Monte Carlo (GCMC) method [12]. The Monte Carlo method, based on statistical mechanics, is widely employed to study and analyze distribution characteristics. Given the stochastic nature of shale gas adsorption in pores, this method is particularly suitable for adsorption research. The grand canonical ensemble is commonly used in conjunction with Monte Carlo adsorption simulations. In this ensemble, for each computational cycle, the temperature (T), volume (V), and chemical potential (μ) remain constant, while the energy and number of molecules are continuously updated. Consequently, the partition function [18] of this ensemble can be expressed as:
During the simulation process, methane gas is added, replaced, or removed with different probabilities. These operations are described as follows:
A molecule is randomly added, and the probability of acceptance is as follows:
A molecule is randomly replaced, and the probability of acceptance is as follows:
A molecule is randomly removed, and the probability of acceptance is as follows:
Here, is the volume of the model, m3; is the de Broglie wavelength of the particles in the model, m; is the Boltzmann constant, J/(mol·K); is the absolute temperature, K; are functions of and ; μ is the chemical potential of the particles, J/mol; is the total energy of the system, J/mol; is the total number of particles in the system; and s and s′ represent the configurations before and after the displacement, respectively. During the simulation, if the probability of any particle change exceeds a randomly generated number within the range [0, 1], the change is accepted, and a new configuration is generated to replace the original one.
3.2. Fugacity–Pressure Conversion
In Material Studio, the chemical potential is a function of fugacity, so the choice of pressure in simulations is mainly represented in terms of fugacity. Compared to pressure, fugacity provides a more comprehensive consideration of non-ideal adsorption behaviors, representing the escape ability and driving force of a gas in a given state. This is particularly significant under supercritical conditions, where the fugacity–adsorption amount correlation is more pronounced than that of pressure. The accuracy of fitting high-pressure adsorption isotherms is crucial. However, in practical experiments, due to experimental limitations, pressure parameters are usually used to characterize shale adsorption amounts, among other variables. To compare the simulation results with existing conclusions and verify the model’s accuracy, it is necessary to convert the simulated fugacity parameters into the corresponding pressure parameters. The fugacity–pressure conversion in this paper is based on the Peng–Robinson (PR) equation [19]. Its complete form is as follows:
The equation can be rewritten in terms of the compressibility factor as follows:
where
By combining this with the thermodynamic relations, we ultimately obtain the following:
In the equation, P* is the pressure, MPa; R is the gas constant, 8.314 J (mol·K); T is the temperature, K; V is the molar volume, m3/mol; bi is volume parameter, m3/mol; Z is the compression factor; Ai and Bi are dimensionless parameter related to and ; is the temperature-dependent energy parameter, Pa·m6/mol2; and is the fugacity at , with units in MPa.
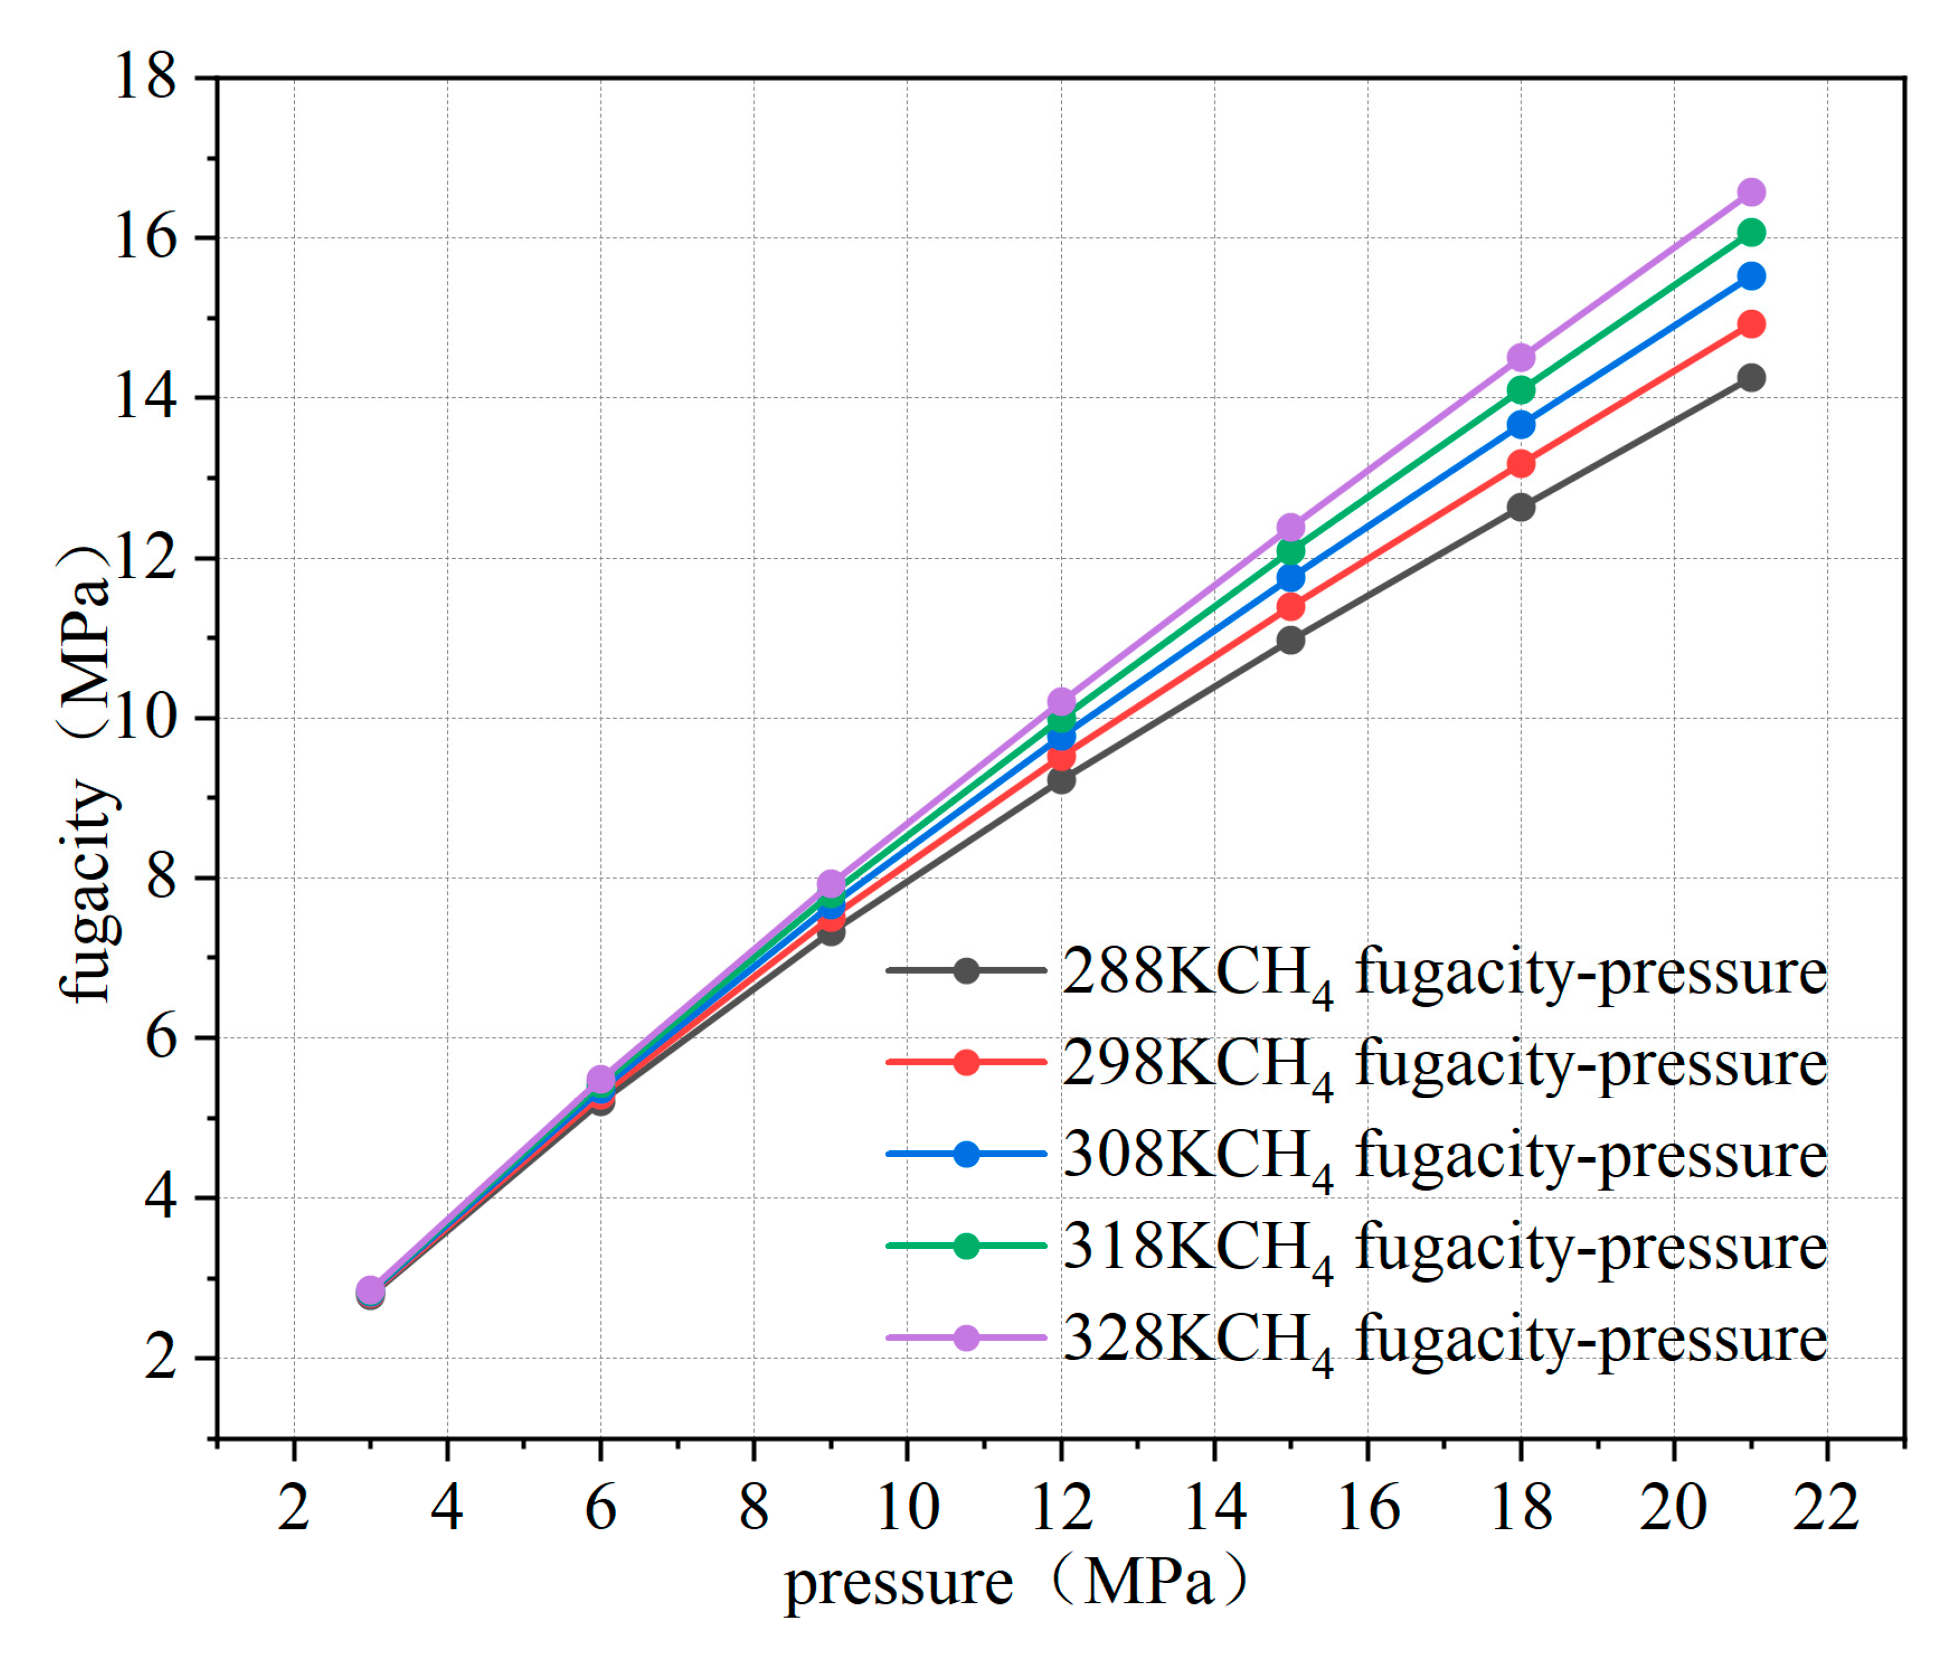
Using MATLAB R2020b software, the fugacity of methane was calculated, and the relationship curve between fugacity and pressure was obtained, as illustrated in Figure 4. From the fitting results, it is evident that below 8 MPa, the fugacity of methane closely approximates the pressure. However, as the pressure increases, the fugacity becomes lower than the pressure. This is because, as pressure increases, the kinetic energy and interactions between gas molecules intensify, leading to a greater tendency for the gas to escape. However, since the methane used is not an ideal gas, the repulsive and attractive forces between molecules affect its behavior. Therefore, the increase in the escape tendency is smaller than the increase in pressure. When the temperature rises, the escape tendency also increases, as temperature enhances the kinetic energy and interactions of gas molecules. Especially for non-ideal gases, higher temperatures make it easier for the gas to overcome molecular interactions, leading to an increased tendency to escape into the external environment. This discrepancy between fugacity and pressure highlights the differences between Fick’s diffusion law and Darcy’s seepage law in describing the seepage characteristics in porous media. In this paper, microscopic diffusion properties are investigated, and it is more appropriate to use Fick’s law of diffusion to characterize percolation in porous media.
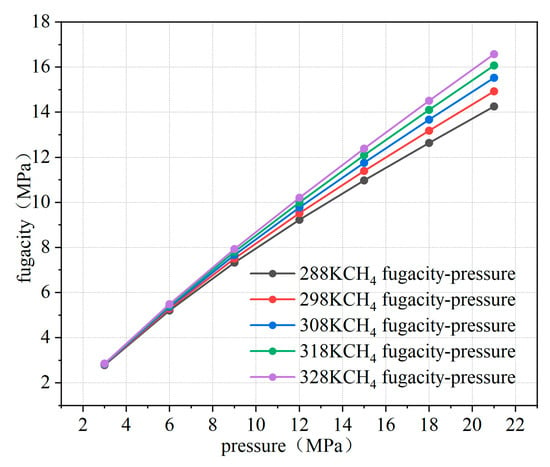
Figure 4.
Relationship between fugacity and pressure at different temperatures.
3.3. Model Validation and Adsorption Simulation
The accuracy of the constructed kerogen models directly determines the reliability of the simulation results. Ensuring the precision of the adsorption results is a fundamental prerequisite for the simulation. In this study, adsorption simulations were conducted using the Sorption module in Material Studio, with fugacity values selected in the range of 1 MPa to 20 MPa. By converting the fugacity parameters of the isothermal adsorption curve, calculated by the Sorption module, into pressure parameters and fitting them with other isothermal adsorption models, it is possible to verify the reasonableness of the adsorption simulation results. Given the non-uniform surface of the internal pores in kerogen, the Freundlich adsorption model was employed to fit the adsorption isotherms. The Freundlich formula is expressed as follows [20]:
where is the pressure in MPa, and is the absolute adsorption amount in mmol/g. and are the equation coefficients, with related to the specific surface area and adsorption temperature of the model, and also related to the adsorption temperature. Since the adsorption amount in the adsorption isotherms plotted by the Sorption module is the specific number of methane molecules adsorbed in a single unit cell, with the unit being average molecules/cell, it is necessary to convert the methane units to mmol/g before fitting. The conversion formula is as follows:
The parameters and in the Freundlich (11) model vary depending on the type of kerogen. Here, is the Freundlich adsorption constant, representing the adsorption capacity. Typically, the range of values is 0.3–0.7 for sapropelic kerogen (Type I), 0.5–1.0 for mixed kerogen (Type II), and 0.8–1.5 for humic kerogen (Type III). This increasing trend is directly related to the increase in the aromaticity and functional group content of the kerogen. The parameter represents surface heterogeneity, with values usually greater than 1. A larger value indicates greater surface non-uniformity of the kerogen.
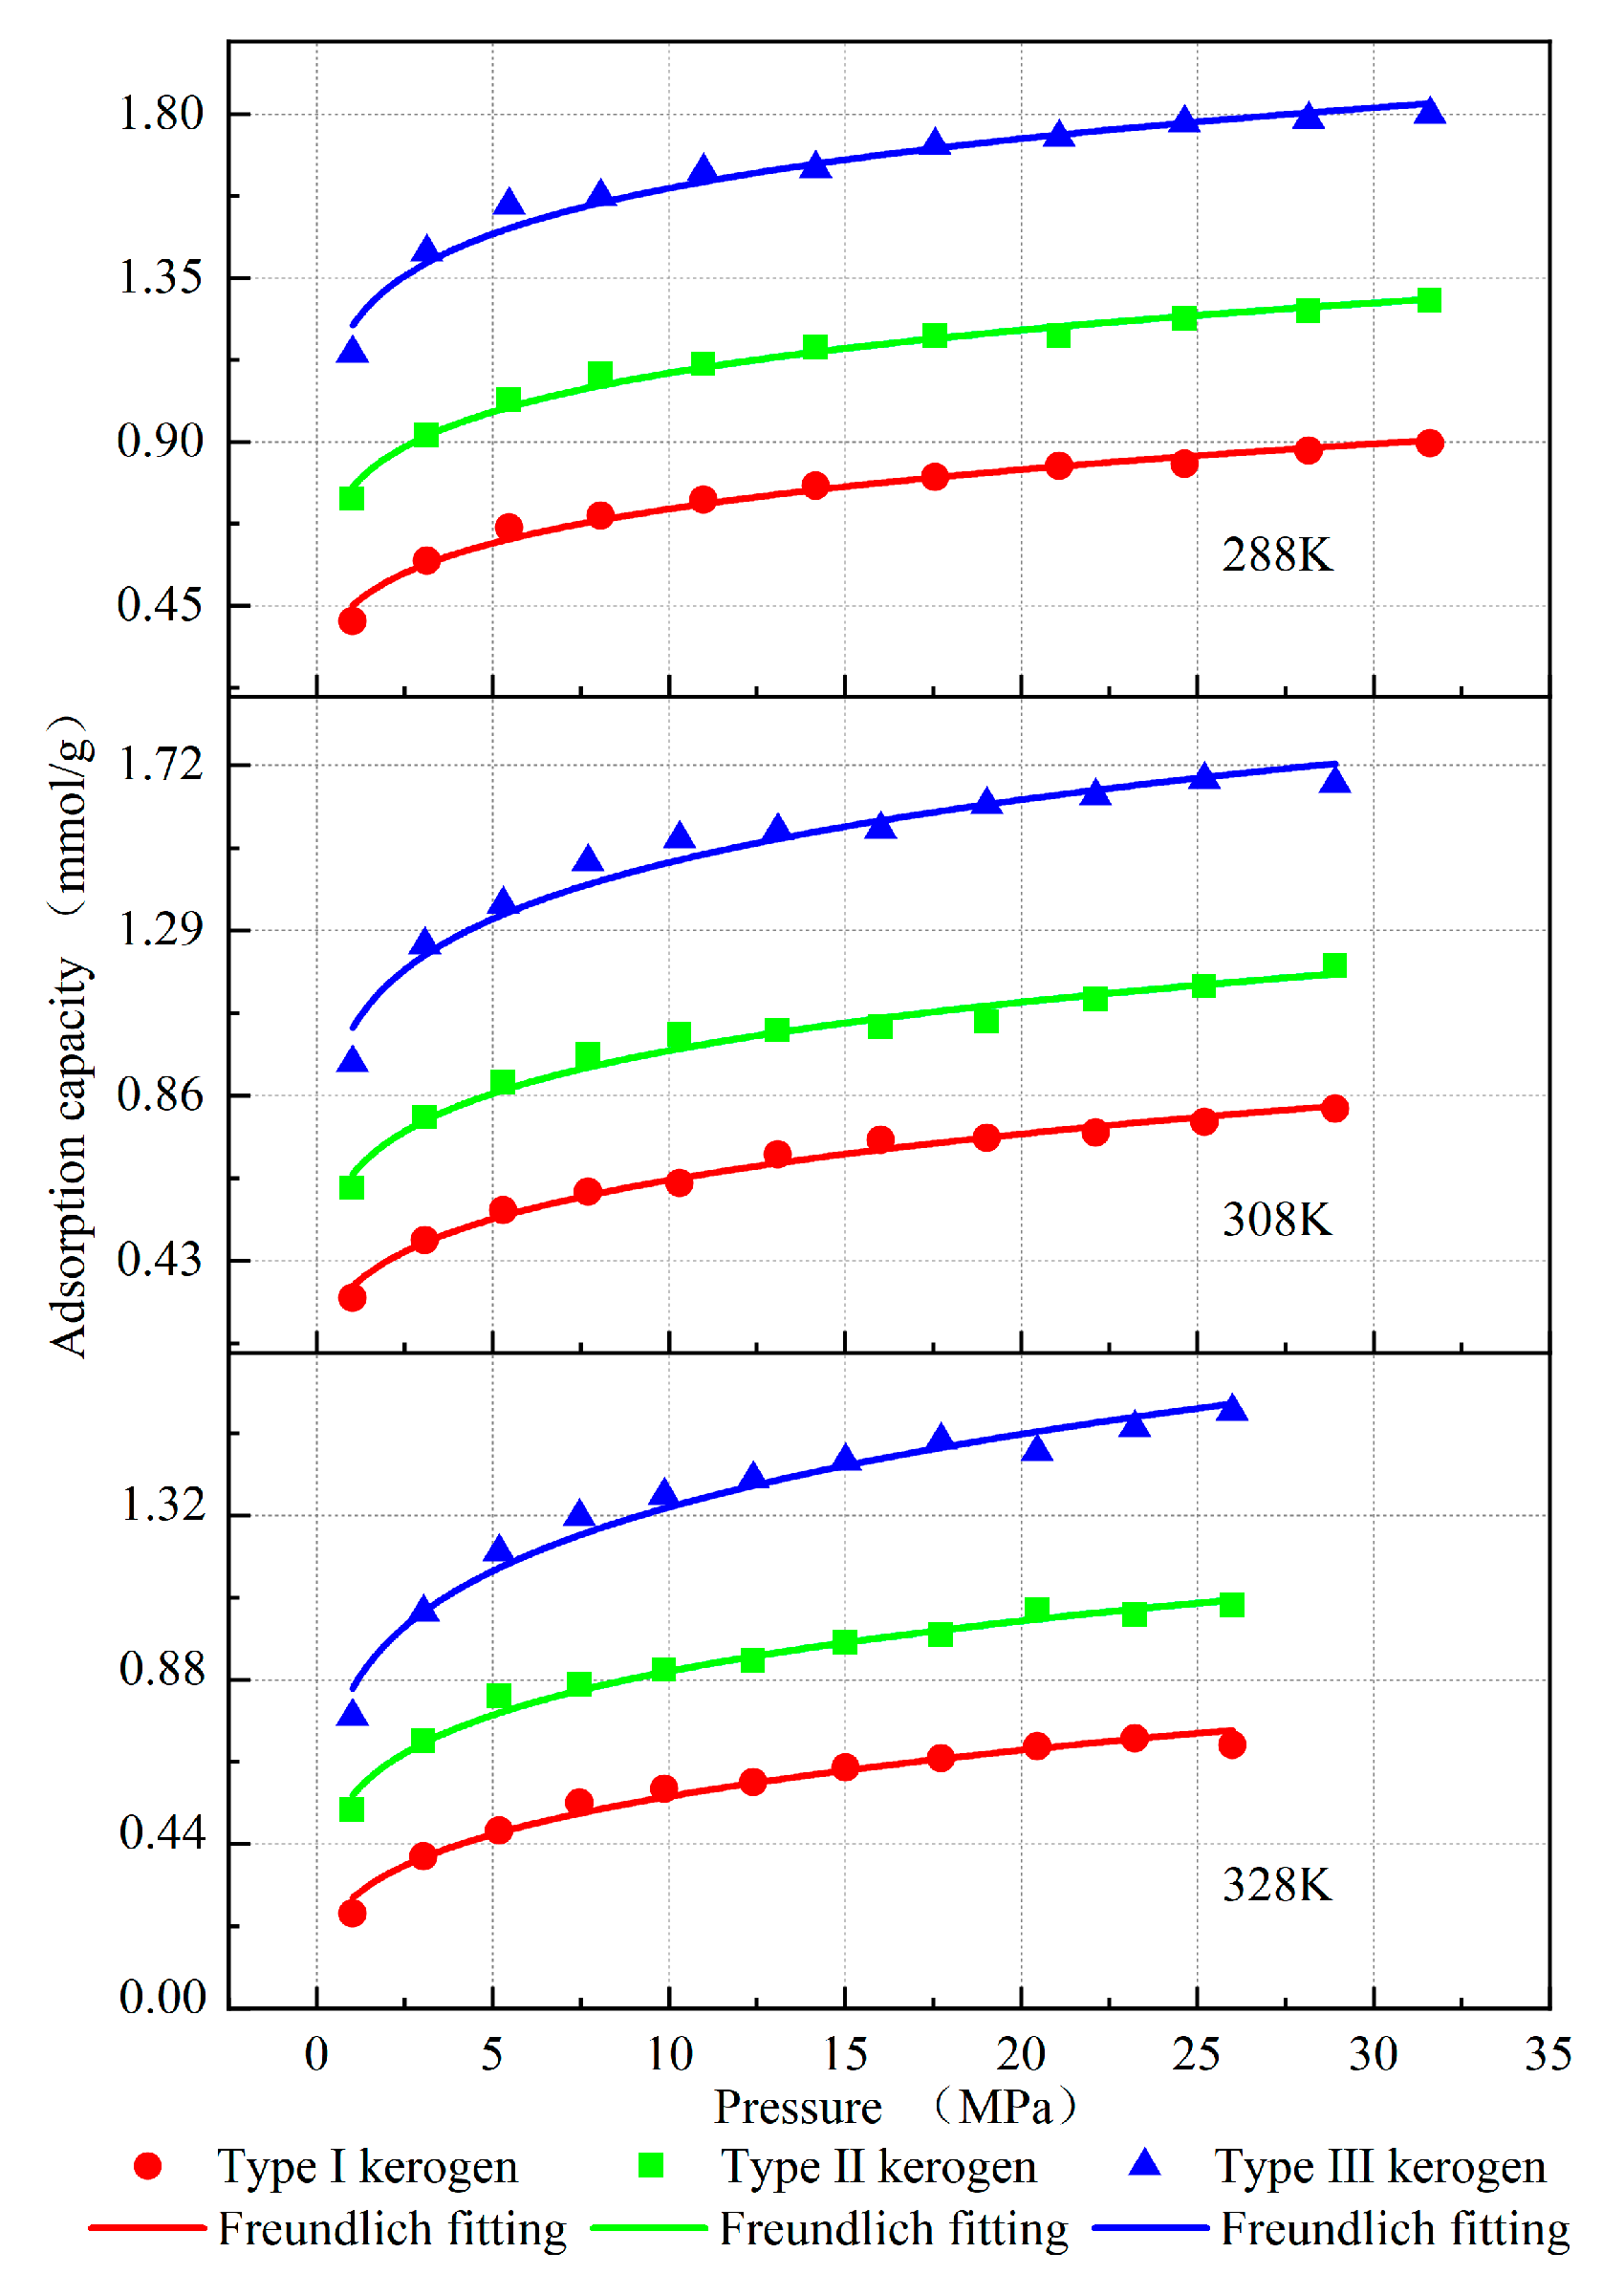
A random value was selected as the initial value based on the corresponding distribution range of the Freundlich parameters for different types of kerogen, and iterative fitting was performed using Origin 2021 software. The best-fit results and corresponding parameter values were subsequently obtained. The results demonstrate that the adsorption behavior of the kerogen models constructed in this study adheres to the Freundlich adsorption law, as illustrated in Figure 5. The relevant fitting parameters are summarized in Table 4. The variations in parameters K and n are higher for high-type kerogen compared to low-type kerogen, which is consistent with the changes in parameters across different kerogen types. Furthermore, since the average molecular model used in the compositional model is correct, and the atomic composition aligns with the actual kerogen molecules, as well as the structural parameters, density, and porosity matching those of the kerogen molecules, it is concluded that the model is correctly constructed.
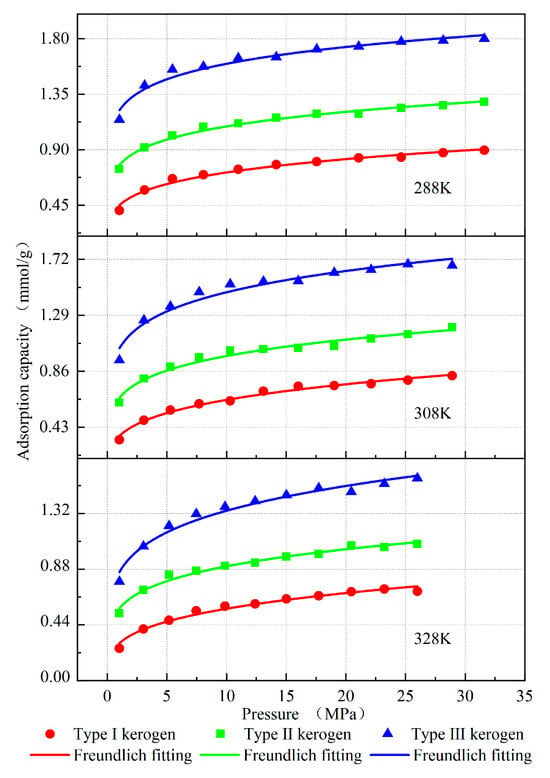
Figure 5.
Desorption isotherms of kerogen fitted with the Freundlich model.
Table 4.
Parameters of the Freundlich model fitted to the kerogen adsorption isotherms.
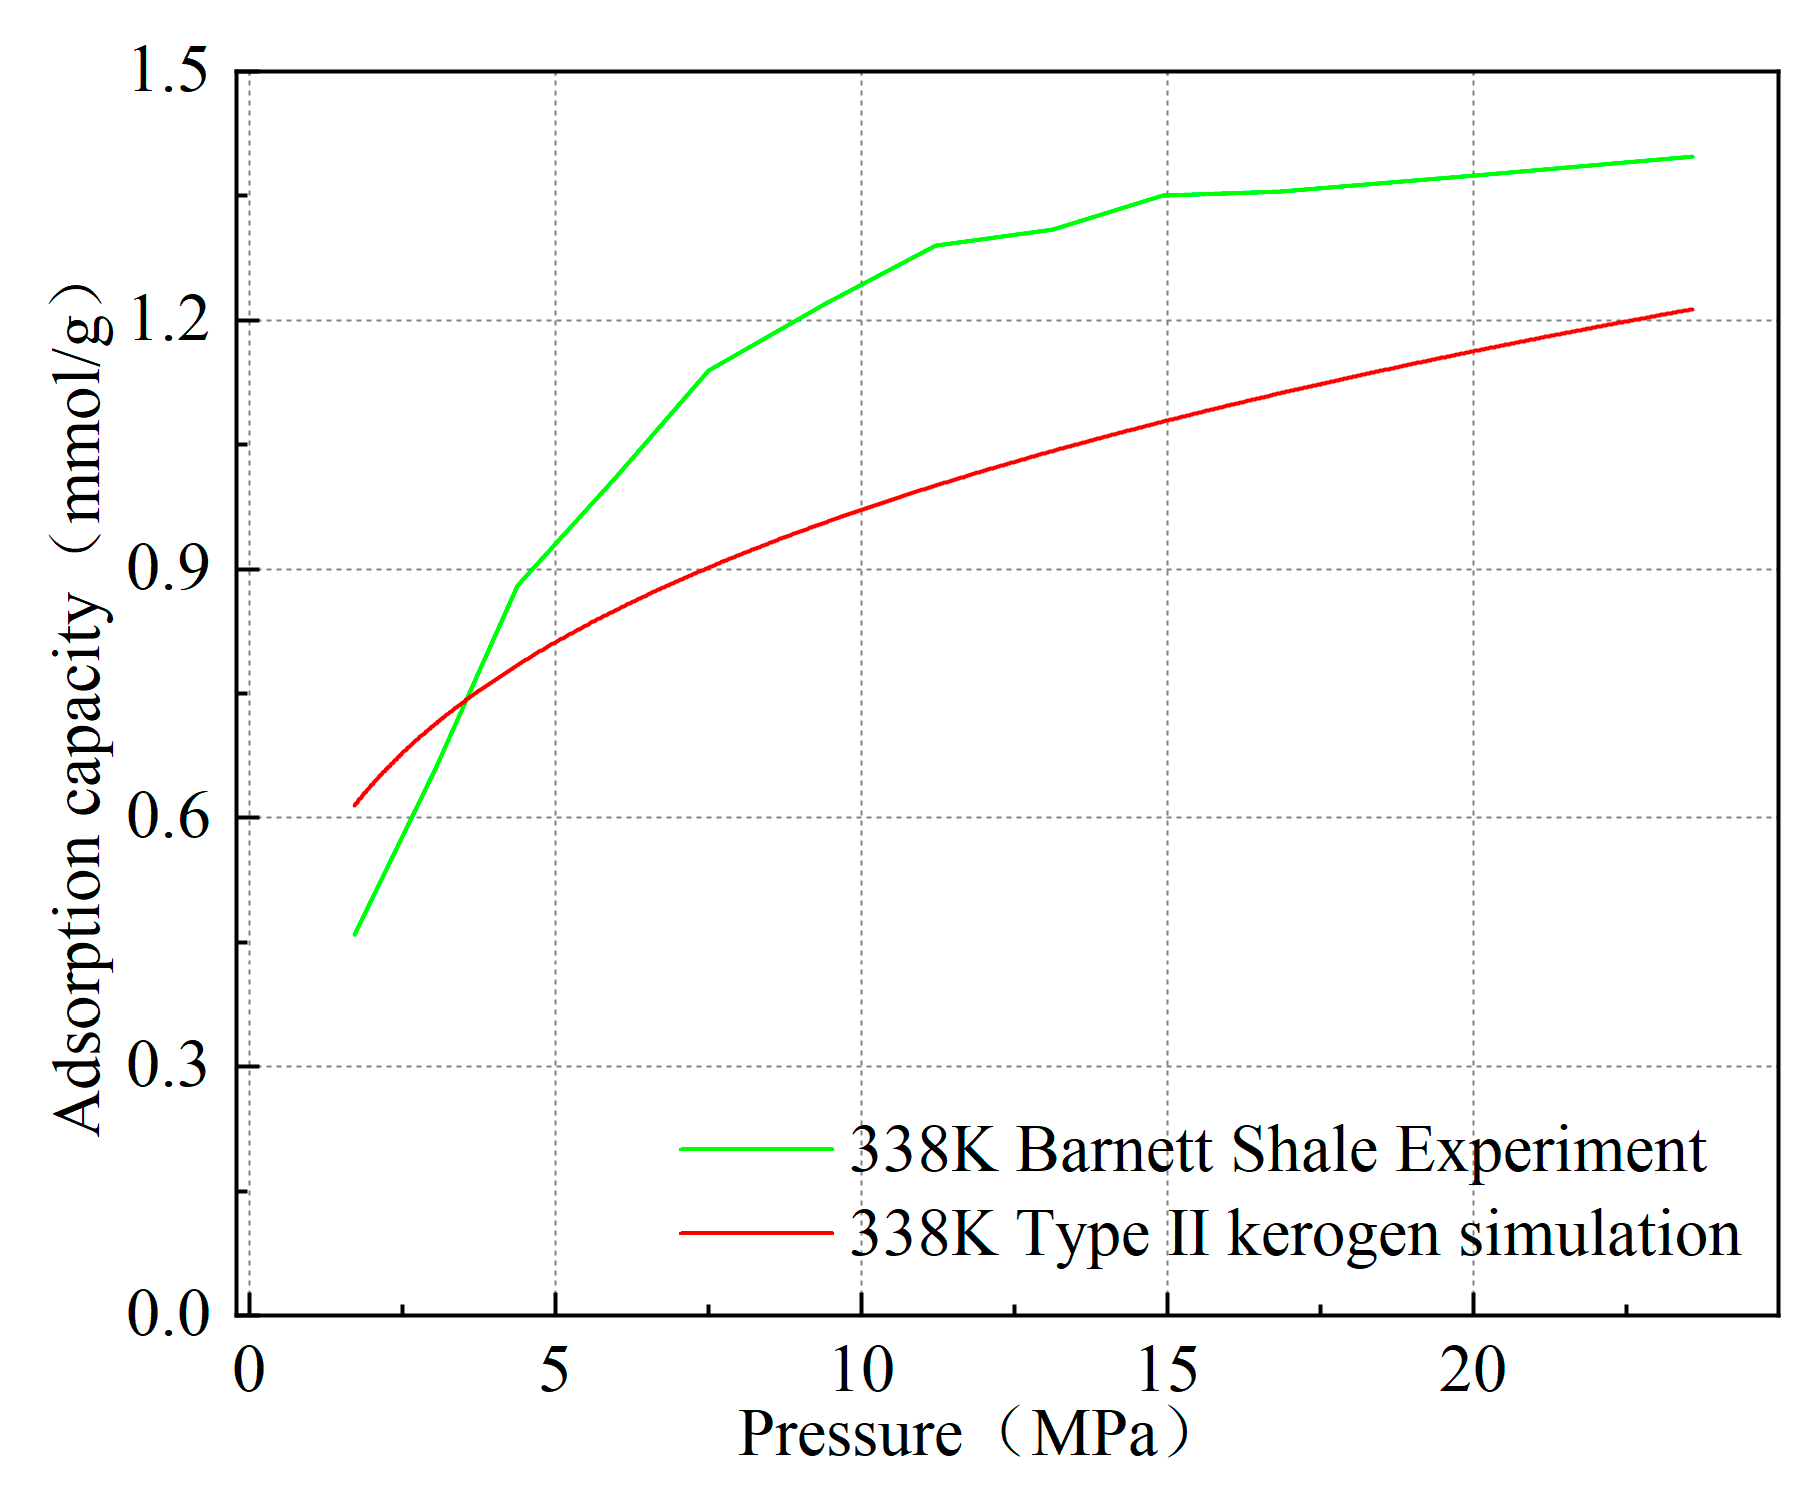
Furthermore, since the model constructed in this study is a microscopic kerogen model at the molecular scale, with dimensions smaller than 4 nm, the pores in the model primarily exist as micropores. As a result, the adsorption results slightly differ from the macroscopic experimental adsorption quantities measured. As shown in Figure 6, taking Type II kerogen as an example at 338 K and 20 MPa, the simulated adsorption quantity of Type II kerogen is 1.162 mmol/g, while the experimental adsorption quantity for Barnett shale, which is primarily composed of Type II kerogen, reaches 1.374 mmol/g. The adsorption quantity for kerogen with the same mass, simulated under high-pressure conditions, is slightly lower than the macroscopic adsorption quantity measured in the laboratory [21]. However, at 3MPa, the simulated adsorption quantity is 0.714 mmol/g, while the experimental adsorption quantity is 0.632 mmol/g. This difference reflects the unique properties of micropore adsorption. The limitation in model size leads to the dominance of micropores during adsorption, resulting in slightly smaller simulated adsorption at high pressure compared to the macroscopic experimental results, while at low pressure, the simulated adsorption is slightly larger. This also serves as strong evidence to verify the rationality of the model.
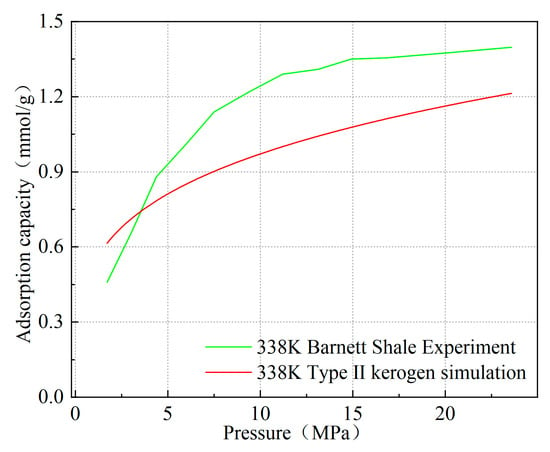
Figure 6.
Comparison of simulated isotherms of kerogen at 338 K with experimental data from shale corresponding to kerogen types.
Moreover, as pressure increases, the simulated adsorption quantity exhibits a trend nearly identical to the experimental adsorption quantity, which is highly consistent with previous works, especially the conclusions of Zhang [22] and others, who found that methane adsorbs onto kerogen through surface adsorption and pore-filling adsorption, with pore filling being the dominant form of adsorption. At the same time, the maximum value of the simulated methane adsorption phase density reaches 0.385 g/cm3, which is close to the commonly used experimental adsorption phase density value of 0.373 g/cm3 (van der Waals density) and the previously measured adsorption phase density value of 0.377 g/cm3, further validating the reliability of the model [23,24]. The slightly higher value is due to the micropores having a larger specific surface area, which leads to a cumulative adsorption effect and stronger adsorption capacity. These mutually corroborating pieces of evidence, from molecular structure to macroscopic properties, comprehensively demonstrate the correctness of the model construction and lay a solid theoretical foundation for the study of the microscopic adsorption mechanism of kerogen.
4. Results and Discussion
4.1. Adsorption Isotherms
The adsorption isotherm results demonstrate that, under identical pressure and temperature conditions, the methane adsorption capacity of kerogen follows the order: Type I < Type II < Type III (Figure 5). Humic kerogen (Type III) exhibits the highest methane adsorption performance, followed by mixed kerogen (Type II), while sapropelic kerogen (Type I) shows the lowest adsorption capacity. For instance, at a pressure of 29 MPa and a temperature of 308 K, the adsorption capacities are 0.825 mmol/g for sapropelic kerogen (Type I), 1.197 mmol/g for mixed kerogen (Type II), and 1.672 mmol/g for humic kerogen (Type III). The methane distribution at this time is shown in Figure 7, where the red dots represent the possible locations of methane. By analyzing the average molecular configurations, aromatic carbon ratios, and porosities of the three kerogen types, it is evident that their main carbon (C) content is comparable. However, the humic type, which is primarily composed of aromatic rings with a high aromatic carbon ratio and well-developed pore structures, enhances the van der Waals interaction with methane due to the aromatic ring π-electron system. This provides more high-energy adsorption sites and increases the adsorption capacity for methane. The sapropelic kerogen is mainly composed of fatty chains, with less developed pores and fewer active sites, resulting in the weakest adsorption capacity. The mixed-type kerogen has properties that lie between the two, and its adsorption capacity is also intermediate.
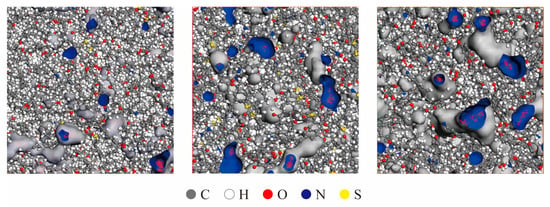
Figure 7.
Distribution of methane in the kerogen unit cell model.
The Freundlich model fitting parameters in Table 4 further validate this pattern. The kerogen of type III has the highest K value and n value, indicating stronger gas retention ability, a more uneven energy distribution on the surface, and more high-energy adsorption sites. The methane adsorption capacity of the three types of kerogen shows similar trends at different temperatures and gas pressures. Increasing pressure and lowering temperature both increase methane adsorption. However, the adsorption capacity of the three types of kerogen is stronger, meaning that a larger pressure drop or temperature increase is required for effective desorption. On the other hand, although the type I kerogen has a lower adsorption capacity, it is easier to generate gas. Therefore, in engineering practice, based on the above pattern, shale gas recovery can be improved by rationally increasing temperature, reducing pressure, and altering the kerogen pore structure through methods like hydraulic fracturing, pressure-reduction mining, or steam injection, depending on the type of kerogen.
4.2. Adsorption Energy
The adsorption energy data can intuitively reflect the methane adsorption capacity and the physicochemical nature of kerogen [25,26]. It is an important parameter in kerogen adsorption. It reflects the interaction between kerogen and methane, as well as the uniformity of the kerogen surface. It is one of the key indicators for assessing the difficulty of shale gas extraction.
4.2.1. Limiting Adsorption Energy
The limiting adsorption energy of methane is a key parameter that reflects the direct interaction between methane molecules and kerogen. The limiting adsorption energy quantitatively characterizes the interaction force between them. Typically, the limiting adsorption energy is calculated using the Henry constant, as described by the Van ’t Hoff equation [27]:
Integrating both sides yields:
In the equation, represents the Henry constant; denotes the limiting adsorption heat, kJ/mol; and is the gas constant, 8.314 J/mol·K.
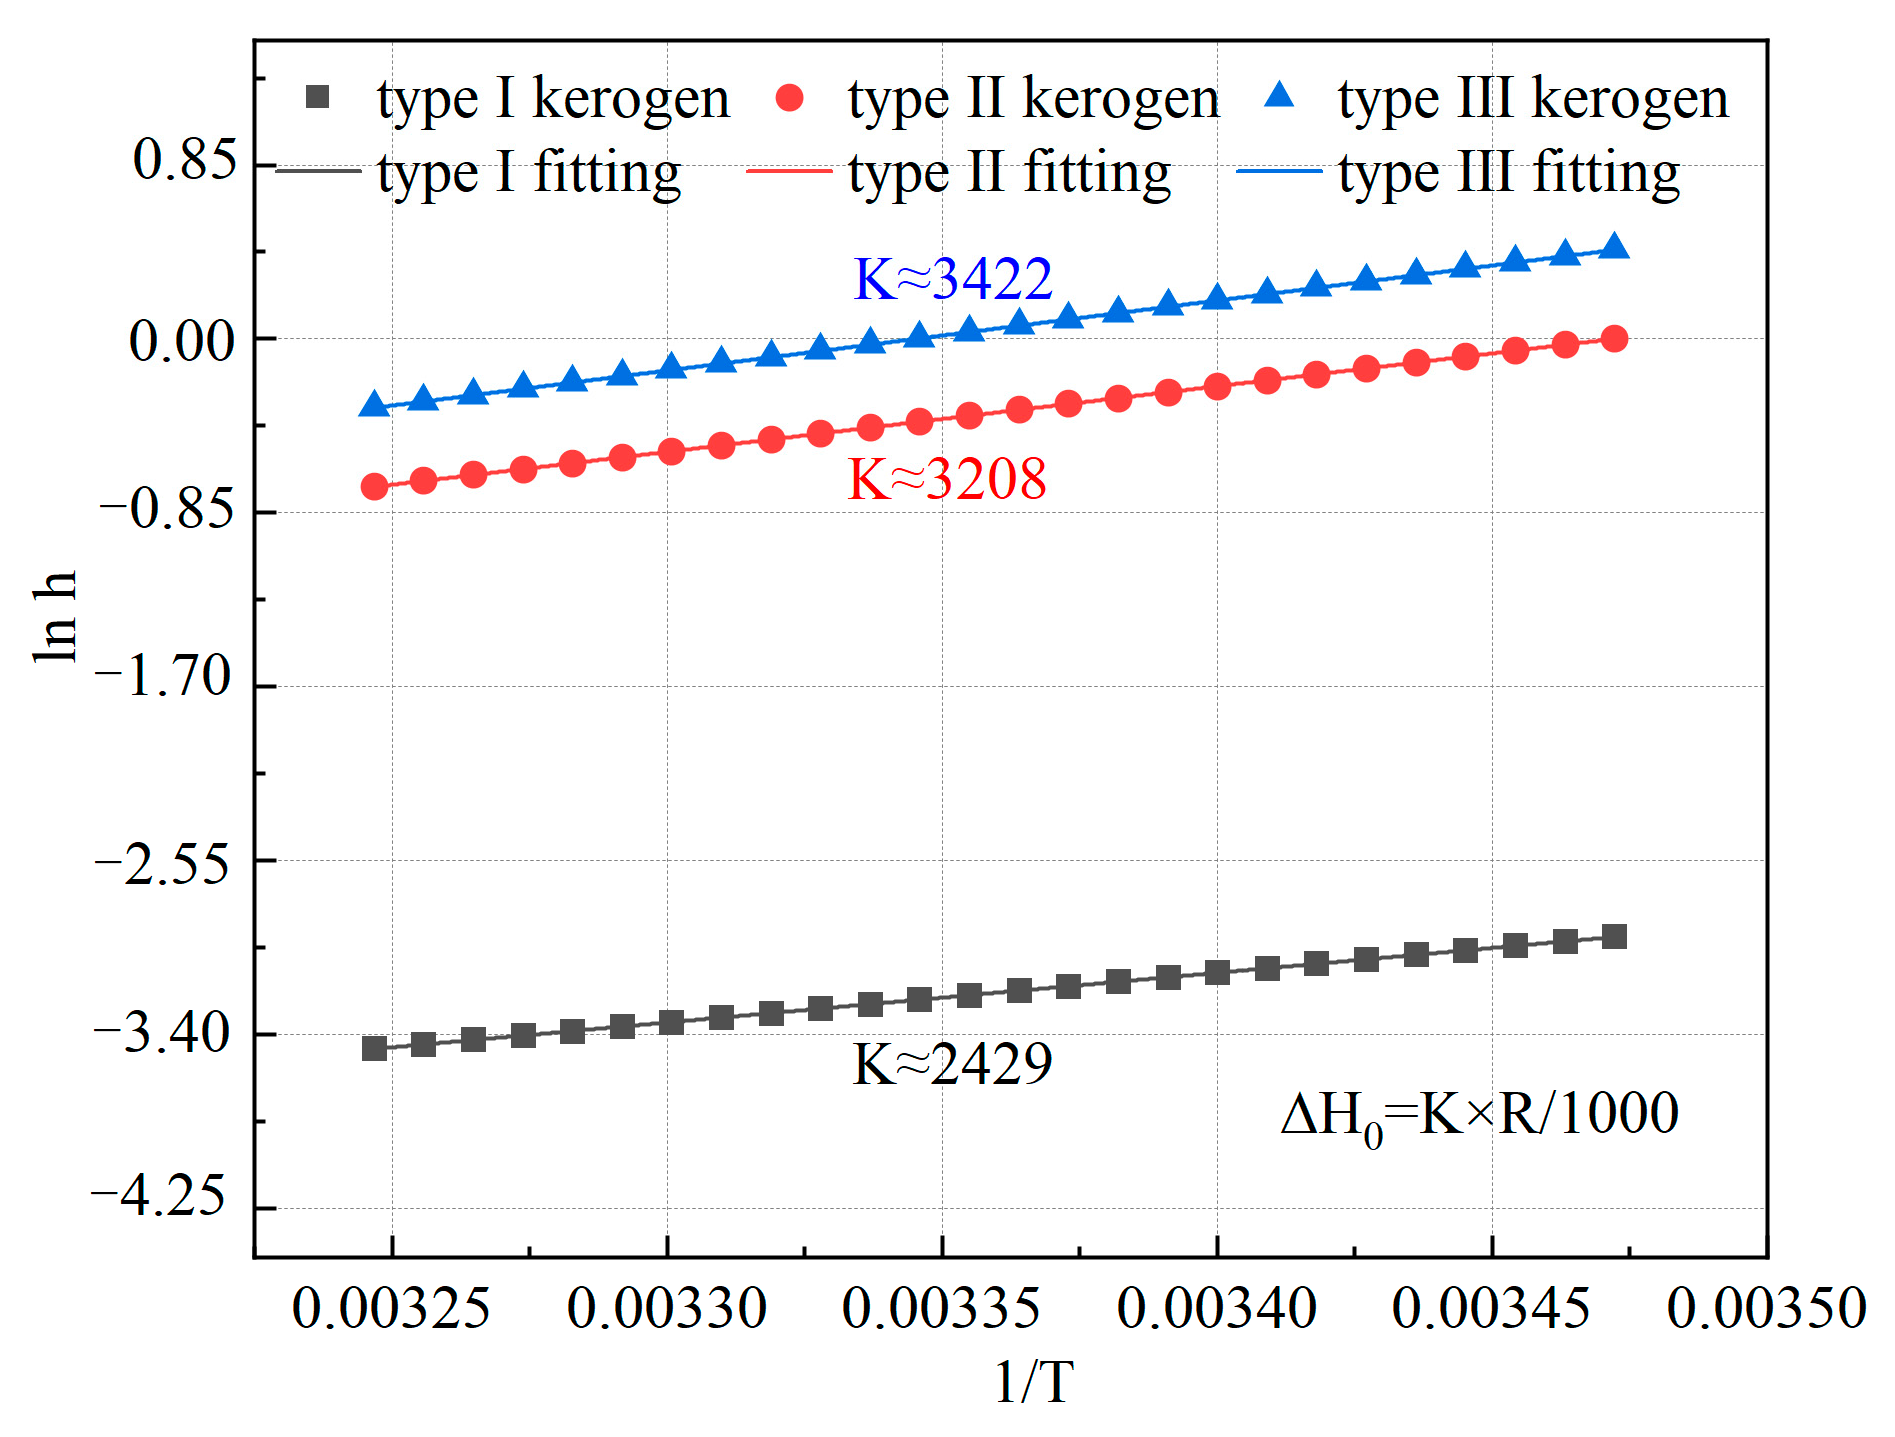
By plotting and , as shown in Figure 8, the isosteric heat of methane adsorption can be calculated from the slope. In this study, the Henry constants for the three types of kerogen were simulated, and the relationship between and for the three microscopic kerogen models was plotted. The slope was determined using Origin 2021 software for fitting. The calculated isosteric heats of adsorption for methane on the three types of kerogen models are 20.184 kJ/mol for Type I kerogen, 26.658 kJ/mol for Type II kerogen, and 28.436 kJ/mol for Type III kerogen. This result is consistent with the limiting adsorption heat values of 23.91 kJ/mol and 27.76 kJ/mol obtained by Yang et al. [28] from experiments on the black shale of the Lower Cambrian Niuetang Formation in the Sichuan Basin, as the limiting adsorption heat corresponds to a very low adsorption capacity. At this point, methane is mainly influenced by high-energy adsorption sites. Therefore, the microscopic model and macroscopic experiments show a high degree of comparability. The adsorption energy among the three types of kerogen follows the order: Type I < Type II < Type III. Additionally, the isosteric heats of adsorption for all three types of kerogen are below 40 kJ/mol, indicating that methane adsorption on these kerogen types is governed by physical adsorption. Furthermore, the heat of adsorption varies with the type of kerogen, and the extent of this variation aligns with the differences in adsorption capacity. This indicates that the organic matter type of kerogen is one of the key factors influencing methane adsorption behavior. Therefore, for high-type kerogen, targeted increases in temperature and fracturing intensity are required during shale gas extraction.
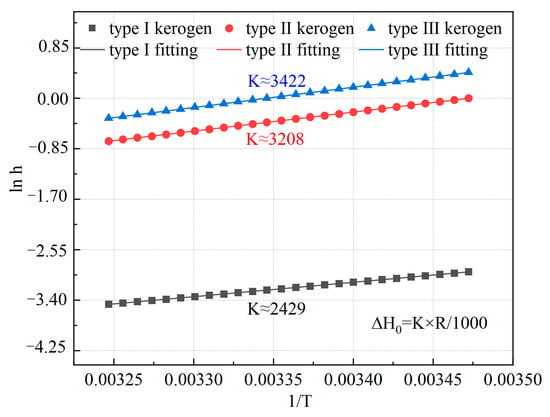
Figure 8.
Relationship between h and 1/T for the three types of kerogen models.
4.2.2. Isosteric Heat of Adsorption
The isosteric heat of methane adsorption on kerogen refers to the change in enthalpy when 1 mol of methane is adsorbed under conditions of constant adsorption pressure, temperature, and kerogen surface area [29]. Currently, precise measurement of the isosteric heat remains a significant challenge. In experimental studies, it is typically calculated using isothermal adsorption curves and the Clausius–Clapeyron equation (referred to as the C-C equation). However, due to the difficulty in accurately distinguishing between the adsorbed phase volume and the free phase volume of methane in laboratory settings, the isosteric heat calculated using the C-C equation may exhibit notable deviations [30]. In contrast, the microscopic kerogen models used in simulations feature small pore scales, where methane molecules within the pores are almost entirely in the adsorbed state. Consequently, the adsorption amount obtained from simulations is generally regarded as the absolute adsorption amount, and the adsorption phase volume of the kerogen models is equivalent to the pore volume of the kerogen. Therefore, the isosteric heat calculated using the C-C equation in simulations is considered to be more accurate compared to experimental results.
The C-C equation is as follows [31]:
By taking its derivative with respect to , we obtain:
In the equation, represents the isosteric heat of adsorption, kJ/mol; and is the gas constant. Similar to the isosteric heat of adsorption, by plotting and based on the adsorption isotherms, the isosteric heat of adsorption for the three types of kerogen can be calculated from the slope.
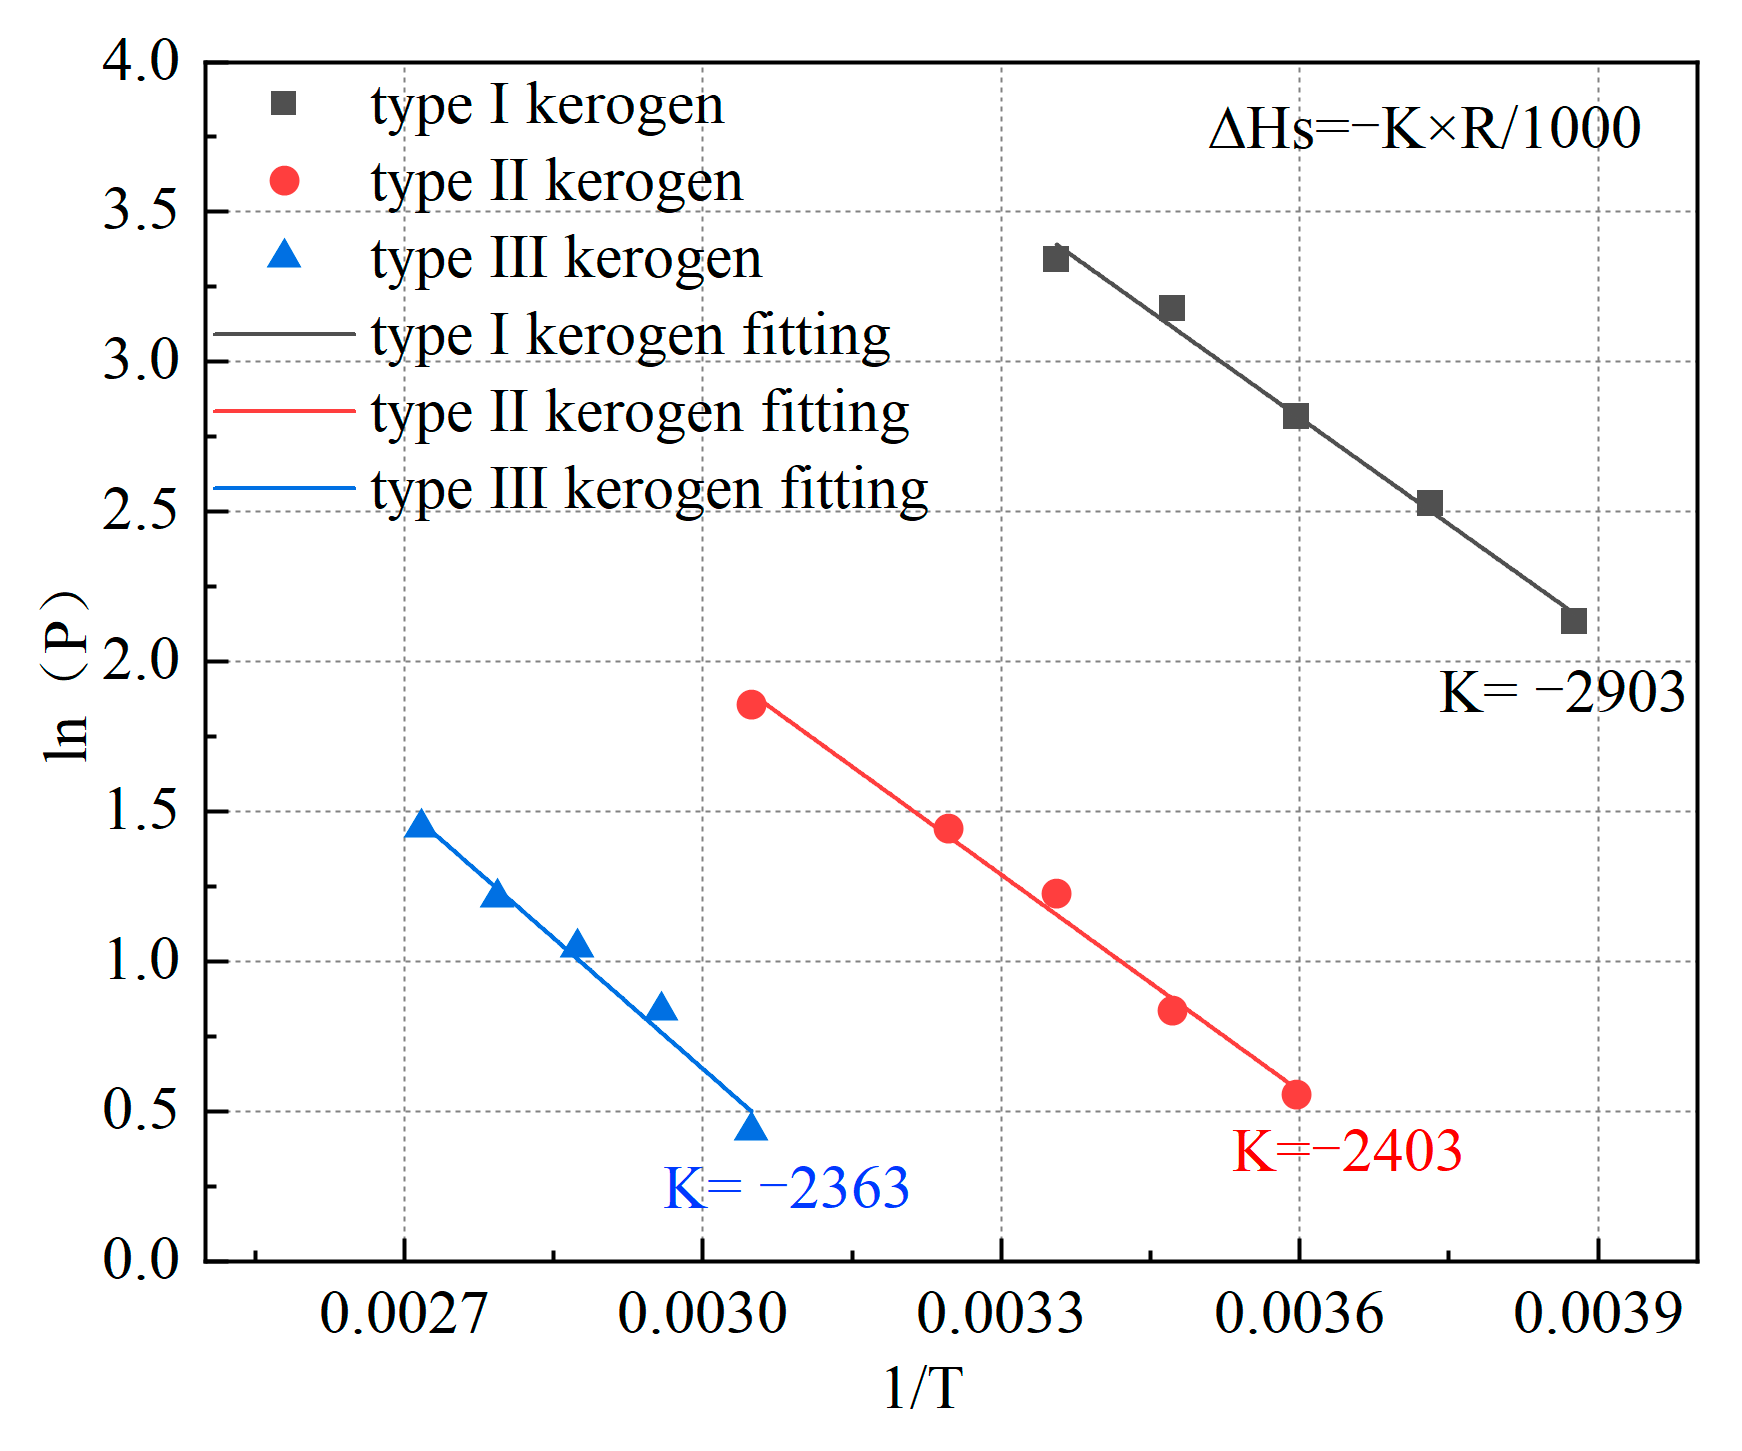
Based on the previously mentioned adsorption isotherms, the temperature corresponding to the adsorption of 0.85 mmol/g of methane by kerogen at different pressures was determined using Origin 2021 software. The relationship between temperature and corresponding pressure was plotted in Figure 9, and the slope was obtained through fitting. This enabled the calculation of the isosteric heat of adsorption for kerogen when adsorbing 0.85 mmol/g of methane. The isosteric heat of adsorption was found to be 19.645 kJ/mol for Type I kerogen, 19.978 kJ/mol for Type II kerogen, and 24.135 kJ/mol for Type III kerogen. Compared to the limiting adsorption energy, these values are relatively smaller because the isosteric heat of adsorption represents the heat generated when kerogen adsorbs methane at pressures approaching zero, where the adsorption amount is significantly lower than 0.85 mmol/g.
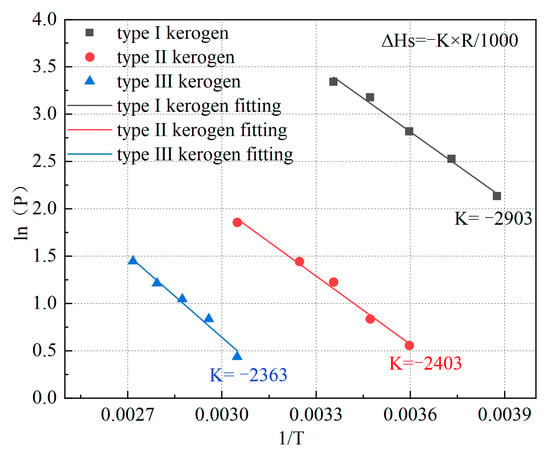
Figure 9.
Relationship between P and 1/T for the three types of kerogen models.
During the methane adsorption process on kerogen, methane molecules first adsorb onto high-energy adsorption sites. As the adsorption amount increases, subsequent adsorption occurs at low-energy sites, leading to a decrease in the average adsorption energy. Therefore, it is less than the limiting adsorption energy. In addition, the simulation results align with the CH4 equivalent adsorption heat values of 7.30 kJ/mol to 24.79 kJ/mol reported by Li et al. [32] for shale, but are closer to the upper limit, indicating that microporous kerogen has a stronger methane binding effect than the macroscopic experimental observations. This proves that high-energy adsorption of gas in micropores is the most difficult part to exploit in shale gas extraction. Therefore, when the adsorption amount is relatively high, efficient extraction can be achieved using conventional fracturing techniques [33], while when the adsorption amount is low, methods like thermal activation may be needed to promote desorption.
4.3. Impact of Adsorption on Unit Cell Deformation
When kerogen adsorbs methane, the volume and pore structure of kerogen molecules undergo changes due to interactions between kerogen molecules and methane molecules, as well as the energy generated during the adsorption process. These changes can significantly alter the gas storage capacity and permeability of shale gas reservoirs and may also impact the long-term stability of the reservoir. By studying the deformation effects of kerogen, it is possible to more accurately assess the characteristics of shale reservoirs and the risks associated with shale gas development environments. However, current research on shale deformation induced by adsorption remains limited and primarily relies on experimental methods. Accurately quantifying shale deformation poses significant challenges. Therefore, this study combines MD-GCMC (Molecular Dynamics–Grand Canonical Monte Carlo) simulations and molecular probe techniques to measure the deformation of the three types of kerogen during methane adsorption. Additionally, as previously mentioned, methane is primarily adsorbed in kerogen through pore filling. To ensure more accurate simulations, this section uses the amount of methane adsorbed per unit pore size of kerogen as the benchmark for simulation.
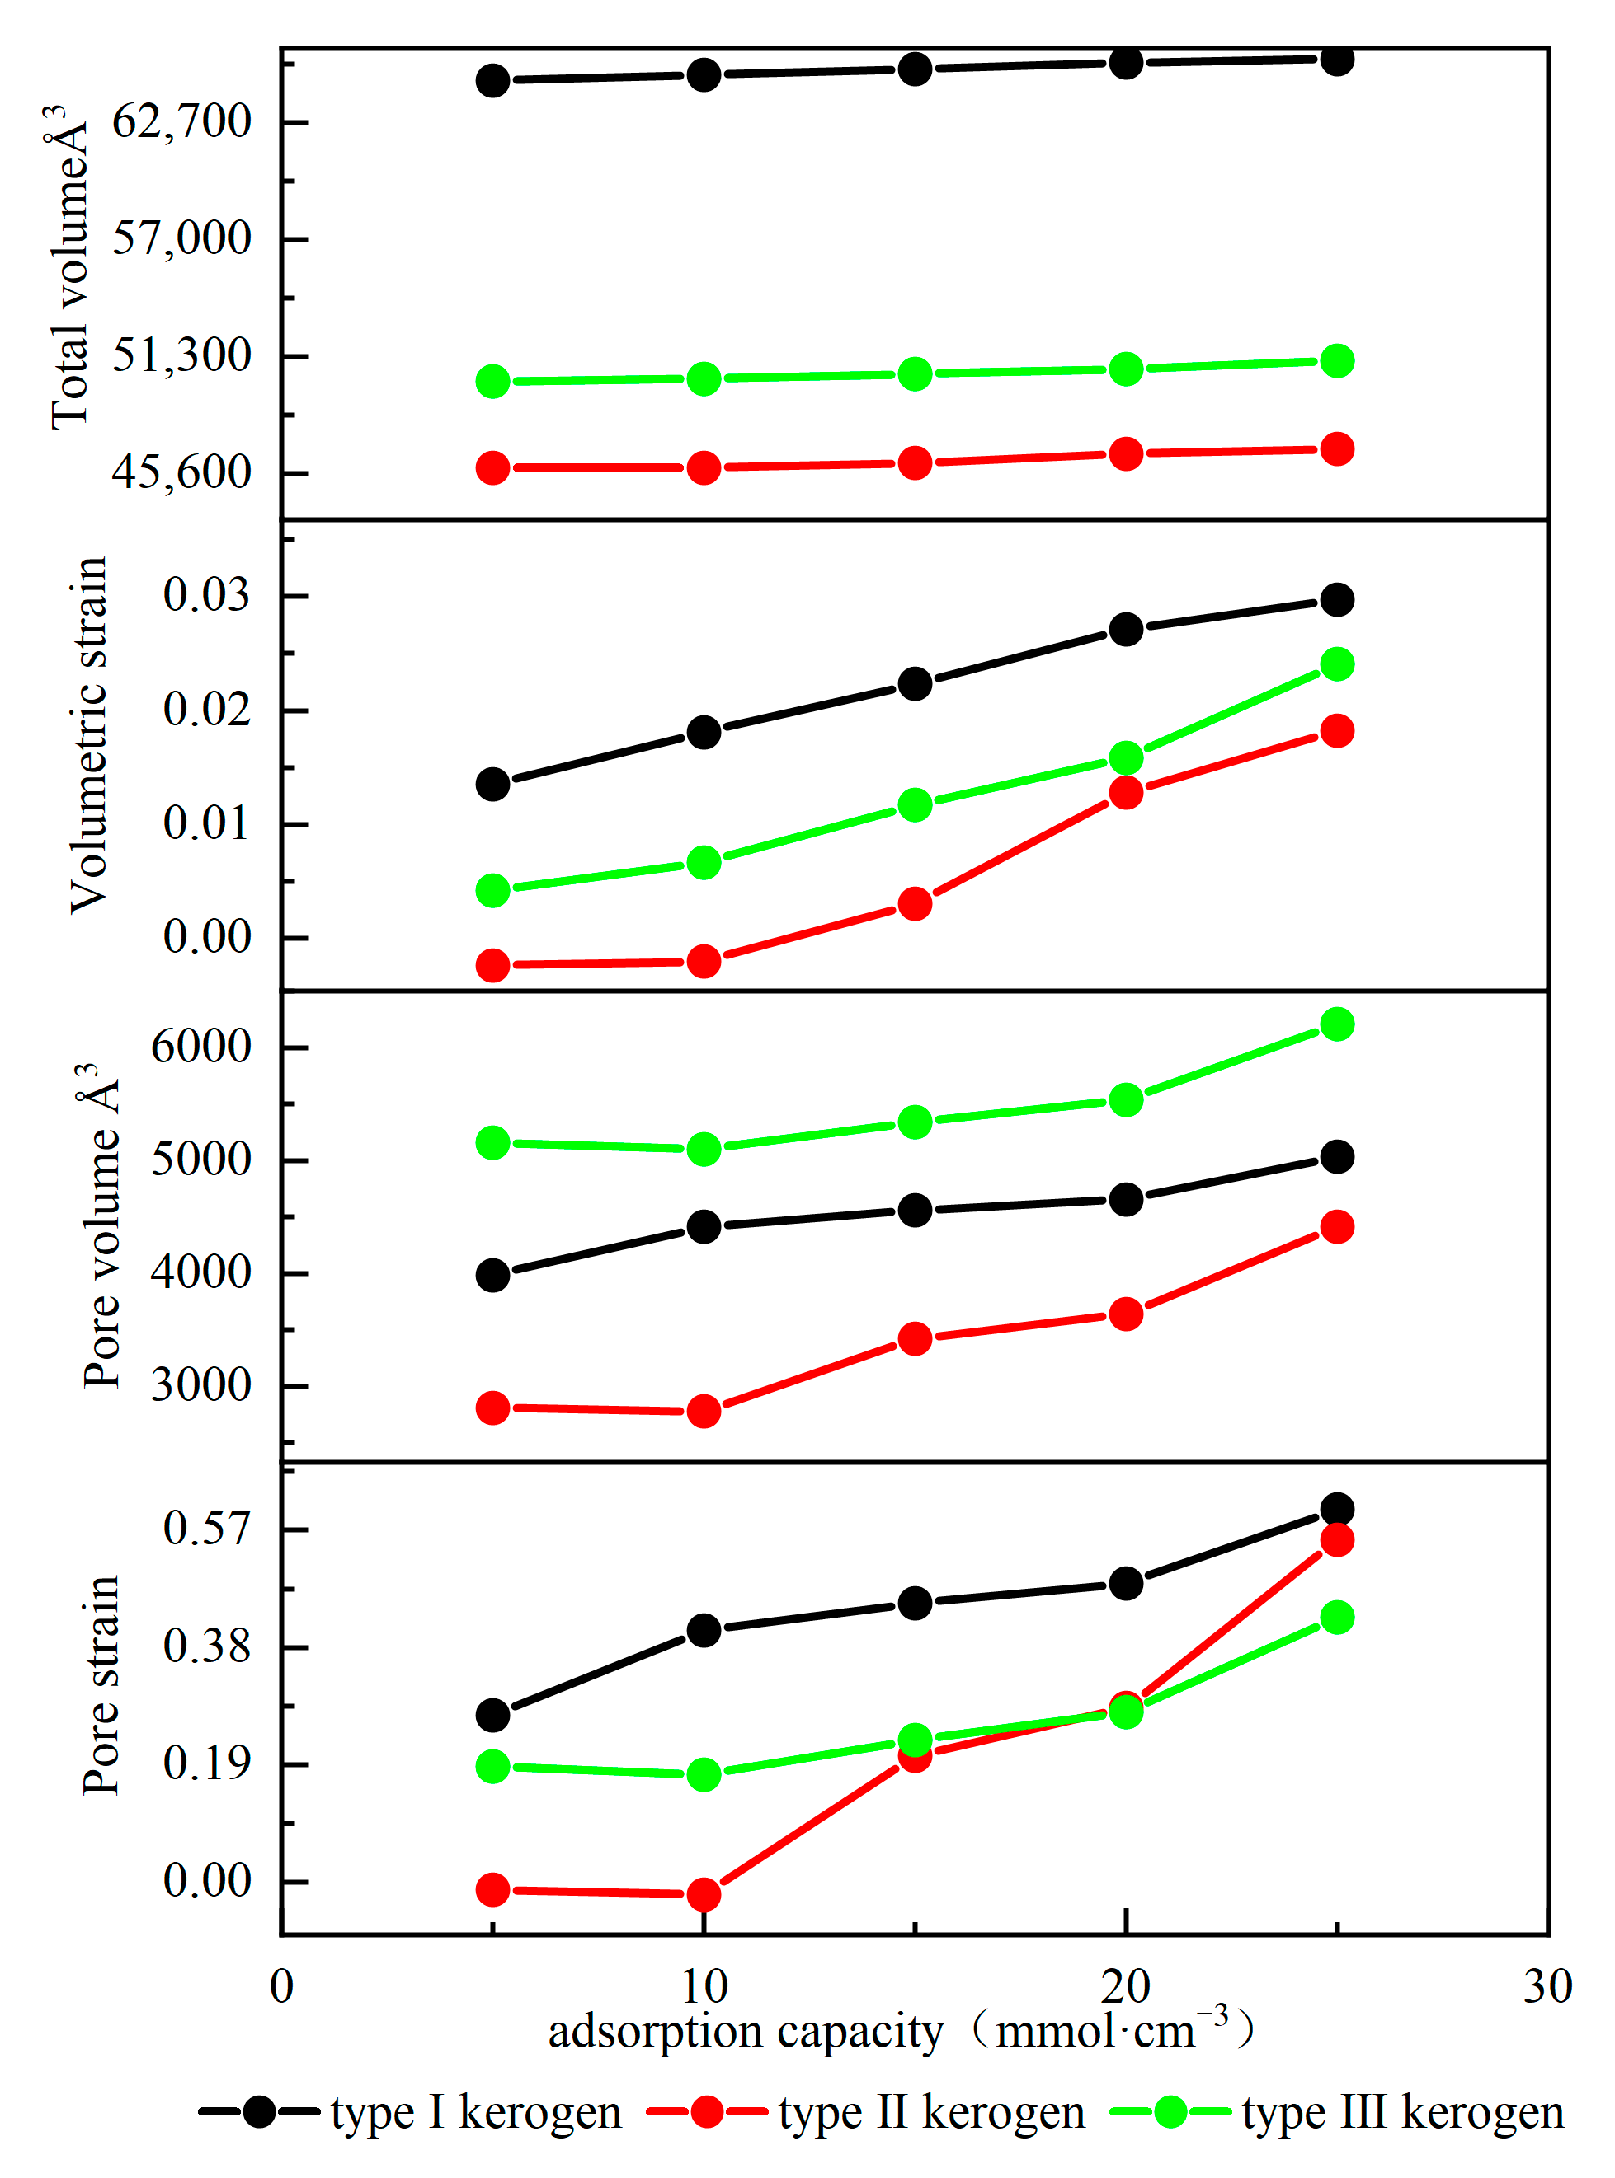
Figure 10 illustrates the effect of adsorption on kerogen deformation. As shown in the figure, with an increase in kerogen adsorption, both the total volume and pore volume of the three types of kerogen exhibit an expansion trend. However, the expansion dynamics show significant differences. The expansion process can be divided into a slow expansion stage and a rapid expansion stage. In the initial adsorption stage, Type I kerogen shows rapid expansion characteristics, while the volumes of the other two types of kerogen increase slowly and may even slightly decrease. This difference primarily arises from the varying surface energy characteristics of different types of kerogen. Compared to Type I kerogen, Types II and III kerogen have more high-energy adsorption sites. When methane occupies these sites, it significantly lowers the surface energy of the kerogen, enhancing intermolecular attraction. The repulsive forces between molecules compete with the enhanced intermolecular attraction, causing the kerogen volume to increase slowly or even slightly decrease. As the adsorption amount increases and exceeds a critical value, the high-energy sites on the kerogen become fully occupied. Methane then begins to adsorb on the low-energy adsorption sites, and intermolecular repulsion becomes dominant. At this point, the kerogen begins to expand rapidly. For Type III kerogen with an adsorption amount greater than 20 mmol/cm3, Type II kerogen with an adsorption amount greater than 10 mmol/cm3, and Type I kerogen in the initial adsorption stage, all reach the rapid expansion phase. However, the adsorption capacity of kerogen not only determines the critical adsorption amount at which the rapid expansion phase begins but also influences the expansion rate. The stronger the adsorption capacity, the greater the expansion rate during the rapid expansion phase. The maximum expansion rate of the three types of kerogen ranges from 1.82% to 2.97%, which is consistent with the expansion rule found by Sui et al., where the maximum expansion rate of kerogen is less than 4.45% [10]. However, while studying the volume expansion of kerogen, the study also found that due to adsorption, the pore volume of kerogen expands significantly, and the degree of expansion is much greater than the volume expansion, reaching as high as 57%. Because the pore sizes in the models are relatively small compared to the total volume of the model, and methane molecule interactions primarily occur inside the pores, the internal pore expansion is numerically similar to the total expansion, leading to a much higher pore strain rate than the volume strain rate. However, due to experimental limitations, it is extremely difficult to measure the pore changes inside the kerogen caused by adsorption, and they cannot be measured experimentally. These expansion behaviors have important implications for shale gas reservoirs: the overall volume expansion may lead to microstrain in the surrounding matrix, partially releasing the reservoir stress, while the significant expansion of pore volume directly affects the methane adsorption capacity of kerogen and the gas transmission properties of the reservoir. These findings provide an important theoretical basis for developing shale reservoir evaluation methods based on kerogen type and are significant for optimizing fracturing designs during shale gas development and accurately predicting fracture expansion behavior.
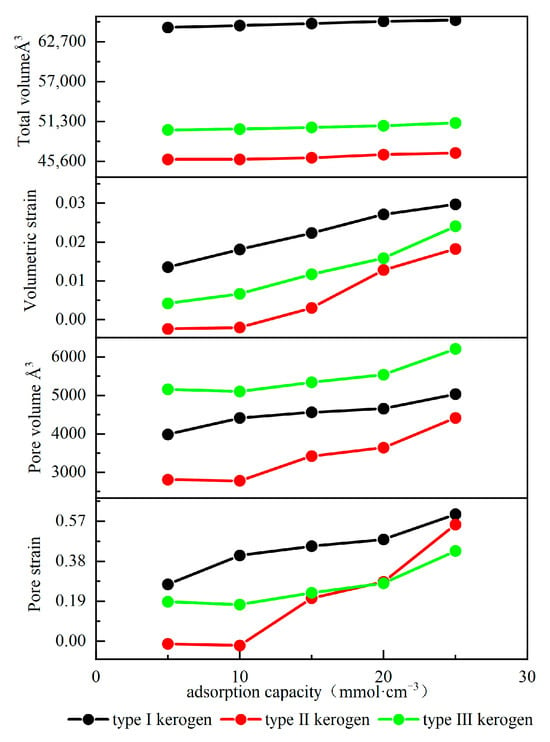
Figure 10.
Adsorption-induced deformation curves of kerogen.
4.4. Diffusion Coefficient
The diffusion coefficient reflects the diffusion ability of methane within kerogen models [34]. It can be calculated using the mean square displacement (MSD). Based on molecular dynamics simulations, the mean square displacement of methane molecules in kerogen under various conditions can be determined. The relationship between the mean square displacement and time is expressed as follows [35]:
The diffusion coefficient D is determined by:
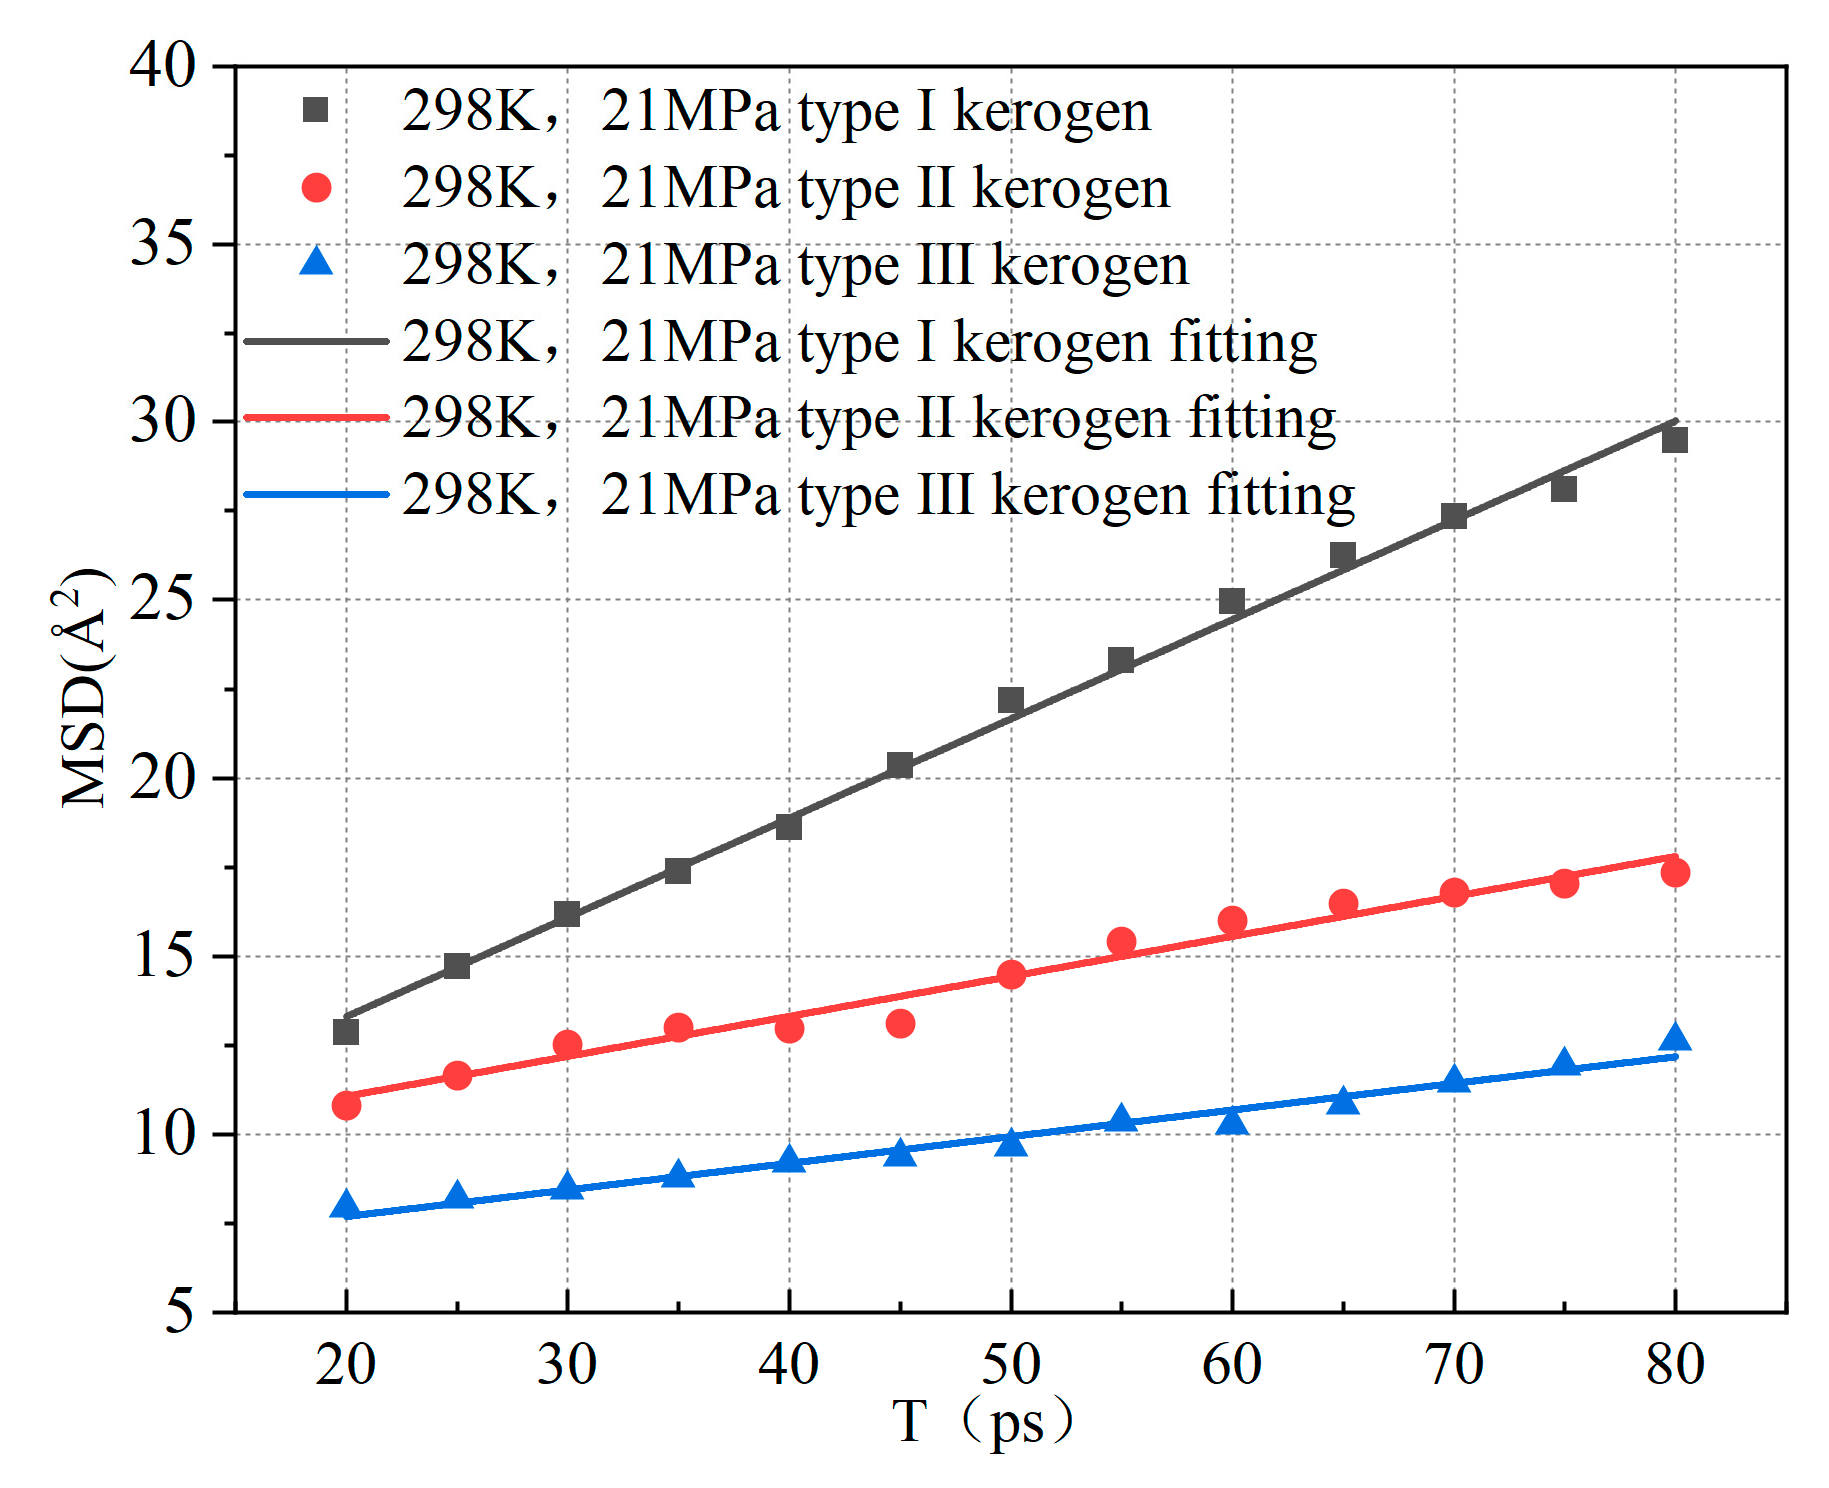
In the equation, represents the displacement at time t, with units in Å, and is the number of molecules. Based on the above equations, it can be observed that by plotting the mean square displacement (MSD) of methane against time, one-sixth of the slope corresponds to the diffusion coefficient of methane molecules. Figure 11 illustrates the variation of the mean square displacement of adsorbed methane over time for the three types of kerogen at 298 K and 21 MPa.
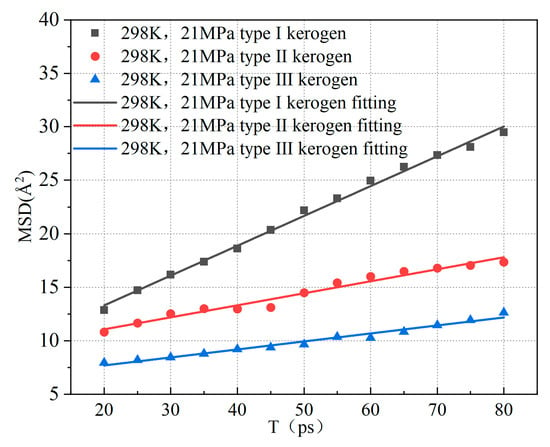
Figure 11.
Relationship between mean square displacement (MSD) of adsorbed methane in kerogen and time.
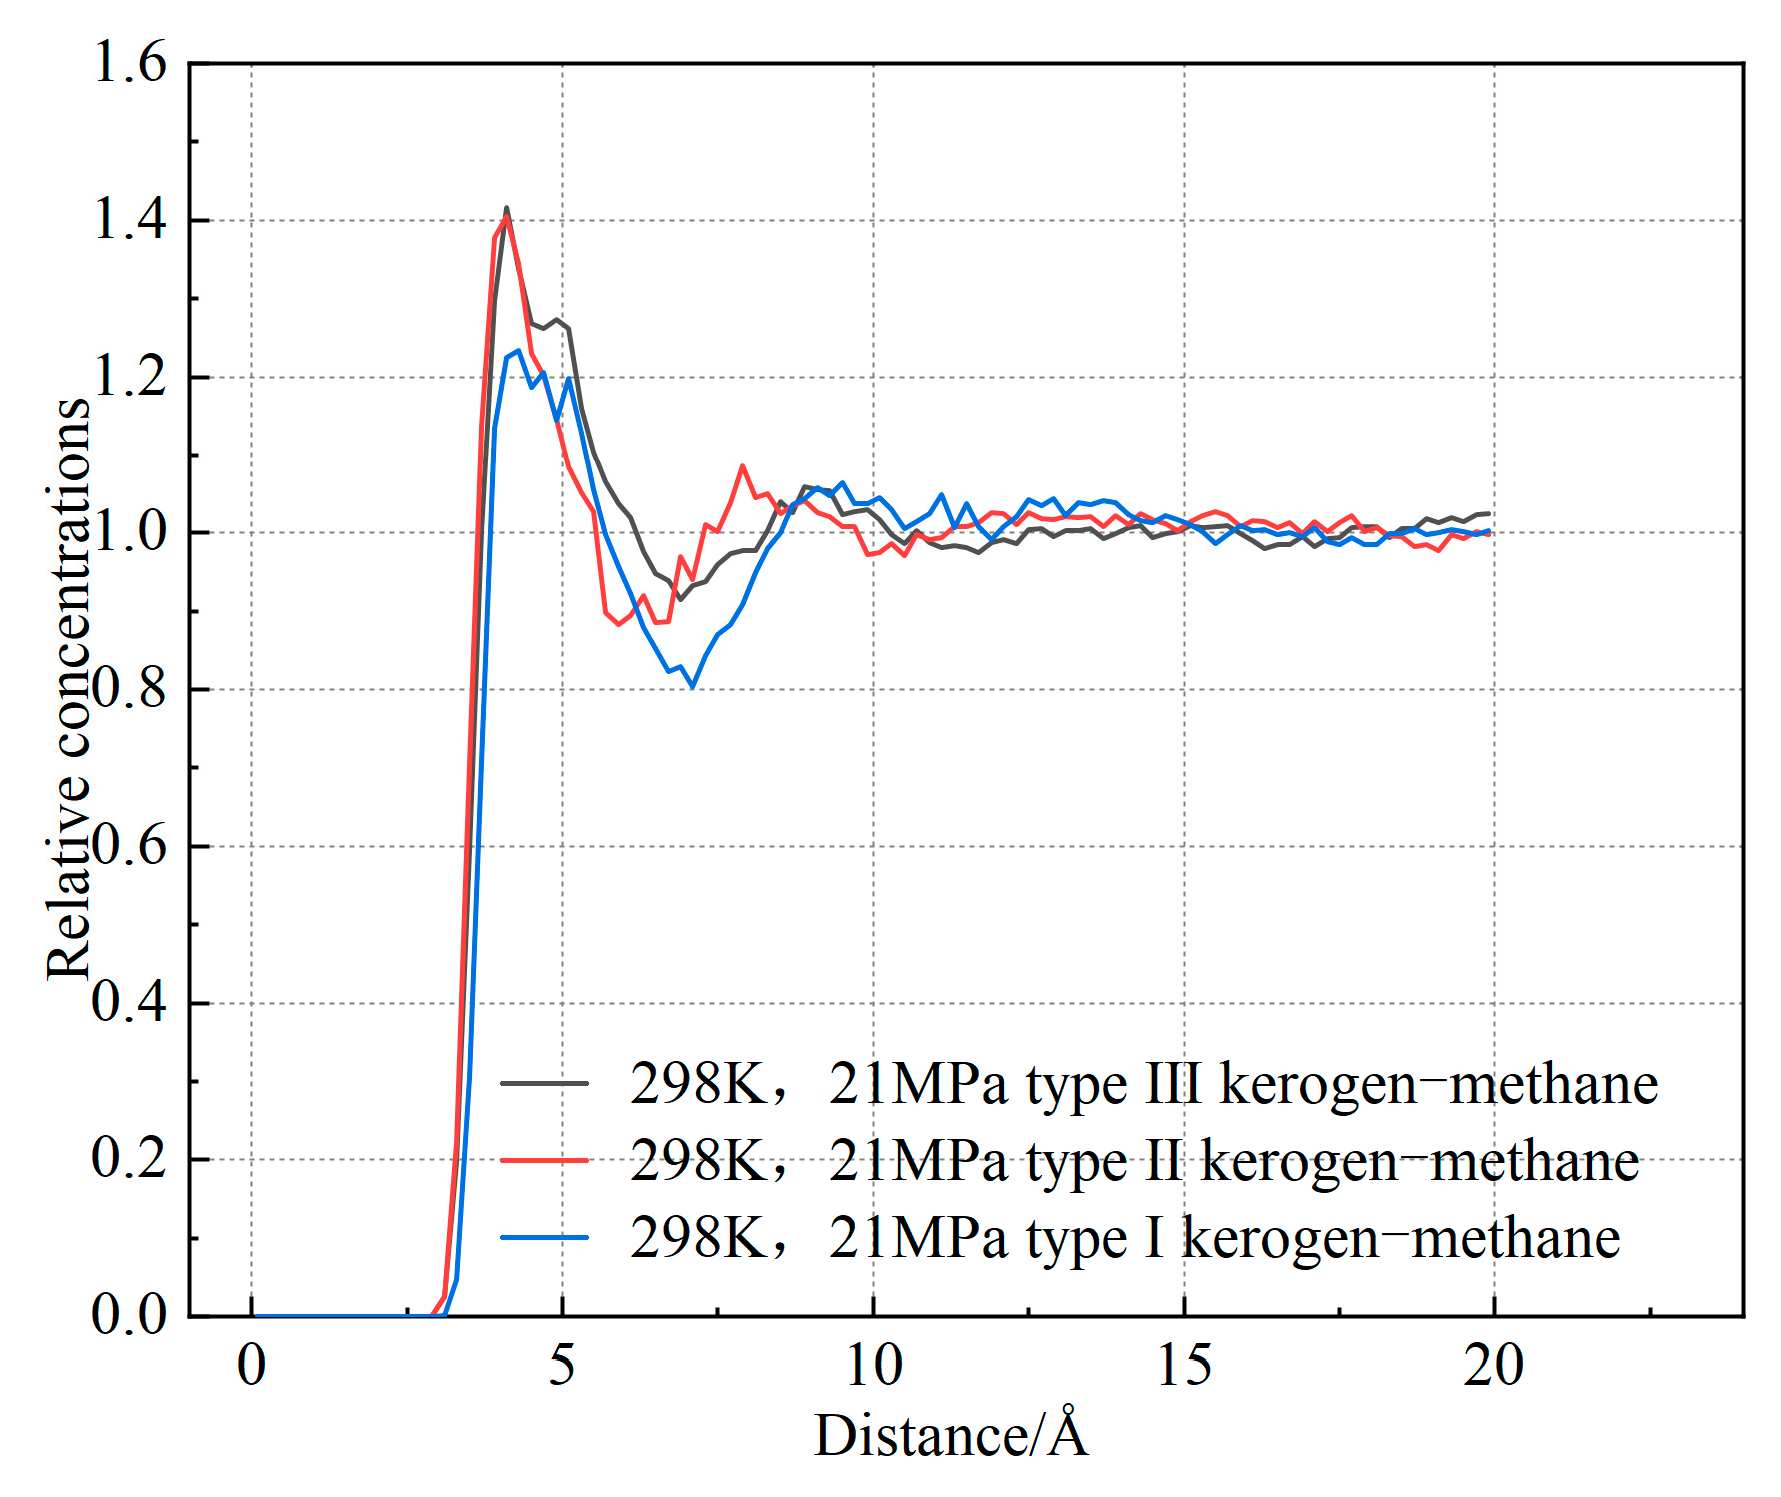
Based on the slopes in Figure 11, the diffusion coefficients of the three types of kerogen are calculated to be 0.0464 Å2/Ps, 0.0187 Å2/Ps, and 0.0125 Å2/Ps, respectively. The diffusion coefficient of Type I kerogen is significantly higher than that of Type II and Type III kerogen. Additionally, the mean square displacement (MSD) values for Type I kerogen are much larger than those for Type II and Type III kerogen. This indicates that the diffusion coefficient of methane is influenced by the adsorption capacity of kerogen. Specifically, the stronger the adsorption capacity, the less likely methane molecules are to detach, resulting in a smaller diffusion coefficient. Type I kerogen, due to its open fatty chain structure, is highly conducive to methane migration. On the other hand, the strong adsorption sites in high-type kerogen limit methane migration. This finding aligns with previous research. However, Tesson et al. [6] reported that the diffusion coefficient of methane in kerogen ranges from 0.61 to 0.71 Å2/Ps, which is significantly higher than the results obtained in this study. This discrepancy arises because the models constructed in this study are at the microscopic level. As shown in Figure 12, the radial distribution of methane in the kerogen model reveals that methane is primarily adsorbed at a distance of approximately 4.1 Å from the kerogen, and the pores are predominantly ultra-micropores smaller than 2 nm. Considering the size of methane, its adsorption position, and the constraints imposed by pore size [36], there is almost no free methane in the model, which significantly limits the diffusion coefficient. Furthermore, methane molecules frequently collide with the pore walls during movement, and diffusion mainly occurs through surface diffusion, which is much slower than diffusion in macroscopic systems. Additionally, due to the small pore size, the interactions between the pore walls and methane molecules are significantly enhanced, leading to strong adsorption effects and further reducing the diffusion coefficient of methane [37]. Finally, in micropores, the strong adsorption results in a high number of adsorbed methane molecules, leaving very little free volume available for methane diffusion, which further restricts the diffusion path. Under the combined influence of these factors, the diffusion coefficient of methane in micropores is 1–3 orders of magnitude smaller than that in mesopores larger than 2 nm [38]. Therefore, in shale gas extraction, low-type kerogen may exhibit a faster initial production rate. In contrast, extraction from Type III kerogen reservoirs is more challenging. Methods such as long-term pressure reduction, pore fracturing, or gas displacement are required to enhance recovery rates.
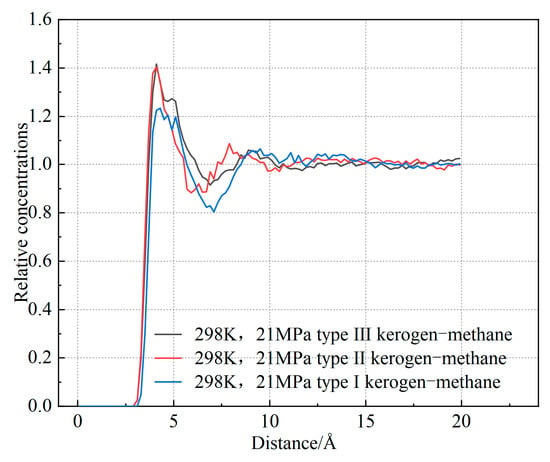
Figure 12.
Radial distribution function (RDF) of methane in the kerogen model.
5. Conclusions
Based on the microscopic unit cell structures of the three types of kerogen, this study investigated the adsorption characteristics of methane in different types of kerogen using molecular dynamics and Monte Carlo methods. The following conclusions were drawn:
(1) Different elements in kerogen have a significant impact on methane adsorption energy and adsorption sites. The effect of sulfur (S) is the most pronounced, with the presence of C-S bonds causing a shift in the adsorption site by 0.861 Å and increasing the adsorption energy by 1.418 kJ. In contrast, nitrogen (N) has a minimal effect on methane adsorption. This finding clearly highlights the key role of sulfur-containing functional groups in kerogen adsorption, providing a theoretical basis for optimizing shale gas reservoir evaluation.
(2) The adsorption heats of the three types of kerogen follow the trend: Type I < Type II < Type III, with the limiting adsorption heats being 20.184 kJ/mol, 26.658 kJ/mol, and 28.436 kJ/mol, respectively, and the equivalent adsorption heats being 19.645 kJ/mol, 19.978 kJ/mol, and 24.135 kJ/mol, respectively. As the adsorption amount increases, the adsorption energy decreases. This indicates that the three types of kerogen have better gas storage potential. However, during extraction, due to their higher adsorption capacity, more efficient pressure-reduction and temperature-increase strategies need to be designed according to their characteristics.
(3) Kerogen adsorption leads to the expansion of both the total volume and pore volume as the adsorption amount increases, with expansion being type-dependent. Type I kerogen undergoes rapid expansion in the initial adsorption stage, while Type II and Type III kerogen enter the rapid expansion phase sequentially as the adsorption amount increases. The total volume expansion rate of kerogen is less than 3%, while the pore volume expansion rate can reach up to 57%. This provides a new approach for improving pore connectivity by utilizing the expansion effect.
(4) The diffusion coefficients of the three types of kerogen at 298 K and 21 MPa are 0.0464 Å2/Ps, 0.0187 Å2/Ps, and 0.0125 Å2/Ps, respectively. The diffusion coefficient of methane in the ultramicropores of kerogen measured in simulations is much smaller than the diffusion coefficient measured in macroscopic experiments, with the difference exceeding one order of magnitude. This difference in diffusion coefficients clarifies the relationship between the kerogen structure and gas storage at the molecular scale, providing new insights for shale gas micropore desorption and production capacity prediction.
Author Contributions
Conceptualization, Z.L.; methodology, A.Y.; software, A.Y.; validation, A.Y.; formal analysis, A.Y.; investigation, Y.M.; resources, Y.M.; data curation, A.Y.; writing—original draft preparation, A.Y.; writing—review and editing, Z.L.; visualization, A.Y.; supervision, Y.Z.; project administration, Y.Z.; funding acquisition, Y.M. All authors have read and agreed to the published version of the manuscript.
Funding
This research was funded by the National Natural Science Foundation of China [51874166], Liaoning Provincial Applied Basic Research Program Project [2022JH2/101300136] and Liaoning Provincial Department of Education Basic Research Project [JYTMS20230821].
Data Availability Statement
The data that support the findings of this study are available from the author upon reasonable request. For any data or related questions mentioned in the paper, please contact the first author Ao Yin. E-mail address: yingao1253531927@gmail.com (Ao Yin).
Acknowledgments
The authors would like to thank the funding for the project, the guidance of the teachers, and the companionship of the classmates.
Conflicts of Interest
The authors declare no conflicts of interest.
References
- Huang, L.; Xiao, Y.; Yang, Q.; Chen, Q.; Zhang, Y.; Xu, Z.; Feng, X.; Tian, B.; Wang, L.; Liu, Y. Gas Sorption in Shale Media by Molecular Simulation: Advances, Challenges and Perspectives. Chem. Eng. J. 2024, 487, 150742. [Google Scholar] [CrossRef]
- Yuan, T.; Zhang, J.; Yu, B.; Tang, X.; Niu, J.; Sun, M. Weight Assignment Method and Application of Key Parameters in Shale Gas Resource Evaluation. Appl. Sci. 2024, 14, 8518. [Google Scholar] [CrossRef]
- Zhang, J.; Zhou, Z.; Song, T.; Li, F.; Chen, R. Comparison of shale gas exploration and development history, geological characteristics, development and utilization conditions in China and the United States and its enlightenment. Acta Pet. Sin. 2022, 43, 1687–1701. [Google Scholar] [CrossRef]
- Liang, H.; Qi, Z.; Wang, S.; Huang, X.; Yan, W.; Yuan, Y.; Li, Z. Adsorption Models for Shale Gas: A Mini-Review. Energy Fuels 2022, 36, 12946–12960. [Google Scholar] [CrossRef]
- Kang, D.; Wang, X.; Zheng, X.; Zhao, Y.-P. Predicting the Components and Types of Kerogen in Shale by Combining Machine Learning with NMR Spectra. Fuel 2021, 290, 120006. [Google Scholar] [CrossRef]
- Tesson, S.; Firoozabadi, A. Methane Adsorption and Self-Diffusion in Shale Kerogen and Slit Nanopores by Molecular Simulations. J. Phys. Chem. C 2018, 122, 23528–23542. [Google Scholar] [CrossRef]
- Huang, L.; Feng, X.; Yang, Q.; Wu, J.; Yang, X.; Huang, S. Microscopic occurrence characteristics of methane in nanopores of kerogen in deep shale. Oil Drill. Technol. 2023, 51, 112–120. [Google Scholar]
- Lin, X.; Li, Z.; Jiang, Z.; He, T.; Jiang, Z.; Qin, C.; Zhang, C. Simulation of Methane Occurrence in Rough Nanokerogen Slits. Energy Fuels 2023, 37, 15476–15489. [Google Scholar] [CrossRef]
- Ho, T.A.; Wang, Y.; Criscenti, L.J. Chemo-Mechanical Coupling in Kerogen Gas Adsorption/Desorption. Phys. Chem. Chem. Phys. 2018, 20, 12390–12395. [Google Scholar] [CrossRef]
- Sui, H.; Yao, J. Effect of Surface Chemistry for CH4/CO2 Adsorption in Kerogen: A Molecular Simulation Study. J. Nat. Gas Sci. Eng. 2016, 31, 738–746. [Google Scholar] [CrossRef]
- Shi, J.; Chen, C.; Gong, L.; Bai, Z.; Sun, S. Adsorption and diffusion characteristics of methane in kerogen. J. Eng. Thermophys. 2019, 40, 1338–1343. [Google Scholar]
- Li, J.; Han, X.; Huang, S.; Yu, Y.; Qiang, X.; Gu, K.; Hou, D. Molecular simulation of kerogen adsorption law in shale. Eval. Dev. Oil Gas Reserv. 2022, 12, 455–461. [Google Scholar]
- Liu, Z.; Feng, Z. Theoretical study on heat adsorption of gas by coal. J. China Coal Soc. 2012, 37, 647–653. [Google Scholar] [CrossRef]
- Huang, L.; Ning, Z.; Wang, Q.; Qi, R.; Zeng, Y.; Qin, H.; Ye, H.; Zhang, W. Molecular Simulation of Adsorption Behaviors of Methane, Carbon Dioxide and Their Mixtures on Kerogen: Effect of Kerogen Maturity and Moisture Content. Fuel 2018, 211, 159–172. [Google Scholar] [CrossRef]
- Wang, Q.; Pan, S.; Bai, J.; Chi, M.; Cui, D.; Wang, Z.; Liu, Q.; Xu, F. Theoretical Study of Structural and Spatial Properties of Kerogen. Energy Fuels 2019, 33, 9559–9569. [Google Scholar] [CrossRef]
- Liu, X.; Luo, D.; Xiong, J.; Liang, L. Construction of average molecular structure model of kerogen shale in Longmaxi Formation. Chem. Ind. Prog. 2017, 36, 530–537. [Google Scholar]
- Ungerer, P.; Collell, J.; Yiannourakou, M. Molecular Modeling of the Volumetric and Thermodynamic Properties of Kerogen: Influence of Organic Type and Maturity. Energy Fuels 2014, 19, 91–105. [Google Scholar] [CrossRef]
- Myers, A.L.; Monson, P.A. Adsorption in Porous Materials at High Pressure: Theory and Experiment. Langmuir 2002, 18, 10261–10273. [Google Scholar] [CrossRef]
- Peng, D.-Y.; Robinson, D.B. A New Two-Constant Equation of State. Ind. Eng. Chem. Fundam. 1976, 15, 59–64. [Google Scholar] [CrossRef]
- Zhang, Z.; Meng, Z.; Zhang, Y. The derivation of Freundlich kinetic equation and exploration on the physical meaning of its parameters. J. Northwest A F Univ. (Nat. Sci. Ed.) 2003, 5, 202–204. [Google Scholar] [CrossRef]
- Gasparik, M.; Bertier, P.; Gensterblum, Y.; Ghanizadeh, A.; Krooss, B.M.; Littke, R. Geological Controls on the Methane Storage Capacity in Organic-Rich Shales. Int. J. Coal Geol. 2014, 123, 34–51. [Google Scholar] [CrossRef]
- Zhang, C.; Yao, Y.; Swennen, R.; Zhang, Y. Re-Evaluating the Methane Adsorption Behavior in Shale Kerogen: Unifying Experiment and Molecular Simulation. Phys. Fluids 2024, 36, 022002. [Google Scholar] [CrossRef]
- Zhou, S.; Wang, H.; Xue, H.; Guo, W.; Lu, B. The difference between excess adsorption capacity and absolute adsorption capacity of shale and a new method for calculating shale gas reserves. Nat. Gas Ind. 2016, 36, 12–20. [Google Scholar]
- Fang, F.; Sun, C.; Shu, X.; Zhu, Z.; Fang, Z. Calculation problem and method improvement of isothermal adsorption capacity of methane in shale. Pet. Exp. Geol. 2018, 40, 71–77+89. [Google Scholar]
- Zhou, D.; Liu, Z.; Feng, Z.; Shen, Y.; Wu, Y. The Study of the Local Area Density Homogenization Effect of Meso-Structures in Coal during Methane Adsorption. J. Pet. Sci. Eng. 2020, 191, 107141. [Google Scholar] [CrossRef]
- Liu, Z.; Feng, Z.; Zhang, Q.; Zhao, D.; Guo, H. Heat and Deformation Effects of Coal during Adsorption and Desorption of Carbon Dioxide. J. Nat. Gas Sci. Eng. 2015, 25, 242–252. [Google Scholar] [CrossRef]
- Asnin, L.D.; Stepanova, M.V. On Physical Meaning of van’t Hoff Equation and Its Applicability in Chromatography. J. Chromatogr. A 2024, 1733, 465250. [Google Scholar] [CrossRef]
- Yang, F.; Ning, Z.; Wang, Q.; Liu, H.; Kong, D. Thermodynamic analysis of methane adsorption on gas shale. J. Cent. South Univ. (Nat. Sci. Ed.) 2014, 45, 2871–2877. [Google Scholar]
- Mu, Z.; Ning, Z.; Ren, C. Methane Adsorption on Shales and Application of Temperature-Related Composite Models Based on Dual Adsorption Modes. J. Pet. Sci. Eng. 2022, 208, 109379. [Google Scholar] [CrossRef]
- Tian, W. Study on the Adsorption Law of CH4, C2H6 and Their Binary Mixtures in Shale; China University of Petroleum (Beijing): Beijing, China, 2022. [Google Scholar]
- Pan, H.; Ritter, J.A.; Balbuen, P.B. Examination of the Approximations Used in Determining the Isosteric Heat of Adsorption from the Clausius-Clapeyron Equation. Langmuir 1998, 14, 6323–6327. [Google Scholar] [CrossRef]
- Li, J.; Chen, Z.; Wu, K.; Wang, K.; Luo, J.; Feng, D.; Qu, S.; Li, X. A Multi-Site Model to Determine Supercritical Methane Adsorption in Energetically Heterogeneous Shales. Chem. Eng. 2018, 349, 438–455. [Google Scholar] [CrossRef]
- Zhou, D.; Liu, Z.; Feng, Z.; Shen, Y. Methane passage in microporous throat of coal and its influence mechanism on desorption. J. China Coal Soc. 2019, 44, 6. [Google Scholar] [CrossRef]
- Yang, Y.; Liu, S. Review of Shale Gas Sorption and Its Models. Energy Fuels 2020, 34, 15502–15524. [Google Scholar] [CrossRef]
- Yuan, Q.; Zhou, X.; Zeng, F.; Knorr, K.D.; Imran, M. Nonlinear Simulation of Miscible Displacements with Concentration-Dependent Diffusion Coefficient in Homogeneous Porous Media. Chem. Eng. Sci. 2017, 172, 528–544. [Google Scholar] [CrossRef]
- Shang, F.; Miao, K.; Zhu, Y.; Wang, M.; Tang, X. Shale pore structure, adsorption characteristics and influencing factors in complex structural area. Coal Sci. Technol. 2023, 51, 269–282. [Google Scholar] [CrossRef]
- Tang, C.; Li, B.; Li, J.; Gao, Z.; Song, H.; Yang, J. Study Concerning the Supercritical Adsorption Behavior of Shale Gas That Analyzed Different Adsorption Mechanisms. Chem. Eng. Res. Des. 2024, 208, 15–28. [Google Scholar] [CrossRef]
- Chen, M.; Kang, Y.; Zhang, T.; You, L.; Li, X.; Chen, Z.; Wu, K.; Yang, B. Methane Diffusion in Shales with Multiple Pore Sizes at Supercritical Conditions. Chem. Eng. J. 2017, 334, 1455–1465. [Google Scholar] [CrossRef]


Disclaimer/Publisher’s Note: The statements, opinions and data contained in all publications are solely those of the individual author(s) and contributor(s) and not of MDPI and/or the editor(s). MDPI and/or the editor(s) disclaim responsibility for any injury to people or property resulting from any ideas, methods, instructions or products referred to in the content. |
© 2025 by the authors. Licensee MDPI, Basel, Switzerland. This article is an open access article distributed under the terms and conditions of the Creative Commons Attribution (CC BY) license (https://creativecommons.org/licenses/by/4.0/).