3.2. Catalytic Cracking of Studied Eight Vacuum Gas Oils
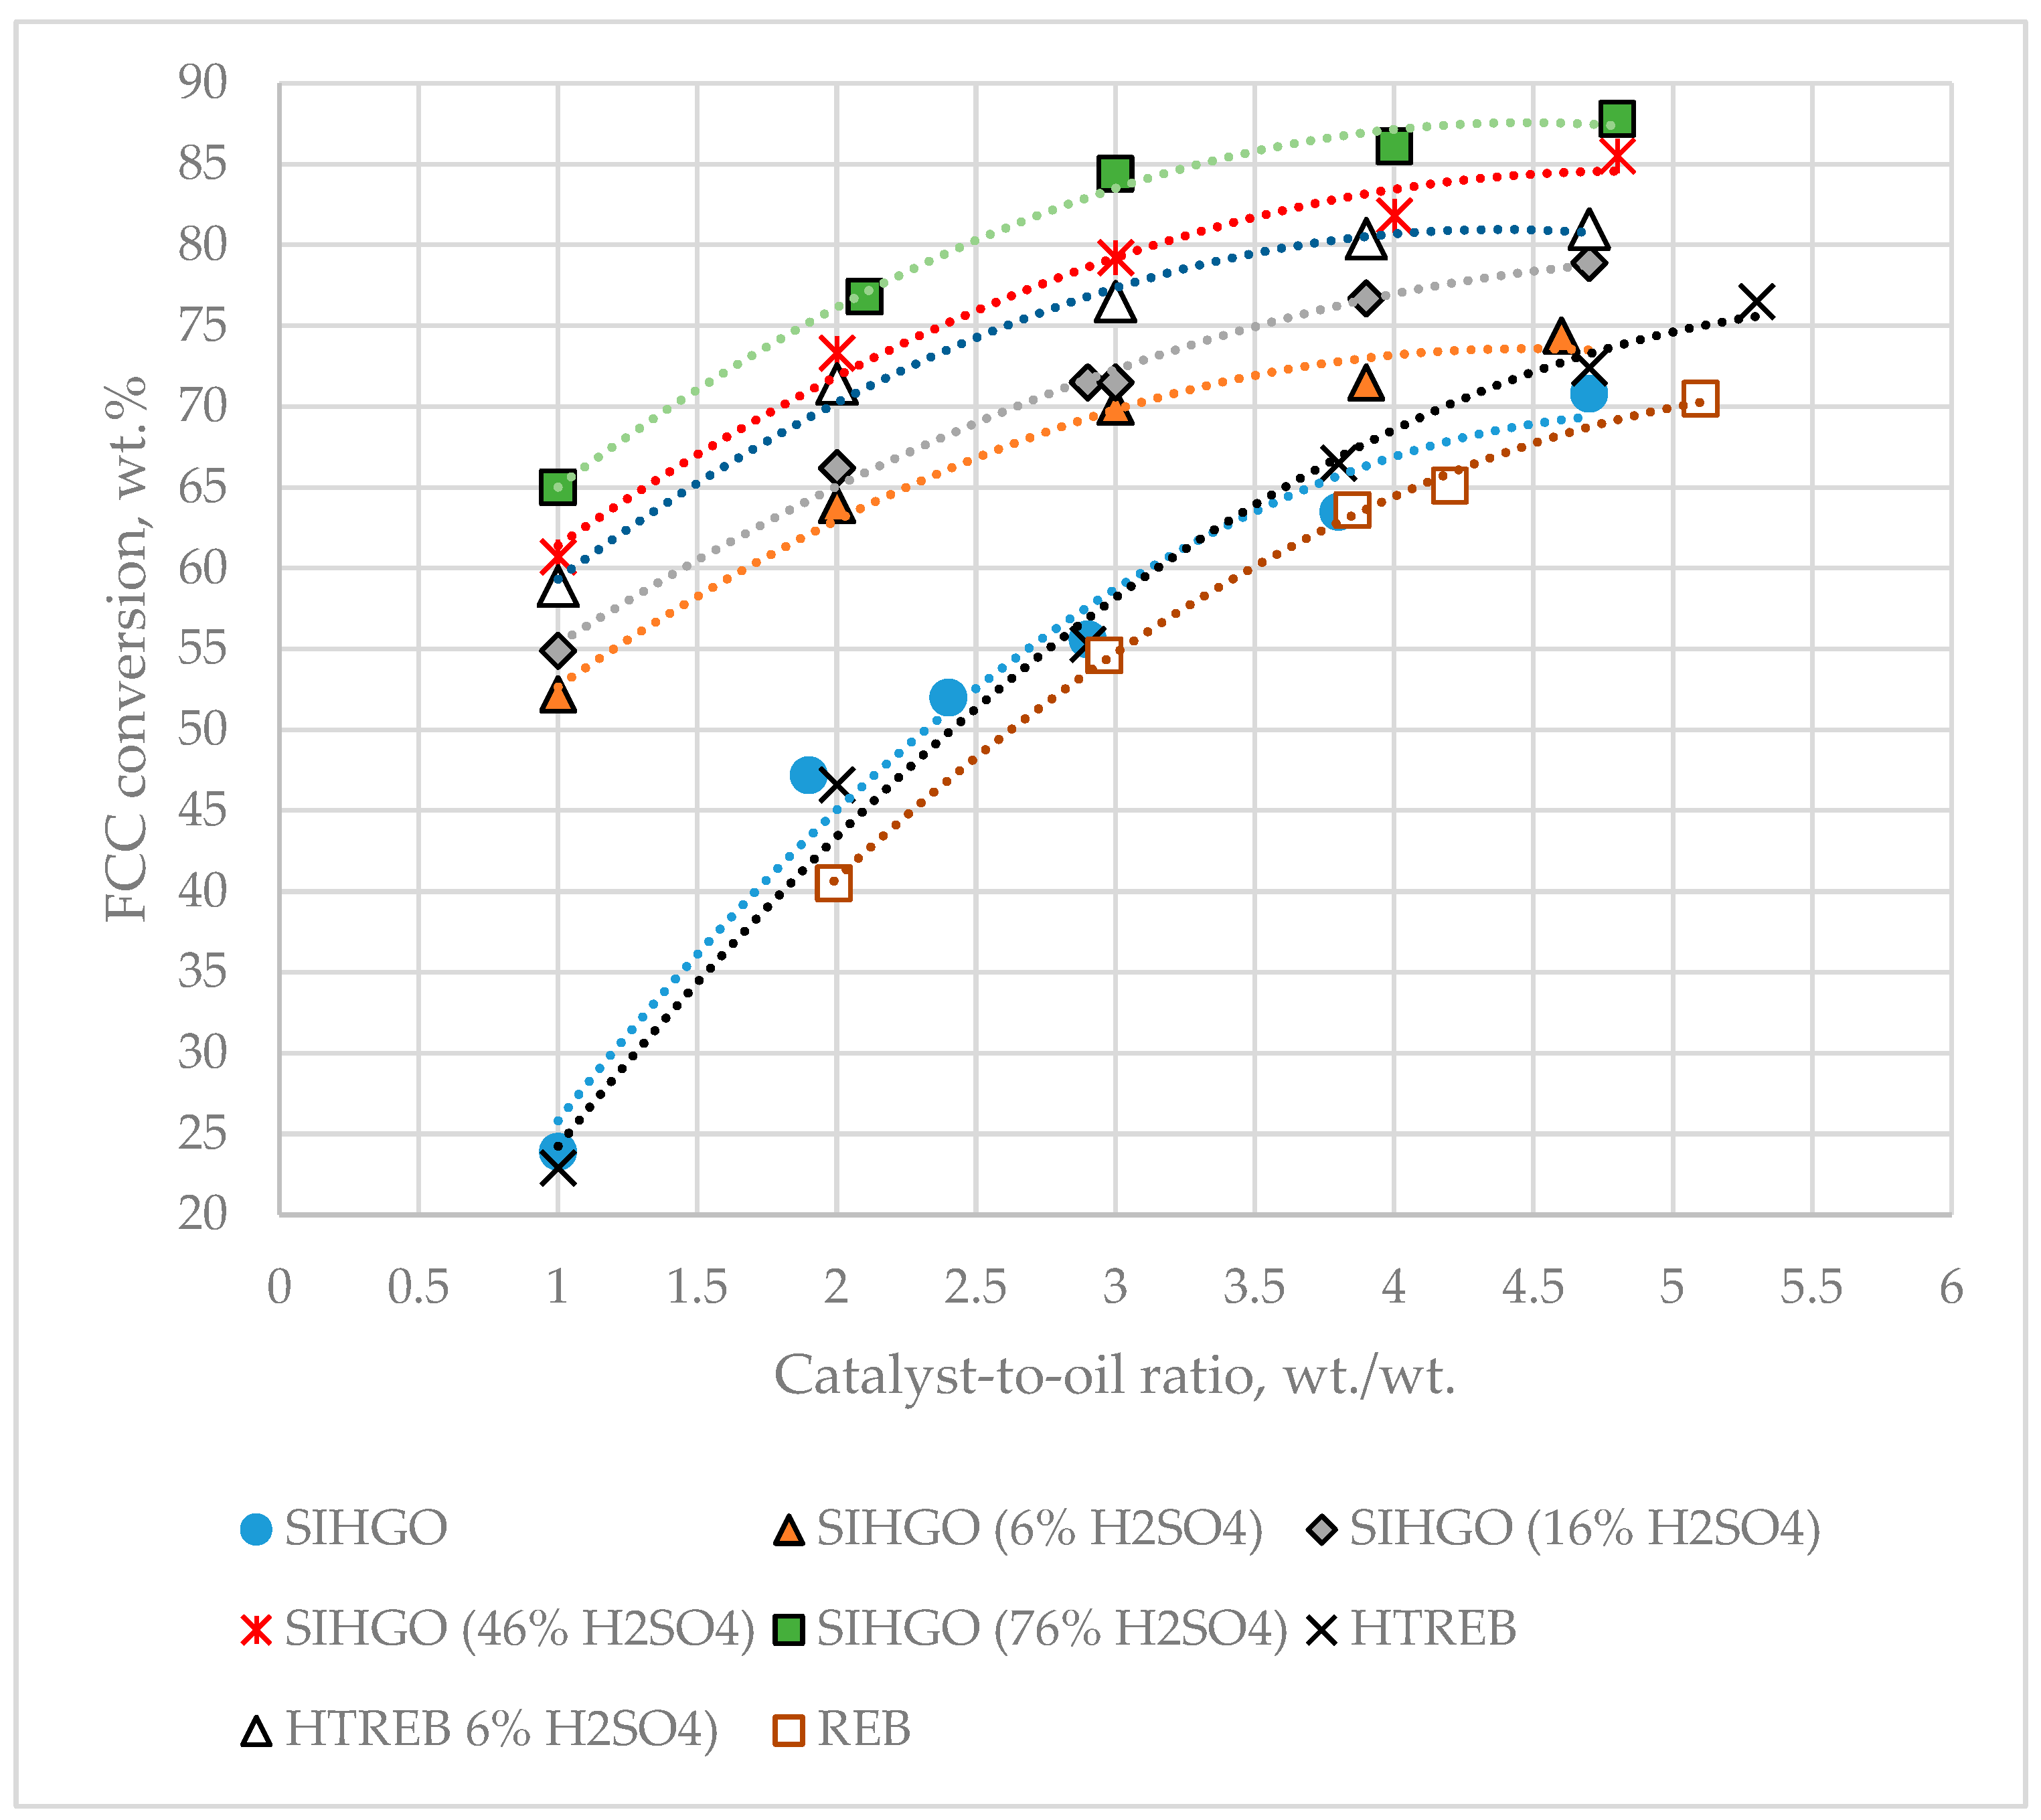
Figure 2 presents a graph of the dependence of VGO conversion on the catalyst-to-oil ratio.
The data in
Figure 2 indicate that the least reactive VGO under the cracking conditions studied is REB, while the most reactive is SIHGO (76% H
2SO
4). As a measure of the reactivity of the studied VGOs, the catalyst-to-oil ratio interpolated at a constant conversion of 65 wt.% was used (
Table 4).
By regression of feed characterizing data and that of
Table 4, Equation (7) was developed.
where,
CTO at 65% conv = Catalyst-to-oil ratio interpolated at 65 wt.% conversion, wt./wt.;
BN = Content of basic nitrogen in the FCC VGO feed, wt.%;
CA = Aromatic carbon content in FCC VGO feed, calculated by Equation (1), wt.%;
H = Hydrogen content in FCC VGO feed, calculated by Equation (2), wt.%.
Equation (8) suggests that the reactivity of a FCC VGO feed depends on three characterizing parameters: aromatic carbon, hydrogen, and basic nitrogen contents. The higher the aromatic carbon and basic nitrogen contents, and the lower the hydrogen content, the higher the catalyst-to-oil ratio needed to achieve the VGO conversion of 65 wt.%. The sulfuric acid-treated vacuum gas oils (SIHGO 6% H
2SO
4 and HTREB 6% H
2SO
4), whose basic nitrogen has been completely removed, but whose group hydrocarbon composition has not been considerably affected in comparison to the parent SIHGO and HTREB, are cracked much more easily than the original gas oils. For a catalyst-to-oil ratio of 2 wt./wt. the difference in conversions between SIHGO and SIHGO 6% H
2SO
4 is 16.7 wt.% and that between HTREB and HTREB 6% H
2SO
4 is 24.8 wt.%. Whereas at the highest catalyst-to-oil ratio of about 5 wt./wt. this difference is much lower 3.6 wt.% for SIHGO gas oils, and 4.5 wt.% for the HTREB gas oils. This observation can be explained by the poisoning effect of basic nitrogen components on the Brønsted acid sites responsible for cracking [
51].
The difference is bigger for low catalyst-to-oil ratios because at low catalyst-to-oil ratios, the quantity of basic nitrogen components per mass of catalyst is higher, and poisoning will be more pronounced. At higher catalyst-to-oil ratios, the influence of basic nitrogen components on crackability is less pronounced because their relative amount in the feed compared to the catalyst mass is lower. After the removal of basic nitrogen, the effect of hydrocarbon composition, quantified by the contents of aromatic carbon and hydrogen, on the reactivity of FCC gas oils becomes more prominent.
Figure 2 shows a plot of the dependence of gasoline yield on the catalyst-to-oil ratio for the eight vacuum gas oils under study. It is evident from this data that for the sulfuric acid-treated VGOs, the maximum gasoline yield is found between CTO of 3 and 4 wt./wt. A calculation of conversion for the sulfuric acid-treated VGOs from the data in
Figure 1 for a catalyst-to-oil ratio of 3.5 wt./wt. may define the conversion where overcracking occurred. In previous studies [
38,
39], it was found that the empirical parameters C
A and H can be used to calculate the conversion where overcracking occurred using Equation (9).
Table 5 summarizes the data observed and calculated by Equation (9) overcracking conversions of the investigated VGOs. It should be noted here that the overcracking of SIHGO, REB, and HTREB VGOs was not possible to define exactly because no reduction of gasoline yield can be seen during conversion enhancement, similar to that evident for the sulfuric acid-treated VGOs from the data in
Figure 3. In this case, for these three VGOs, the conversion attained at the maximum CTO was assumed to be representative of their overcracking conversion. It can be expected that the overcracking conversion of SIHGO should not be higher than that of SIHGO (6% H
2SO
4) and that the maximal conversion of HTREB would not be higher than that of HTREB (6% H
2SO
4) because the removal of heavy aromatics by the sulfuric acid from both SIHGO and HTREB ought not to lead to obtaining a higher overcracking conversion from that of SIHGO (6% H
2SO
4) and that of HTREB (6% H
2SO
4). Thus, the conversion level of SIHGO of 70.8 wt.% was observed at CTO of 4.7 wt./wt. may be safely expected to be the overcracking point or very close to it. The same speculation for the overcracking point of HTREB may define the conversion level of 76.5 wt.% observed at CTO of 5.3 wt./wt. as the overcracking conversion or very close to the maximal conversion value.
Comparing the calculated by Equation (9) overcacking conversions with those apparent for the sulfuric acid-treated VGOs, an excellent agreement can be seen that can be considered as a reasonable basis to assume that the reported overcracking conversions for SIHGO, REB and HTREB should be very close to the true values. Equation (9) was developed for FCC feeds whose overcracking conversions varied between 50 and 85 wt.% [
38], and it showed an adequate prediction for the data reported in [
20] and [
24]. The data set of the sulfuric-treated VGOs in this work also shows very good predictability.
The results generated in this research suggest that the feed characterizing parameters, aromatic carbon, hydrogen, and basic nitrogen contents, are sufficient to be used for forecasting the FCC feed reactivity and the conversion at maximum gasoline yield.
Figure 4 displays a chart of the dependence of dry gas yield on the catalyst-to-oil ratio.
There is a band with about 0.5 wt.% width that shows an increasing trend of dry gas yield with the enhancement of CTO for all studied feeds. It is difficult to discern a feed with a notable tendency to make more dry gas than the other feeds, probably because the dry gas is considered a product of thermal cracking rather than catalytic cracking.
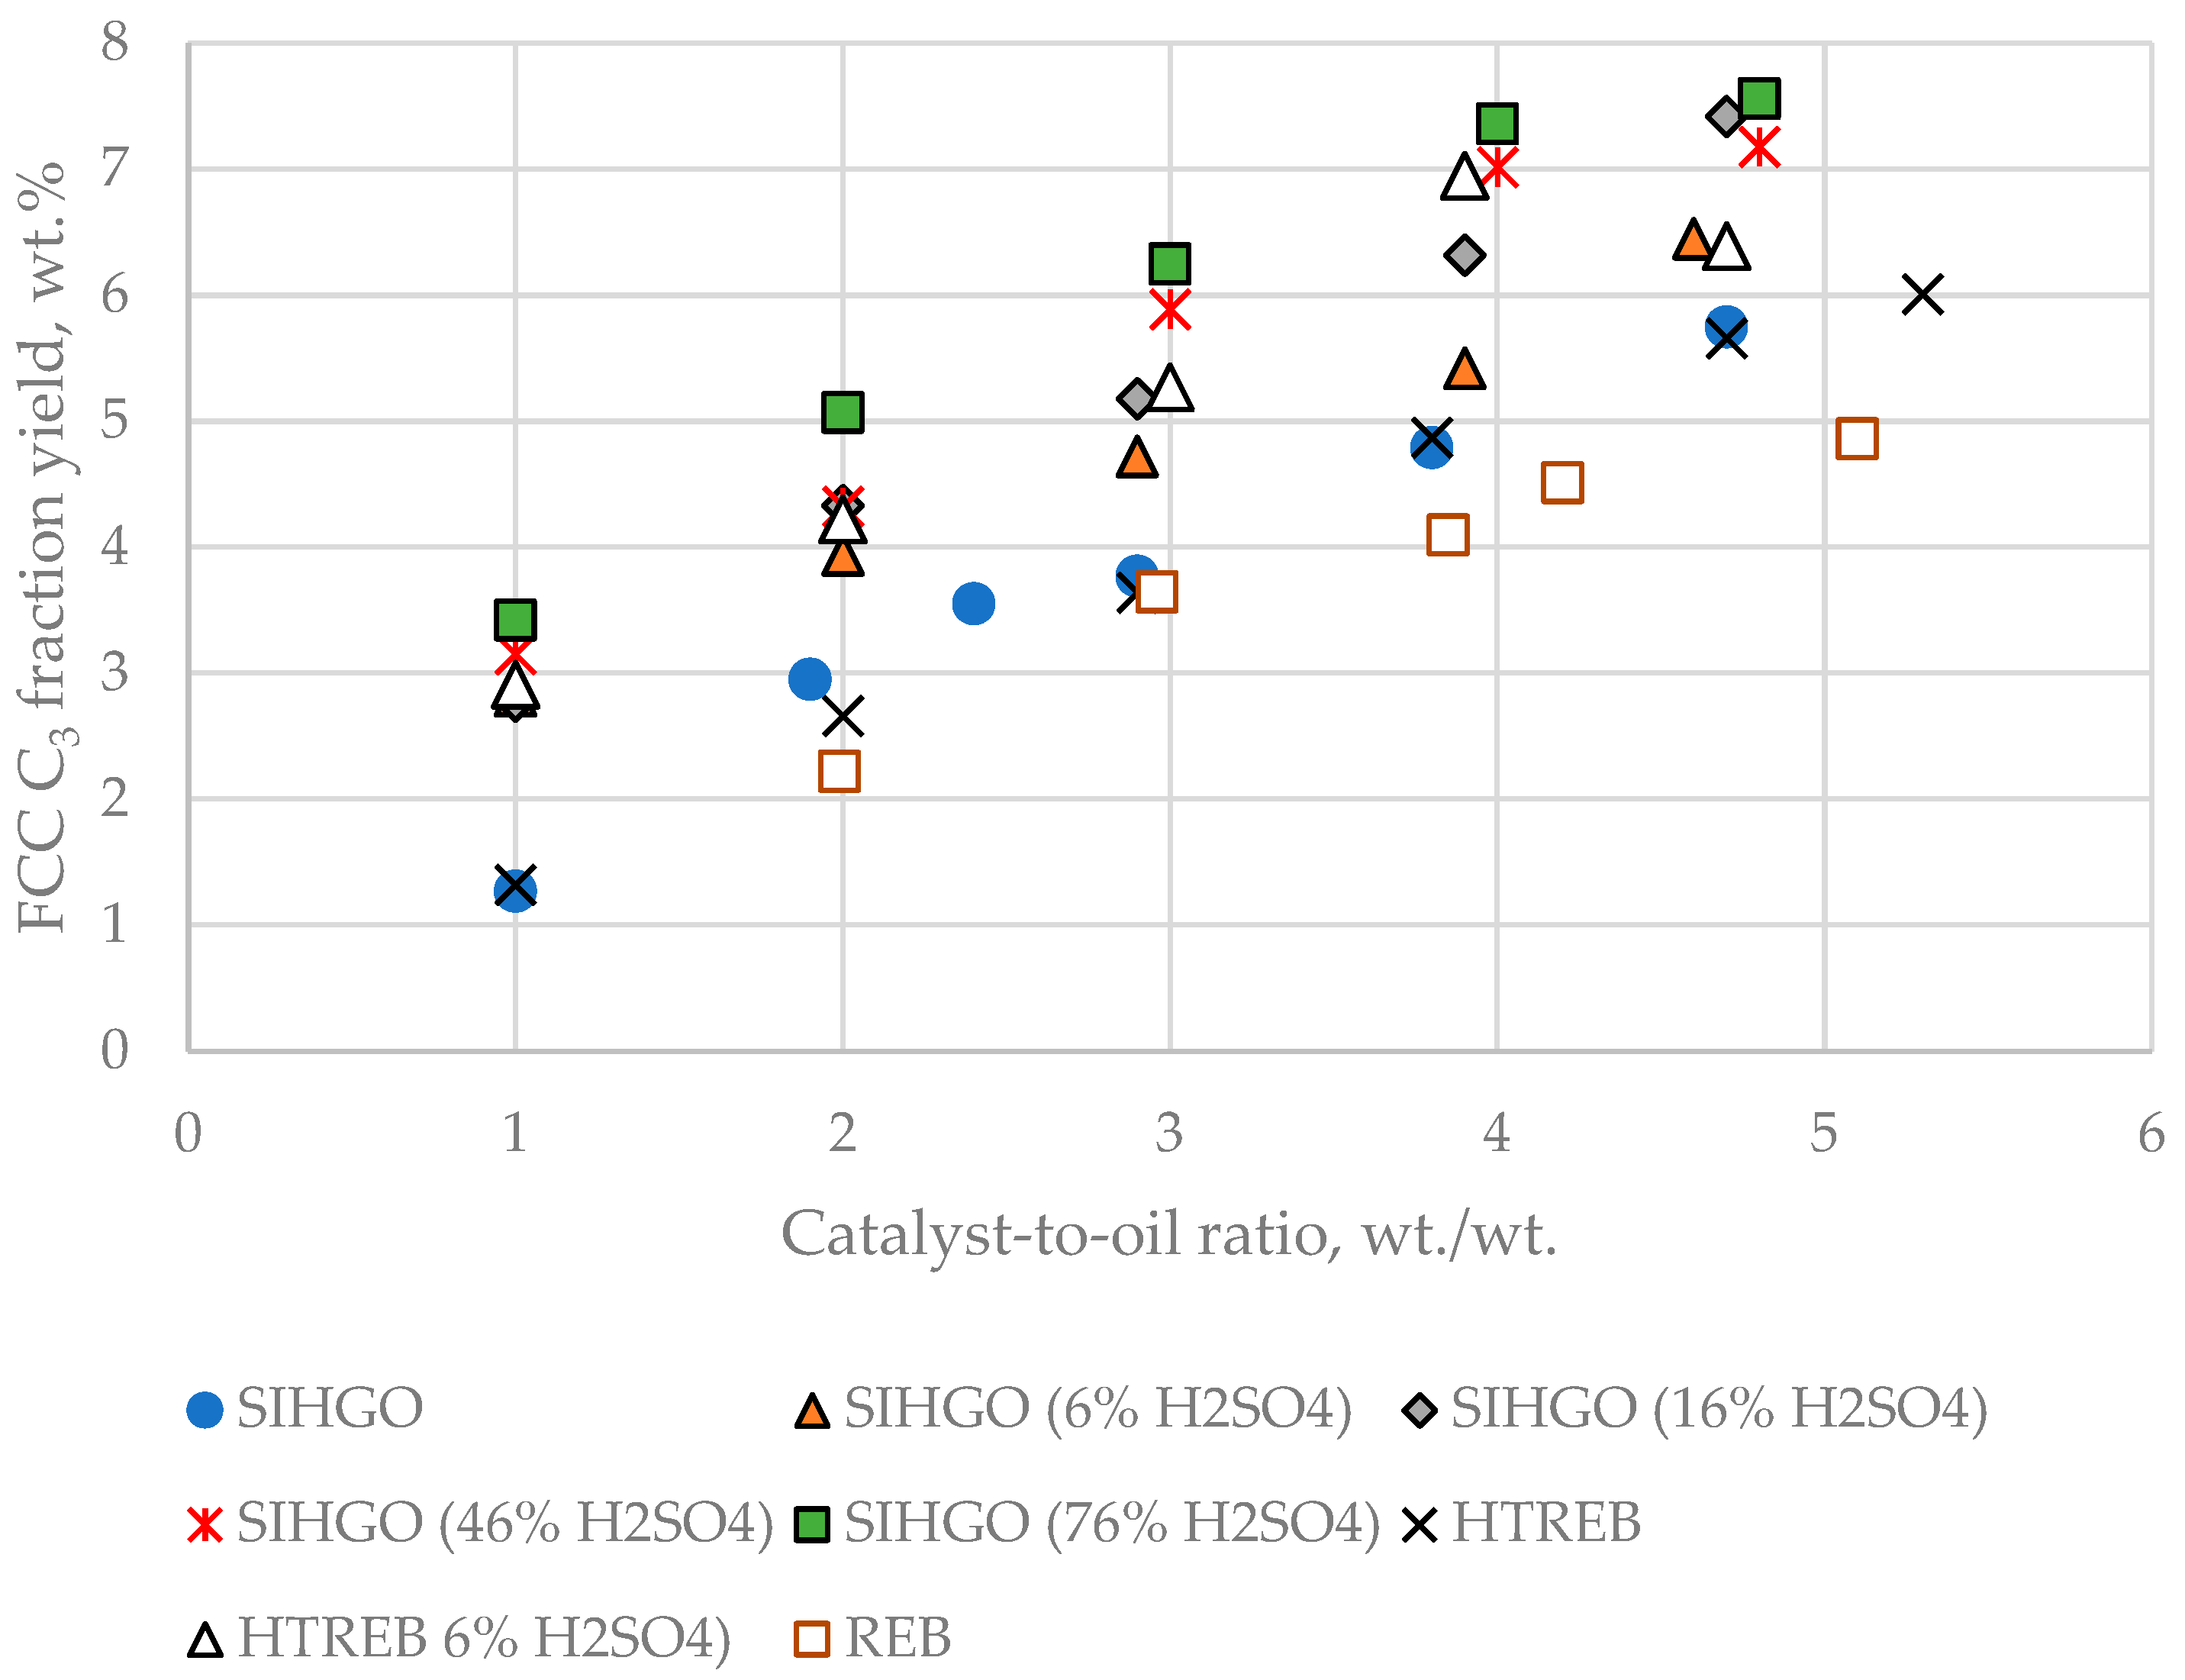
Figure 5 exhibits a plot of C
3 fraction yield dependence on CTO for the eight VGOs.
In contrast to the dry gas yield, the C3 fraction yield discerns that REB is the FCC feed that makes the least C3 fraction yield, while SIHGO (76% H2SO4) is the VGO that produces the highest yield of C3 fraction. This observation is in line with the reactivity of the examined FCC feeds. REB is the least reactive, while SIHGO (76% H2SO4) is the most reactive, and for that reason, REB makes the least C3 fraction yield, while SIHGO (76% H2SO4) produces the highest yield of C3 fraction.
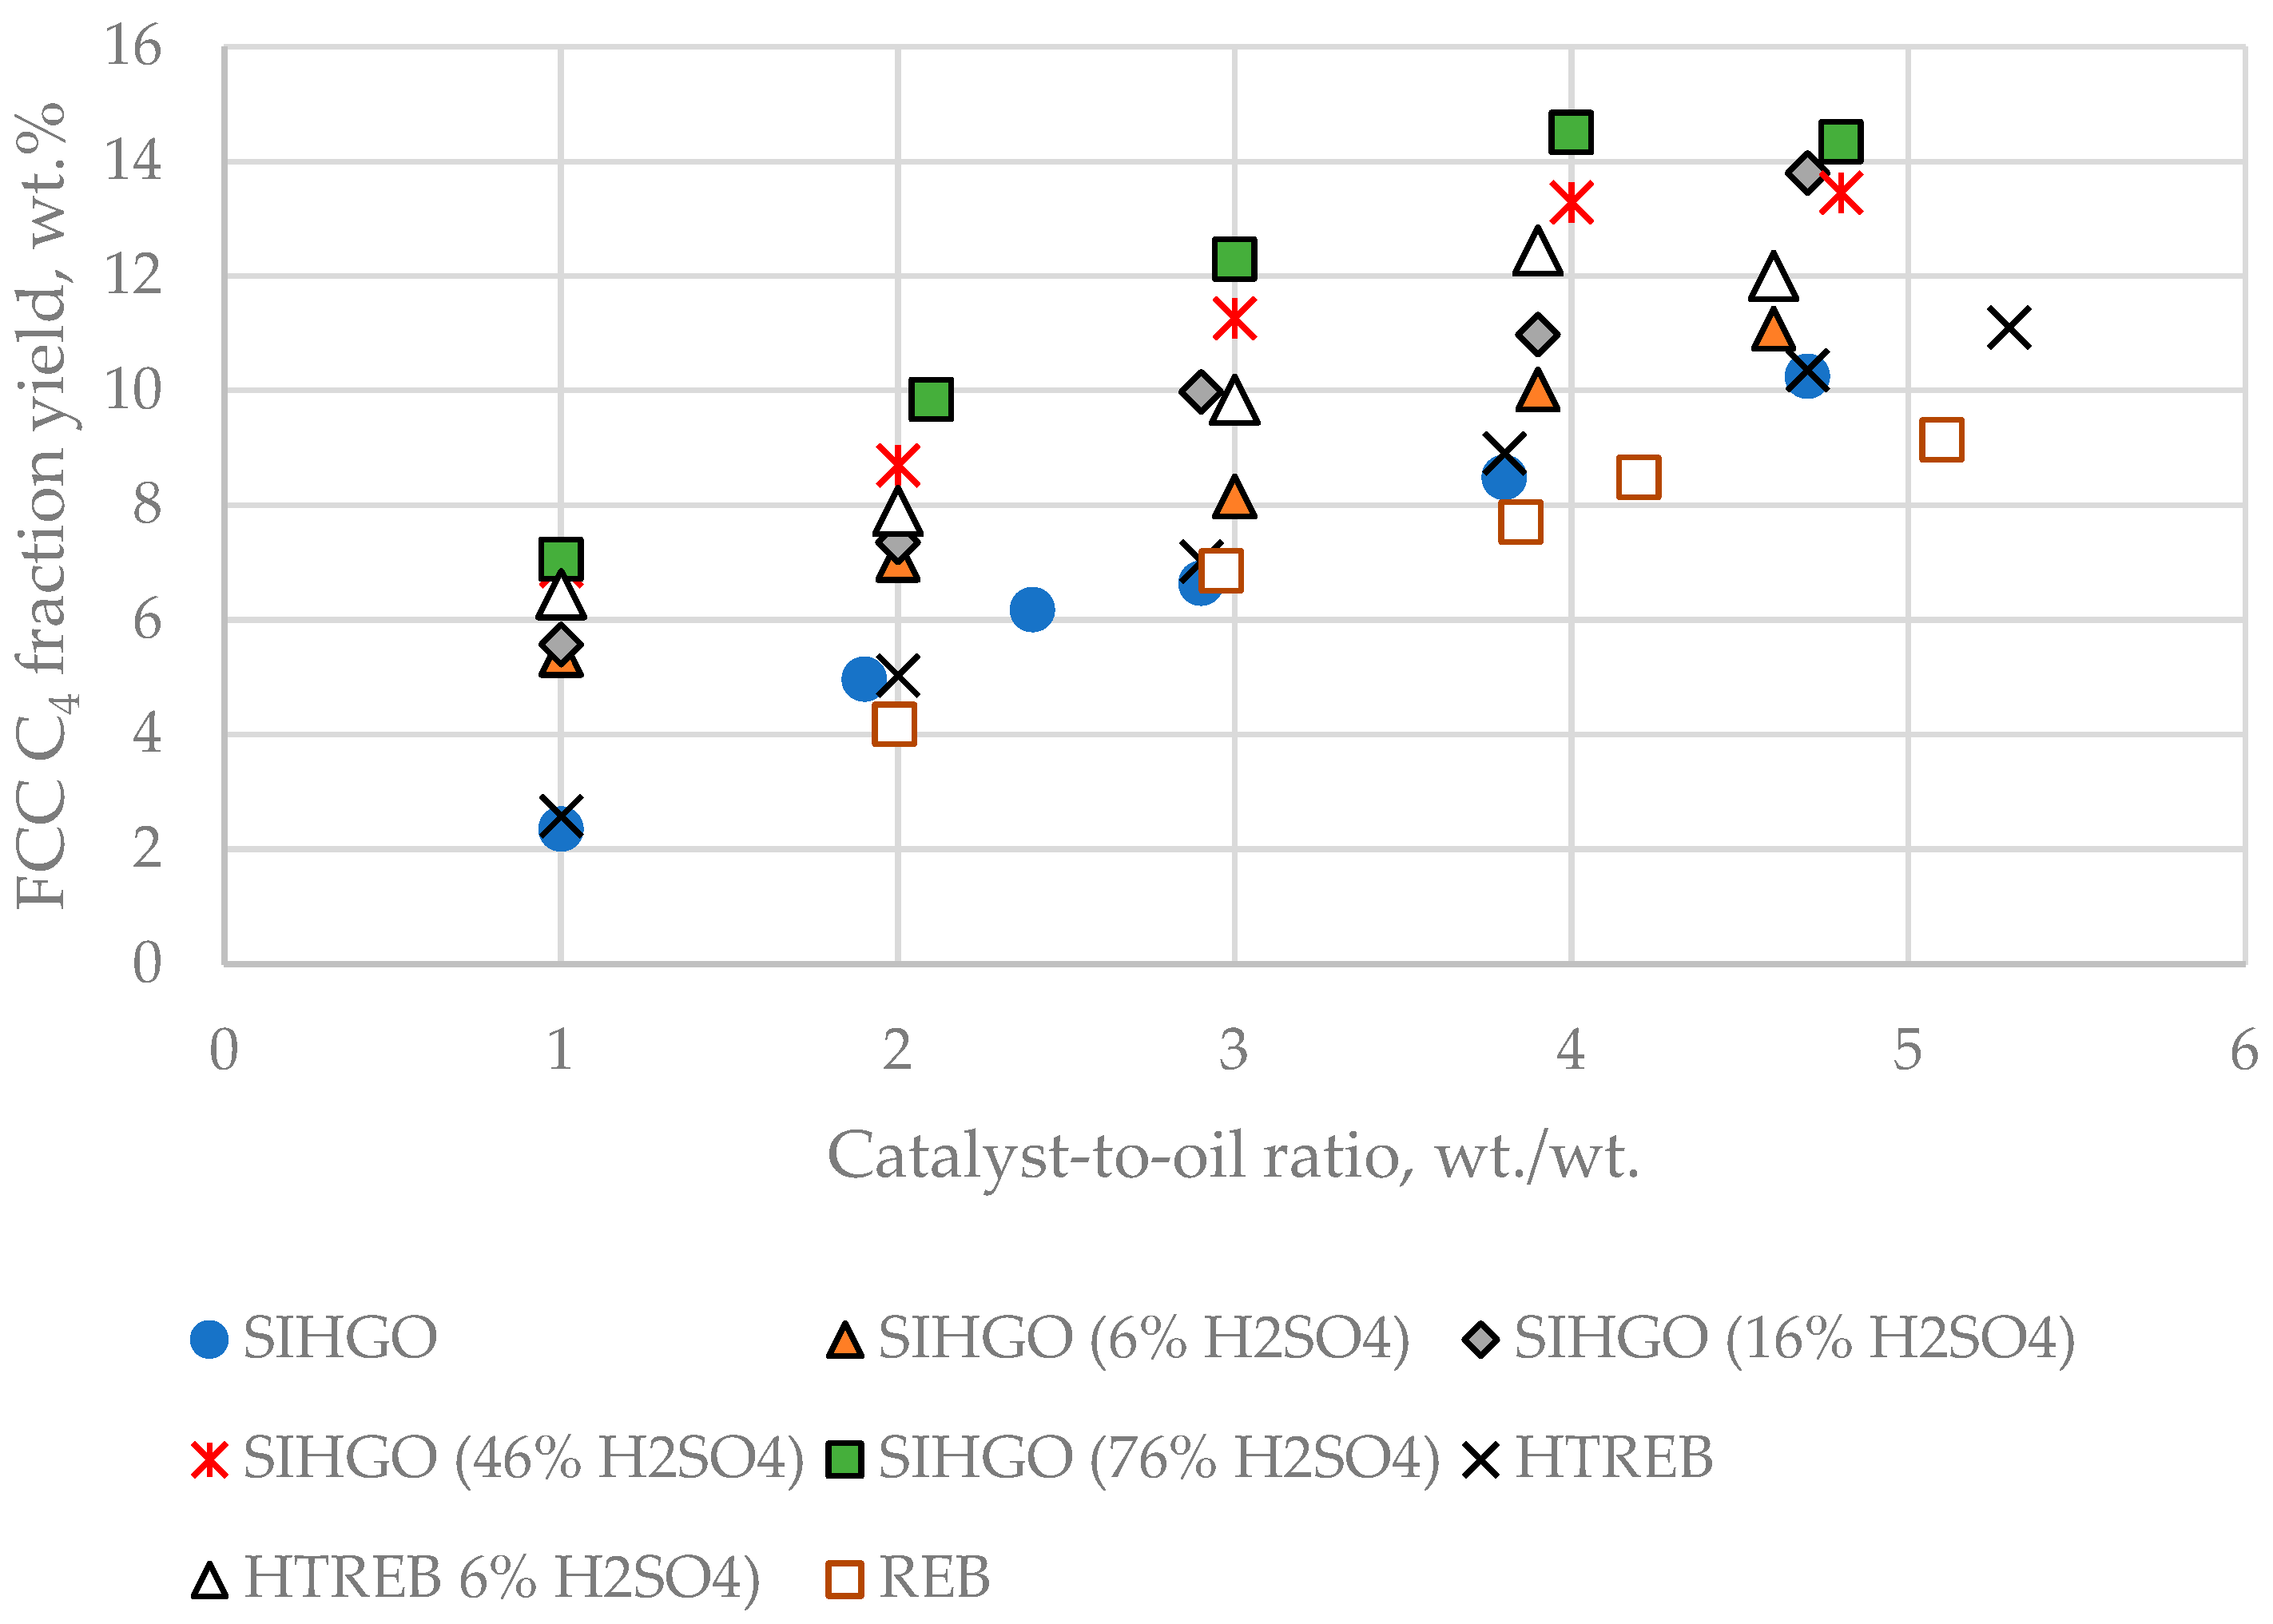
Figure 6 presents a graph of the relationship between C
4 fraction yield and CTO for the studied VGOs.
Similar to the C3 fraction yield, the C4 fraction yield distinguishes that REB is the FCC feed that makes the least C4 fraction yield, while SIHGO (76% H2SO4) is the VGO that produces the highest yield of C4 fraction. The explanation of this finding is the same as that mentioned above for the C3 fraction yield variation.
Figure 7 indicates a diagram of the dependence of LCO yield on CTO for the studied VGOs.
The data in
Figure 7 indicates that SIHGO makes the highest yield of LCO, while SIHGO (76% H
2SO
4) makes the lowest yield of LCO. SIHGO yields a higher amount of LCO than the REB and the HTREB. A possible reason for this observation may be the higher content of material boiling below 338 °C (20 wt.% in SIHGO versus 6 wt.% in HTREB and 4 wt.% in REB). The content of the material boiling below 338 °C in a FCC feed cannot be the single reason for registering different LCO yields. For example, REB, despite its lower content of LCO (4 wt.%) relative to HTREB (6 wt.% of LCO), makes more LCO than HTREB, which probably owes to the lower reactivity of REB, which results in a lower extent of conversion of the LCO boiling range material in the REB into gasoline, gas and coke. Indeed, Harding et al. [
19] showed that the material boiling below 370 °C makes more LCO than the original SIHGO, which can be the explanation for the highest yield of LCO observed during the cracking of SIHGO in the current study.
Figure 8 indicates how the HCO yield varies with changing the CTO for the studied feeds. Non-sulfuric acid-treated VGOs (SIHGO, REB and HTREB) showed much higher HCO yield due to their lower reactivity. SIHGO demonstrates a lower yield of HCO relative to REB and HTREB, probably because of the lower content of the material boiling above 338 °C. With the other feeds, the higher the reactivity, the lower the yield of HCO.
Figure 9 shows a plot of the linear dependence of coke yield on CTO for the studied VGOs. It is evident from this data that SIHGO and REB exhibit the highest yield of coke, while SIHGO (76% H
2SO
4) demonstrates the lowest coke yield.
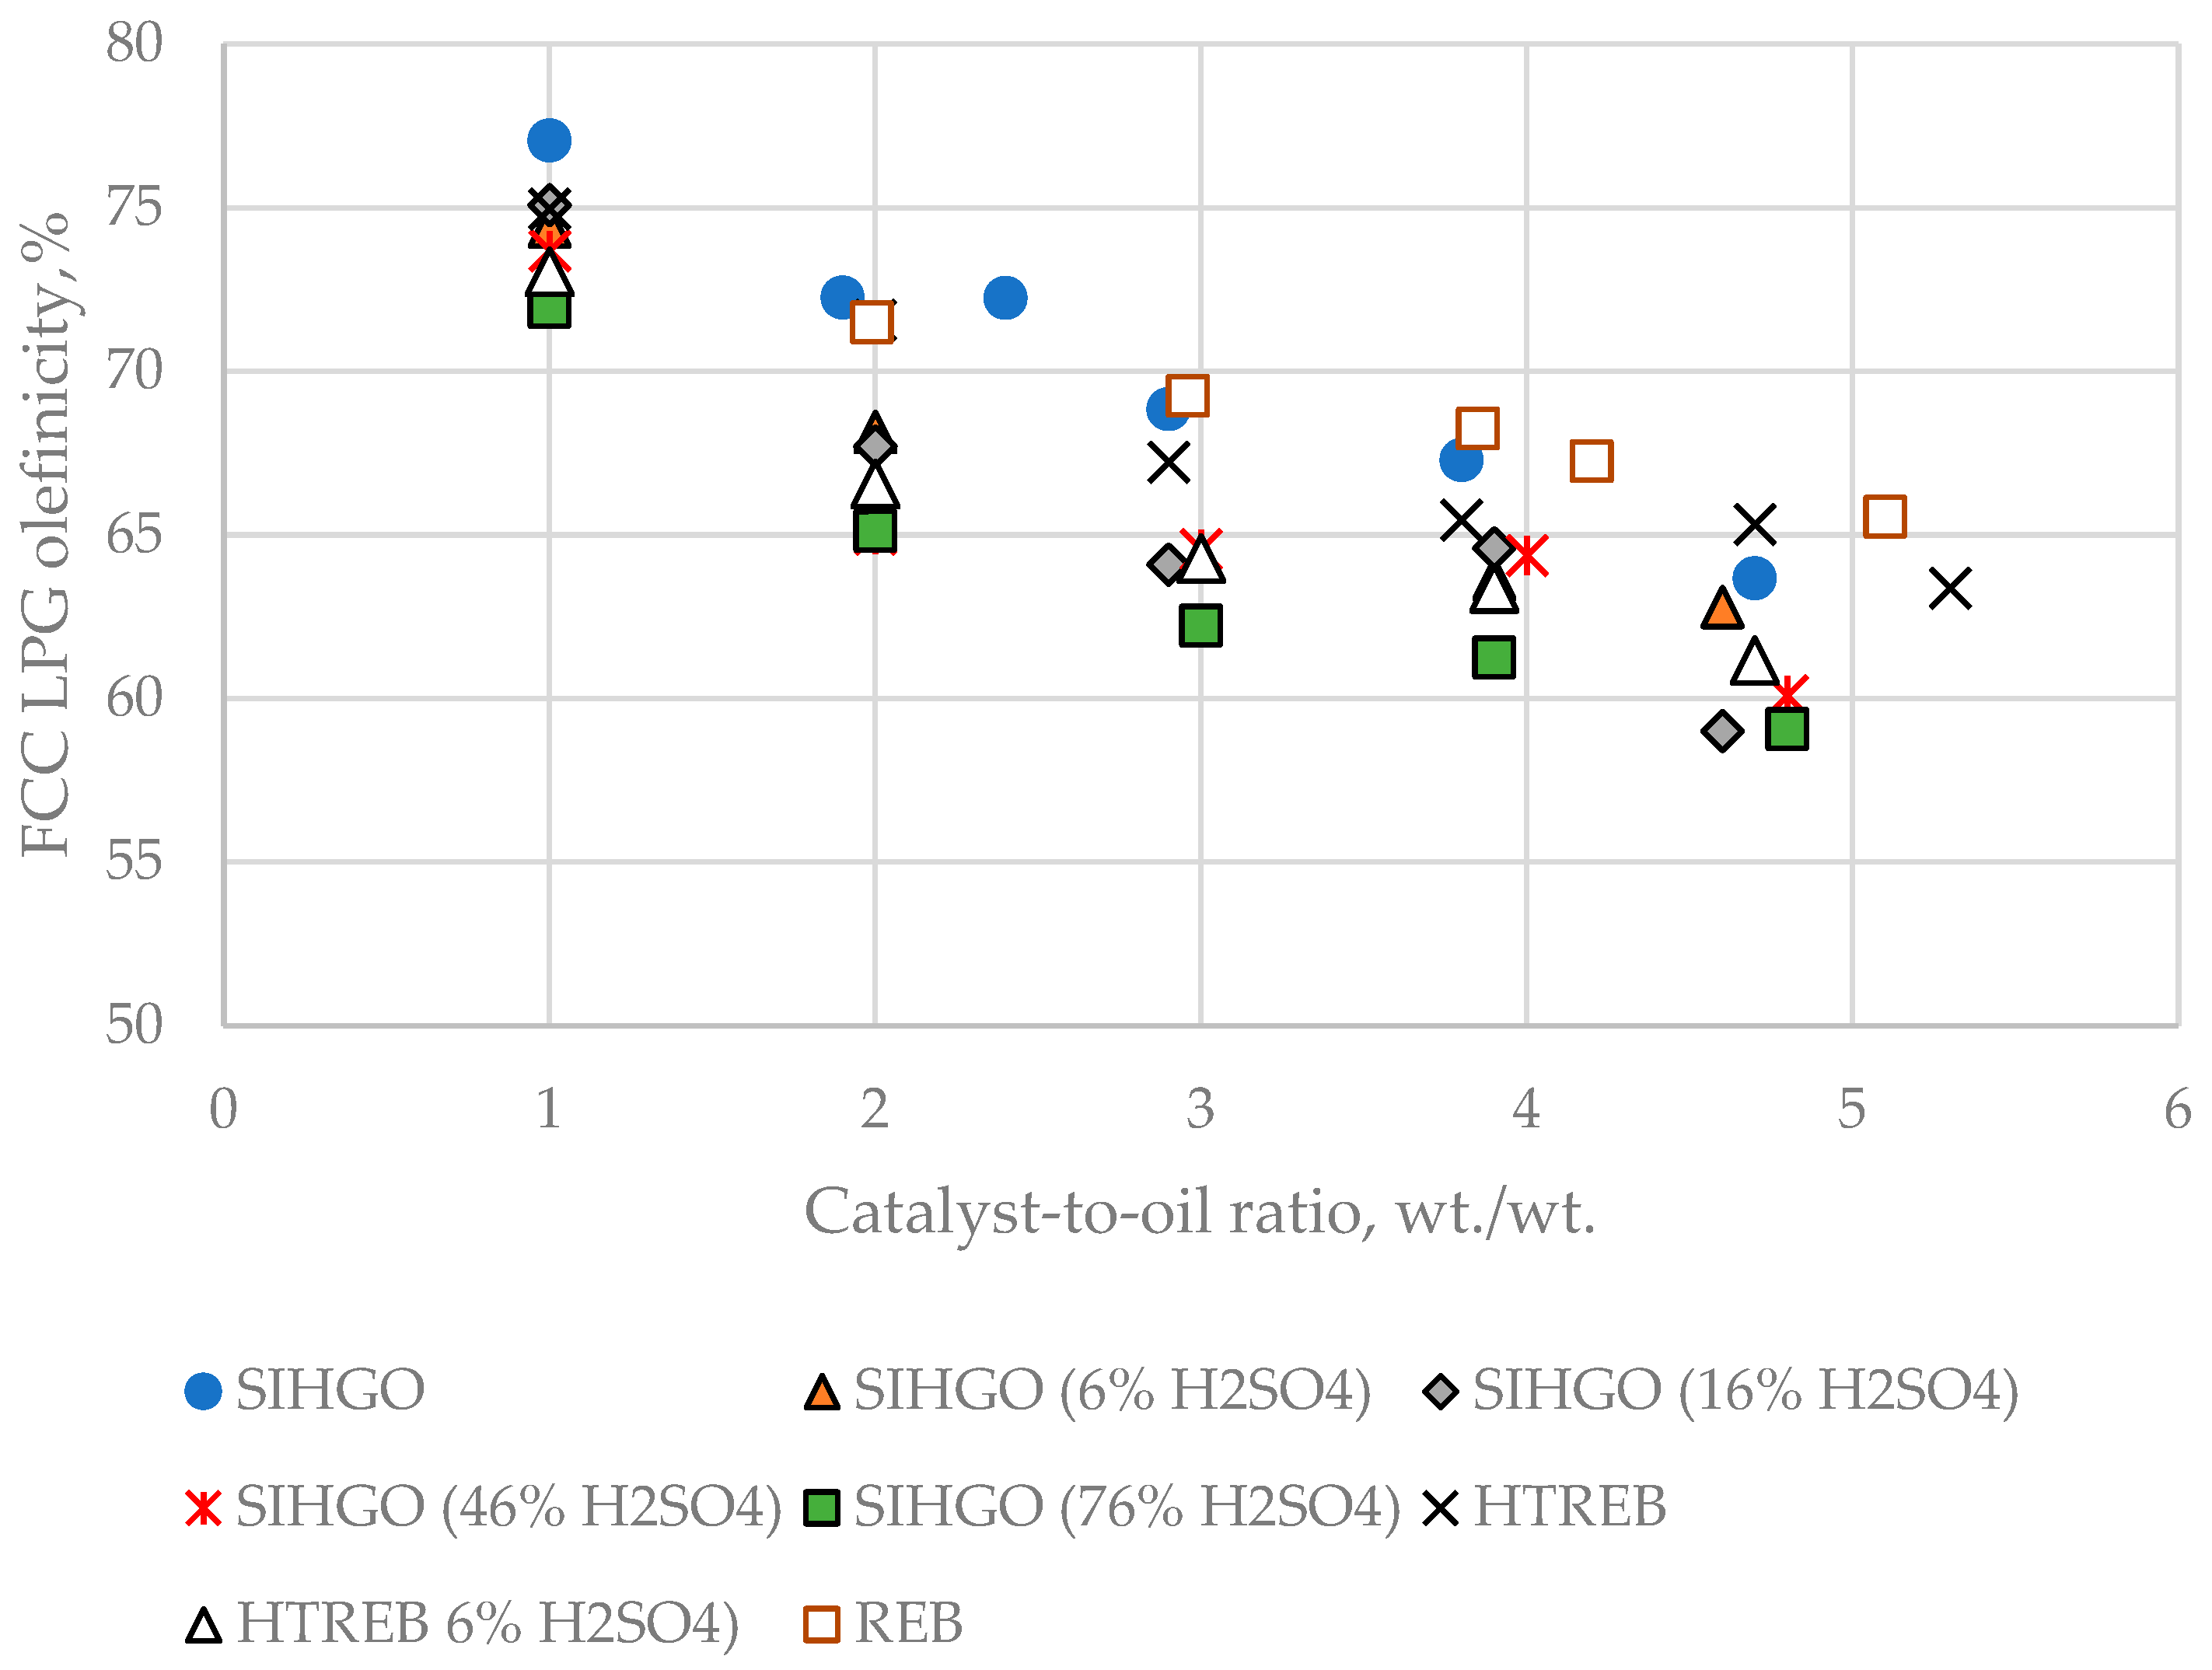
Figure 10 shows LPG olefinicity variation as a function of CTO for the eight VGOs.
The data in
Figure 10 displays that LPG olefinicity decreases with CTO enhancement for all feeds, being higher for the non-sulfuric acid-treated VGOs (SIHGO, REB and HTREB) and the lowest for SIHGO (76% H
2SO
4). The higher the feed reactivity, the lower the LPG olefinicity because at higher conversion, a bigger proportion of secondary hydrogen transfer reactions leading to lower olefinicity will take place.
Table 6 summarizes the conversion, product yields, gasoline composition and gas chromatographic research octane number (RON) and motor octane number at the maximal conversion (overcracking point conversion).
In order to determine the presence or absence of statistically meaningful relations between the FCC feed characterizing parameters (data in
Table 3) and the experimental cracking data from
Table 6, intercriteria analysis (ICrA) evaluation was performed.
Table 7 and
Table 8 summarize μ-values and ν –values obtained from ICrA. Concerning the yields at the point of maximum gasoline yield, one can see that the dry gas (C
2) yield has no statistically significant relation to any FCC feed characteristic, which could be a result of the fact that the dry gas is a product of thermal cracking. The C
3 fraction yield has negative consonances with the contents of heavy aromatics and resins. Regressing the data allowed us the develop the following correlation for C
3 fraction yield, as shown in Equation (10).
where:
The yield of C3 fraction at the overcracking point, wt.%;
Content of heavy aromatics in FCC feed, wt.%;
Molecular weight of FCC feed, g/mol;
Content of resins in FCC feed, wt.%.
Equation (10) indicates that the increase of heavy aromatics and resin contents and that of molecular weight of FCC feed leads to a reduction in the C3 fraction yield.
The data in
Table 7 and
Table 8 indicate that the yields of C
4 fraction and gasoline (cracked naphtha = CN) have strong negative consonances with the heavy aromatics content in the FCC feed, which is very well illustrated in
Figure 11a,b. The higher the FCC feed heavy aromatics content is, the lower the yields of C
4 fraction and gasoline are.
Regarding the yields of LCO and HCO, the following regressions were developed (Equations (11) and (12)).
where,
LCO yield at the point of maximum gasoline yield, wt.%;
Content of fraction boiling below 338 °C in FCC feed, wt.%
The yield of coke at the overcracking point and the Δ Coke (this is the coke laid down on the catalyst) was found to best correlate to the contents of hydrogen and heavy aromatics, as exemplified in Equations (13) and (14).
The bottom cracking, defined as
, was found to depend mainly on the content of heavy aromatic compounds in the FCC feed as shown in
Figure 12.
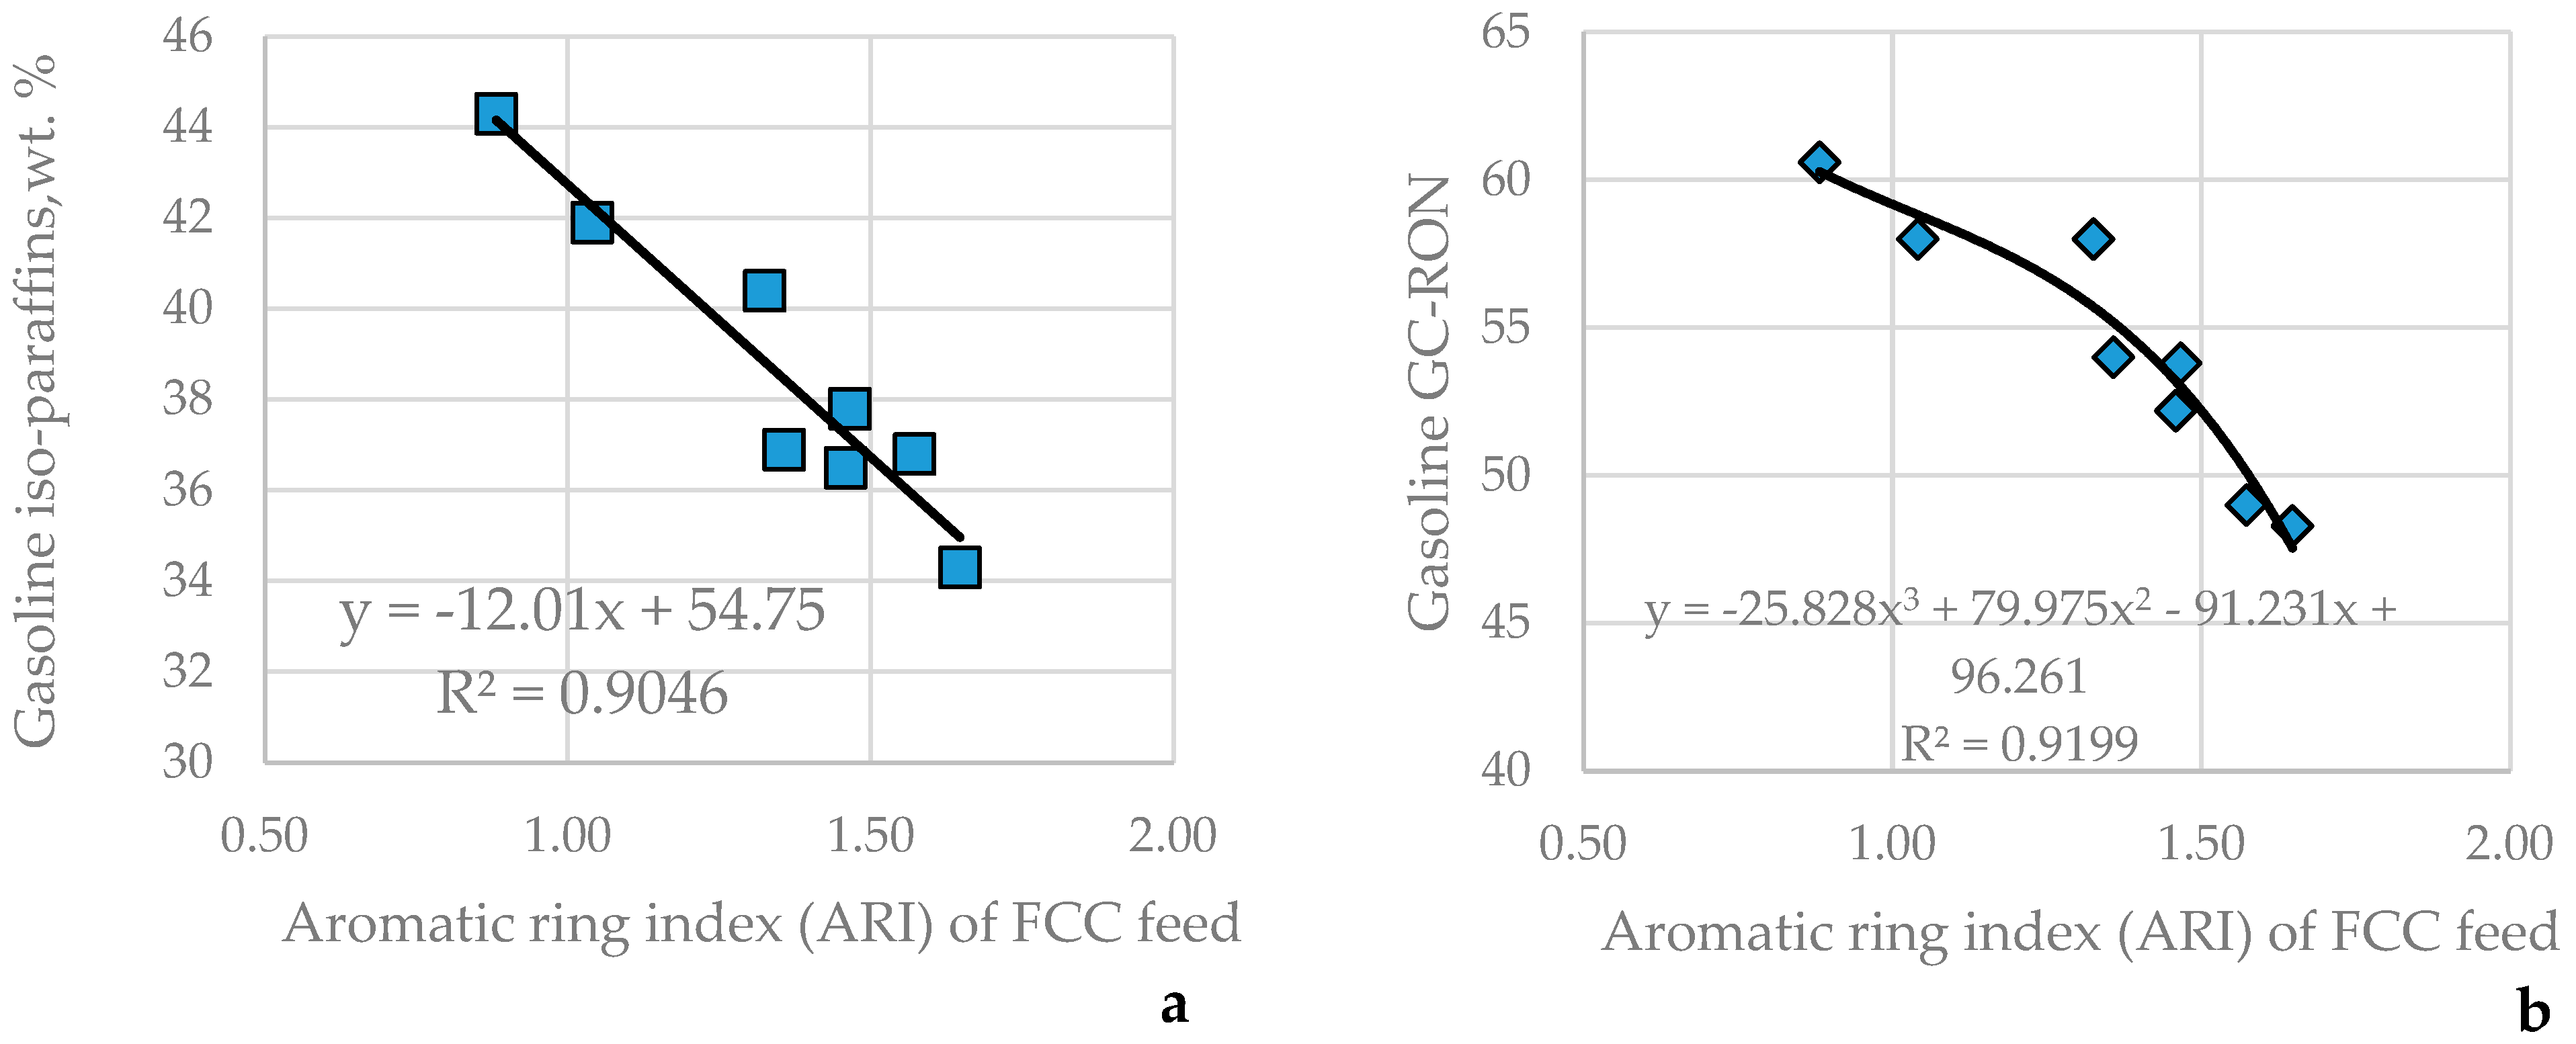
Some characteristics of gasoline were found to be related to the feed ARI.
Figure 13 indicates the relationships between FCC feed ARI and the iso-paraffin content in the gasoline (
Figure 13a) and its research octane number (
Figure 13b).
As apparent from the data in
Table 7 and
Table 8, the gasoline aromatic content has a weak positive consonance with the feed aromatic carbon content (μ = 0.79; υ = 0.21), and the gasoline olefin content has a weak positive consonance (μ = 0.75; υ = 0.25) with feed ARI. The gasoline n-paraffin and naphthene contents are in dissonance with any of the feed characteristics studied.
All results obtained in this research underline the significant role the heavy aromatic content plays in the catalytic cracking of vacuum gas oils. The heavy aromatics, as shown in the data in
Table 3, can be diminished not only by sulfuric acid treatment but also by hydrotreatment. HTREB has been obtained by hydrotreatment of REB in a commercial FCC feed hydrotreater. An earlier study [
52] showed how the severity of hydrotreatment in commercial FCC feed hydrotreaters can affect the quality of HTREB. As evident from the data in
Table 3, as a result of the hydrotreatment of REB, 47.5% of the heavy aromatics components are converted to other FCC feed components. The heavy aromatics in REB, HTREB, and SIHGO may have different impacts on the FCC process performance. In order to assess how the heavy aromatics in the three VGOs (SIHGO, REB and HTREB) influence conversion and product yields, the approximate linear combination technique described by Harding et al. [
19] was applied to calculate the yield distribution of the heavy aromatics at a constant catalyst-to-oil ratio of 4.0 wt./wt. from the cracking experiments with SIHGO, SINGO (6%H
2SO
4), HTREB(6%H
2SO
4), and REB.
Table 9 summarizes the results of this comparison.
The data in
Table 9 clearly indicate that the heavy aromatic components in the three studied vacuum gas oils have different crackability. The most crackable are the heavy aromatics from REB. During hydrotreatment, the heavy aromatics in REB are hydrogenated, and their content is significantly reduced at the expense of augmentation of saturate content (see the data of REB and HTREB in
Table 3). Despite the significant reduction in the heavy aromatics and simultaneous increase in saturate content, the difference in reactivity between HTREB and REB is not as big as that between HTREB and HTREB (6% H
2SO
4) and that between SIHGO and SIHGO (6% H
2SO
4) (see the data in
Figure 1 and
Table 4). This suggests that the hydrogenation of the heavy aromatics during the FCC feed hydrotreatment does not significantly affect the removal of the most inhibiting species in the FCC process–the basic nitrogen compounds [
53]. The low hydrodenitrogenation extent observed in the FCC feed hydrotreatment [
54], along with the noted conversion of the neutral nitrogen species in basic ones [
55,
56,
57] during the gas oil hydrotreatment, can explain why the difference in reactivity of REB and HTREB is not very big. The removed heavy aromatics from REB in the process of its hydrotreatment, as shown in the data in
Table 9, exhibit much higher crackability than the heavy aromatics removed by treatment with 6% H
2SO
4 of both SIHGO and HTREB. Obviously, the treatment with 6% H
2SO
4 of both SIHGO and HTREB removes these species, which have a great influence on the VGO reactivity in the process of catalytic cracking, and their reactivity is considerably lower than that of the whole VGO. Based on the data in
Table 9, one may suggest that the heavy aromatic fraction from HTREB contains a higher level of inhibitors for catalytic cracking than that in SIHGO. This observation coincides with the higher slope of heavy aromatics removal, which is evident for HTREB in comparison with SIHGO (see
Figure 1a). The data in
Table 9 also indicate that the heavy aromatic fraction of HTREB suppresses the formation of gaseous products (dry gas, C
3 fraction, and C
4 fraction). A similar suppressing effect was reported by Harding et al. [
19], where the polar components were found to suppress the C
4 fraction and gasoline formation. Therefore, it can be deduced that the heavy aromatics contained in the various VGOs may have diverse effects on conversion level and product distribution during VGO catalytic cracking.


