Article

A New Method for Assessing the Performance of Photovoltaic Module Enhancing Techniques Based on the Lifespan and Power Effectiveness Factor

1
Solar Energy Research Institute, Universiti Kebangsaan Malaysia, Bangi 43600, Selangor, Malaysia
2
Faculty of Engineering and Technology, Multimedia University, Jalan Ayer Keroh Lama, Bukit Beruang 75450, Melaka, Malaysia
3
School of Mechanical Engineering, Universiti Sains Malaysia, Nibong Tebal 14300, Penang, Malaysia
4
Department of Mechanical Engineering, Universiti Teknologi Petronas, Seri Iskandar 32610, Perak, Malaysia
*
Authors to whom correspondence should be addressed.
Processes 2025, 13(5), 1311; https://doi.org/10.3390/pr13051311
Submission received: 14 March 2025 / Revised: 23 April 2025 / Accepted: 24 April 2025 / Published: 25 April 2025

Abstract

:
Photovoltaic (PV) module enhancers—such as coolers or reflectors—are developed to improve the electrical output and thermal management of PV systems. A previous method evaluated enhancer effectiveness based solely on the lifespan of both the PV module and the enhancer. However, this approach did not account for the net power contribution of the enhancer, limiting its applicability in performance comparisons. To address this gap, a new metric is introduced, the lifespan and power effectiveness factor ( F L S P E ), which incorporates both power and durability dimensions. The proposed method requires five parameters: the lifespan of the PV module ( P V L S ) and the enhancer ( P V C L S ), the net power from the enhancer ( P P V C ), the baseline PV power without enhancement ( P P V ), and the maximum PV power under standard test conditions ( P P V , m a x ). Experimental data from prior studies were used to validate the method. The results show that the F L S P E values for different enhancers ranged from 0.22 (22%) to 0.37 (37%). Maximum or minimum performance occurs when the F L S P E value is either unity or equivalent to the ratio of the PV’s power output (PV without an enhancer) to its maximum power under standard test conditions ( P P V P P V , m a x ), respectively. The proposed method not only offers improved clarity in evaluating PV enhancer technologies but also provides a robust framework for selecting durable and power-efficient PV cooling solutions.

1. Introduction

The sun has been the primary source of energy for centuries, playing a crucial role in various aspects of life. Historically, people have relied on solar energy for warmth and for drying food items such as fruits, grains, and meat. Over time, advancements in science have led to the development of technologies that harness solar energy for heating and electricity generation [1]. One such technology is the photovoltaic (PV) module, which directly converts sunlight into electrical power [2]. The share of solar PV electricity generation is increasing every year, as illustrated in Figure 1 [3]. This growth has motivated researchers to explore ways to enhance PV efficiency, such as integrating cooling systems or reflectors. The choice of an appropriate enhancement method depends largely on environmental conditions. In regions experiencing high solar radiation and elevated ambient temperatures, cooling mechanisms are preferred to reduce PV module temperature, as fluid movement aids in heat dissipation from the PV surface [4]. Consequently, this improves PV performance [5]. Various cooling techniques exist, including passive and active cooling, as well as natural and forced convection systems that utilize liquids, air, or phase change materials. In recent years, extensive research has been conducted on PV cooling technologies (see Table 1).
In contrast, reflectors are more suitable for regions with lower solar radiation and ambient temperatures. Initially introduced in 1958, reflectors were designed to expand the area of incident solar radiation, thereby improving PV efficiency [19]. Experimental studies have examined the impact of reflector parameters on the PV output power [20], revealing an enhancement of up to 60%. A PV system equipped with an aluminum sheet reflector demonstrated a 15% increase in the output power [21]. The performance of a PV module with a V-trough concentrator was assessed both numerically and experimentally in outdoor conditions, showing a maximum power improvement of 31.20% [22]. Another outdoor experimental study on a PV system with a V-trough concentrator recorded a 48% rise in the output power [23]. Additionally, an experimental and economic analysis of a PV module integrating both a cooler and a reflector indicated a 10.68% efficiency gain, with a payback period of 4.2 years [24]. A numerical study explored the effects of tilt angles on the efficiency of a PV module using an aluminum sheet reflector [25]. The findings demonstrated that increasing the tilt angle enhances performance, with an optimal tilt of 75° yielding a peak efficiency of 19%. A novel PV system featuring a curved reflector was introduced, resulting in a spatial solar power increase of 61% [26]. A combination of theoretical and experimental research on a PV system with a flat reflector and cooling mechanism showed an efficiency improvement of 36% [27]. Furthermore, a three-dimensional model incorporating a stainless-steel reflector was developed, leading to a PV efficiency boost of 34.16% [28]. Typically, PV enhancers are constructed from materials such as stainless steel, aluminum, or copper, which offer high thermal conductivity for better heat dissipation. However, their lifespan may vary depending on environmental conditions.
A prior study [1] examined the relationship between the lifespan of both PV modules and their respective enhancers, introducing the lifespan effectiveness factor, F L S E , as shown in Equation (1). This factor simplifies the comparison of different PV enhancer types based on their operational lifespan. It is defined as follows:
F L S E = P V C L S P V L S ,
where P V C L S and P V L S represent the lifespan of the PV enhancer and the PV module in years, respectively.
However, Equation (1) does not account for the power parameter of PV modules when paired with enhancers, which complicates performance comparisons when this factor is considered. This limitation of the existing approach can be illustrated with an example.
Suppose three different PV coolers—Type A, Type B, and Type C—are evaluated using the same PV module with a lifespan of 15 years under identical operating conditions, including solar irradiance, ambient temperature, and wind velocity. The lifespan of these coolers is assumed to be 7, 15, and 23 years, respectively. Based on Equation (1), all three coolers are deemed lifespan-effective, with Type B and Type C being superior to Type A in terms of longevity.
However, if the power of these coolers is also considered, the evaluation changes. Assuming the power outputs are 12 W for Type A, 5.6 W for Type B, and 4 W for Type C (as presented in Table 2), the comparison becomes more complex and requires a more comprehensive evaluation metric.
Determining which PV cooler type is the most effective in terms of both the lifespan and power remains a challenge. The existing method does not provide clear answers to this critical challenge, making it difficult to accurately assess the overall performance of each PV cooler. Consequently, comparing different PV cooler types in a meaningful way becomes problematic. This limitation may hinder informed decision-making regarding the optimal design choice for PV cooling applications.
To address this issue, a new approach is required—one that considers both the lifespan and power of PV coolers simultaneously. By overcoming the constraints of the existing method, a more comprehensive evaluation framework can be developed, facilitating better comparisons and enabling improved design decisions for PV cooling technologies.
Hence, the aims of this study are as follows:
  • This study introduces a novel method that links the lifespan and power of both PV modules and their coolers to improve the accuracy of PV enhancer performance evaluations.
  • Validation of the method was conducted using data from prior experimental studies, demonstrating its applicability in real-world scenarios.
  • The proposed method is expected to benefit researchers, manufacturers, and designers working in PV enhancement technologies.
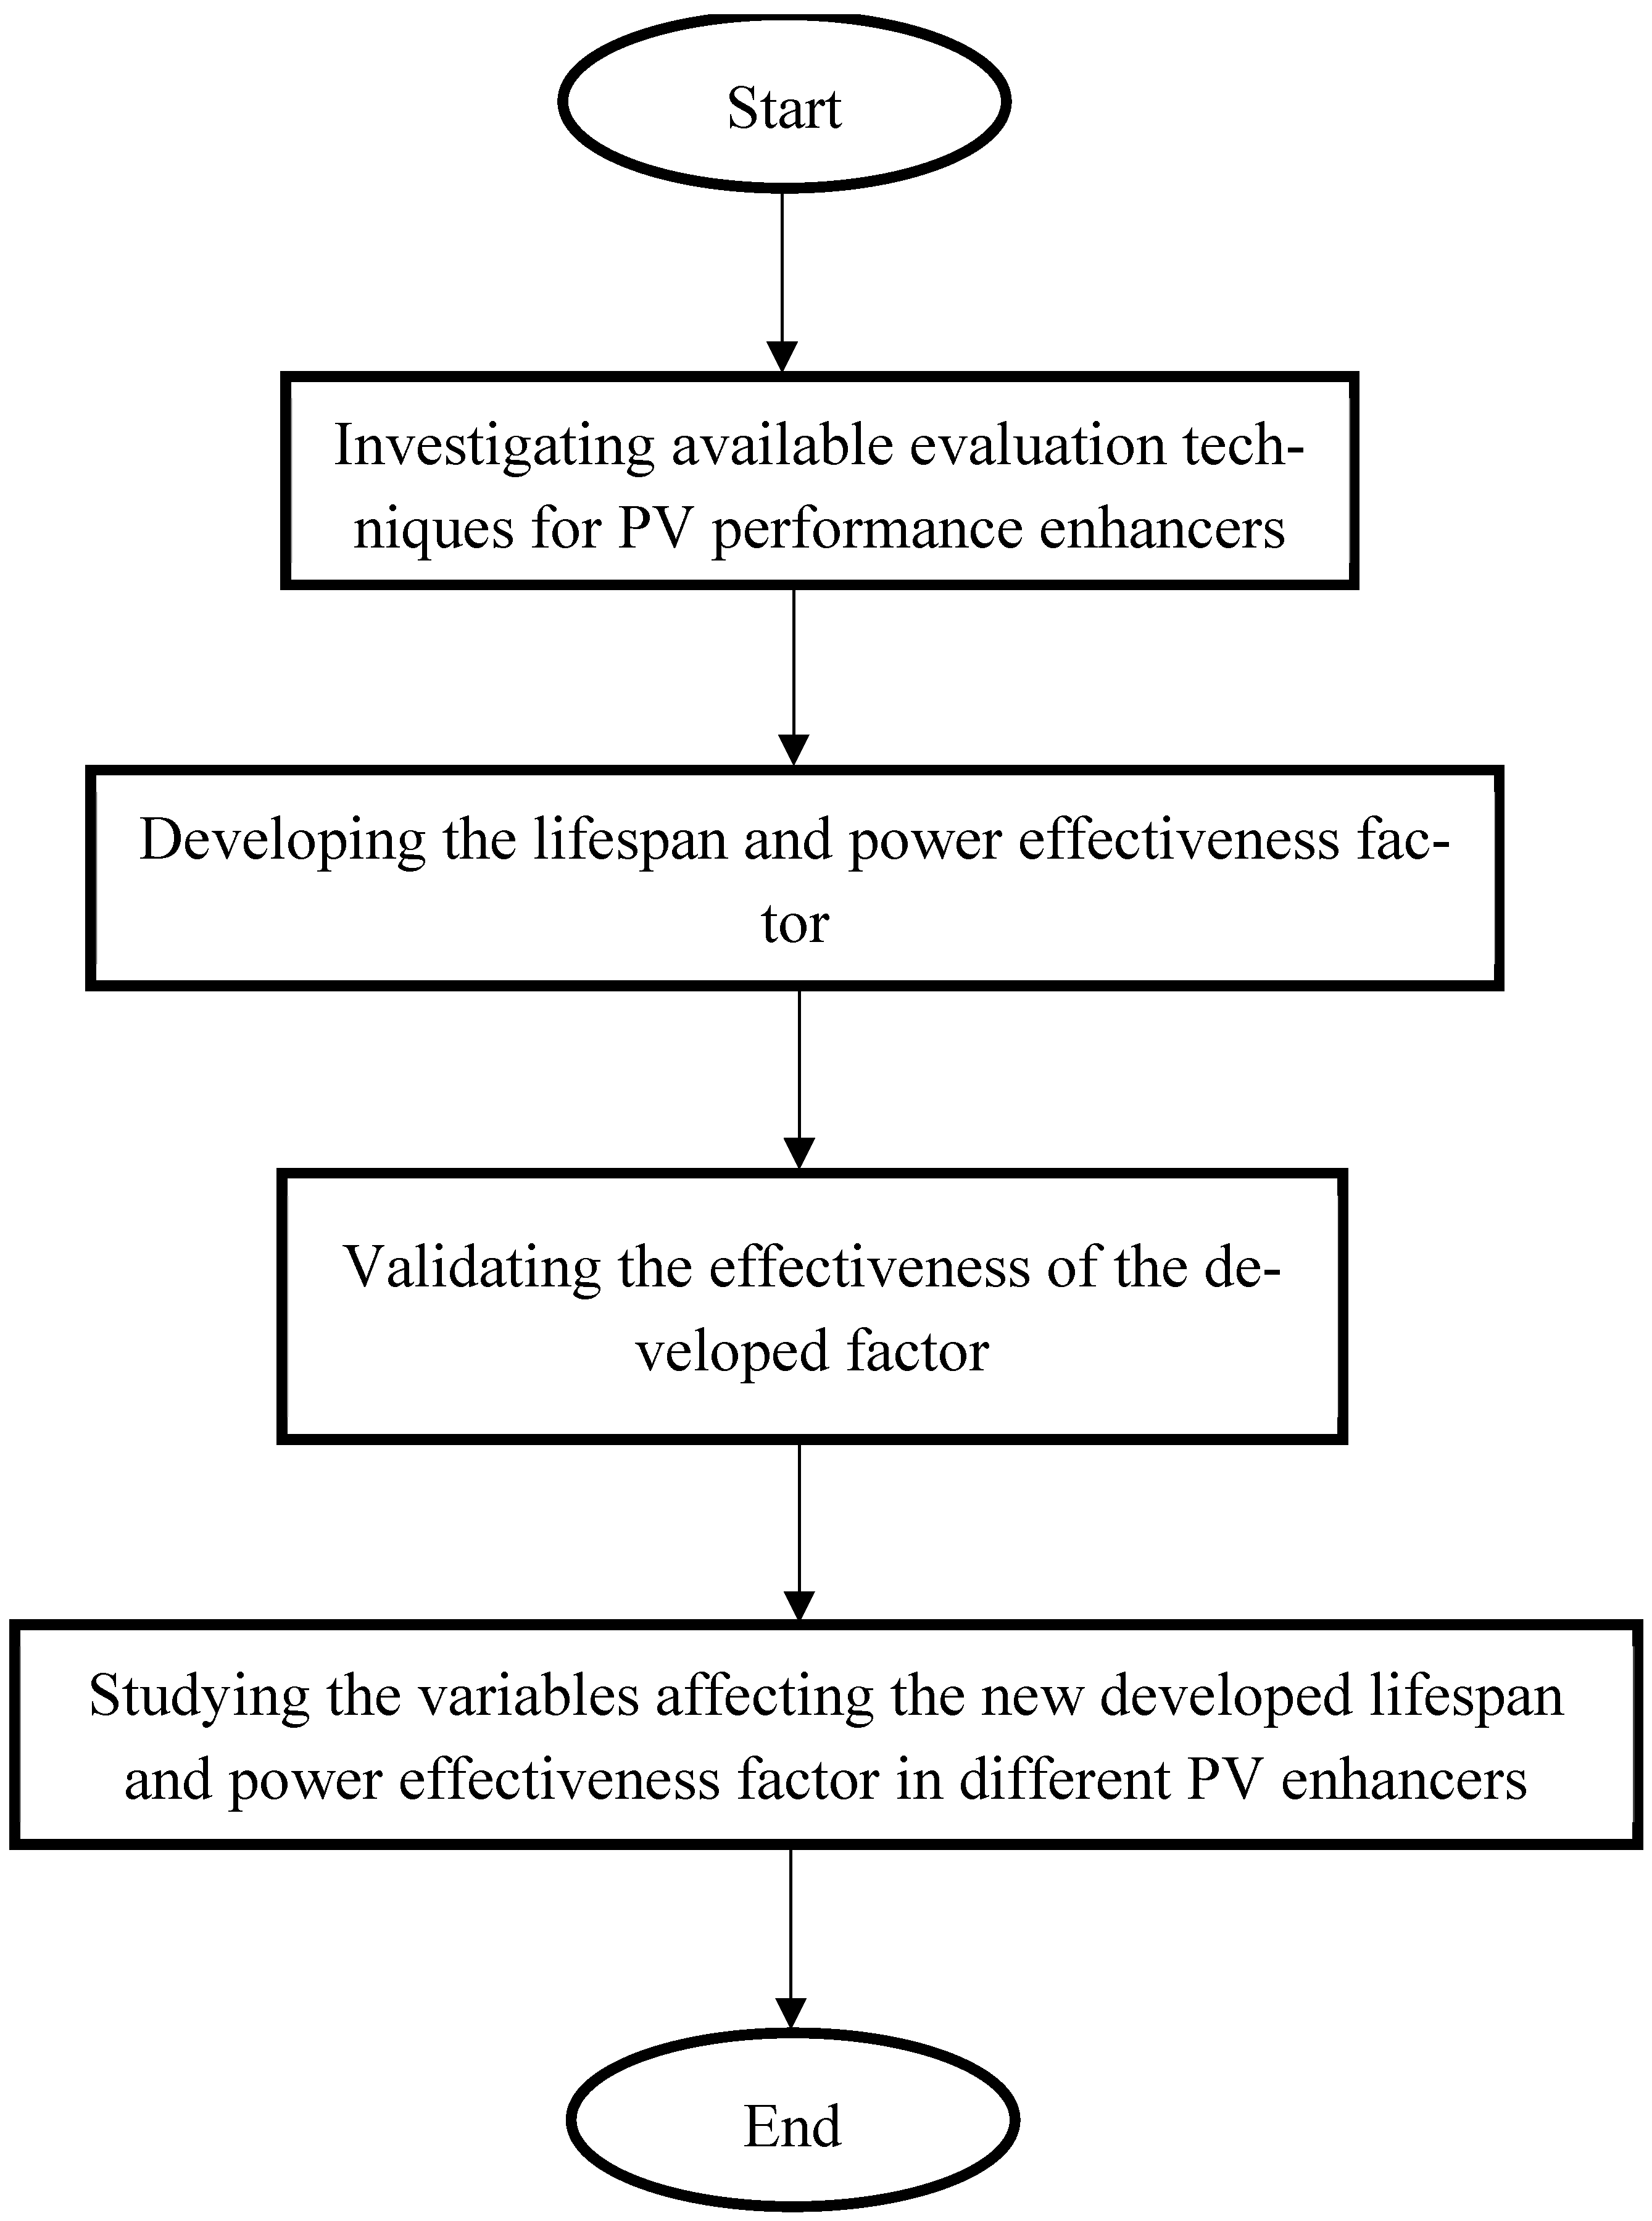
This paper is structured into four sections. Section 1 presents an introduction covering PV enhancer types, previous studies, and the motivation behind this research. Section 2 details the proposed method, highlighting its importance in assessing PV enhancer performance, along with the research methodology. Section 3 discusses the results, while Section 4 provides the concluding remarks of this study.

2. Methodology

Figure 2 illustrates a structured flowchart that encapsulates the key methodological steps undertaken in this research. This study begins with a comprehensive literature review focused on existing evaluation methods for photovoltaic (PV) enhancers. This initial step aims to identify current practices, highlight methodological shortcomings, and uncover potential areas for improvement. By critically examining the limitations and inconsistencies in the existing frameworks, the foundation is laid for the development of a more holistic and reliable assessment approach.
Building upon the insights gained from the literature, the next phase involves the formulation of a novel assessment method. This newly proposed method distinguishes itself by integrating two essential performance indicators: the lifespan and power output. The incorporation of both parameters ensures a more balanced and realistic evaluation of PV enhancers, addressing the trade-offs between durability and energy efficiency that are often overlooked in conventional methods.
Subsequently, the methodology includes a sensitivity analysis to investigate the influence of key operational and environmental parameters on the outcomes of the proposed evaluation method. This analytical step is crucial for understanding how variations in these parameters may affect the reliability and generalizability of the results, thereby providing deeper insights into the robustness of the approach.
The final stage of the methodology involves the application and validation of the proposed assessment framework across a diverse set of PV enhancer technologies. This testing phase serves to evaluate the method’s practical applicability and consistency under different scenarios, confirming its effectiveness as a tool for comparative analysis.
The flowchart in Figure 2 not only summarizes these sequential research activities but also highlights the logical progression from theoretical groundwork to empirical validation, reinforcing the systematic nature of this study’s methodological design.

2.1. The New PV Enhancer Lifespan and Power Effectiveness Factor, F L S P E

The effectiveness factor for PV enhancer lifespan and power, F L S P E , is determined by the ratio of two key components. The first component is the product of the enhancer’s lifespan and the net power gain achieved by integrating the enhancer with the PV module. The second component consists of the product of the PV module’s lifespan and the power output from the PV without an enhancer. This combined ratio is then divided by the product of the PV’s lifespan and its maximum power under standard test conditions (STCs). The equation is expressed as follows:
F L S P E = P V C L S × P P V C + P V L S × P P V ( P V L S × P P V , m a x   ) ,
Here, P V C L S and P V L S denote the lifespan of the enhancer and the PV module, respectively. The net power gain resulting from the integration of the enhancer with the PV system is represented by P P V C , which can be expressed as follows:
P P V C = P P V C , t o t a l P P V ,
P P V C , t o t a l represents the total output power of a PV system, including the additional power contributed by the enhancer. Meanwhile, P P V and P P V , m a x correspond to the power generated by a PV module without an enhancer and the maximum power under standard test conditions (STCs), respectively. If the enhancer’s lifespan ( P V C L S ) exceeds that of the PV module ( P V L S ), its value should be adjusted to match the PV module’s lifespan ( P V C L S = P V L S ) when applying Equation (2).
The adjustments to the lifespan of the PV cooler were made to reflect realistic operational constraints, rather than arbitrary assumptions. Specifically, the adjustment is based on the principle that the effective contribution of a PV cooler cannot exceed the functional lifespan of the PV module it is enhancing. For example, if a cooler is claimed to have a 30-year lifespan, but it is paired with a PV module rated for 25 years, only 25 years of its contribution are considered in the analysis. This adjustment ensures consistency in evaluating the integrated system’s performance over a shared operational timeline.
When the lifespan of the PV enhancer matches that of the PV module ( P V C L S = P V L S ), Equation (3) simplifies to the following:
F L S P E = P P V C + P P V P P V , m a x .
It can be noticed that Equation (4) depends on P P V C , P P V , and P P V , m a x .
The value of the F L S P E can be presented in terms of percentage as the following:
F L S P E % = P V C L S × P P V C + P V L S × P P V P V L S × P P V , m a x × 100 .
The value of the F L S P E lies in its ability to bridge the gap between theoretical potential and practical reality. By incorporating the power and lifespan as core variables, this metric acknowledges that the value of a PV enhancer cannot be determined solely by its initial impact but by how long that impact lasts and how it integrates with the existing PV module’s lifecycle. In doing so, it rewards enhancers that not only improve performance but do so sustainably.
One of the most profound reflections this metric enables is a paradigm shift from power-centered design to power-yield-over-time-centered evaluation. It encourages manufacturers and researchers to look beyond the “efficiency peak” and focus on energy longevity and system resilience. In contexts like Building-Integrated Photovoltaics (BIPVs), desert-based solar farms, or off-grid installations—where module replacement or enhancer failure can be costly—this metric offers a more realistic and investment-informed lens.
Furthermore, the F L S P E introduces a new avenue for standardizing comparisons across very different types of enhancers. It can be used to fairly evaluate a simple passive fin against an advanced nanofluid system, by balancing their relative lifespans and power impacts. This democratizes innovation, allowing low-cost, durable solutions to compete with more sophisticated but short-lived technologies.
From a policy and industry perspective, the metric could also serve as a benchmarking tool for funding decisions, subsidies, or lifecycle analyses, especially in sustainability-driven contexts.
In summary, the F L S P E is more than a performance ratio; it is a conceptual framework that embeds time, sustainability, and realism into PV enhancer evaluation. It promotes a more holistic understanding of value—one that aligns with long-term energy goals, resource efficiency, and the real-world demands of solar energy deployment.
The authors emphasize that the F L S P E focuses on the combined impact of lifespan and power contribution and does not account for other critical factors such as system cost, ease of maintenance, or integration complexity.

2.2. Significance of the Value of the F L S P E

Based on Equation (2) or Equation (3), F L S P E values can be classified as the following:
  • If F L S P E = 1 or F L S P E = 100 % in terms of percentage, the PV enhancer has reached its optimal (maximum) performance in improving the PV system.
  • If F L S P E = P P V P P V , m a x , the PV enhancer has reached its lowest effectiveness in improving the PV system.
  • The lifespan and power factor of the PV enhancers should fall in the range of between P P V P P V , m a x and 1. In equation form,
P P V P P V , m a x F L S P E 1 .
When applying the PV cooler lifespan effectiveness factor, several conditions must be satisfied to ensure consistent and meaningful comparisons. First, the performance evaluation should be conducted under the same operating conditions, which include the irradiance, ambient temperature, air velocity, and inclination angle. These conditions provide a uniform baseline for assessing PV module behavior and enable accurate comparisons across different studies. Second, the same PV module type must be used for both the baseline system (without a cooler) and the enhanced system (with a cooler) to eliminate variations arising from differing PV characteristics. Third, the physical area of the PV coolers must be kept consistent, as discrepancies in surface area may independently affect heat dissipation and electrical output, thereby compromising the reliability of the method. A key limitation of this approach lies in its sensitivity to regional environmental conditions. Since the lifespan of PV cooling materials is influenced by factors such as temperature extremes, humidity, and UV exposure, the calculated effectiveness factor may vary significantly from one geographical region to another. Consequently, while the method provides a valuable framework for comparative analysis, its outputs must be interpreted with caution when applied across diverse climatic zones.

3. Results and Discussion

This section demonstrates the real-world applicability of the proposed method, providing evidence to support its validity. Additionally, an in-depth theoretical analysis is conducted to examine the influence of key parameters on the F L S P E , including P V C L S , P V L S ,   P P V , and P P V , m a x . The findings indicate a proportional relationship between the lifespan of both the PV module ( P P V ) and its enhancer ( P V C L S ), as well as the net power gain from the enhancer, the output power of a PV without an enhancer, and the F L S P E . Conversely, an inverse relationship is observed between the maximum power under standard test conditions ( P P V , m a x ) and the lifespan of the PV ( P V L S ) and the F L S P E .

3.1. The Use of the F L S E and F L S P E in a Real-World Scenario

Table 3 illustrates the F L S E and F L S P E analysis for the examined PV with and without a reflector. The entries in Table 3 like the P V C L S , P V L S , P P V C , P P V , and P P V , m a x are taken from Ref. [33]. It is given that the P P V , m a x is 525 W. The lifespans of the PV ( P V L S ) and reflector ( P V C L S ) are 25 and 10 years, respectively. The P P V (PV without a reflector) and P P V C (the net enhanced power from the reflector) are 110.80 and 16.16 W, respectively. Using Equations (1) and (3), the F L S E and F L S P E values are determined to be 0.40 and 0.22, respectively. It is found that the existing method ( F L S E ) cannot evaluate the performance of PV enhancers when the PV output power is considered in the analysis. On the other hand, the new method ( F L S P E ) can be applied when the PV output power is considered and is applicable in a real case. This could be evidence to support the applicability of the proposed method, which may have the potential to be utilized by PV enhancer researchers, designers, and/or manufacturers.
Further experimental analysis for the F L S P E was performed, as shown in Table 4. The entries in Table 4 were taken from Ref. [34]. The single and double PV reflectors were compared using the F L S P E . In Ref. [34], the power for a PV without an enhancer is 0.374 W. The net enhanced power values for a PV with a single and double reflector are 0.205 W and 0.218 W, respectively. The maximum PV power under STCs is 1.25 W. Using Equation (3), the F L S P E values are determined to be 0.36 and 0.37 for a PV with a single and double reflector, respectively. It is found that the F L S P E value for a PV with a double reflector is higher than that for the one with a single reflector. Hence, the PV with a double reflector performs better as compared to the PV with a single reflector. From the results of the present study, it was found the F L S P E is applicable to different PV enhancers.

3.2. Further Analysis on the F L S P E

3.2.1. The Effect of the F L S P E on Different PV Enhancers

To illustrate the analysis of the F L S P E , Table 5 was compiled using the example provided in the Introduction Section. The assumed lifespans for PV coolers Type A, Type B, and Type C are 7, 15, and 23 years, respectively. These coolers enhance the PV system by generating additional power of 12 W, 5.60 W, and 4 W for Type A, Type B, and Type C, respectively. Given that the PV module without a cooler has an output power of 100 W and a lifespan of 15 years, applying Equation (2) or (3) yields F L S P E values of 0.88 for both Type A and Type B. Since Type C has a lifespan exceeding that of the PV module, its lifespan is adjusted to 15 years to align with the PV system, resulting in an F L S P E value of 0.87. The highest F L S P E value of 0.88 is observed for Type A and Type B, indicating superior performance compared to Type C in terms of the lifespan and power. Under the existing evaluation method, Type B and Type C appeared more favorable than Type A when power was excluded. This confirms that the F L S P E effectively differentiates PV enhancer performance when power is incorporated into the assessment.

3.2.2. The Effect of Changing the Lifespan of the PV Enhancer on the F L S P E

Consider a scenario where the lifespan of the PV coolers from Table 5 is reduced. The updated lifespans for Type A, Type B, and Type C are now 5, 6, and 15 years, respectively, while all other parameters remain unchanged, as shown in Table 6. These adjustments noticeably impact the F L S P E values, which are recalculated as 0.87 for Type A, 0.85 for Type B, and 0.87 for Type C. A proportional relationship is observed between the PV cooler’s lifespan and the F L S P E ; as the cooler’s lifespan decreases, its F L S P E value also declines. Among the three types, the highest F L S P E values (0.87) are achieved by Type A and Type C, indicating optimal performance. This analysis confirms that the lifespan of the PV cooler is a crucial factor influencing the F L S P E value and, consequently, the overall effectiveness of the enhancement system.

3.2.3. The Effect of Changing the Lifespan of the PV on the F L S P E

Suppose the lifespan of the PV module in Table 5 is increased from 15 to 25 years, while all other parameters remain unchanged, as shown in Table 7. Under these conditions, the recalculated F L S P E values for PV coolers Type A, Type B, and Type C are 0.861, 0.861, and 0.864, respectively. Among the three, Type C demonstrates the highest effectiveness in terms of both the lifespan and power, making it the most favorable option in this scenario.
If the PV’s lifespan from Table 7 is reduced from 25 to 5 years, while keeping all other parameters unchanged (Table 8), the lifespans of Type A, Type B, and Type C must be adjusted to match the PV’s lifespan, as required by the applicability conditions of the F L S P E . Under these revised conditions, the recalculated F L S P E values are 0.93 for Type A, 0.88 for Type B, and 0.87 for Type C. Comparing these values with Table 7, it is evident that Type A achieves the highest performance, as its F L S P E value surpasses those of Type B and Type C.
An inverse proportional relationship is observed between the PV’s lifespan and the F L S P E ; as the PV’s lifespan increases, the F L S P E value decreases and vice versa. Additionally, the PV’s lifespan also impacts the performance of the PV cooler. If the cooler’s lifespan exceeds that of the PV module, it must be adjusted accordingly when applying the F L S P E . This analysis highlights that the PV’s lifespan is a crucial parameter, directly influencing the F L S P E value and, consequently, the overall evaluation of PV enhancement systems.

3.2.4. The Effect of Changing the PV Enhancer Net Produced Power on the F L S P E

If the net power output of the PV coolers in Table 9 is increased to 10 W, 15 W, and 20 W for Type A, Type B, and Type C, respectively, while keeping all other parameters unchanged, the recalculated F L S P E values, based on Equation (3), are 0.87 for Type A, 0.96 for Type B, and 1 for Type C. Among these, Type C demonstrates the highest performance in terms of both the lifespan and power, making it the most effective option in this scenario.
If the net power output of the PV coolers from Table 9 is reduced to 3 W for Type A, 6 W for Type B, and 10 W for Type C, while keeping all other parameters unchanged (as shown in Table 10), the recalculated F L S P E values are 0.85 for Type A and 0.88 for Type B. Since the lifespan of Type C exceeds that of the PV module, it is adjusted to match the PV’s lifespan of 15 years, resulting in an F L S P E value of 0.92. Comparing these values with Table 9, it is evident that Type C achieves the highest performance. This analysis confirms a proportional relationship between the PV cooler’s net power output and the F L S P E , indicating that as the net produced power increases, the F L S P E value also rises. Therefore, the net power produced by the PV cooler is a crucial parameter that directly impacts the effectiveness of PV enhancement systems.

3.2.5. The Effect of Changing the Produced Power from a PV Without an Enhancer on the F L S P E

If the power output from a PV module without a cooler is reduced from 100 W to 70 W, while keeping all other parameters unchanged (as shown in Table 11), the recalculated F L S P E values are 0.63 for both Type A and Type B. Since the lifespan of Type C exceeds that of the PV module, it is adjusted to match the PV’s lifespan of 15 years, resulting in an F L S P E value of 0.62. In this scenario, Type A and Type B demonstrate the highest performance in terms of lifespan and power effectiveness compared to Type C.
If the power output from a PV module without a cooler is increased from 70 W to 80 W, while keeping all other parameters unchanged (as shown in Table 12), the recalculated F L S P E values are 0.71 for both Type A and Type B and 0.70 for Type C. Comparing these results with Table 11, it is evident that Type A and Type B achieve the highest performance in terms of lifespan and power effectiveness.
A proportional relationship is observed between the power output from a PV module without a cooler and the F L S P E ; as the produced power increases, the F L S P E value also rises. This indicates that the power output from a PV without a cooler is a crucial factor, directly impacting the F L S P E and, consequently, the overall evaluation of PV cooler performance.

3.2.6. The Effect of Changing the Maximum Power Under PV Standard Test Conditions on the F L S P E

If the maximum power under PV standard test conditions is increased from 120 W to 150 W, while keeping all other parameters unchanged (as shown in Table 13), the recalculated F L S P E values are 0.70 for both Type A and Type B. Since the lifespan of Type C exceeds that of the PV module, it is adjusted to match the PV’s lifespan of 15 years, resulting in an F L S P E value of 0.69. In this scenario, Type A and Type B demonstrate the highest performance in terms of lifespan and power effectiveness compared to Type C.
If the maximum power under PV standard test conditions is reduced from 150 W to 130 W, while keeping all other parameters unchanged (as shown in Table 14), the recalculated F L S P E values are 0.81 for both Type A and Type B and 0.80 for Type C. Comparing these results with Table 13, it is evident that Type A and Type B achieve the highest performance in terms of lifespan and power effectiveness.
An inverse proportional relationship is observed between the maximum power under PV standard test conditions and the F L S P E ; as the maximum power increases, the F L S P E value decreases. This indicates that the maximum power under standard test conditions is a critical parameter, directly affecting the F L S P E and, consequently, the evaluation of PV cooler performance.

3.3. Summary of the Existing and New Assessment Methods for PV Enhancers

Table 15 presents a comparison between the existing and the newly proposed assessment methods for PV enhancers. The existing method relies on P V C L S and P V L S , representing the lifespans of the enhancer and PV module, respectively. In contrast, the new method ( F L S P E ) incorporates additional key parameters, including the net power gain from the enhancer ( P P V C ), the output power of a PV module without an enhancer ( P P V ), and the maximum power under standard test conditions ( P P V , m a x ). The analysis highlights that the existing method overlooks the impact of power from PV modules with enhancers, making it challenging to accurately assess the performance of different PV enhancement techniques. Therefore, the new method is introduced to address this limitation, as discussed in the earlier sections.
Furthermore, traditional evaluation methods for photovoltaic enhancers have primarily focused on instantaneous electrical efficiency and thermal output, often measured under standard test conditions (STCs). For example, researchers have commonly relied on metrics such as thermal efficiency, electrical efficiency, and combined PVT efficiency to quantify performance improvements introduced by cooling techniques, reflectors, nanofluids, or hybrid configurations [6,10]. These metrics are typically computed at a specific moment or over a short operational period, thereby offering limited insight into the long-term sustainability of the enhancer’s contribution. Some extended approaches have introduced the energy yield per day, performance ratio (PR), or exergy efficiency to better reflect real-world dynamics. While these are improvements over basic efficiency metrics, they still often fail to incorporate the lifespan of the enhancer or its durability under prolonged exposure to environmental stressors. Furthermore, very few of these existing models directly integrate the relationship between the lifespan of the PV module and that of the enhancer, which is a critical factor in lifecycle and economic assessments. In contrast, the newly proposed metric ( F L S P E ) represents a significant advancement in performance evaluation methodology. It introduces lifespan-weighted energy performance as a core criterion, moving beyond static output measurements. Specifically, it accounts for the net power gain provided by the enhancer over its operational life while also comparing it against the total expected power output of the PV module under ideal conditions. This holistic perspective allows for direct comparability between enhancers of different types and operational durations.

4. Conclusions

This study introduces a novel method for evaluating the combined lifespan and power effectiveness of PV enhancers using five critical parameters. The proposed effectiveness factor ( F L S P E ) facilitates a comprehensive comparison of enhancer technologies by integrating both durability and performance contributions. The results indicate that enhancers with longer lifespans and greater net power gains yield higher F L S P E values. The analysis of real-world data confirms that the method can successfully classify enhancer performance, with F L S P E values ranging from 0.22 to 0.37. These findings demonstrate the method’s potential as a valuable tool for researchers and industry stakeholders to identify optimal solutions that balance efficiency and longevity. Importantly, this work underscores the need for integrated evaluation frameworks in the renewable energy sector, where maximizing the return on investment and sustaining long-term performance are essential. By enabling the more informed design and selection of PV enhancement systems, the method supports broader goals in energy efficiency, sustainability, and innovation. Nonetheless, this study makes several simplifying assumptions. The model relies on idealized maximum power conditions, excludes degradation effects over time, and uses estimated lifespan values drawn from the literature rather than empirical field data. These limitations may affect the precision of the results but provide a strong foundation for future refinement. Subsequent research should aim to incorporate degradation modeling, real-world lifespan variability, and additional system-level metrics to further strengthen this evaluation approach.

Author Contributions

Conceptualization, S.M.S.; methodology, S.M.S.; software, S.M.S.; validation, S.M.S.; formal analysis, S.M.S.; investigation, S.M.S.; resources, S.M.S., C.P.T., M.Z.A. and K.S.; data curation, S.M.S.; writing—original draft, S.M.S. and C.P.T.; writing—review and editing, S.M.S., M.Z.A. and K.S.; visualization, S.M.S.; supervision, S.M.S.; project administration, S.M.S.; funding acquisition, S.M.S. All authors have read and agreed to the published version of the manuscript.

Funding

The APC was funded by the Multimedia University, Malaysia.

Data Availability Statement

The original contributions presented in this study are included in the article. Further inquiries can be directed to the corresponding authors.

Conflicts of Interest

The authors declare no conflicts of interest.

Nomenclature

βFractional decrease in photovoltaic efficiency per
unit temperature increase (K−1)
FFactor, dimensionless
PPower (W)
PVPhotovoltaic module
PVCPhotovoltaic module with an enhancer
PVTPhotovoltaic thermal collector
TTemperature, °C
Subscript
LSELifespan effectiveness factor
LSLifespan (years)
LSPELifespan and power effectiveness
maxMaximum output power
MPPMaximum power point
ocOpen circuit
refReference
scShort circuit
STCsStandard test conditions

References

  1. Sultan, S.M.; Abdullah, M.Z. A new method for assessing photovoltaic module cooler based on lifespan effectiveness factor. Case Stud. Therm. Eng. 2022, 35, 102126. [Google Scholar] [CrossRef]
  2. Sultan, S.M.; Tso, C.P.; Ervina, E.M.N. A new production cost effectiveness factor for assessing photovoltaic module cooling techniques. Int. J. Energy Res. 2019, 44, 574–583. [Google Scholar] [CrossRef]
  3. Available online: https://www.iea.org/reports/solar-pv (accessed on 11 April 2025).
  4. Sultan, S.M.; Tso, C.P.; Ervina, E.M.N. Comments on “Performance evaluation of photovoltaic thermal solar air collector for composite climate of India”. Sol. Energy Mater. Sol. Cells 2019, 198, 63–64. [Google Scholar] [CrossRef]
  5. Sultan, S.M.; Ervina, E.M.N. Review on recent Photovoltaic/Thermal (PV/T) technology advances and applications. Sol. Energy 2018, 173, 939–954. [Google Scholar] [CrossRef]
  6. Fuentesa, M.; Vivar, M.; Casa, J.; Aguilera, J. An experimental comparison between commercial hybrid PV-T and simple PV systems intended for BIPV. Renew. Sustain. Energy Rev. 2018, 93, 110–120. [Google Scholar] [CrossRef]
  7. Ruobing, L.; Qiangguang, P.; Peng, W.; Jili, Z. Experiment research of solar PV/T cogeneration system on the building façade driven by a refrigerant pump. Energy 2018, 161, 744–752. [Google Scholar]
  8. Tiwari, G.N.; Fischer, O.; Mishra, R.K.; Al-Helal, I.M. Performance evaluation of N-photovoltaic thermal (PVT) water collectors partially covered by photovoltaic module connected in series: An experimental study. Sol. Energy 2016, 134, 302–313. [Google Scholar]
  9. Hossein, A.; Roghayeh, G.; Mohammad, B.S.; Mohammad, H.A.; Wei-Mon, Y.; Mohammad, A.N. Numerical simulation of PV cooling by using single turn pulsating heat pipe. Int. J. Heat Mass Transf. 2018, 127, 203–208. [Google Scholar]
  10. Nahar, A.; Hasanuzzaman, M.; Rahim, N.A. Numerical and experimental investigation on the performance of a photovoltaic thermal collector with parallel plate flow channel under different operating conditions in Malaysia. Sol. Energy 2017, 144, 517–528. [Google Scholar] [CrossRef]
  11. Rahman, M.M.; Hasanuzzaman, M.; Rahim, N.A. Effects of operational conditions on the energy efficiency of photovoltaic modules operating in Malaysia. J. Clean. Prod. 2017, 143, 912–924. [Google Scholar] [CrossRef]
  12. Fayaz, H.; Nasrin, R.; Rahim, N.A.; Hasanuzzaman, M. Energy and exergy analysis of the PVT system: Effect of nanofluid flow rate. Sol. Energy 2018, 169, 217–230. [Google Scholar] [CrossRef]
  13. Fadhel, M.I.; Sultan, S.M.; Alkaff, S.A. Theoretical study of new configuration of PVT system design. J. Adv. Mater. Res. 2013, 772, 681–687. [Google Scholar] [CrossRef]
  14. Sultan, S.M.; Fadhel, M.I.; Alkaff, S.A. Performance analysis of the photovoltaic/thermal solar collector for different Malaysian climatic condition. J. Appl. Mech. Mater. 2014, 467, 522–527. [Google Scholar] [CrossRef]
  15. Nahar, A.; Hasanuzzaman, M.; Rahim, N.A.; Parvin, S. Numerical investigation on the effect of different parameters in enhancing heat transfer performance of photovoltaic thermal systems. Renew. Energy 2019, 132, 284–295. [Google Scholar] [CrossRef]
  16. Sakellariou, E.; Axaopoulos, P. Simulation and experimental performance analysis of a modified PV panel to a PVT collector. Sol. Energy 2017, 155, 715–726. [Google Scholar] [CrossRef]
  17. Bilbao, J.I.; Sproul, A.B. Detailed PVT-water model for transient analysis using RC networks. Sol. Energy 2015, 115, 680–693. [Google Scholar] [CrossRef]
  18. Grubišić-Čabo, F.; Nižetić, S.; Duje, C.; Ivo, M.K.; Agis, P. Experimental investigation of the passive cooled free-standing photovoltaic panel with fixed aluminum fins on the backside surface. J. Clean. Prod. 2018, 176, 119–129. [Google Scholar] [CrossRef]
  19. Grubišić-Čabo, F.; Nižetić, S.; Marinić, K.I.; Čoko, D. Further progress in the research of fin-based passive cooling technique for the free-standing silicon photovoltaic panels. Int. J. Energy Res. 2019, 43, 3475–3495. [Google Scholar] [CrossRef]
  20. Anand, V.P.; Khan, A.E.; Amuthan, V.; Pesala, B. Performance improvement of solar module system using flat plate reflectors. In Proceedings of the International Conference on Advanced Electrical Engineering (ICAEE), Vellore, India, 9–11 January 2014; pp. 1–4. [Google Scholar]
  21. Palaskar, V.N.; Deshmukh, S.P. Design and performance analysis of reflectors attached to commercial PV module. Int. J. Renew. Energy Res. 2014, 4, 240–245. [Google Scholar]
  22. Bahaidarah, H.M.; Tanweer; Gandhidasan, B.; Rehman, S. A combined optical, thermal and electrical performance study of a V-trough PV system experimental and analytical investigations. Energies 2015, 8, 2803–2827. [Google Scholar] [CrossRef]
  23. Naseer, K.K.; Ahmed, F.A.; Fadhil, M.E. Improve the performance of solar modules by reflectors. Sixth Sci. Conf. Renew. Energy Its Appl. 2018, 1032, 012031. [Google Scholar]
  24. Moon, K.K.; Khalid, O.A.; Liu, J.; Joon-Ho, C.; Wen, H. Optimal design strategy of a solar reflector combining photovoltaic panels to improve electricity output: A case study in Calgary, Canada. Sustainability 2021, 13, 6115. [Google Scholar] [CrossRef]
  25. Jin, S.; Choi, B.G.; Choi, J.H.; Kim, S.R.; Chun, R.T.; Yun-Su, K. New curved reflectors for significantly enhanced solar power generation in four seasons. Energies 2019, 12, 4602. [Google Scholar] [CrossRef]
  26. Amanlou, Y.; Hashjin, T.T.; Ghobadian, B.; Najafi, G. Air cooling low concentrated photovoltaic/thermal (LCPV/T) solar collector to approach uniform temperature distribution on the PV plate. Appl. Therm. Eng. 2018, 141, 413–421. [Google Scholar] [CrossRef]
  27. Monika, A.; Priyank, C.; Amartya, C. Performance analysis of photovoltaic module with reflector: Optimizing orientation with different tilt scenarios. Renew. Energy 2022, 186, 10–25. [Google Scholar]
  28. Wang, G.; Ge, Z.; Lin, J. Design and performance analysis of a novel solar photovoltaic/thermal system using compact linear Fresnel reflector and nanofluids beam splitting device. Case Stud. Therm. Eng. 2022, 35, 102167. [Google Scholar] [CrossRef]
  29. Baccoli, R.; Kumar, A.; Frattolillo, A.; Mastino, C.; Ghiani, E.; Gatto, G. Enhancing energy production in a PV collector—Reflector system supervised by an optimization model: Experimental analysis and validation. Energy Convers. Manag. 2021, 229, 113774. [Google Scholar] [CrossRef]
  30. Kumar, S.; Agyekum, E.B.; Kumar, A.; Velkin, V.I. Performance evaluation with low-cost aluminum reflectors and phase change material integrated to solar PV modules using natural air convection: An experimental investigation. Energy 2023, 266, 126415. [Google Scholar]
  31. Almadhhachi, M.; Seres, I.; Farkas, I. Electrical power harvesting enhancement of PV module by a novel hemispherical configuration. Int. J. Thermofluids 2023, 20, 100460. [Google Scholar] [CrossRef]
  32. Michael, L. Durability and climate change: Changing climatic loads as may affect the durability of building materials, components and assemblies. In Proceedings of the CIB/NRC Symposium, Ottawa, ON, Canada, 21 September 2018. [Google Scholar]
  33. Sultan, S.; Abdullah, Z.; Tso, C.; Abllah, N.; Zakaria, N.; Raheem, K.; Sobayel, K. An economic feasibility assessment of implementing photovoltaic module reflectors under Malaysian meteorological conditions. Sci. Rep. 2024, 14, 3349. [Google Scholar] [CrossRef]
  34. Sakhr, M.; Tso, C.; Ervina, E.; Abdullah, M. A cost effective and economic method for assessing the performance of photovoltaic module enhancing techniques: Analytical and experimental study. Sol. Energy 2023, 254, 27–41. [Google Scholar]
Figure 1. The share of renewable electricity generation by technology, 2000–2030 [3].
Processes 13 01311 g001
Figure 2. A structured flowchart outlining the research process in this work.
Processes 13 01311 g002
Table 1. Earlier studies on a PV with an enhancer.
ReferencePV Enhancer Description Study MethodAbsolute PV Efficiency with Enhancer (%)Additional Insights
[6]The operational performance of a commercial PVT system was assessed over a full day.Experimental18.20% *Active cooling integration.
[7]A refrigerant pump was utilized for forced circulation cooling of the PVT system.Experimental16.00% *Feasibility demonstrated; COP ~3.1.
[8]The electrical efficiency of a series-connected PVT water collector was analyzed.Numerical analysis and experiment13.50%*Validated theoretical model.
[9]A copper fin integrated with a pulsating heat pipe (PHP) was simulated to compare PHP efficiency against a solid copper structure.Numerical12.80% *Enhanced heat dissipation.
[10,11]A novel PVT system design was proposed.Numerical analysis and experiment12.69% *Tested under Malaysian climate.
[12]An aluminum-based collector was introduced to improve heat transfer efficiency.Numerical analysis and experiment12.25% *Rectangular tube absorber design.
[13,14]A new PVT system design was developed and assessed theoretically.Numerical12.13% *Used aluminum for better conduction.
[15]A thermal collector was designed and evaluated using a mathematical model.Numerical11.90% *Used for dynamic condition simulations.
[16]A modified PVT collector was constructed and installed alongside a PV module.Numerical analysis and experiment10.72% *Better airflow and temperature reduction.
[17]A detailed transient model for PVT–water collectors was introduced.Numerical analysis and experiment9.80% *Increased incident irradiance.
[18]Experimental studies were carried out to analyze the efficiency of PVT-PCM.Experiment8.16% *Boosted power output.
[18]Experiments were performed to assess PVT system efficiency.Experimental6.98% *Enhanced optical and thermal performance.
[19]Aluminum fins were affixed to the PV module’s backside using thermally conductive epoxy glue.Experimental2% ** increaseSimple reflectors improved efficiency.
[20]The effect of reflector parameters on PV efficiency was analyzed through experimental testing.Experimental60% ** incrementCombined cooling and reflection.
[21]A PV system with an aluminum sheet reflector was examined using both numerical and experimental approaches.Numerical analysis and experiment15% ** incrementImproved annual energy yield.
[22]A predictive model was developed to estimate the output power of a V-trough concentrator.Numerical analysis31.20% ** incrementGood performance in all seasons.
[23]Outdoor experimental evaluation was conducted on a PV system integrated with a V-trough concentrator.Experimental48% ** incrementUniform PV temperature.
[24]An analytical study assessed the performance of a PV system using an aluminum sheet as a reflector.Numerical analysis 19% ** incrementHigher thermal/electrical output.
[25]A newly designed curved reflector for PV applications was proposed and examined.Numerical analysis and experiment61% ** incrementSystematic energy enhancement.
[26]A PV system with a flat reflector and cooling system was analyzed through theoretical and experimental studies.Numerical analysis and experiment36% ** incrementStable module temperature.
[27]A method for enhancing PV efficiency using a commercial flat stainless-steel reflector was identified.Experimental34.16% ** incrementImproved solar capture.
[28]Performance evaluation of an innovative PVT system utilizing a compact linear Fresnel reflector and nanofluid-based beam splitting device was conducted.Numerical analysis34.16% ** incrementCost-effective evaluation framework.
[29]A flat booster bottom reflector integrated with a collector was introduced and assessed.Numerical analysis and experimentUp to 17.8% ** incrementIntegrated design enhanced PV-T performance.
[30]A cost-effective aluminum reflector combined with phase change material and natural air convection was studied for PV performance enhancement.Numerical analysis and experiment18.16% ** incrementImproved lower-side irradiance.
[31]A novel hemispherical curved PV design was developed and tested.Experimental19% *Passive thermal regulation.
[32]The impact of a double mirror reflector on PV efficiency was studied.Experimental58.3% ** incrementSubstantial gain in output with mirrors.
* Absolute efficiency; ** relative efficiency improvements over a baseline efficiency.
Table 2. Examples of PV cooler types with different lifespan periods and power. Modified from Ref. [1].
PV Cooler TypeLifespan of the PV, YearLifespan of the PV Cooler, Year Output Power, W F L S E
Type A157120.466
Type B15155.601
Type C1523 *41
* The lifespan of the PV cooler will be adjusted to have the same value as the PV’s lifespan.
Table 3. The F L S E and F L S P E analysis for the examined PV with a reflector.
Method. P V C L S ,
Year
P V L S ,
Year
P P V C ,
W
P P V ,
W
P P V , m a x ,
W
ValueValue in %
F L S E (existing
study from
Ref. [1])
1025* N/AN/AN/A0.4040
F L S P E
(current study)
102516.16110.865250.2222
* N/A (Not Applicable) indicates that the net output power from the PV with the enhancer, the output power from the PV without the enhancer, and the STC power of the PV are not required to calculate the F L S E .
Table 4. The F L S P E analysis for a PV with a single and double reflecting mirror.
Reflector Type P V C L S ,
Year
P V L S ,
Year
P P V C ,
W
P P V ,
W
P P V , m a x ,
W
F L S P E F L S P E in %
A single
reflector
10250.2050.3741.250.3636
A double
reflector
10250.2180.3741.250.3737
Table 5. Comparison between different types of PV coolers using F L S P E .
PV Cooler Type P V C L S , Year P V L S , Year P P V C , W P P V , W P P V , m a x , W F L S P E F L S P E in %
Type A715121001200.8888
Type B15155.601001200.8888
Type C23 *1541001200.8787
* The lifespan of the PV cooler will be adjusted to have the same value as the PV’s lifespan.
Table 6. The effect of changing the PV cooler lifespan on the F L S P E .
PV Cooler Type P V C L S , Year P V L S , Year P P V C , W P P V , W P P V , m a x , W F L S P E F L S P E in %
Type A515121001200.8787
Type B6155.601001200.8585
Type C151541001200.8787
Table 7. Comparison of PV coolers using the F L S P E when the PV’s lifespan is increased from 15 to 25 years.
PV Cooler Type P V C L S , Year P V L S , Year P P V C , W P P V , W P P V , m a x , W F L S P E F L S P E in %
Type A725121001200.86186.1
Type B15255.601001200.86186.1
Type C232541001200.86486.4
Table 8. Comparison of PV coolers using the F L S P E when the PV’s lifespan is decreased from 25 to 5 years.
PV Cooler Type P V C L S , Year P V L S , Year P P V C , W P P V , W P P V , m a x , W F L S P E F L S P E in %
Type A7 *5121001200.9393
Type B15 *55.601001200.8888
Type C23 *541001200.8787
* The lifespan of the PV cooler will be adjusted to have the same value as the PV’s lifespan.
Table 9. Comparison of PV coolers using the F L S P E when the net produced power of the PV cooler is increased.
PV Cooler Type P V C L S , Year P V L S , Year P P V C , W P P V , W P P V , m a x , W F L S P E F L S P E in %
Type A715101001200.8787
Type B1515151001200.9696
Type C23 *15201001201.00100
* The lifespan of the PV cooler will be adjusted to have the same value as the PV’s lifespan.
Table 10. Comparison of PV coolers using the F L S P E when the net produced power of the PV cooler is decreased.
PV Cooler Type P V C L S , Year P V L S , Year P P V C , W P P V , W P P V , m a x , W F L S P E F L S P E in %
Type A71531001200.8585
Type B151561001200.8888
Type C23 *15101001200.9292
* The lifespan of the PV cooler will be adjusted to have the same value as the PV’s lifespan.
Table 11. Comparison of PV coolers using the F L S P E when the produced power from a PV without a cooler is reduced.
PV Cooler Type P V C L S , Year P V L S , Year P P V C , W P P V , W P P V , m a x , W F L S P E F L S P E in %
Type 71512701200.6363
Type B 15155.60701200.6363
Type C 23 *154701200.6262
* The lifespan of the PV cooler will be adjusted to have the same value as the PV’s lifespan.
Table 12. Comparison of PV coolers using the F L S P E when the produced power from a PV without a cooler is increased.
PV Cooler Type P V C L S , Year P V L S , Year P P V C , W P P V , W P P V , m a x , W F L S P E F L S P E in %
Type A 71512801200.7171
Type B 15155.60801200.7171
Type C 23 *154801200.7070
* The lifespan of the PV cooler will be adjusted to have the same value as the PV’s lifespan.
Table 13. Comparison of PV coolers using the F L S P E when the maximum power under PV standard test conditions is increased.
PV Cooler Type P V C L S , Year P V L S , Year P P V C , W P P V , W P P V , m a x , W F L S P E F L S P E in %
Type A 715121001500.7070
Type B 15155.601001500.7070
Type C 23 *1541001500.6969
* The lifespan of the PV cooler will be adjusted to have the same value as the PV’s lifespan.
Table 14. Comparison of PV coolers using the F L S P E when the maximum power under PV standard test conditions is decreased.
PV Cooler Type P V C L S , year P V L S , year P P V C , W P P V , W P P V , m a x , W F L S P E F L S P E in %
Type A 715121001300.8181
Type B 15155.601001300.8181
Type C 23 *1541001300.8080
* The lifespan of the PV cooler will be adjusted to have the same value as the PV’s lifespan.
Table 15. Summary of the existing and new assessment methods.
MethodEquationParameters Is the Power Included in the Analysis?
Existing method [1] F L S E = P V C L S P V L S P V C L S and P V L S No
New method F L S P E = P V C L S × P P V C + P V L S × P P V ( P V L S × P P V , m a x ) P V C L S , P V L S , P P V C , P P V and P P V , m a x Yes
Disclaimer/Publisher’s Note: The statements, opinions and data contained in all publications are solely those of the individual author(s) and contributor(s) and not of MDPI and/or the editor(s). MDPI and/or the editor(s) disclaim responsibility for any injury to people or property resulting from any ideas, methods, instructions or products referred to in the content.

