1. Introduction
Coffee is one of the major cash crops of the world, grown in over 50 countries.
Coffea arabica and
canephora have been increasingly grown to meet the demand of the world population as they are a major raw material in the production of beverages. Also, coffee is ranked the third-largest traded agricultural commodity globally [
1]. Coffee production and processing generates coffee pulp, a waste that makes up to approximately 40 percent of the dry weight of the entire coffee berry; in other words, it is the primary by-product of the coffee industry [
2]. Every unit of coffee beans produces a huge amount of pulp, which is considered waste, and often causes serious problems for the economy, society, and the environment. Improper disposal affects agricultural output by damaging the quality of the soil and polluting water sources, thus disturbing the livelihood of the locals. In addition, accumulation of coffee pulp attracts pests, creating health hazards and increasing the speed of spreading diseases in neighborhoods. Coffee pulp is rich in bioactive components that can be applied in various sectors; hence, economically, this waste is a lost opportunity for value addition [
3]. In view of this challenge, the development of innovative approaches to managing and reusing coffee pulp is required in ways that are sustainable [
4].
According to recent studies, the bioactive compounds inherent in coffee pulp have been linked to an array of biological activities [
5]. Procyanidin, for example, has been reported as one of the most prevalent compounds in coffee pulp, and has been reported to exhibit biological activities [
6,
7,
8]. This compound has shown anti-inflammatory, antioxidant, anti-atherosclerotic, anti-tumor, antidiabetic, antibacterial, anti-obesity, neuroprotective, and wound healing activities, among others [
9,
10,
11]. Despite the promising activities, effective extraction to obtain a high yield, isolation/purification, and quantification of procyanidins has been the subject of numerous research studies. The complexity of this class of plant metabolites is due to varied molecular weights and varied chemical characteristics.
Considering these precedents, the search for extraction techniques that enable high procyanidin yields is of particular interest. In recent years, the use of non-conventional extraction technologies has gained significant importance due to their fast-processing times, high yields, and lesser risk associated with the use of less-toxic solvents to the environment [
12]. The ultrasound-assisted extraction (UAE) technique is one such techniques. This method has proven successful in releasing compounds from plant matrices by breaking down the cell wall and creating microbubbles under cavitation. When these microbubbles burst in an aqueous media, they produce localized pressure and heat that make it easier to extract target compounds effectively [
13]. Another method is microwave-assisted extraction (MAE), which uses quick heating and pressure to break down the cell wall of the plant matrix. This technique, which promotes effective compound release, is powered by microwave energy transfer by ionic conduction and dipolar rotation. Both techniques enable the extraction of procyanidins useful for the food and pharmaceutical industries in the formulation of antioxidant, anti-inflammatory, and anti-neurodegenerative agents [
14]. It is suggested that the combination of the two methods may enhance mass and energy transfer while producing higher extraction yields, reduce the time taken in processes, and eliminate some process steps. The combination of these two methods seems to enable more sustainable and better application possibilities for a higher procyanidin yields [
15]. This study aims to develop a sustainable and efficient extraction approach for maximizing the recovery of procyanidins from coffee pulp. Specifically, it assessed the extraction efficiency of microwave-assisted extraction (MAE), ultrasound-assisted extraction (UAE), and a hybrid microwave–ultrasound (MAE–UAE) process. Furthermore, this study aims to characterize the procyanidins extracted from coffee pulp and its antioxidant activity, contributing to the optimization of an eco-friendly extraction method for the valorization of coffee pulp.
2. Materials and Methods
2.1. Collection and Processing of Coffee Pulp
Coffee pulp (Coffea arabica) was collected from Chiapas in November 2023. The sample was transported to the Food Science and Technology Department of the Autonomous University of Coahuila, Mexico. The coffee pulp was dried for 96 h in a low-temperature Memmert Universal Oven (Model UNB 400, Büchenbach, BY, Germany) at 40 °C. The dried pulp was ground using a Famsun 9FQ Series Electric Feed Mill (Model 9FQ-40, Yangzhou, JS, China), equipped with a 150 mm grinding chamber, operating at 1800 r/min, 110 V, and 3000 W. The resulting powder was collected, si eved through a mesh number 30 to obtain a 0.6 mm particle size, and stored in an airtight, food-grade, BPA-free, high-density polyethylene container.
Every chemical reagent used was of chromatographic and analytical grade. Acetone, n-hexane and ethanol of HPLC grade were acquired from J.T. Baker (Phillipsburg, PA, USA). The procyanidin C1 was acquired from Sigma-Aldrich (St. Louis, MO, USA).
2.2. Extraction of Procyanidins
For the MAE, UAE, and hybrid (MAE–UAE) extraction methods, a comprehensive block design with a full factorial arrangement of treatments, as shown in
Table 1 below, was used. The experiment involved two independent variables: mass-to-volume ratio and solvent concentration. Each of the nine runs was performed in triplicate using each of aqueous acetone and ethanol.
The CEM (Mars 6) microwave apparatus (CEM Corporation, Matthews, NC, USA) and the Branson 2510 ultrasonic cleaner (Branson Ultrasonics, Danbury, CT, USA) were utilized as the MAE and UAE apparatus. The hybrid extraction was carried out in an XO-SM400 Microwave–Ultrasound apparatus (ATPIO, Nanjing, JS, China).
Lipophilic (fat-soluble) compounds were removed by carrying out the initial extraction process with n-hexane across all extraction methods. For each method, dried coffee pulp equivalent to the weight in the experimental design was placed into a flask. An appropriate volume of n-hexane, as specified in the experimental design, was then added to the flask. Being non-polar, n-hexane effectively dissolves lipophilic substances, such as oils, fats, and waxes, present in the coffee pulp, as previously described by Wong-Paz et al. [
2]. The mixture was stirred for 30 min to allow the lipophilic compounds to transfer into the n-hexane phase. Following the extraction, the n-hexane phase, now containing the lipophilic compounds, was separated from the residual coffee pulp using a separatory funnel. Subsequent extractions were carried out across all methods on the coffee pulp free of lipophilic compounds using aqueous acetone and ethanol.
Microwave-assisted extraction was carried out by weighing coffee pulp in a microwave reactor and adding solvents based on the weight and concentrations in each experimental run. The extraction parameters were set as follows: Power, 800 W; Temperature, 60 °C; Time, 5 min. To ensure uniform heating, the mixture was stirred continuously throughout the extraction process. After extraction, the mixture was allowed to cool to room temperature, and the sample was filtered using Whatman 0.45 µm filter paper to remove solid residue. The resulting filtrate was collected and stored in amber bottles at −18 °C until further analysis.
For ultrasound-assisted extraction, the coffee pulp was weighed according to the experimental runs and placed into a 250 mL Erlenmeyer flask. The appropriate solvent concentration and volume, as determined by the experimental runs, were then added, ensuring the predetermined mass-to-volume ratio was maintained. The flask was placed inside an ultrasonic bath and subjected to sonication at a frequency of 40 kHz for 10 min at 60 °C. After extraction, the sample was centrifuged at 5000 rpm for 10 min to separate solid residue. The resulting supernatant was filtered using Whatman 0.45 µm filter paper, and the filtrate was stored in amber bottles at −18 °C for further analysis.
For the hybrid extraction method that integrates microwave and ultrasound techniques, the coffee pulp was accurately weighed in accordance with the experimental design and transferred to a glass reaction vessel. The predetermined solvent concentration and volume, as specified in the experimental runs, were then added. The XO-SM400 Microwave–Ultrasound apparatus (ATPIO, Nanjing, JS, China) was operated under the following conditions: 800 W, 60 °C, and 42 kHz for 10 min. After extraction, the treated sample was cooled to room temperature, then centrifuged at 5000 rpm for 10 min to separate solid residue. The resulting supernatant was filtered using a Whatman 0.45 µm filter paper and stored at −18 °C until further analysis.
2.3. Optimization of Hybrid (MAE–UAE) Method Using Box–Behnken
The Box–Behnken design was employed for the optimization of the hybrid (MAE–UAE) method. The design was performed with Design-Expert software (Version 13) from Stat-Ease 360, Inc. (Minneapolis, MN, USA). The experimental design consisted of 15 runs with three replicates, as shown in
Table 2. The three levels were encrypted as −1, 0, +1 for low, midpoint, and high, respectively. The experimental data were subjected to multiple regression analysis, and the response variables were fitted to a second-order polynomial model equation obtained by the response surface methodology (RSM), as shown in Equation (1):
In Equation (1),
y represents the predicted procyanidin content; β
0 denote the intercept (constant term); β
1, β
2, β
3 corresponds to coefficients of the linear terms for temperature (
A), time (
B), and solid-to-liquid ratio (
C); β
12, β
13, β
23 represent the coefficients of the interaction terms; β
11, β
22, β
33 denote the coefficients for the quadratic terms (squared terms).
According to the response model, the optimal three independent variables were evaluated to validate and check the accuracy of the used response model. The predicted values and the experimental values were reported.
2.4. Determination of Total Procyanidins
The content of procyanidin in the extracts was estimated using the HCl–Butanol assay in accordance with the procedure reported by Swain and Hillis [
16]. This reaction mixture consists of 50 µL solution of 2% (
w/
v) ferric ammonium sulphate in 2 M hydrochloric acid, 1.5 mL of (5%,
v/
v) HCl–butanol, and 200 µL of sample in a glass tube with a stopcock. A spectrophotometer (Biomate 3 Thermo Spectronic, Waltham, MA, USA) was used to measure the absorbance of the material at 500 nm. Procyanidins were measured in (mg/L) and compared to a procyanidin C1 standard curve. According to the Valencia-Hernandez et al. [
14] report, the yields of the procyanidin from coffee pulp were computed using Equation (2) below, where C is the concentration of procyanidins in (mg/mL), V is the total volume of extraction solvent in (mL), and M is the weight of coffee pulp analyzed in (mg).
2.5. Purification of Extracts Using Column Chromatography
Procyanidin purification was performed with column chromatography packed with Sephadex LH-20, following the protocol described by Wong-Paz et al. [
17]. A total of 80 g of Sephadex LH-20 was suspended in water for 72 h and allowed to swell before manually packing the 60 × 5 cm i.d. column (GE Healthcare, Chicago, IL, USA). To purify the procyanidins, dried aqueous acetonic extract (5 g/50 mL of 70% acetone) was applied to a Sephadex LH-20. The elution process was carried out using water, ethanol (70%,
v/
v), and acetone (70%,
v/
v) as mobile phases, with a flow rate of 5 mL/min. Elution times varied from 5 min to 15 h. During each solvent elution, sample fractions were manually collected for each solvent in the elution, evaporated under vacuum to remove organic solvents and lyophilized. The fractions collected were analyzed using the HCl–butanol assay for total procyanidins content and then the fractions were further characterized using HPLC/ESI-MS.
2.6. Analysis of Procyanidins by High-Performance Liquid Chromatography Coupled with Electrospray Ionization Mass Spectrometry (HPLC/ESI-MS)
The characterization was carried out by a method proposed by Cerda-Cejudo et al. [
18], with slight modifications. Using a Varian 500-MS IT Mass Spectrometer, (Varian, Palo Alto, CA, USA), with an electrospray ion source (ESI-MS), a Varian ProStar 430 system (Varian, Palo Alto, CA, USA) for high-performance liquid chromatography was set up. The system was integrated with a 150 mm × 2.1 mm, 3 µm Denali C18 column (Grace, CA, USA), a Varian ProStar 330 PDA detector (Varian, Palo Alto, CA, USA), a Varian ProStar 230I ternary pump (Varian, Palo Alto, CA, USA), and a Varian ProStar 410 autosampler (Varian, Palo Alto, CA, USA). An amount of 5 µL of the extract-prepared samples was then injected into the HPLC and passed through the C18 column while the oven was kept at 30 °C. The mobile phase used in this study consisted of acetonitrile (solvent B) mixed with formic acid (solvent A; 0.2%,
v/
v). Starting at 3% B, the elution was continued to 9% B linear for 0–5 min, 16% B linear for 5–15 min, and 50% B linear for 15–45 min. The flow rate was maintained at 0.2 mL/min while observing the elution at 280 nm.
The entire effluent (0.2 mL/min) was directed into the mass spectrometer source without any splitting. Mass spectrometry analysis was conducted in negative ion mode [M-H]-1. For this analysis, nitrogen and helium served as nebulizing and damping gases, respectively. Key ion source parameters are as follows: spray voltage, 5.0 kV; temperature, 350 °C; capillary voltage, 90.0 V. Data acquired during the analysis were gathered and prepared by MS Workstation software Version 6.9. In the full scan mode of analysis, samples were covered within the range of 50–2000 m/z. A compound was identified by every peek appearance in the chromatograms corresponding to a compound’s molecular weight m/z, along with retention time.
2.7. Antioxidant Activities of Procyanidin
The antioxidant activity of the pure procyanidin was evaluated through two widely recognized methods: the DPPH (2,2-diphenyl-1-picrylhydrazyl) radical scavenging assay [
19] and the ABTS (2,2′-azino-bis-(3-ethylbenzothiazoline-6-sulfonic acid) assay [
20]. These tests measure the ability of compounds to neutralize free radicals, providing insight into their potential antioxidant properties.
2.7.1. DPPH Assay
Using the DPPH (2,2-diphenyl-1-picrylhydrazyl) radical scavenging experiment, the antioxidant activity of the isolated molecule was assessed using the methodology outlined by Blois [
19]. A solution containing 60 µM of DPPH radical was made in methanol. Methanol was used to dissolve the test chemical, which was then diluted to different quantities. To avoid light-induced degradation, each sample was combined with a 1.01 mM DPPH solution and allowed to sit at room temperature for 30 min. A UV-visible spectrophotometer (Biomate 3 Thermo Spectronic, Waltham, MA, USA) was used to detect absorbance at 517 nm.
Methanol was used as the baseline correction blank in the experiment, and a DPPH-in-methanol solution was employed as the control. During the experiment, the IC50 value was calculated to find the sample concentration required to reduce absorbance by 50% in addition to the antioxidant activity evaluated with Equation (3):
where Ac = control absorbance and As = absorbance of sample.
2.7.2. ABTS Assay
Using a method described by Re et al. [
20] with some modifications. A stock solution of potassium persulfate (7.35 mmol/L) and ABTS radical solution (7 mmol/L) was combined at a 1:2 (
v/
v) ratio and left to stand at room temperature for the entire night. The ABTS radical working solution was created by diluting the stock solution until the absorbance at 734 nm was 0.7 ± 0.02. An amount of 1 mL of ABTS ethanol solution and 10 µL of sample were added to the reaction cuvette and allowed to stand for 1 min, the reading was carried out at 734 nm on a (Biomate 3 Thermo Spectronic, Waltham, MA, USA). Ethanol was used as the reading blank and the ABTS–ethanol solution as the absorbance control. The antioxidant activity, measured as radical scavenging capacity, was calculated from the equation below. Additionally, the IC50 value, representing the concentration of the sample required to reduce the absorbance by 50%, was also determined using Equation (4):
where Ac = control absorbance and As = absorbance of sample.
2.8. Statistical Analysis
An analysis of variance (ANOVA) with 95% significance was used to analyze the data. The model’s goodness-of-fit was evaluated based on the p-values, and the correlation coefficient (R2) was used to assess the strength of the relationship between the experimental factors and the response variables. Tukey’s multiple range test was used to compare treatment means. Software programs, OriginPro 2021 (OriginLab, Northampton, MA, USA) and Design-Expert software (Version 13) from Stat-Ease 360, Inc. (Minneapolis, MN, USA), were employed to conduct the statistical analysis.
3. Results and Discussion
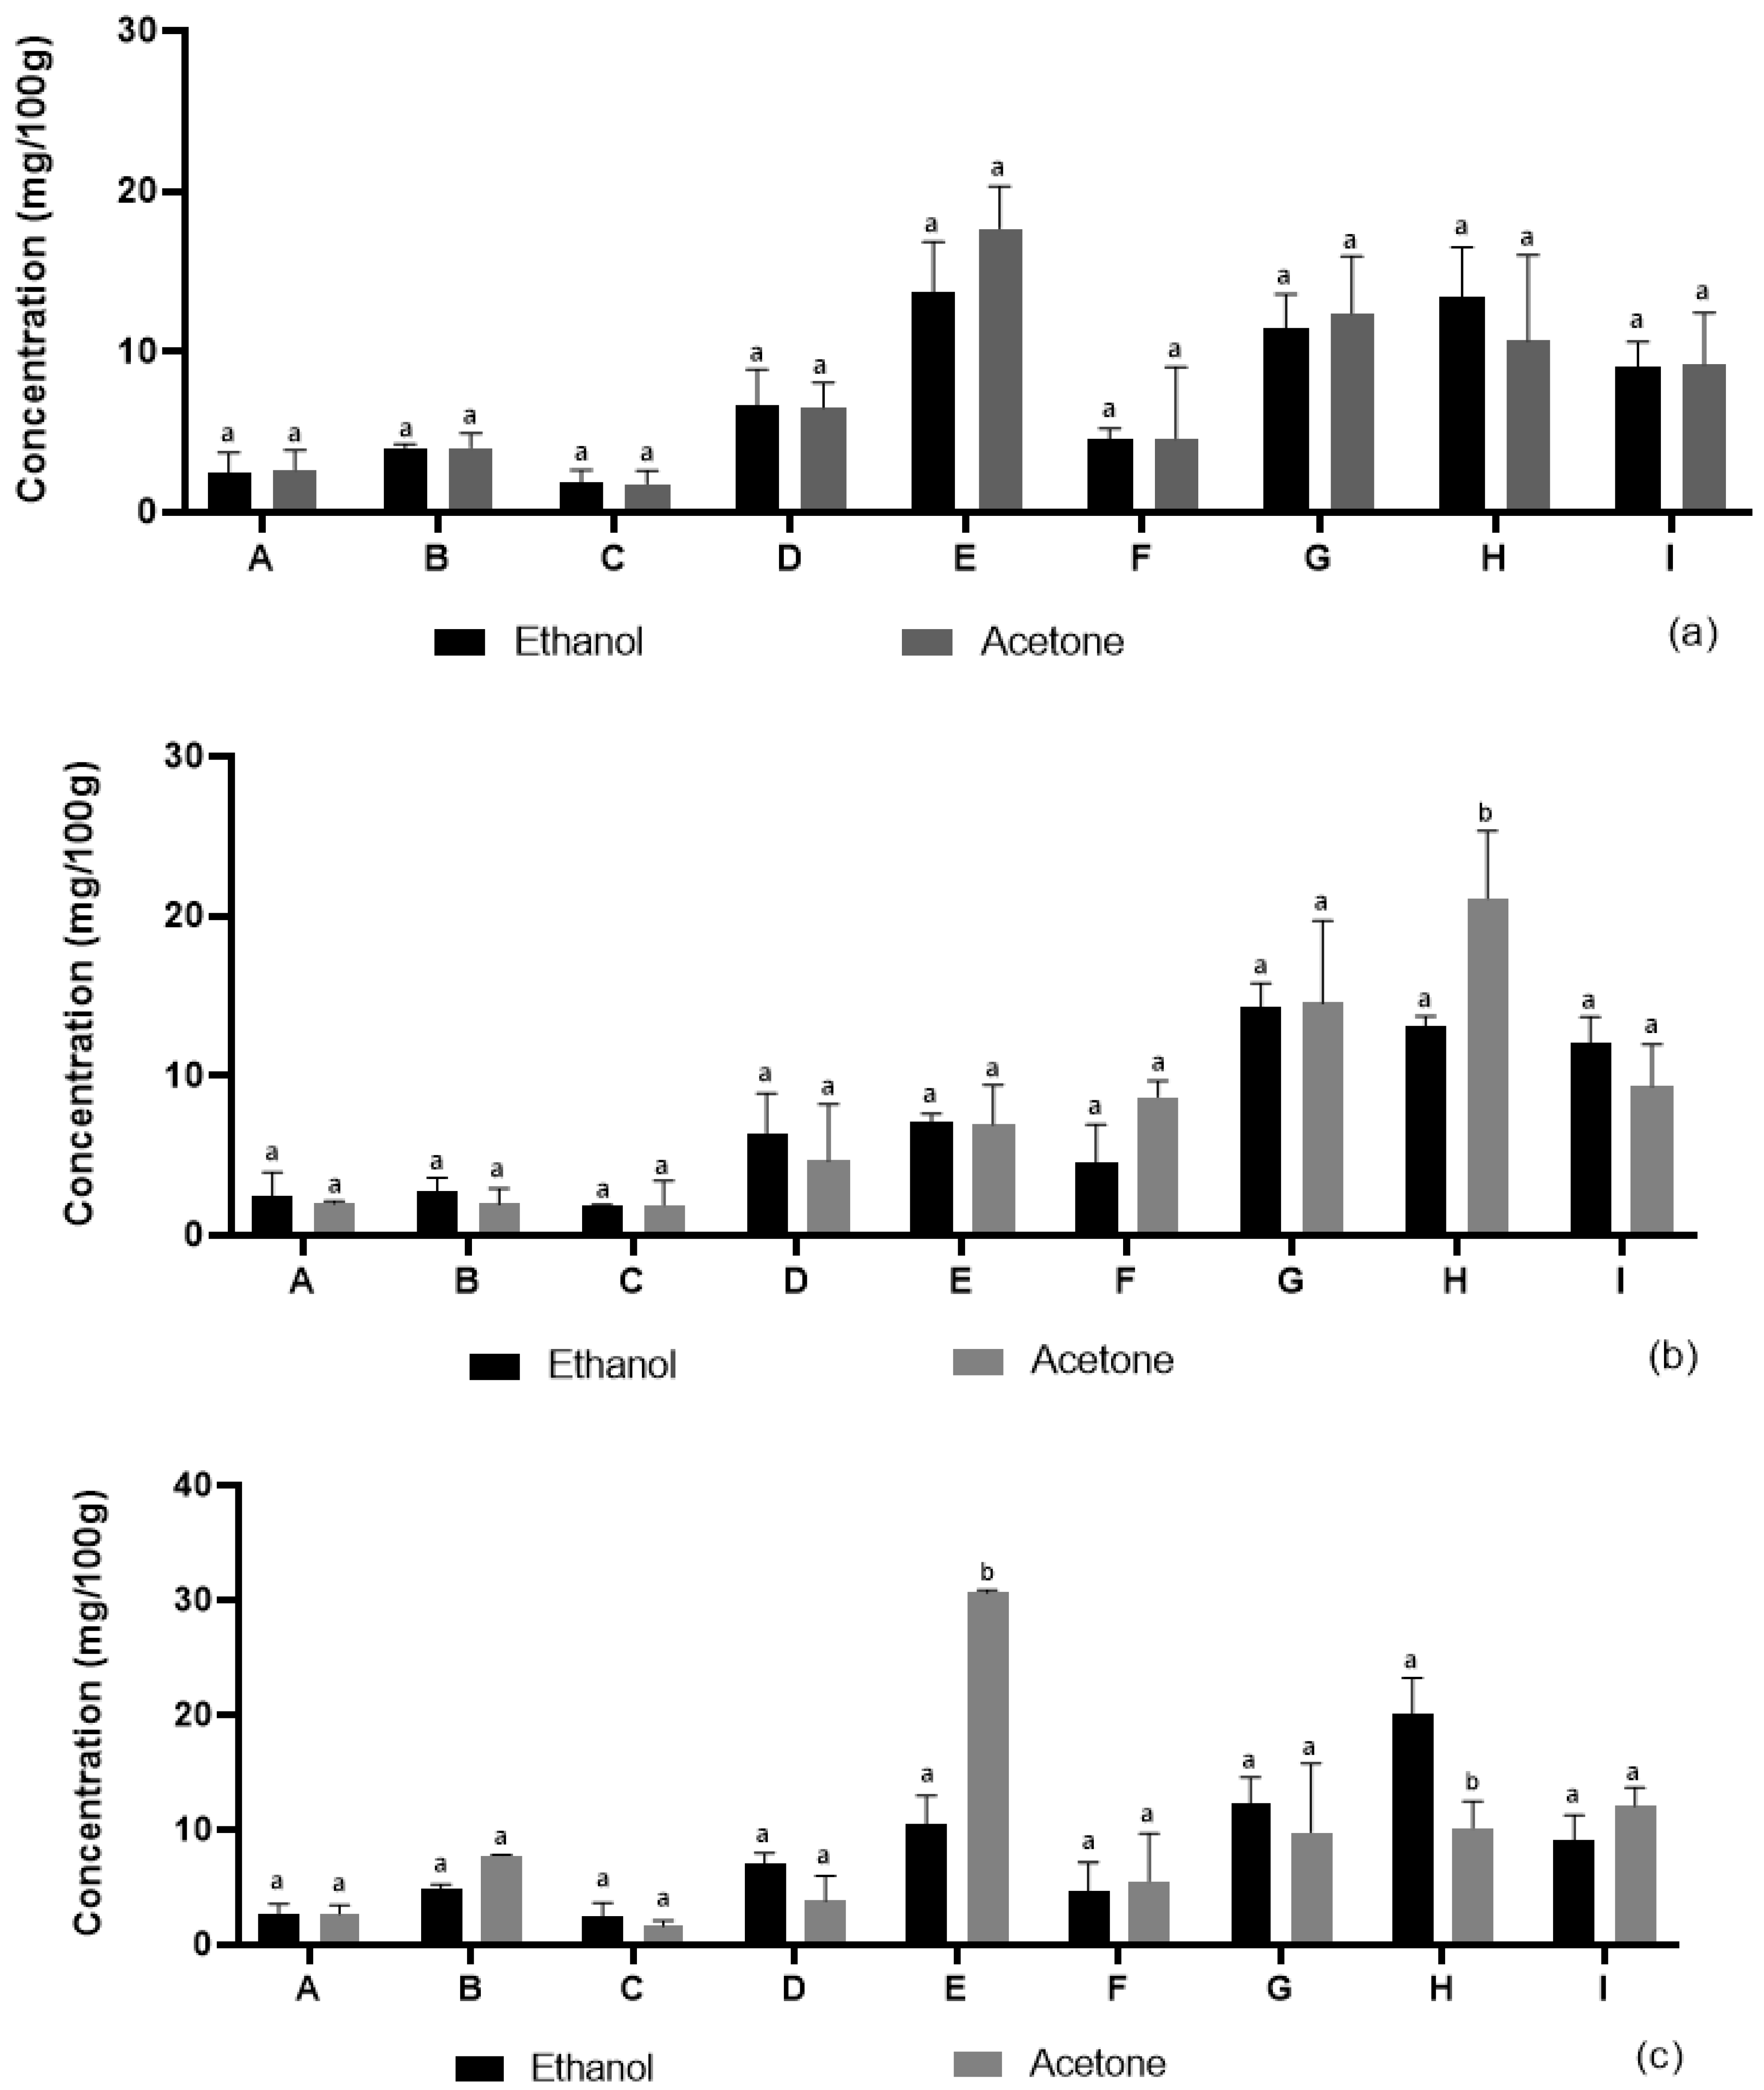
Microwave-assisted extraction (MAE) accelerates the extraction process by using microwave energy to heat the solvent (ethanol or acetone) and coffee pulp, increasing solvent penetration into the cell matrix, disrupting cell walls, and releasing procyanidins. The microwave radiation interacts with the procyanidins, causing rapid heating and efficient recovery from the ground coffee pulp. The yields of procyanidins from coffee pulp using the MAE with ethanol and acetone as extraction solvents are presented in
Figure 1a. Ethanol yielded 2.48 mg/g, 4.01 mg/g, 1.83 mg/g, 6.66 mg/g, 13.73 mg/g, 4.54 mg/g, 11.44 mg/g, 13.38 mg/g, and 9.06 mg/g for runs A, B, C, D, E, F, G, H, and I, respectively. By comparison, acetone yielded 2.66 mg/g, 4.03 mg/g, 1.80 mg/g, 6.54 mg/g, 17.69 mg/g, 4.62 mg/g, 12.40 mg/g, 10.71 mg/g, and 9.24 mg/g for the same runs. The extraction yields obtained using ethanol and acetone are notably similar across all individual runs, as indicated by the letter ‘a’ on the bars in
Figure 1a. This statistical grouping suggests that there are no significant differences between the two solvents in terms of extraction efficiency for the tested samples. For instance, in run A, ethanol yielded 2.48 mg/g, while acetone yielded 2.66 mg/g. Similarly, in run B, the yields were 4.01 mg/g for ethanol and 4.03 mg/g for acetone. In run H, ethanol extraction resulted in 13.38 mg/g, whereas acetone yielded 10.71 mg/g. While the yields were comparable in most cases, the major difference lies in the highest yield observed with acetone in run E (17.69 mg/g) suggesting a favorable interaction between the acetone and the coffee pulp matrix. The low molecular weight and polarity of acetone, combined with the heat and pressure generated by microwave energy, likely enhanced solvent penetration into the cell walls of the coffee pulp, resulting in a higher recovery of procyanidins. Additionally, microwave energy facilitates cell wall disruption and promotes the diffusion and release of procyanidins [
21]. The results indicate that, while both ethanol and acetone are effective for procyanidin extraction, acetone yielded higher amounts of procyanidins with MAE.
Ultrasound-assisted extraction (UAE) enhances the extraction of procyanidins from coffee pulp by using ultrasonic waves to disrupt cell walls, improving solvent penetration and mass transfer efficiency. The results of ultrasound-assisted extraction for ethanol and acetone, as shown in
Figure 1b, revealed varying procyanidin yields across runs A–I for both solvents. Ethanol yielded 2.42 mg/g, 2.72 mg/g, 1.90 mg/g, 6.41 mg/g, 7.08 mg/g, 4.60 mg/g, 14.35 mg/g, 13.11 mg/g, and 12.04 mg/g for runs A–I, respectively, while acetone yielded 2.00 mg/g, 1.95 mg/g, 1.92 mg/g, 4.68 mg/g, 6.97 mg/g, 8.69 mg/g, 14.56 mg/g, 21.11 mg/g, and 9.36 mg/g for the same runs. In
Figure 1b, the extraction yield for Run H showed a significant difference between ethanol and acetone, as indicated by the letter ‘b’ on the acetone bar. In contrast, the yields obtained from all other runs did not show significant differences between the two solvents, as denoted by the letter ‘a’ on the respective bars. This suggests that, except for Run H, ethanol and acetone exhibited similar extraction efficiencies. The extraction yields of ethanol were generally moderate, with the highest yield observed in run G (14.35 mg/g). This could be due to the polarity of ethanol and the ultrasonic waves generated from the ultrasound equipment that caused improvements in mass transfer thereby allowing the permeation of the solvent into the plant matrix [
22] Acetone produced a broader range of yields, with a maximum yield of 21.11 mg/g in run H, suggesting that acetone may have enhanced procyanidin extraction under the given ultrasound conditions. Acetone’s lower polarity compared to ethanol could have facilitated greater penetration into the coffee pulp matrix, especially in this run [
23]. Procyanidins propensity for acetone could also be responsible for the high yield [
24,
25,
26]. The lower yields in runs A–C with acetone (ranging from 1.92 to 2.00 mg/g) indicate that the extraction conditions during these runs were not sufficient to maximize procyanidin recovery. Interestingly, acetone consistently outperformed ethanol particularly in runs F, G, and H. This might be due to acetone’s superior ability to extract compounds from coffee pulp, possibly because it is better suited to dissolving both polar and nonpolar compounds under ultrasound-assisted conditions which generate acoustic cavitation to create micro bubbles that collapse to disrupt cell walls and enhance solvent diffusion to accelerate the release of procyanidins.
The hybrid extraction (MAE–UAE) results are shown in
Figure 1c. Ethanol yielded 2.74 mg/g, 4.83 mg/g, 2.44 mg/g, 7.13 mg/g, 10.42 mg/g, 4.63 mg/g, 12.21 mg/g, 20.11 mg/g, and 9.12 mg/g for runs A, B, C, D, E, F, G, H, and I, respectively. While for the same runs, acetone gave 2.70 mg/g, 7.79 mg/g, 1.65 mg/g, 3.86 mg/g, 30.66 mg/g, 5.55 mg/g, 9.78 mg/g, 10.15 mg/g, and 12.09 mg/g yields. As shown in
Figure 1c, the extraction yields from ethanol and acetone were generally not significantly different, as indicated by the presence of the same letter ‘a’ on most of the bars. However, significant differences were observed for Runs E and H, where the bars are labeled with both ‘a’ and ‘b’, indicating that the extraction efficiency varied significantly between the two solvents in these cases. In run E, ethanol yielded 10.42 mg/g, while acetone yielded 30.66 mg/g. In run H, the ethanol yield was 20.11 mg/g, while acetone gave a 10.15 mg/g yield. The highest yield for ethanol was 20.11 mg/g, in run H, whereas acetone gave a 30.66 mg/g yield in run E. This suggest that the solvent proved to be effective in recovering procyanidins from its natural source [
21]. Also, the low molecular weight and polarity of acetone could be responsible for the better penetration of the solvent to the internal structures of the coffee pulp to release procyanidins [
27]. From the results, it was obvious that the hybrid technique resulted in a more efficient extraction of procyanidin yield compared to the individual methods of MAE and UAE, and this clearly demonstrates the synergistic effect of microwave and ultrasound processes [
15].
The hybrid extraction method integrates the MAE and UAE mechanisms to enhance the efficiency of recovering procyanidins from coffee pulp. In the MAE, microwave energy helps to heat up the solvent to disrupt cell walls, increasing mass transfer and improving solvent penetration to promote the release of procyanidins. The UAE employs ultrasonic waves to generate acoustic cavitation in the extraction solvent to create micro bubbles that collapse to disrupt cell walls, enhance solvent diffusion, and accelerate the release of procyanidins. The hybrid extraction method integrates these mechanisms to optimize the extraction of procyanidins.
Figure 2 shows the highest yield of procyanidin obtained from the three extraction methods employed in this research (MAE, UAE, and hybrid extraction) with acetone. “HAE (Run E) Acetone” (labeled with “b”) had significantly higher concentrations than both “MAE (Run E) Acetone” and “UAE (Run H) Acetone” (both labeled with “a”), which are not significantly different from each other. The results revealed a significant difference between the yield of hybrid extraction method and the individual methods of MAE and UAE, suggesting that the hybrid extraction is the most effective technique for recovering procyanidins from coffee pulp under optimized conditions. Compared to previous studies, the hybrid extraction method demonstrated significantly higher yields. For instance, Hu et al. [
28] reported an MAE yield of 32.23 mg/g, while Valencia-Hernandez et al. [
14] reported a UAE yield of 42.00 mg/g, both of which are notably lower than the 60.88 mg/g obtained through the optimized hybrid extraction in this study. These findings align with recent research on hybrid extraction techniques, which indicate that hybridizing microwave and ultrasound technologies enhances mass and energy transfer, resulting in improved extraction efficiency [
15]. This underscores the potential of hybrid MAE–UAE as a more effective and sustainable approach for extracting bioactive compounds from natural sources.
3.1. Optimization of Extraction Parameters by Box–Behnken Design
The Box–Behnken design was used to optimize extraction parameters on the acetonic hybrid extract, aiming to maximize the procyanidin yield. Fifteen runs were conducted with different combinations of variables. Multiple regression analysis revealed a second-order polynomial equation, demonstrating the relationship between procyanidin content and tested variables, demonstrating the effectiveness of this approach in extracting procyanidins.
where A = Temperature, B = Time, C = solid to liquid ratio.
To assess the quadratic polynomial model’s quality of fit, an analysis of variance (ANOVA) was performed (
Table 3). The fitted regression model and the observed data showed a significant association, as indicated by the coefficient of determination (R
2) of 0.9970. Further confirming the model’s great fit is the little discrepancy of less than 0.2 between the modified R
2 and the expected R
2. Furthermore, the accuracy and dependability of the experimental values were confirmed by the percentage coefficient of variation (% CV), which was 0.3230. The signal-to-noise ratio, or sufficient precision, was 40.5054, significantly higher than the four thresholds. A very strong signal in relation to the noise is indicated by this high ratio, which shows how accurate and dependable the model or measurement is. With a
p-value of less than 0.0001, the model’s strong significance is demonstrated by its F-value of 187.39. Furthermore, the F-value of 1.793 for the lack of fit was negligible at
p = 0.0603, with alpha = 0.05, indicating that the model is both reliable and sufficient for response prediction.
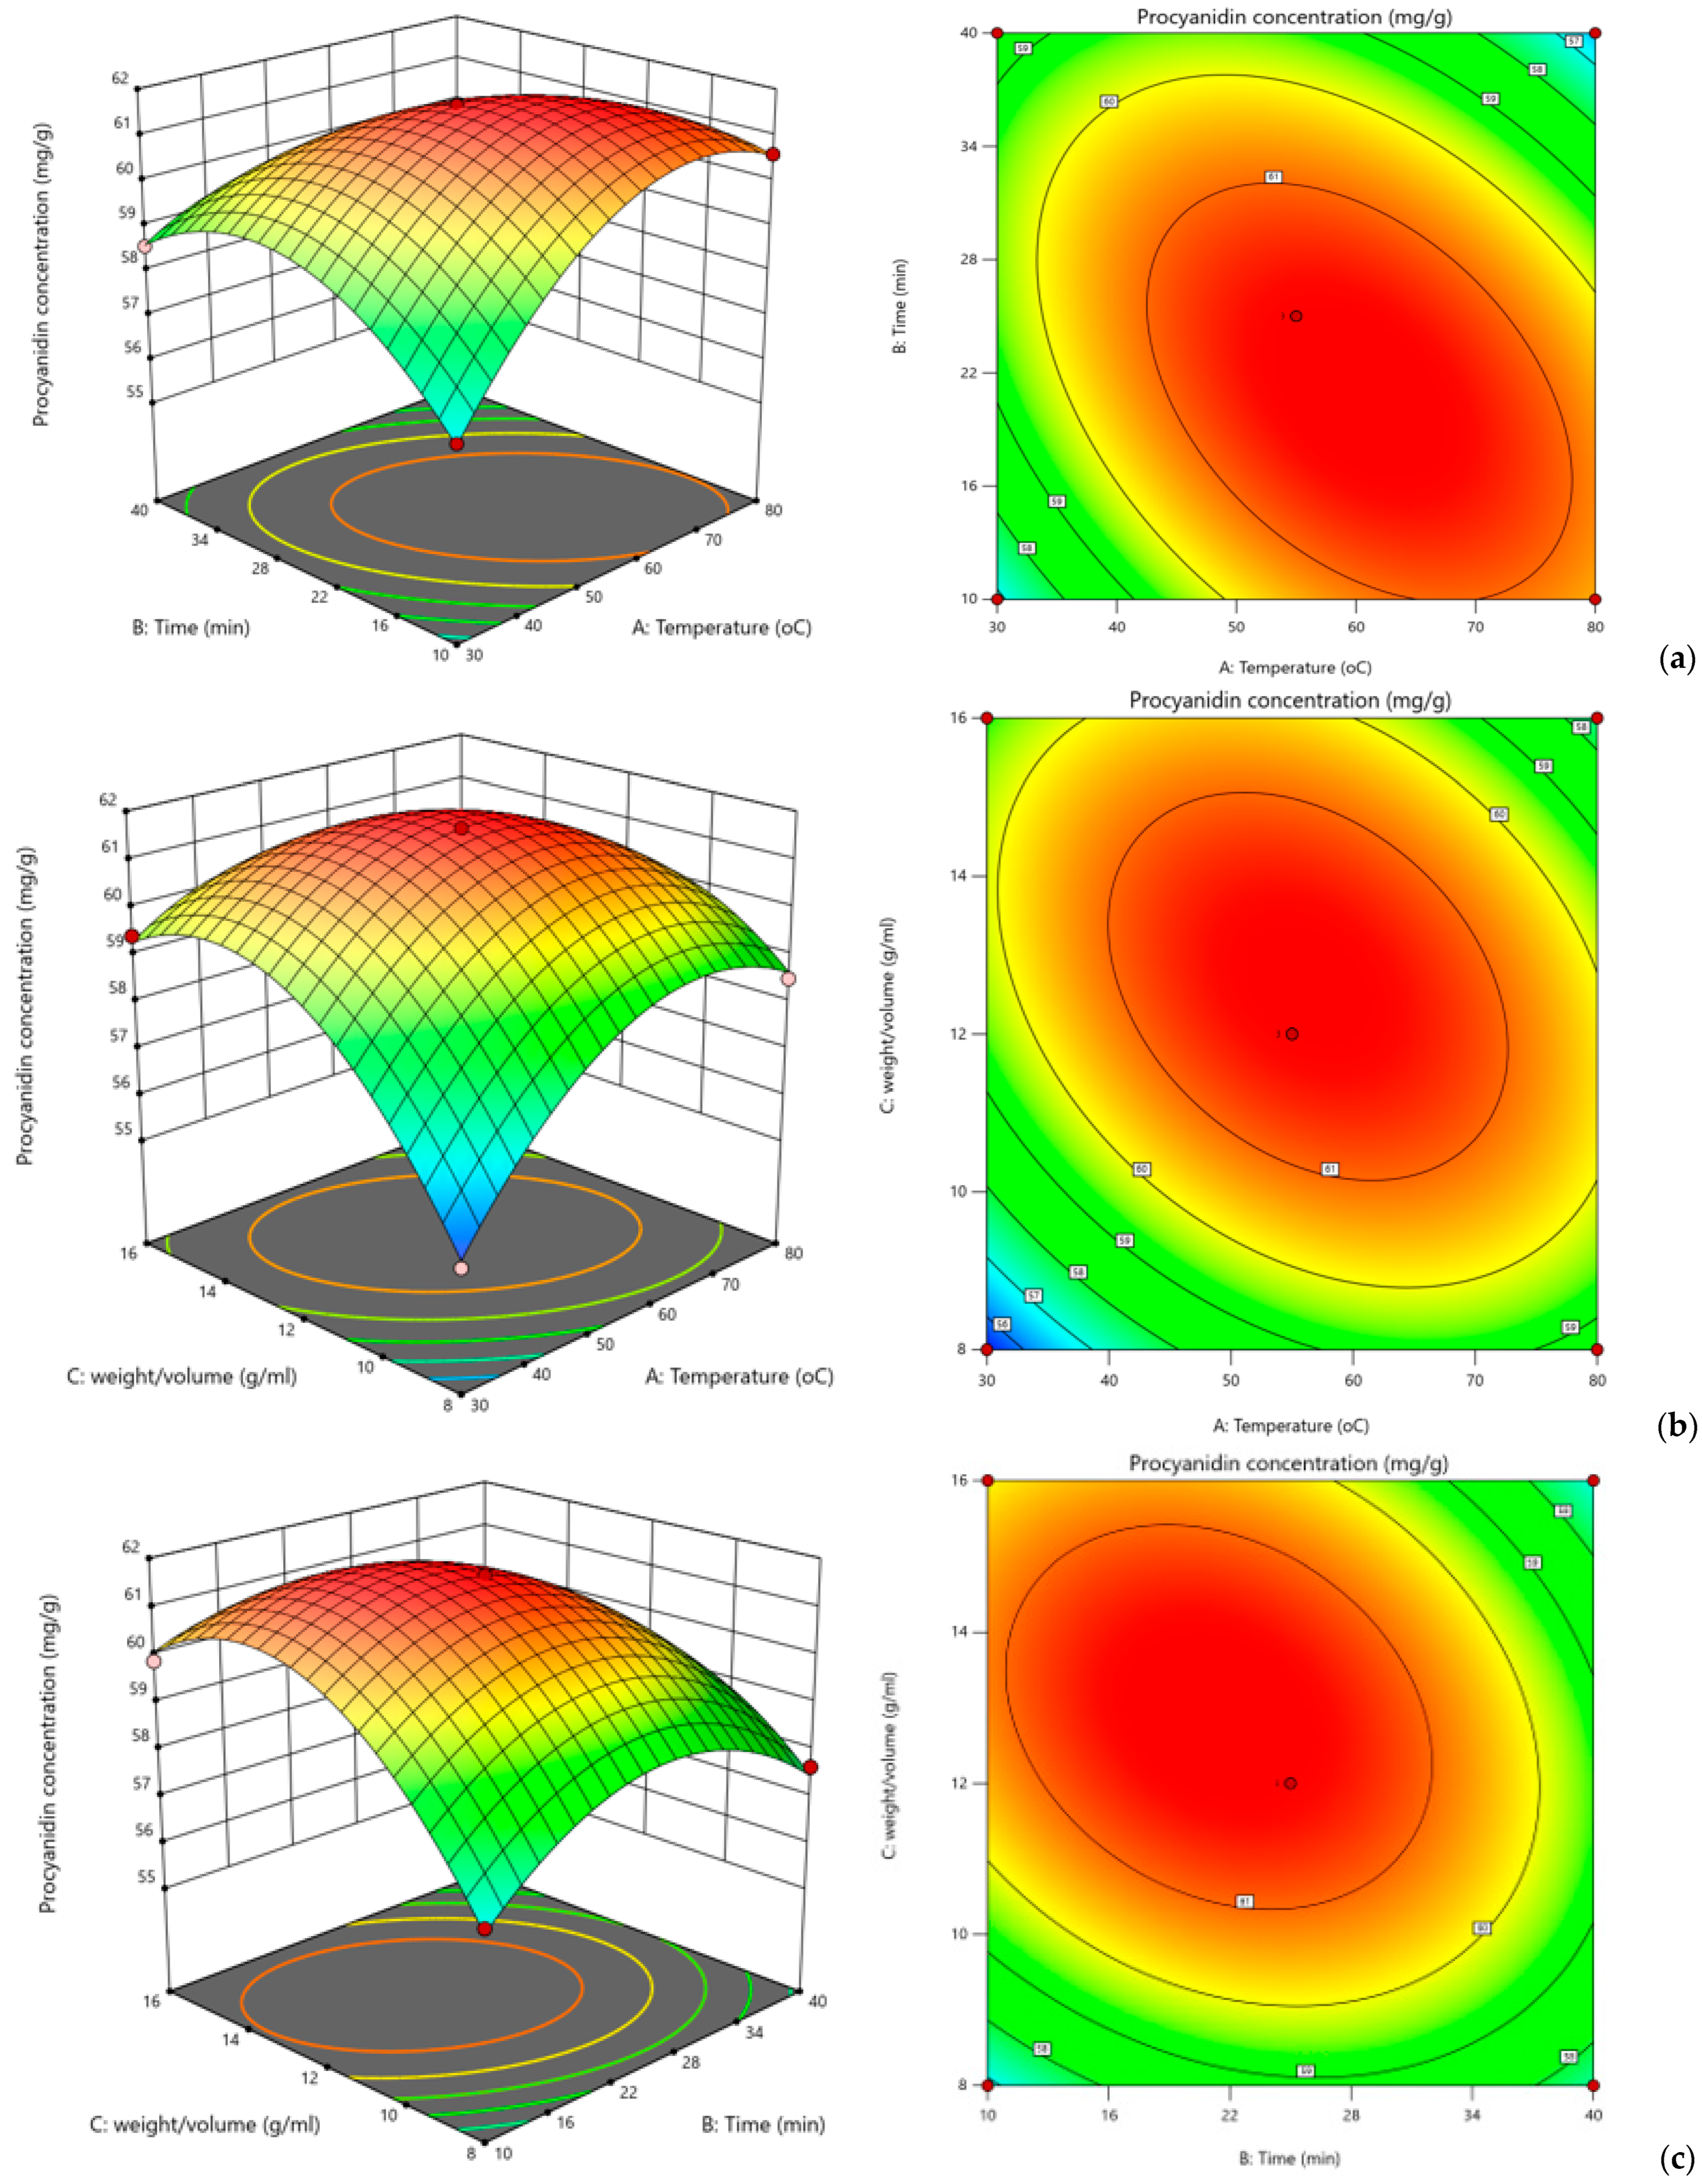
Figure 3 presents the relationships between factors and responses as shown by the contour plots and three-dimensional response surface plots. The 3D graphs show that the observed procyanidin yield increased with the extraction time up to 21 min and with a compound-to-solvent ratio of 1:13 g/mL; procyanidin yield decreased with additional increases in either variable above the ideal value, suggesting that both variables are crucial and have a major impact on the extraction process.
According to this study, procyanidin output is increased at an extraction temperature of 60 °C and a compound-to-solvent ratio of 1:13 g/mL. Lower yields were the outcome of additional increases which could be due to degradation of the procyanidin moiety. With the maximum procyanidin yield of 60.879 mg/g, the ideal process parameters were found to be a 1:13 g/mL compound-to-solvent ratio, 60 °C extraction temperature, and 21 min.
The response model obtained from a multivariable optimization using the Box–Behnken design, where combinations of time, solid-to-liquid ratio, and solvent concentration were tested through a systematic series of experiments to measure extraction efficiency, identified the following three independent variables as optimal: extraction time of ~21 min, solid-to-liquid ratio of ~1:13 g/mL, and temperature of ~60 °C.
To verify that the response model was accurate, a validation experiment was performed.
Table 4 displays both the expected values and the experimental values of this study. With a relative error of 0.004%, the experimental values closely match what was predicted.
3.2. Results of the Purification of Extracts
One of the major challenges of working with procyanidins is the difficulty of obtaining the compound in pure form. Purification of the polymeric fraction of procyanidins was carried out by liquid chromatographic on a Sephadex LH-20 column to obtain an extensive characterization of the polymeric procyanidins from coffee pulp. The following mobile phase was used to collect the three fractions: water, 70%
v/
v ethanol, and 70%
v/
v acetone.
Table 5 displays each of these fractions’ total procyanidin content. It was found that the 70% acetonic fraction had the highest procyanidin content (98.9%). This significant yield highlights the compatibility between acetone and procyanidins, due to acetone’s moderate polarity. The carbonyl group in acetone forms weaker hydrogen bonds with the hydroxyl groups of procyanidins, facilitating easier elution. The balance of 30% water in the solution also contributes by adjusting the polarity, enhancing the selective elution of procyanidins while minimizing the retention of other compounds.
This also indicates that acetone is more effective than other solvents, like ethanol or water, making it an ideal choice for isolating highly purified procyanidins from natural sources, such as coffee pulp. This result aligns with previous studies on the effectiveness of acetone in polyphenol isolation [
14,
17].
The trends observed could also be due to the solvents used in the extraction process. The crude extract was 70% acetone, and this might allow for compatibility with the eluent and cause preferential elution with acetone rather than other solvents, like ethanol or water [
2]. Overall, the 98.9% elution demonstrates the good efficiency of 70% acetone as a mobile phase for the purification of procyanidins. This emphasizes the importance of solvent choice in chromatographic separation and suggests that this parameter can offer a reproducible methodology to isolate highly purified procyanidins from natural sources.
The water fraction yielded the lowest percentage of procyanidins (0.11%) due to polarity mismatch [
29], as water is highly polar and procyanidins are moderately polar. This results in lower affinity to water, as water may elute smaller, highly polar compounds first, while procyanidins may remain retained on the stationary phase. The ethanol fraction (0.41%) had a slightly higher percentage of procyanidins than the water fraction but significantly lower than the 70% acetone fraction. The 70% ethanol fraction can reduce the yield of procyanidins due to stronger hydrogen bonds with the Sephadex LH-20, leading to higher retention in the column. Using 70% ethanol during column chromatography can affect solubility, precipitation, and elution efficiency, resulting in lower yields. Ethanol’s higher viscosity may also result in slower flow rates, resulting in less efficient separation and lower yields.
3.3. Results of Procyanidin Analysis by High-Performance Liquid Chromatography Coupled with Electrospray Ionization Mass Spectrometry (HPLC/ESI-MS) and Their Interpretation
Water, 70% ethanol, and 70% aqueous acetone were used as mobile phases for purifying the acetonic extract. The eluates from each phase were analyzed using HPLC/ESI-MS to identify the molecular weights (m/z) and retention times (RT) of the procyanidins present. Compound identification was based on mass analysis and existing scientific data.
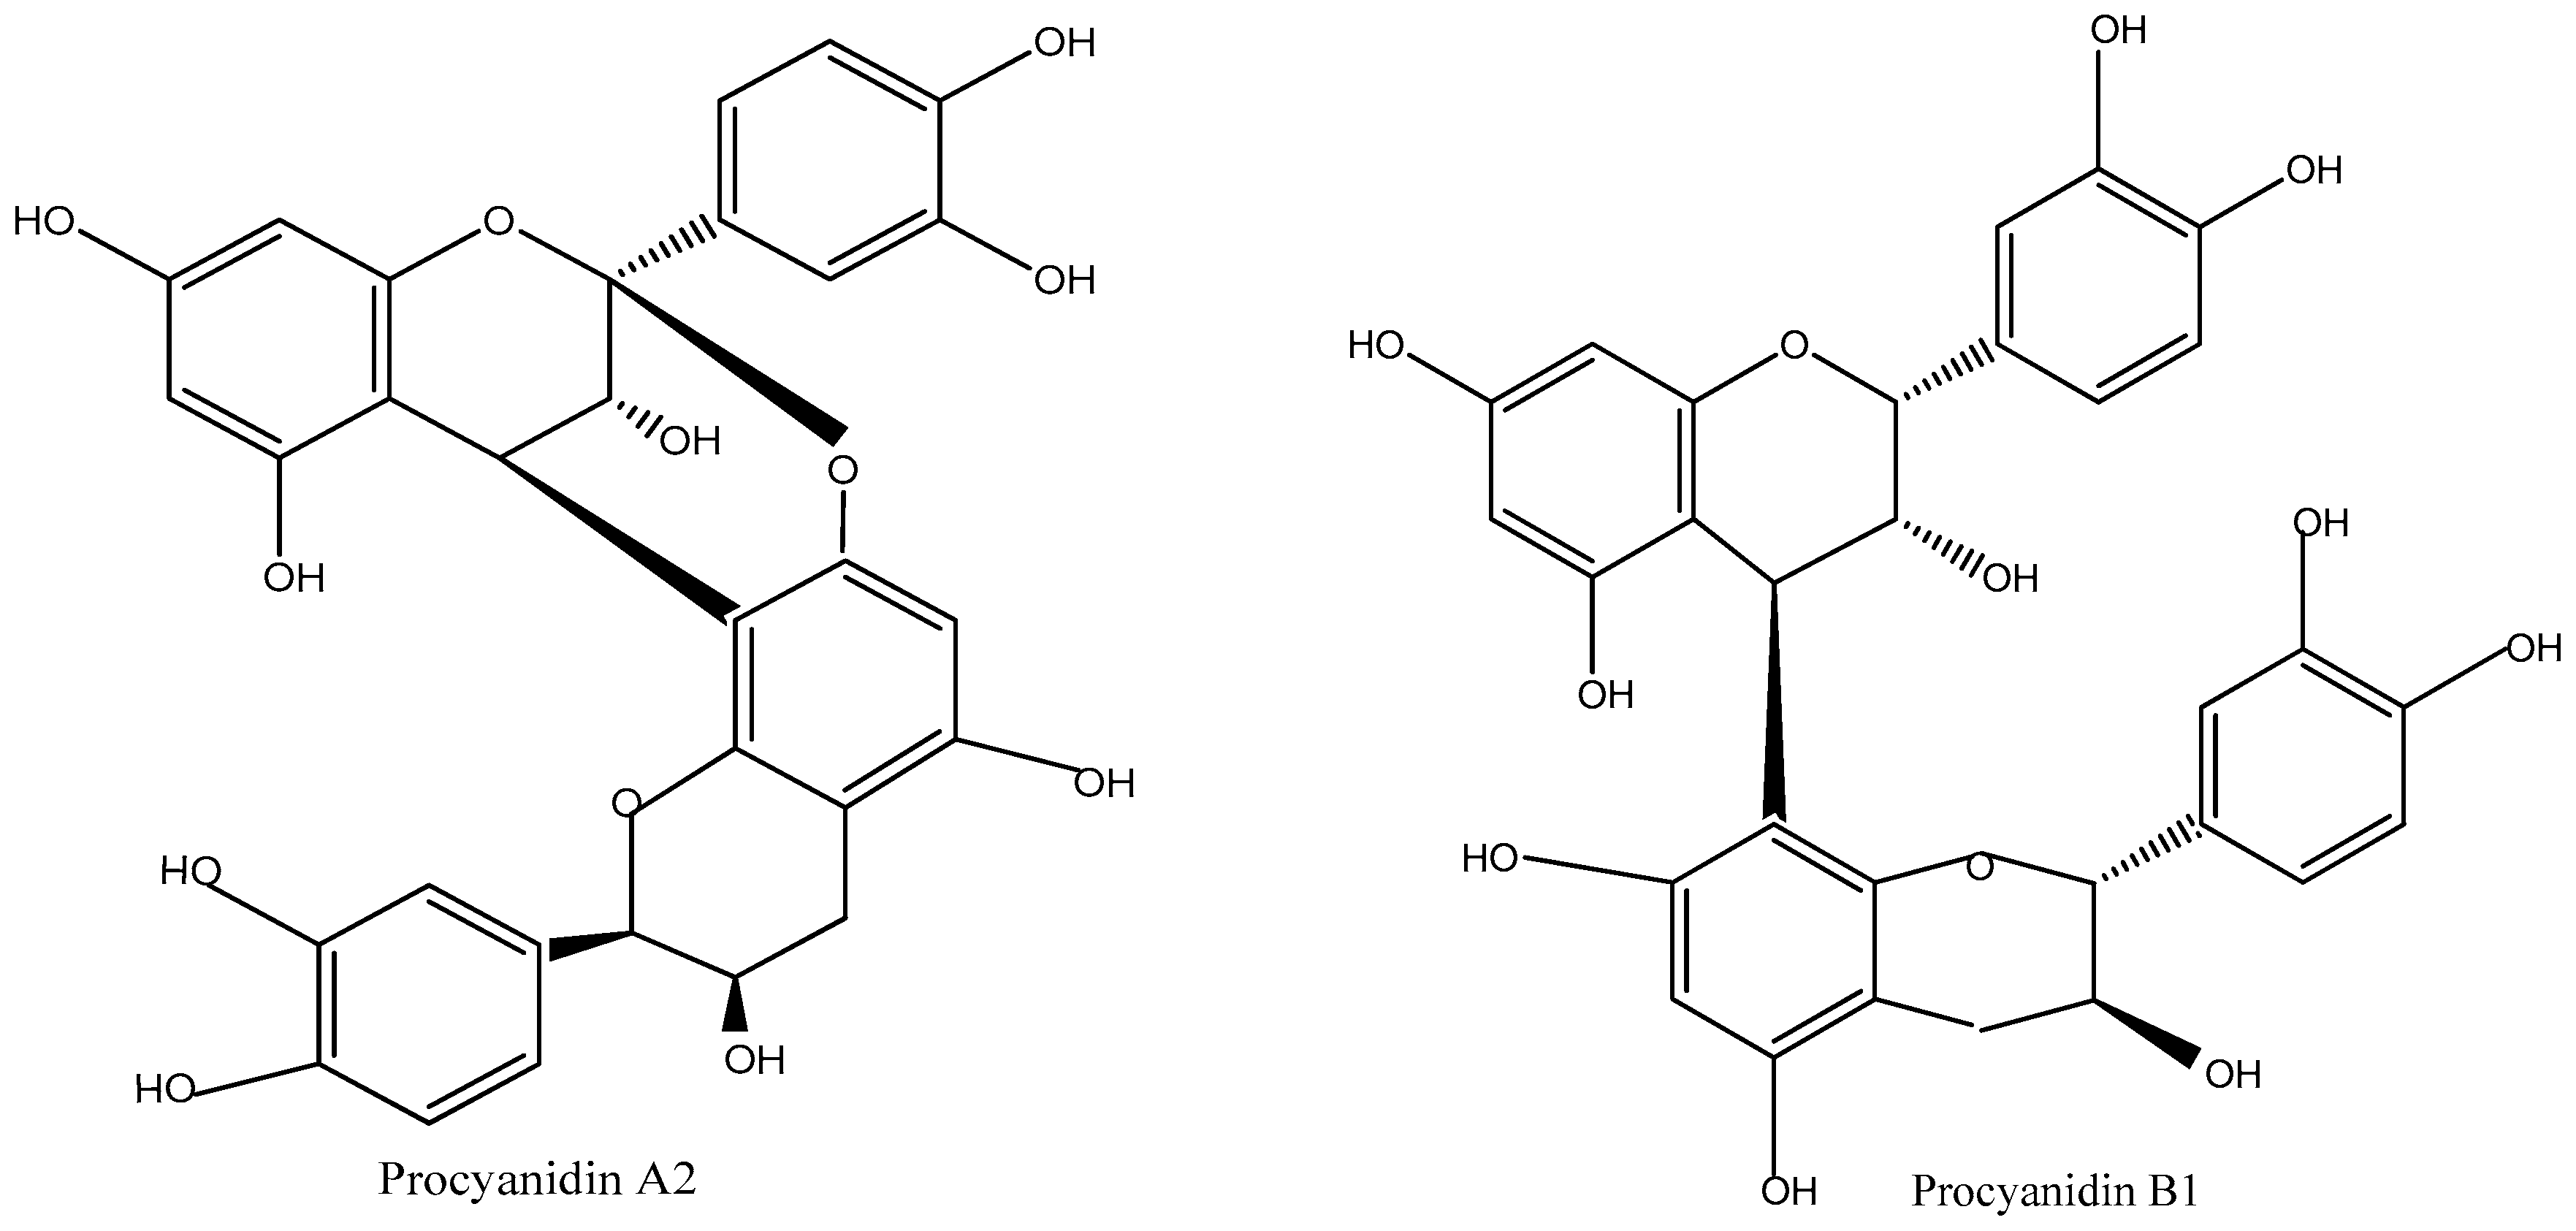
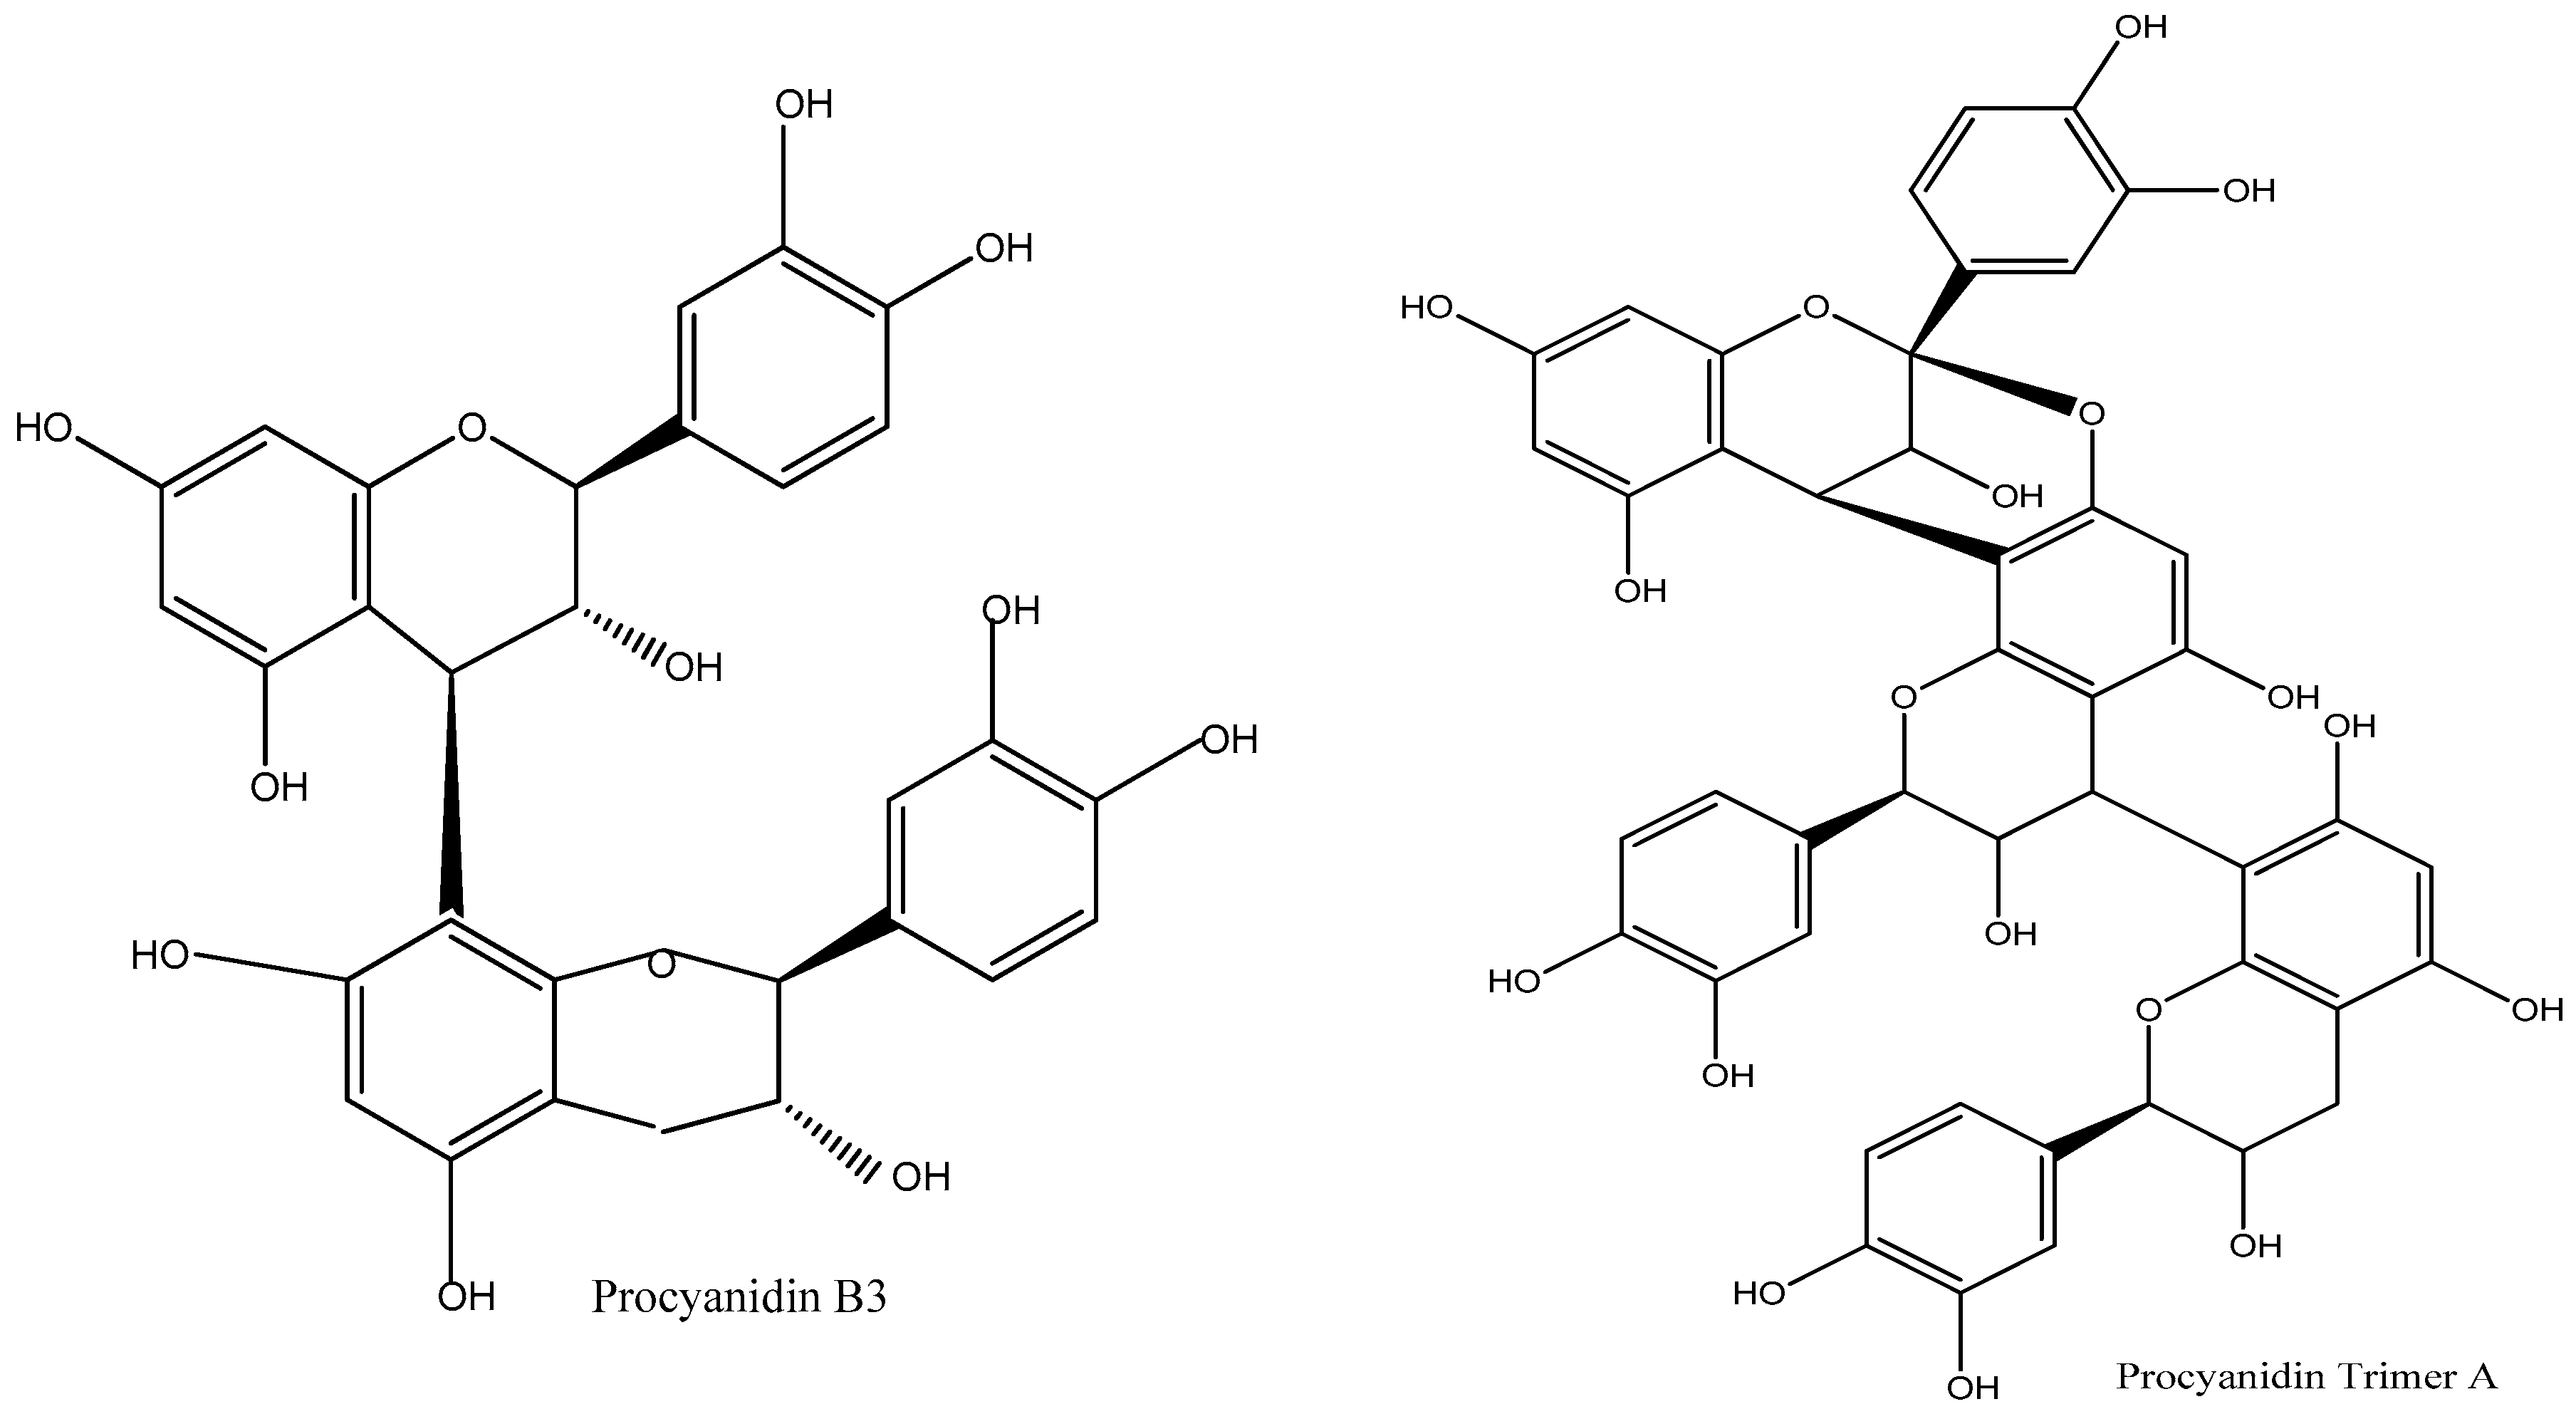
As shown in
Table 6, the mass analysis of the water fraction identified an ion at
m/
z 608.7 with a retention time (RT) of 31.08 min, indicating the presence of Procyanidin B3 dimer (
Figure 4), which belongs to the proanthocyanidin dimers family. The 70% ethanol fraction exhibited an ion at
m/
z 574.4 with an RT of 25.64 min, corresponding to Procyanidin A2 (
Figure 4), a member of the proanthocyanidins family.
In the 70% acetone fraction, two prominent ions were detected. The first, at
m/
z 576.7 with an RT of 18.90 min, corresponds to Procyanidin B1 dimer (
Figure 4), also classified under proanthocyanidin dimers. The second, at
m/
z 864.4 with an RT of 26.26 min, indicates the presence of Procyanidin A trimer (
Figure 4), belonging to the proanthocyanidin trimers family. These findings highlight the variations in procyanidin composition across different solvent fractions, demonstrating the effectiveness of different extraction methods in isolating specific procyanidin compounds.
Previous studies have documented the extraction, partial purification, and characterization of procyanidins from coffee pulp and other sources using HPLC/ESI-MS, supporting the findings of this study [
14,
16,
30,
31]. Procyanidin dimers and trimers have been reported to possess a range of biological activities, including neuroprotection [
32], anticancer properties [
32], analgesic effects [
33], anti-inflammatory actions [
34], and antioxidant activity [
35,
36,
37].
3.4. Antioxidant Activity of Procyanidins in the 70% Acetone Fraction of the Purified Extract, Measured by DPPH and ABTS Assays
The antioxidant properties of the pure procyanidins from 70% acetone fraction of the purified extract was investigated using DPPH radical scavenging activity, and ABTS radical scavenging activity.
Table 7 shows the result of the DPPH assay and ABTS assay. Procyanidin showed the scavenging capacity against DPPH radicals (IC
50) of 12.77 ± 0.16 µg/mL. Trolox as control exhibited an IC
50 of 13.43 ± 0.21 µg/mL. Based on this result, procyanidin has a higher antioxidant activity than Trolox.
The good antioxidant activity of procyanidin is probably due to the phenolic hydrogen present in their structure. The phenolic hydrogen act as hydrogen donating radical scavengers, singlet oxygen quenchers, and electron-donating agents, with properties to form stable antioxidant-derived radicals [
38]. Procyanidin also had scavenging abilities against ABTS, as shown in
Table 7 (IC
50) of 15.52 ± 0.23 µg/mL. The IC
50 of gallic acid as control was 17.48 ± 0.18 µg/mL. Procyanidins neutralize ABTS free radicals by donating electrons or hydrogen atoms to it, converting it into its non-radical form. Their structure stabilizes the radical, making it less reactive [
39].
The higher capability of procyanidin, compared to Trolox, to scavenge free radicals showed that it had better potential as an antioxidant, in concurrence with the result from the DPPH assay. These methods used together reinforce its antioxidant properties, since they are based on different antioxidative reaction mechanisms involving hydrogen atom and electron transfer [
40]. These results are compatible with previous reports that showed procyanidins are powerful antioxidants capable of scavenging free radicals from DPPH and ABTS [
41]. Also, the IC
50 of 12.77 µg/mL and 15.52 µg/mL observed in this study are significantly lower than the 81.91 µg/mL reported for procyanidins by Wei et al. [
42], indicating a much stronger antioxidant capacity. Additionally, these values are comparable to the antioxidant activities reported by Indrianingsih et al. [
26]. The lower IC
50 values suggest that the compounds in this study exhibit excellent free radical scavenging ability.


 ,
, 

