Article

Properties and Optimization Process Using Machine Learning for Recycling of Fly and Bottom Ashes in Fire-Resistant Materials

Department of Chemical and Environmental Engineering, School of Engineering, University of Seville, Camino de los Descubrimientos, s/n, 41092 Seville, Spain
*
Author to whom correspondence should be addressed.
Processes 2025, 13(4), 933; https://doi.org/10.3390/pr13040933
Submission received: 5 February 2025 / Revised: 17 March 2025 / Accepted: 19 March 2025 / Published: 21 March 2025

Abstract

:
Significant amounts of coal fly and bottom ash are generated globally each year, with especially large quantities of bottom ash accumulating in landfills. In this study, fly ash and bottom ash were used to create fire-resistant materials. A mix of 30 wt% gypsum, 9.5 wt% vermiculite, and 0.5 wt% polypropylene fibers was used, maintaining a constant water-to-solid ratio, with varying fly ash/bottom ash ratios (40/20, 30/30, and 20/40). The density, as well as various mechanical properties (compressive strength, flexural strength, and surface hardness), fire insulation capacity, and leaching behavior of both ashes were evaluated. When comparing the 40/20 and 20/40 compositions, a slight decrease in density was observed; however, compressive strength dropped drastically by 80%, while flexural strength decreased slightly due to the action of the polypropylene fibers, and fire resistance dropped by 8%. Neither of the ashes presented any environmental concerns from a leaching standpoint. Additionally, historical data from various materials with different wastes in previous works were used to train different machine learning models (random forest, gradient boosting, artificial neural networks, etc.). Compressive strength and fire resistance were predicted. Simple parameters (density, water/solid ratio and composition for compressive strength and thickness and the composition for fire resistance) were used as input in the models. Both regression and classification algorithms were applied to evaluate the models’ ability to predict compressive strength. Regression models for fire resistance reached r2 up to about 0.85. The classification results for the fire resistance rating (FRR) showed high accuracy (96%). The prediction of compressive strength is not as good as the fire resistance prediction, but compressive strength classification reached up to 99% accuracy for some models.

1. Introduction

It is estimated that between 600 and 800 million tons of coal fly and bottom ash are produced annually worldwide, of which between 500 and 600 million are fly ashes and the rest bottom ashes [1].
The resource utilization percentage and applications of coal fly ashes varies widely among nations. Clearly, the use ratio of coal fly ashes has approached 100% in certain nations, whilst it remains low in many others. In the European Union and Japan, coal fly ash (FA) is virtually completely utilized; in America, China and India, the usage ratios of fly ashes are 60%, 70%, and 67%, correspondingly; in Australia the recycling ratio is only 44% [2].
In the European Union and China, the majority of fly ash is employed to make concrete and cement [3]; in Australia and the United States, fly ash is mainly employed for mine restoring [4], soil improvement [5] and construction material production [6]; and in India and Japan, fly ash is mainly employed to make construction products and soil improvers [5].
However, the reuse of bottom ash (BA) is much less than fly ash because bottom ash is usually larger in size, porous and of more glassy origin, although its chemical composition is very similar to fly ash, and the current practice is to dump bottom ash in landfills. For example, in United States, a range of 10% to 15% are usefully recycled as a cement [7] or aggregate replacement [8], road base, snow and ice control, and structural fills [9].
Passive fire protection is a barrier that stops the progression of smoke, prevents the spread of flames, contains thermal effects and maintains the fire stability of structural elements for a specific time. A widely used technique for increasing the fire protection of a weak building product is by covering it with a fire-resistant material. Gypsum, calcium silicate, ceramic, rock, and glass wool are usually used [10]. Commercial gypsum is normally employed, although in other previous studies, different types of residual gypsum from other processes have been used in gypsum panels (from the flue gas desulphurization process [11], phospho-gypsum [12], titanium gypsum [13] or fluor-gypsum [14]. Sometimes, some additives are added, such as vermiculite [15] or perlite [16], in which water has a prominent presence, both in its free water form and chemically linked to some compounds that form it. In recent years, many kinds of waste have been incorporated into its dosage, including coal fly ash [17] and biomass fly ash [18], FeNi slag [19], ladle furnace slag [20], flue gas desulphurization gypsum [11], phospho-gypsum [21], municipal incineration ashes [22], waste from CO2 capture [23], titanium dioxide waste [24], seashell waste [25], eggshells [26] and recycled glass waste [27]. These studies found that some waste can be used in fire resistant materials as the major component (60 wt%) [17,18,22,25,28].
In recent years, applications of machine learning (ML) have become increasingly common across various fields such as chemical engineering, materials, and energy, among others [29]. The evolution of mathematical algorithms and the exponential increase in computational power have transformed ML into a powerful tool for modeling complex datasets (sometimes comprising dozens or even hundreds of variables), which would be difficult to represent using traditional methods, such as conservation equations or empirical models.
Machine learning is fundamentally ordered into three types of categories: supervised learning, unsupervised learning, and reinforcement learning [30]. The goal of supervised learning is to predict the values of a target variable by training models on labeled data. If the target variable is continuous, the problem is referred to as regression, while if it is categorical, it is referred to as classification [31]. In contrast, unsupervised learning does not require labeled data, with its main applications being clustering and data processing, such as principal component analysis (PCA) [32]. Finally, reinforcement learning focuses on learning through trial and error by interacting with an environment. A wide range of machine learning models exist for each of these learning paradigms, tailored to different situations and requirements.
One of the main advantages of supervised learning in experimental research is its ability to optimize the number of experimental trials, reducing the number of tests to be carried out, and thereby reducing the cost and time necessary for optimization. With pre-trained models, it is possible to identify the most relevant variables and predict their optimal values to achieve specific experimental objectives. This enables the design of an experimental plan with fewer trials compared to traditional methods. However, the use of ML techniques in research also faces certain challenges, primarily related to the need for a substantial volume of high-quality data to train the models effectively. Although techniques such as data augmentation can address the scarcity of data, the success of ML models in experimental applications remains contingent on having a robust dataset to ensure reliable performance [33,34].
The objective of this work is to analyze the incorporation of coal bottom ashes into construction materials, analyzing their physical, chemical, fire resistance and environmental characteristics, obtaining conclusions about its potential use as internal partitions for passive fire protection in buildings. In addition, a process for optimizing the dosage of bottom ash and the necessary thickness of each dosage is carried out using machine learning. To do this, simple input parameters (thickness and composition for fire resistance and density, water/solid ratio and composition for compressive strength) are used to reduce the experimentation required.

2. Materials and Methods

2.1. Materials

In this work, FA and BA from the co-combustion of coal (70%) and pet-coke (30%) in a power plant were investigated. The chemical compositions of the various materials in accordance with ASTM D3682-0112 [35] are shown in Table 1.
As indicated in Table 1, the sum of the percentages of Al2O3, SiO2 and Fe2O3 in the fly ash is 80.89%, suggesting that it may be classed as an F-type ash per ASTM C 618 [36]. The bottom ash has a low calcium concentration (<10%) and a total content (SiO2 + Al2O3 + Fe2O3) of 86.7%. Based on chemical equivalence, this bottom ash may fulfill ASTM C 618 [36] standards for an F-type ash. LOI is the loss on ignition; it is determined as the mass loss at 950 °C according to EN 196-2 [37]. The LOI of BA is lower than FA; according to EN 450-1 [38], the LOI for fly ashes used for concrete additions must be less than 5 wt%. Figure 1 depicts particle size distribution for bottom and fly ashes. FA presents a range of sizes between 0.5 and 112 μm and a D50 of 14 μm while BA presents a higher particle size distribution (between 5 and 1500 μm and a D50 of 1000 μm.
A commercial gypsum was used according to the EN 13279-1 standard (from AFIMOSA S.L. Company) [39].
Vermiculite is a flaky, hydrated silicate made up of aluminum, magnesium and iron. The current investigation made use of commercial vermiculite (VERLITE S.A.), and it presents 85% of particles smaller than 1.4 mm.
Polypropylene fibers measuring 3 cm long and 30 μm in diameter were utilized to improve mechanical resistance to bending and fissuring [40].
In this work, materials were created with a 60 wt% of ash substituted by bottom ash (20, 30 and 40 wt%). The amount of gypsum (30 wt%), vermiculite (9.5 wt%), and fibers (0.5 wt%), as well as the water/solid ratio (0.4), were held constant in all compositions with the goal of studying the change in ash for slag. Table 2 shows the final composition choices.
The solid components specified in Table 2 were put in a mixer and stirred for 4 min to obtain a homogeneous mixture. Water was then added to the mixture and stirred well until a homogeneous paste was produced. The resultant paste was placed in molds. After 24 h, the samples were removed from the molds and left to cure for a further 27 days at an ambient temperature (20 °C; 50% moisture).

2.2. Methods

2.2.1. Leaching Study

Leaching tests are ways of analyzing heavy metal discharge to determine its potential for mobilization into the environment. Because of their high toxicity, heavy metal pollutants can be transported by weathering and rainfall, even at low concentrations.
The leaching test was carried out in accordance with EN-12457-4 [41]. This test is designed for granular waste, with a one-stage batch test and a liquid–waste ratio of 10 L/kg (dry matter). The maximum particle size of the waste must be smaller than 10 mm.
European regulations EN-520 [42] establish that the materials used in the products must not emit any regulated substances at levels higher than the maximum permitted levels indicated in the corresponding European standard for the material, or those permitted by national regulations of the Member States for which it is intended. Many European countries possess maximum limits for the leaching of heavy metals in waste to be used as construction materials according to EN-12457-4 [41], but they set different limits for the exact same substances. In the Results Section, the leaching results are compared to the limits defined by various European countries and regions.

2.2.2. Physical Properties
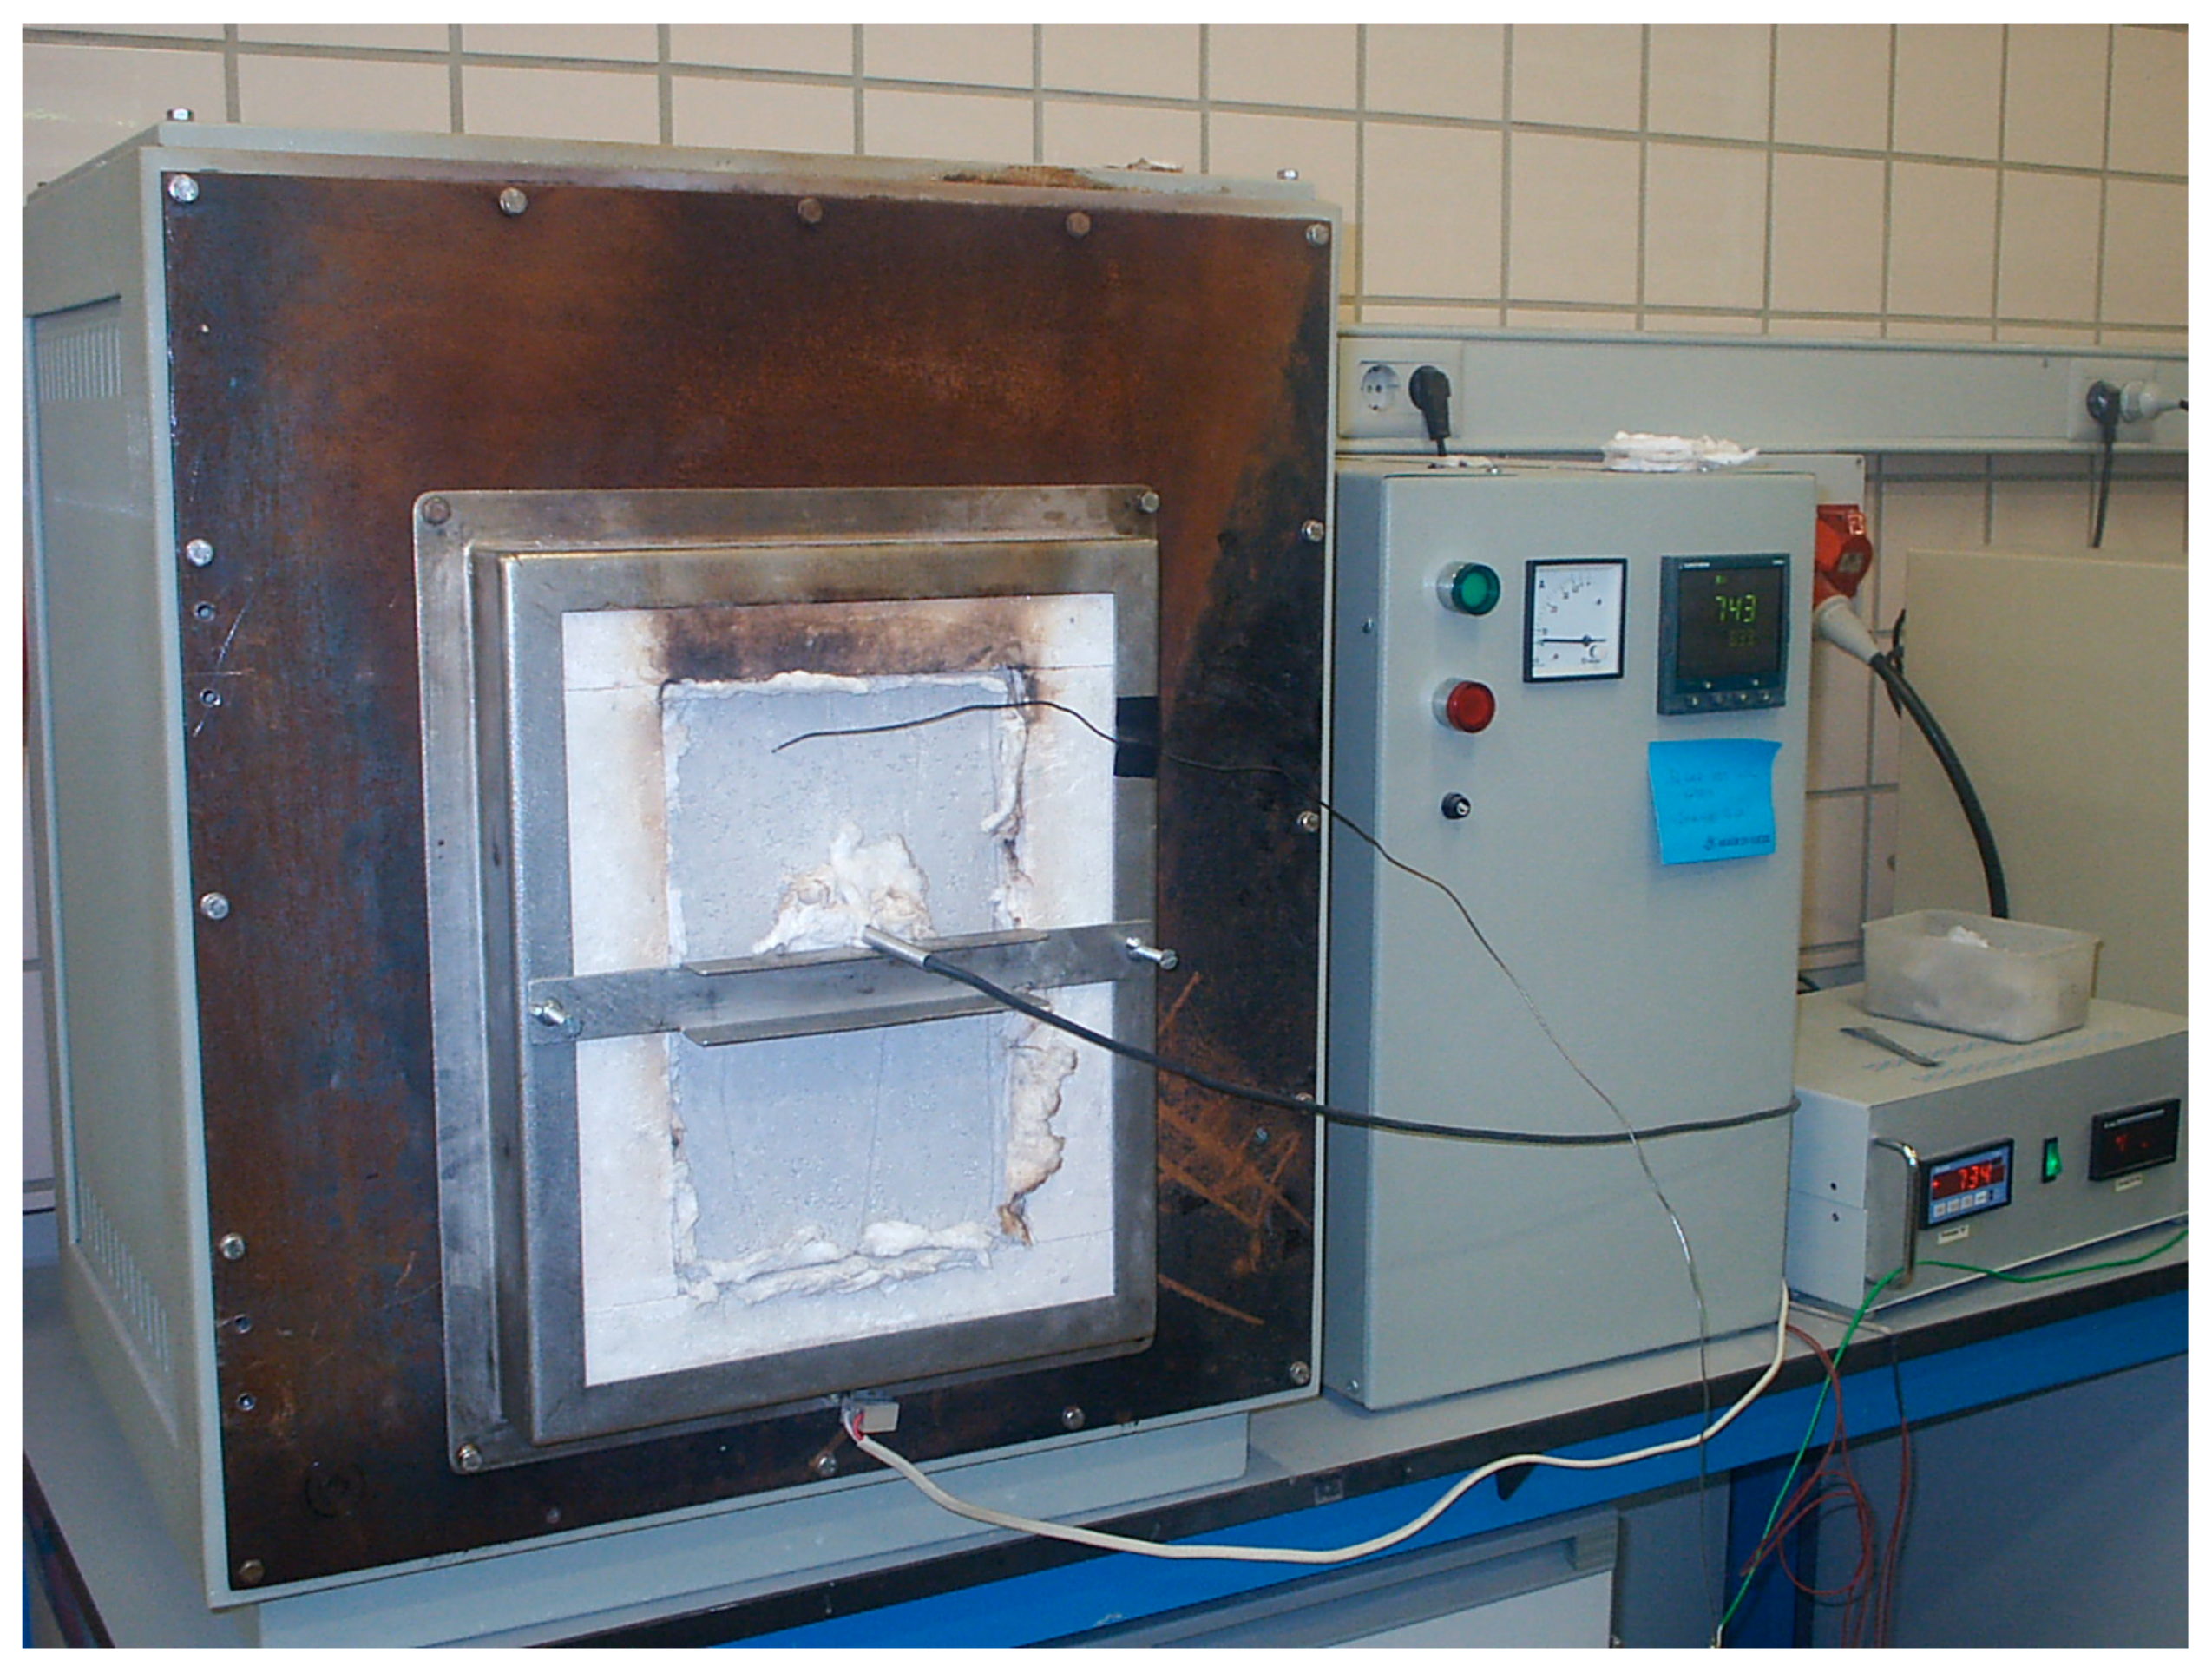
The bulk density (ρ) was evaluated using the volume and weight according UNE 102042:2023 [43], using 18 × 24 × 2 cm3 plates and a 0.01 g precision balance. Four samples were examined.
The pH was tested using European standards [42]. A 2 g sample was obtained and dissolved in 20 g of water. After 5 min, the solution’s pH was tested. Four samples were examined.
The humidity (H) was measured using European standards [42]. The mass was measured at ambient temperature (M1) and then dried at 60 °C until it reached a constant mass (M2). The humidity (H) was estimated as follows:
H = M 1 M 2 M 1 · 100
Water absorption capacity (A) and water content (Wc) were assessed using European standard [42]. Four samples were examined.
The volume expansions of hardened samples were determined using the Le Chatelier test according to EN 196-3 [44].

2.2.3. Fire Test

The European fire-resistance test is specified in EN 1363-1 [45], which is equivalent to other frequently utilized international standards, and was established after viewing and evaluating numerous fires. To replicate fire conditions, the standard requires that one of the surfaces of the material be subjected to heat according to a standard temperature curve established by T = 20 + 345·log10 (8t + 1), where “T” is the fire temperature in °C and “t” is the time in minutes from the commencement of the fire.
To investigate the fire resistance of the panels during a fire, the plate was placed on a vertical wall of a furnace which allowed the internal surface to be subjected to the standard temperature curve and to measure the temperature of the non-exposed face using a thermocouple within the furnace (see Figure 2). The temperature of the unexposed surface was measured using a Pt-100 thermocouple. All of the tested panels measure 2 cm in thickness, 28 cm high and 18 cm wide. The time required to reach 180 °C (t180) in the non-exposed surface is used as a reference for fire resistance.

2.2.4. Mechanical Properties

A Tinius-Olsen TO 317 machine was used to determine the flexural (Rf) and compressive (Rc) strengths according to European Standards [46]. Rf was measured on three samples (16 cm × 4 cm × 4 cm), as well as Rc on five samples (cubic samples of 4 cm).
The possible uses as panels that may be exposed to impact prompted us to investigate the material’s surface hardness [47]. The method is based on the resistance to penetration by a Shore C durometer. The test was repeated twice on each side of the panels prior to and following the fire test.
The impact resistance (RI) was tested according to [42]. It was determined as the diameter of the mark (mm) produced on the surface of a panel when it is subjected to a steel ball with a potential energy of 245 J.

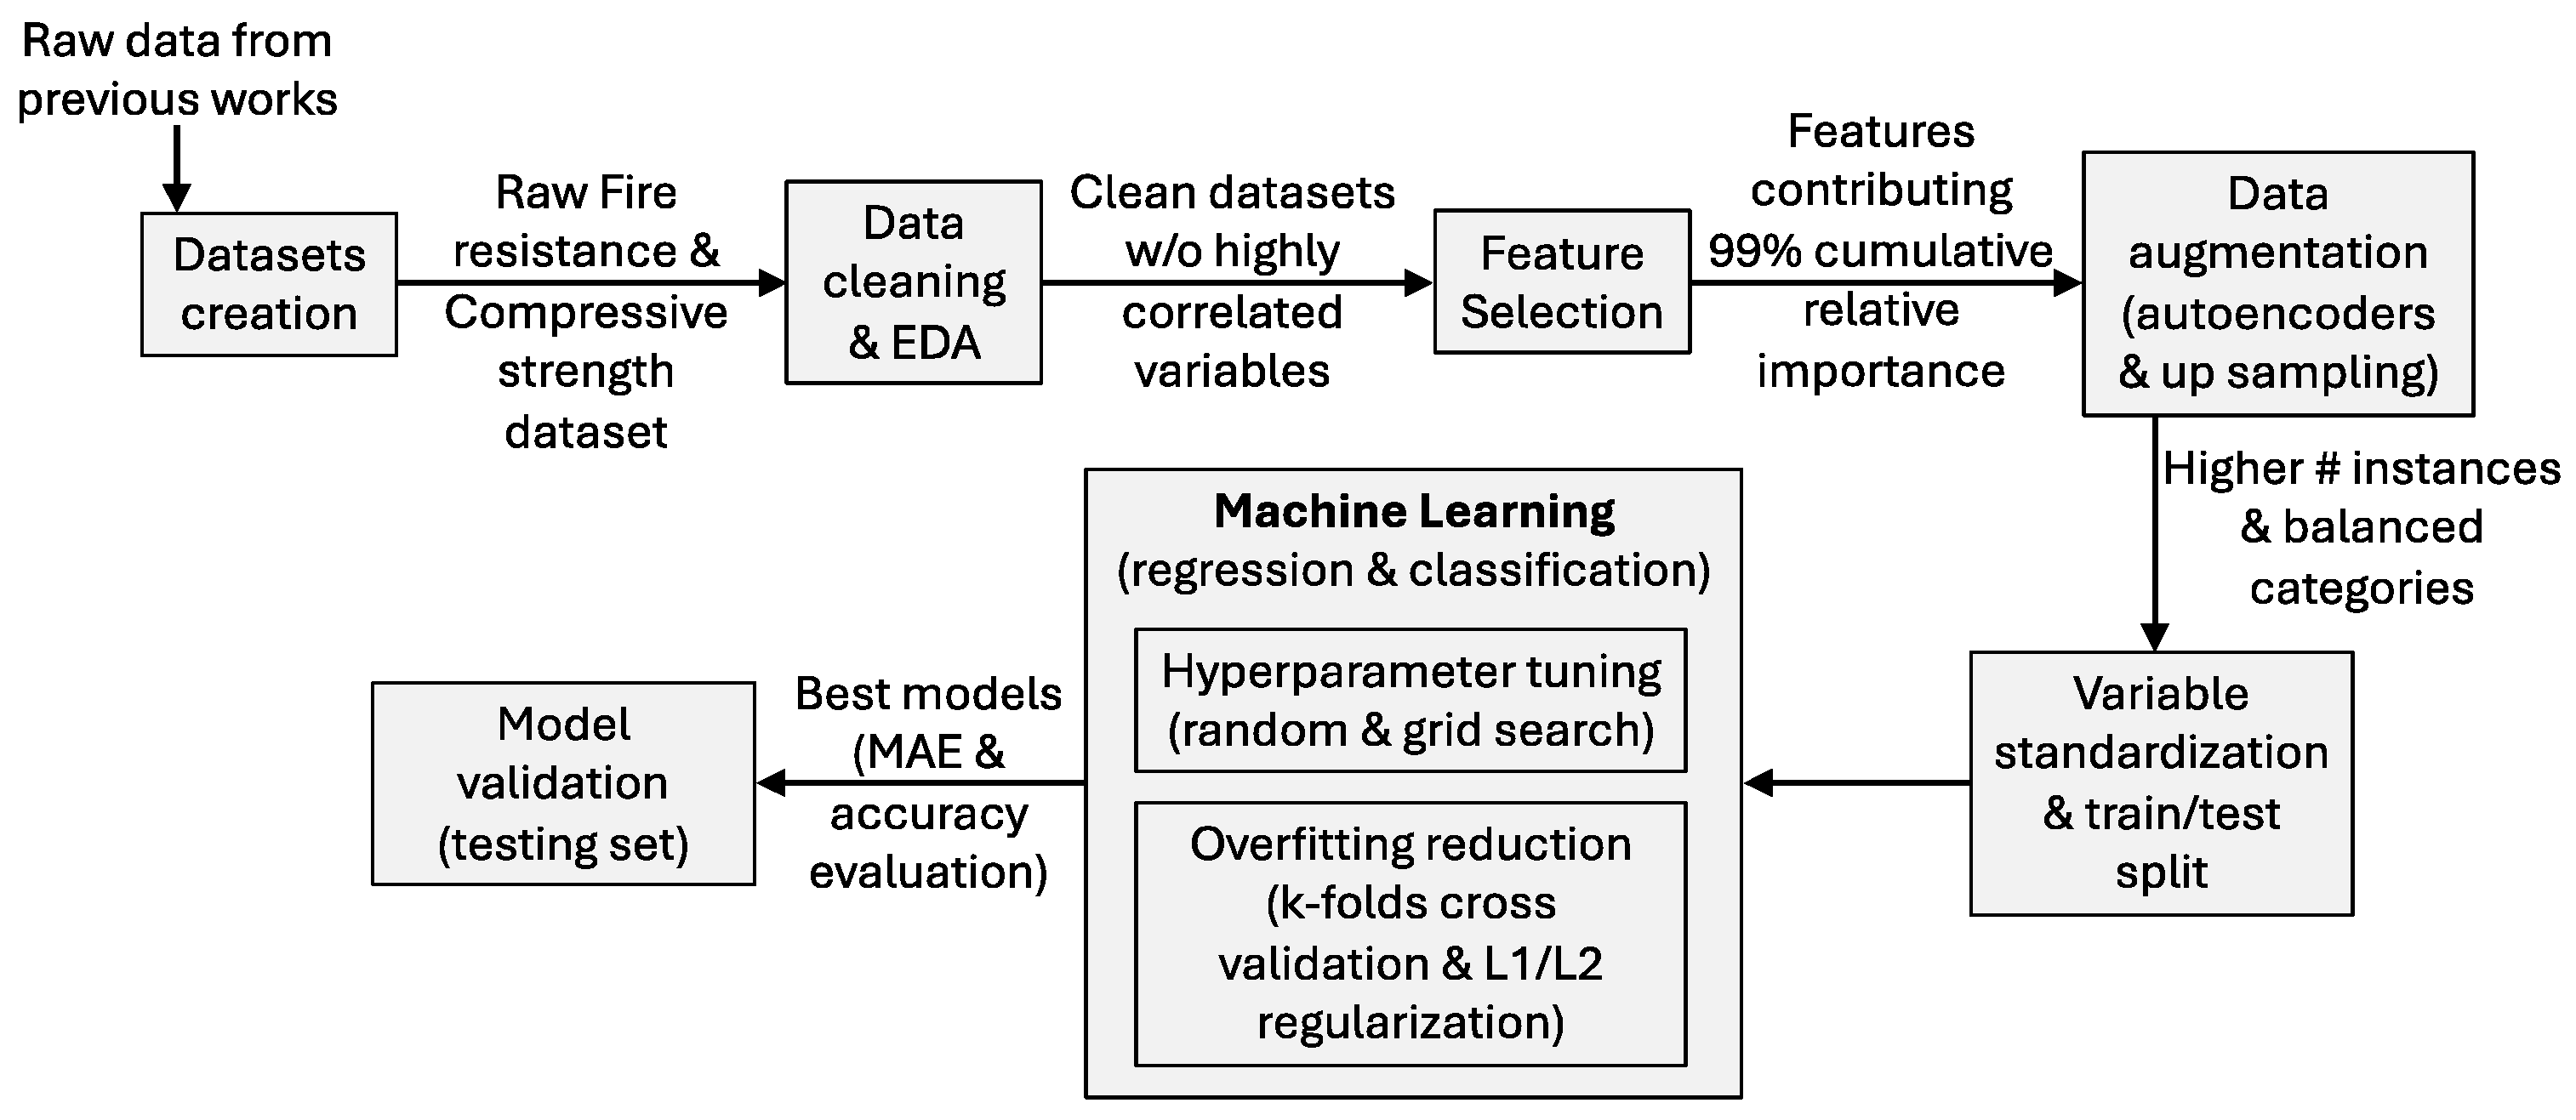
2.2.5. Machine Learning Method

Different ML models have been developed to compare their results with those obtained experimentally. The methodological approach was based on two types of supervised learning. On the one hand, regression models were used to predict the t180 value in fire resistance and to estimate the compressive strength (Rc) of materials.
According to EN 13501-1 [48], the fire resistance rating (FRR) is the time that guarantees (a) stability or bearing capacity, (b) absence of emission of flammable gases on the side not exposed to fire, (c) tightness against the passage of flames or hot gases and (d) sufficient thermal resistance to prevent temperatures higher than those established in the aforementioned EN from occurring on the unexposed side (180 °C). It is indicated by the number in minutes (15, 30, 60, 90, 120, 180 and 240), but rounded to the nearest lower number in that series. The classification models were developed to determine the fire resistance rating. The compressive strength must be higher than 1 MPa according to the European Standard EN 13279-1 [39], but in this work, the compressive strength of materials has been classified into the following categories: low (0–1 MPa), medium (1–5 MPa), high (5–10 MPa), and very high (>10 MPa).
The development of the models was carried out using Python and its most common libraries, such as Pandas, Scikit-learn, and Matplotlib, among others. Supplementary Materials provides a link to the generated datasets and the various Jupyter Notebooks used for data processing and model training. The following sections detail the stages involved in the creation and use of these models. Figure 3 shows a logic diagram which summarizes the ML procedure and its results.
-
Creation of datasets
Two datasets were created: one to evaluate fire resistance and another to assess compressive strength. To avoid excessive self-citation of articles, it is recommended to search using “Fire Resistance” and “Leiva” as keywords in any scientific search engine, for example, Scopus or Google Scholar. The fire resistance dataset was derived from previous experimental tests and includes t180 (target variable, in min), thickness (in cm), and the composition (wt%) of the panel, considering materials such as gypsum, vermiculite, bottom ash, and fly ash. A total of 26 different compounds were considered, resulting in a dataset with 28 features (columns) and 30 instances (rows). Compressive strength dataset was derived from previous studies. Variables included compressive strength (Rc, in MPa, as the target variable), water/solid ratio (weight), bulk density (in kg/m3), and 20 potential compounds (wt%). This dataset comprised 23 features and 93 instances.
-
Data cleaning and exploratory data analysis
Data cleaning and exploratory data analysis (EDA) were performed on the datasets. Duplicate values were removed, and missing values were completed by filling empty cells with zeros. EDA enabled the identification of outliers, which were excluded to prevent their negative impact on model performance. Additionally, collinearity among variables was analyzed, and highly correlated variables were removed.
-
Feature selection
Techniques such as LightGBM 4.5.0, XG boost 2.1.1, recursive feature elimination with cross-validation (RFECV, included in Scikit-learn 1.0.1), random forest (included in Scikit-learn 1.0.1), and Boruta 0.4.3 were employed to analyze the relative importance of each variable concerning the target variables in regression and classification tasks. Features were ranked based on their relevance, and those contributing to 99% of cumulative relative importance were selected. Features beyond this threshold were excluded before model training.
-
Data augmentation
In addition to the original datasets, data augmentation techniques were applied to supplement the available data. For the regression models predicting fire resistance (t180), autoencoders were used, increasing the number of instances to a total of 133. For the classification models (FRR and compressive strength), upsampling techniques were applied to balance categories and increase the number of instances [49].
-
Machine learning algorithms
Since the datasets did not include categorical variables after feature selection, only standardization of independent variables was required. Each dataset was split into training (70–75%) and testing (25–30%) sets. The algorithms used for regression tasks included multivariable linear regression, ridge regression, lasso regression, k-nearest neighbors, decision trees, random forest, gradient boosting, XG boost, and artificial neural networks (multilayer perceptron, MLP).
For classification tasks, the applied algorithms were: multivariable logistic regression, ridge regression, k-nearest neighbors, decision trees, random forest, gradient boosting, XG boost, and artificial neural networks (MLP).
The evaluation metric for selecting the best regression models was the mean absolute error (MAE), while accuracy was used for selecting the best classification models.
-
Overfitting reduction and hyperparameter tuning
To mitigate overfitting, 10-fold cross-validation and L1/L2 regularization techniques were applied in compatible algorithms. Hyperparameter tuning was conducted in two stages: first, using a broad search via random search and then fine-tuning with grid search [50]. The Scikit-learn libraries for random search (RandomizedSearchCV) and grid search (GridSearchCV) allow cross-validation (k-folds) without the need for additional libraries, enabling the selection of the number of folds. Table 3 and Table 4 summarize the tuned hyperparameters, the search ranges, and other relevant parameters.
-
Model validation
The validation of the trained models was performed by comparing the test set results (actual label values) with the predicted values obtained when applying the independent variables of the test dataset to the different models. For regression models, a scatter plot (predicted vs. actual) was generated, and the coefficient of determination (r2) was calculated. For classification models, accuracy was evaluated on the test set, and a confusion matrix was generated to compare actual vs. predicted values.

3. Results

3.1. Leaching Behaviour

Table 5 presents the results of the EN-12457-4 [41] leaching test of bottom and fly ash. As can be seen, the FA can be classified as non-hazardous waste since the concentration of Mo is higher than the limit for inert waste but lower than that for non-hazardous waste according to the European Landfill Directive (EULFD) [51]. In contrast, BA can be classified as inert waste. Although they come from the same plant and at the same time, the differences in this compound are due to the fact that molybdenum is generally released as oxides during combustion and tends to condense into finer particles (FA in this case) when the combustion gases cool down [52].
There is no harmonized test method for the use of waste in the building sector. However, the most widely used ones are EN-12457-2 [53] and EN-12457-4 [41]. The only difference between both tests is the particle size of the waste, smaller than 10 mm in EN-12457-4 [41] or smaller than 4 mm in EN-12457-2 [53]. Each region or country has set requirements on the heavy metals they want to manage, their limitations, and the specific building applications in which waste can be employed [54].
Table 5 shows the heavy metal content, leaching limits, and applications of waste according to EN-12457-4 [41], as established in the regulations of Italy [55], Lithuania [56], Catalonia (Spain) [57]; additionally, Portuguese legislation [58] allows the use of waste in civil engineering if it is classified as inert. According to the results, FA can be used in these countries but FA cannot be used in Italy, Portugal and Lithuania due to its Mo content.

3.2. Physical Properties

Table 6 shows that the bulk decreases with the increase in bottom ash content. It is due to the lower specific gravity and the higher particle size of BA. According to previous works [22], when the particle sizes are bigger (BA presents a D50 70 times greater than FA, according to Figure 1), it results in higher inter-particle porosity (higher than 11 μm [59], while a lower specific gravity of the particles (BA presents a 15% lower specific gravity than FA, according to Table 1) produces a high internal porosity (with a pore size lower than 1 μm) [60].
All the different compositions present densities lower than 1100 Kg/m3, and according to EN 12859 [61], all of them can be classified as medium bulk density panels (800–1100 kg/m3). Free water content and the water absorption are inversely proportional to the bulk density, because a higher porosity allows a greater amount of water in the pores and also allows a greater entry of water. EN 12859 [61] establishes that free water content cannot have an average free content greater than 6% and that no individual value will exceed 8%, which is only satisfied by B-0. According to EN 520 [42], the materials could be classified as H3 (with water absorption capacity ≤ 25%), but none as H2 (≤10%). The water absorption of the materials is increased when the BA is increased, due to the larger particle size of BA.
pH does not change significantly when replacing BA with FA, due to their similar chemical nature (Table 1). EN 12859 [61] specifies that a normal pH panel will be considered if it is in the range between 6.5 and 10.5, which is satisfied by all compositions. Volume stability is very low in all the cases, lower than the 10 mm that the regulations present as a limit [38].

3.3. Fire Insulating Capacity

Figure 4 show the fire insulating capacity. As the free water is higher when the dosage of the BA is also high, this water is evaporated at temperatures around 60 °C [17], increasing the time to reach the evaporation plateau. The evaporation plateau is a phenomenon that can be observed in Figure 3, where the temperature on the side not exposed to the fire remains constant for a long period of time, this temperature stays unchanged due to the evaporation of the chemically bound water, which is mainly due to the endothermic dehydration of gypsum (CaSO4·2H2O → CaSO4 + 2H2O). This process absorbs the energy transferred by the fire, so maintaining an unchanged temperature on the non-exposed surface. Because all samples contain the same amount of gypsum, the chemically bound water is similar in all the different compositions, and therefore, their evaporation plateau durations are equal [20]. Above the evaporation plateau, as the bulk density decreases, a decrease in fire resistance is produced. It is because a lower bulk density produces an increase in the thermal diffusivity of the material (=k/ρ·cp, where k is the thermal conductivity, ρ is the bulk density and cp is the heat capacity), which is inversely proportional to the slope of the temperature–time curve [40]. The time it takes to reach 180 °C on the unexposed side (t180) (a 10% decrease when the material has 40% BA).
During all the tests, all the materials prevented the passage of fire and did not emit hot gases on the side not exposed to the fire.

3.4. Mechanical Properties

The mechanical characteristics are displayed in Table 7. The mechanical characteristics were measured before and after the fire test.
The strength diminished when the FA was replaced by BA; this is because by increasing the amount of BA, the bulk density decreases, which causes an increase in porosity, decreasing its mechanical properties. Furthermore, the contribution of the fiber had a positive effect on the flexural strength; it doubled the resistance with respect to the same composition without fiber [40]. EN 13279-1 standard [39] establishes 1 MPa as the minimum compressive strength, and therefore, all compositions except B-40 satisfy this requirement. The flexural strength for all the materials except B-40 are beyond 0.6 MPa, the minimum prescribed by standard [61] for medium bulk density products, and is comparable to other materials that employ waste in similar proportions [18].
After the fire, there was a considerable fall in strength due to the mass loss occurred during the fire, which increased the porosity. The loss of mass was fundamentally due to the loss of water (humidity and chemically bound), the melting of the polypropylene fibers at 165 °C [62], and the decomposition of some carbonates present in the gypsum [23]. As the loss on ignition (LOI) of BA is lower than FA (Table 1), when BA is added, the mass loss during the fire test is diminished, and therefore the increase in porosity after fire is lower, so the percentage of decrease in Rc after fire is lower when the BA content is higher (a diminution of 58% for B-0 and a 31% for B-40).
The surface hardness is a little lower than that obtained for other gypsum plates when exposed to the same tests, with values that vary between 45 and 70 Shore C units [20]. EN 12859 [61] dictates that the surface hardness for medium bulk density materials must be greater than 55 Shore C, which was only satisfied by B-0 and B-20. After the thermal test, the exposed side’s surface hardness decreased significantly, but the unexposed side’s reduction was less dramatic in all the cases.
Finally, the RI before the fire was smaller than 15 mm except B-40, which allows the materials to be classified as “high impact” and, therefore, they are considered class I according to the EN standard. 520 [42]. None is considered “very high impact” since none is less than 13 mm.

4. Machine Learning Modelling Results

4.1. Feature Selection

4.1.1. Fire Resistance Feature

Figure 5 shows the relative importance of each variable on the target variable (blue bars), as well as the cumulative importance for a set of variables (red line), for both the regression case (Figure 5a) and the classification case (Figure 5b). Variables with zero importance are not included in Figure 4. In both cases, thickness is the most important variable, accounting for nearly 50% of the importance in regression and about 25% in classification, followed by the presence of hydromag (a commercial compound with six molecules of water chemically bound). This is because the duration of the evaporation plateau, the principal process in fire resistance, is proportional to the thickness cubed and to the chemically bound water in the matrix [11,17,22,40]. In the case of regression, a large number of variables are required to reach a high cumulative importance, whereas in classification, fewer variables are needed.

4.1.2. Compression Strength Feature

Figure 6 is equivalent to Figure 5, but in this case, it represents compressive strength. In Rc regression, the most important parameter is the water/solid ratio, while in compressive strength classification, bulk density is the dominant factor. This is because the compressive strength is inversely proportional to the porosity, and porosity is always inversely proportional to bulk density, and a higher water/solid ratio in the mix produces a greater water excess for hardening, this water being evaporated during the curing period of the material, producing an increase in porosity [17,18,28,40]. In any case, more than 80% of the cumulative importance is attributed to the combination of these two factors and the amount of gypsum (the percentage of commercial binder is the third key parameter) [20].

4.2. Regression Model Fitting

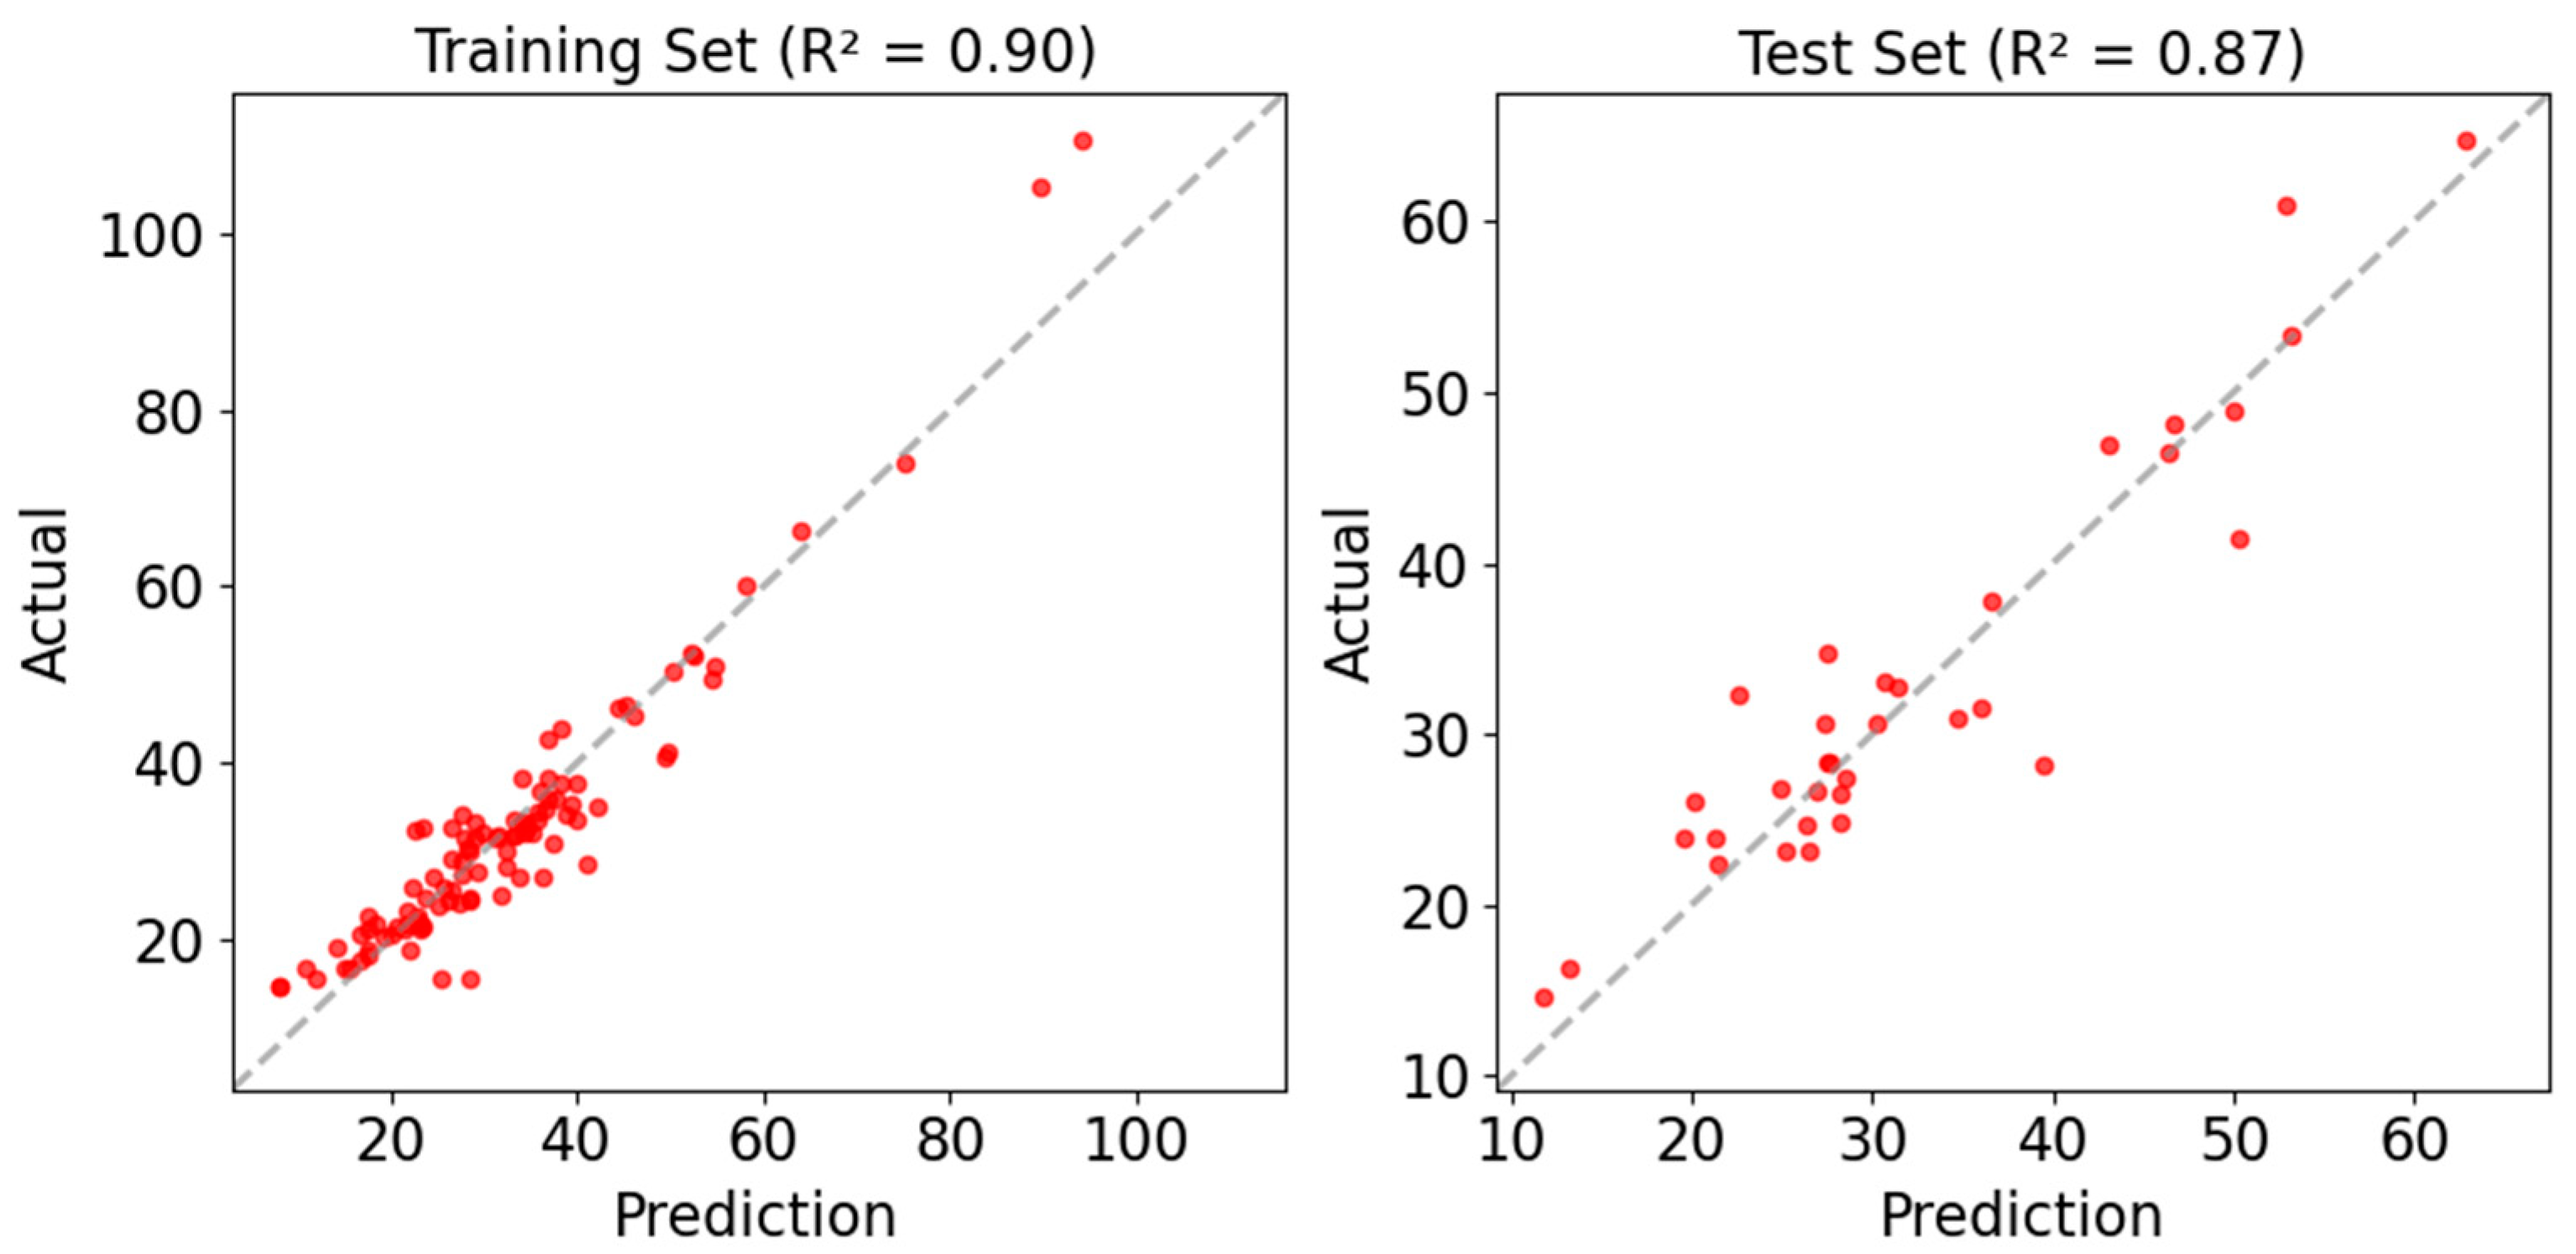
4.2.1. Fire Resistance Fitting

Due to the small size of the original dataset (30 rows and 25 columns after feature selection), it was not possible to achieve sufficiently satisfactory results (r2 < 0.4) after training the models. This limitation necessitated the use of a dataset augmented through variational autoencoders. The different trained models achieved an average r2 score (calculated from multiple training runs with different training and test set partitions) on the test set ranging from about 0.60 (decision tree) to 0.87 (random forest, Figure 7). These results can be considered reasonably good. Table 8 shows the t180 predicted values for samples B-0, B-20, B-30, and B-40 using the same model, where the maximum prediction error (absolute value) is observed to be 11%.

4.2.2. Compressive Strength Fitting

Since a larger number of instances were available in the compressive strength dataset, it was not necessary to use data augmentation techniques for the regression models. The different trained models achieved an average r2 score for predicting Rc (before fire) on the test set ranging from 0.63 (gradient boosting) to 0.79 (XGBoost). However, the results of the latter showed high overfitting, which is why the artificial neural network prediction is considered slightly better (Figure 8). In any case, the results of the regression model for predicting Rc are worse than those developed for predicting t180, and if they were to be improved, additional experimental variables should be included. Although the training results are acceptable, Table 9 shows that the predictions for samples B-0, B-20, B-30, and B-40 are quite poor (underestimating the actual value), likely due to the model being trained to work with a significantly larger variety of material components than those present in the samples of this study. This is because, according to previous studies [17,40], the compressive strength is fundamentally proportional to the amount of binder (gypsum) and the porosity of the matrix, for which it is necessary to carry out mercury porosimetry that analyzes in detail the distribution of pores in the matrix, or indirectly the porosity is inversely proportional to the granulometric distribution of the components.

4.3. Classification Model Fitting

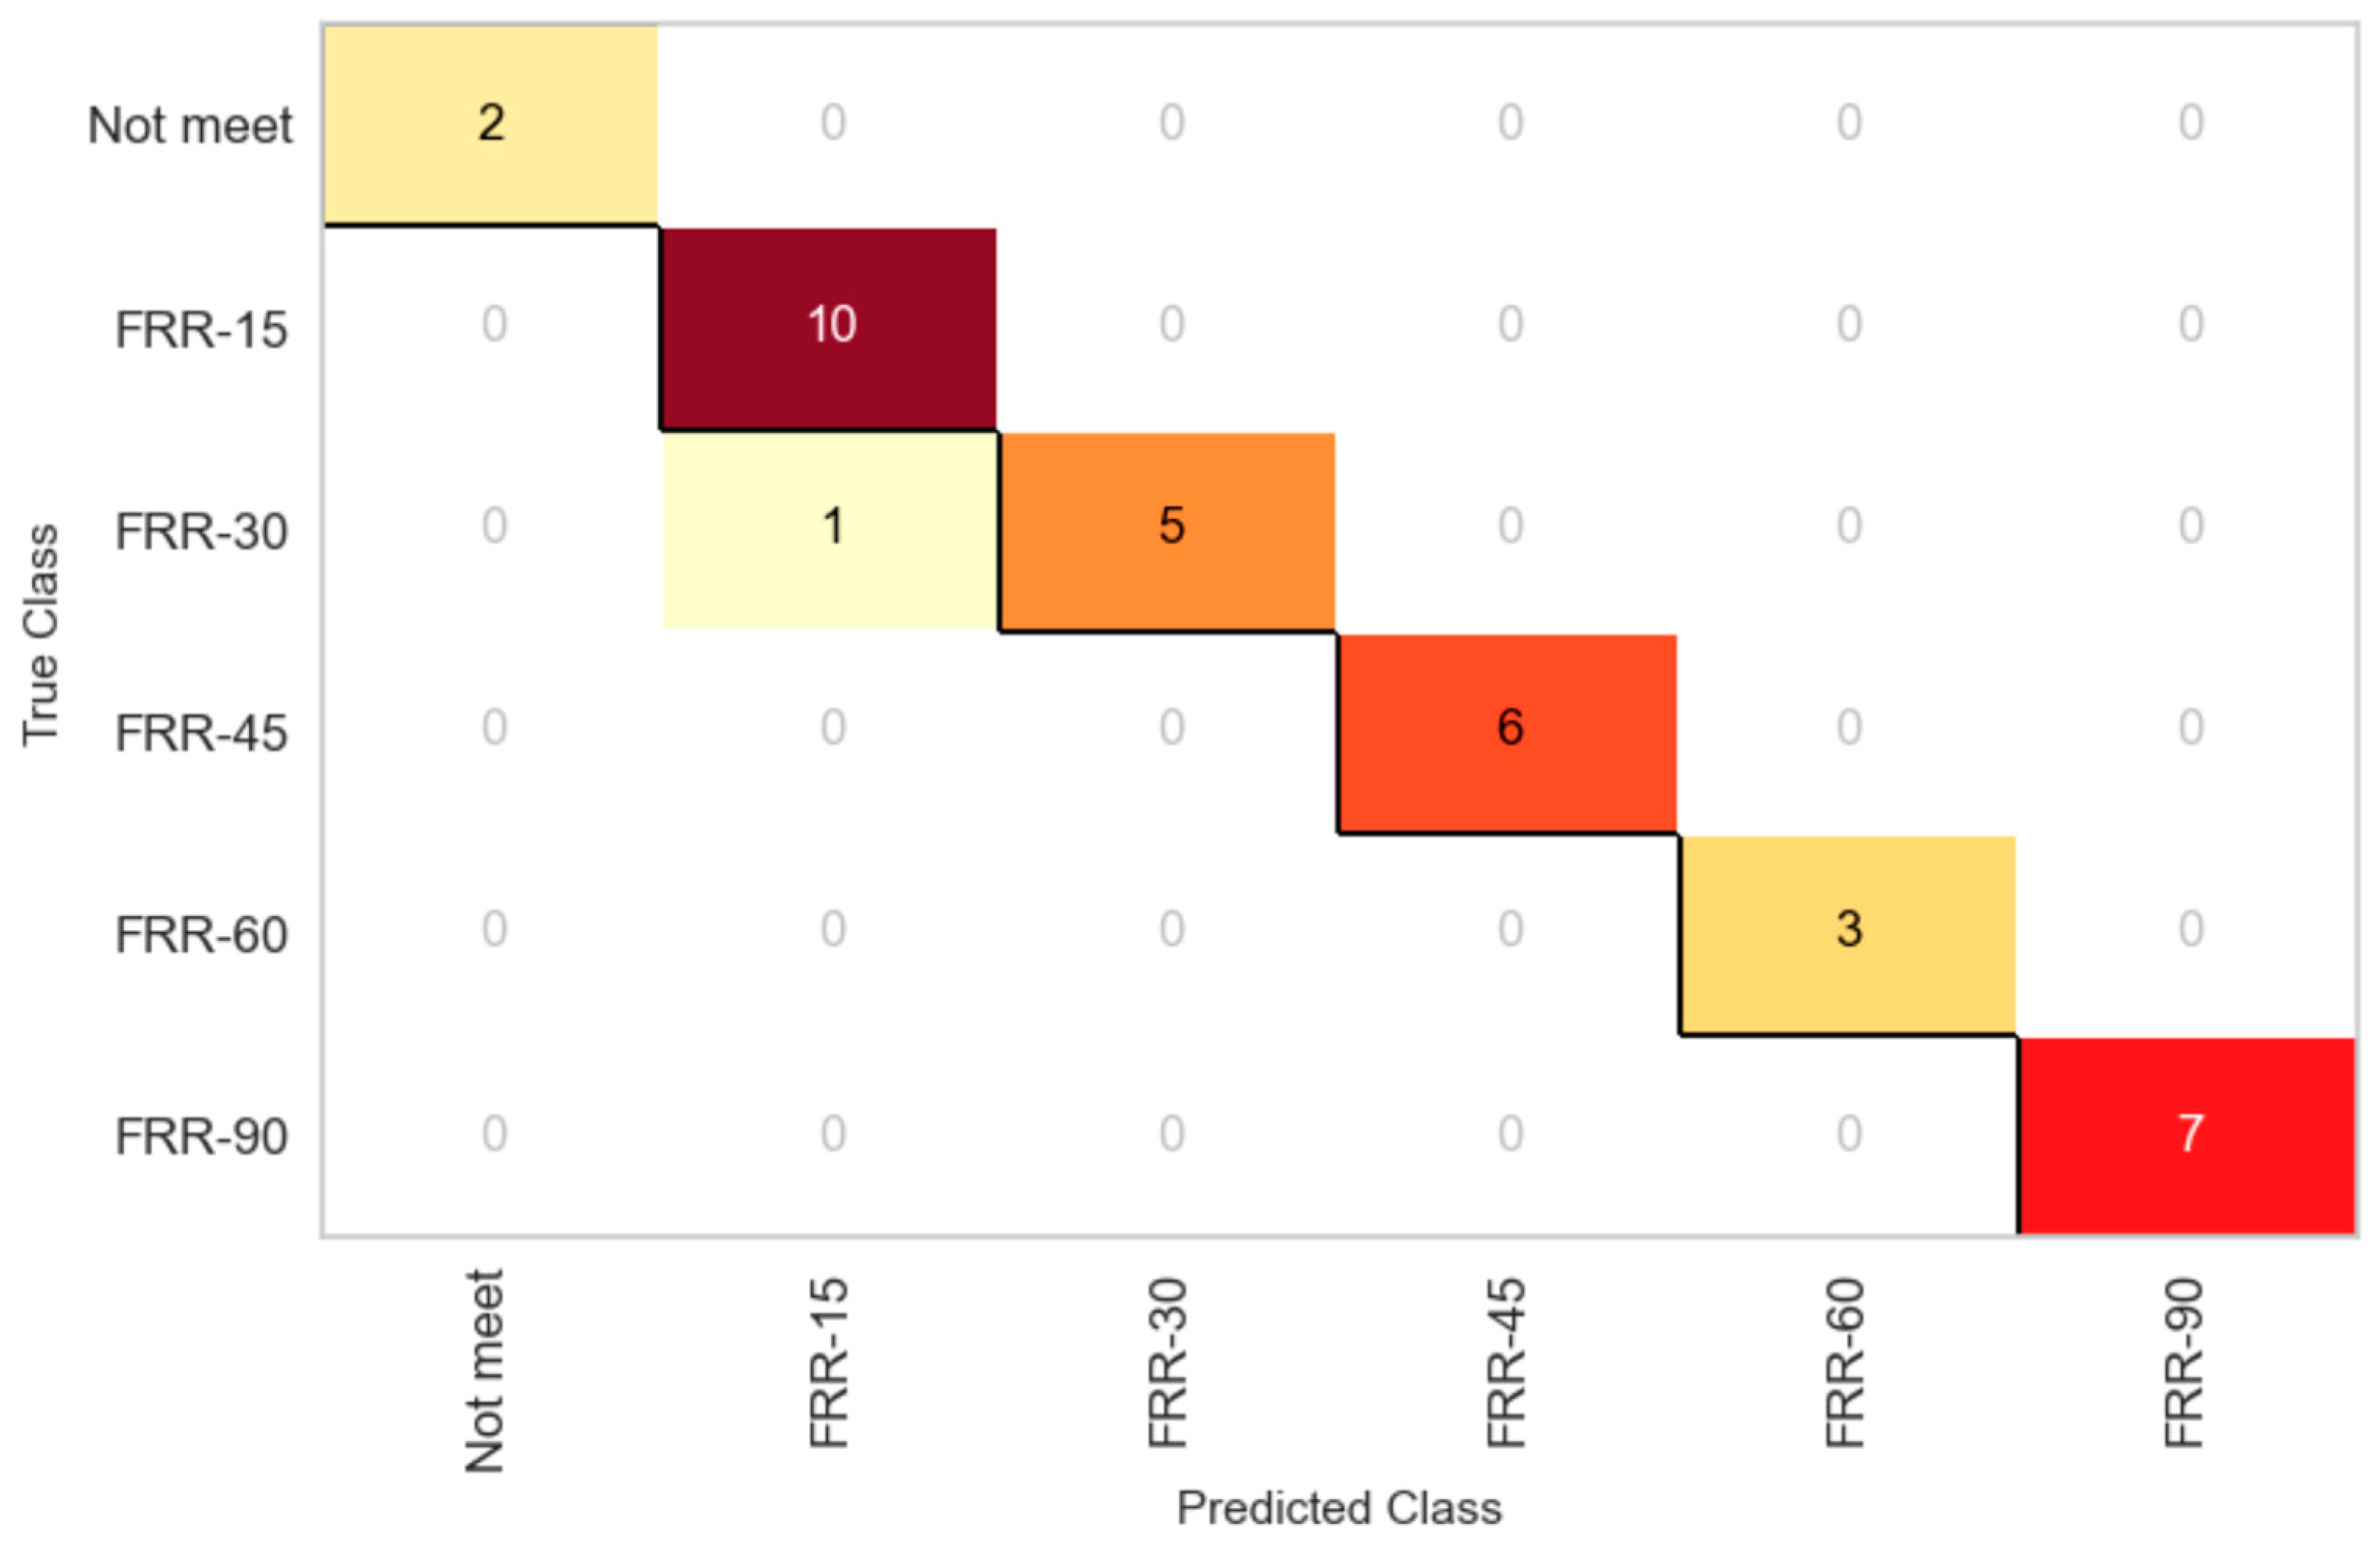
4.3.1. Fire Resistance Rating

When evaluating the fire resistance of a material, it is often more relevant to determine its fire resistance rating (FRR) rather than the t180 value itself. Of the eight trained algorithms, all achieved an average accuracy of 97% on the test set, except for the k-nearest neighbors classifier (91%) and ridge classifier (82%). This accuracy could be improved, since in addition to the thickness, the enthalpy of the evaporation of water chemically linked to the different components of the material seems to be, according to previous studies [11,20,22,40], a very important factor in fire resistance, but to determine it, it is necessary to carry out calorimetry of all the components of each material, which makes their classification more complex. Figure 9 shows, as an example, the confusion matrix for the random forest-based classification model on the test set, where it can be observed that only one value corresponding to the FRR-30 class was misclassified as FRR-15. The remaining 33 cases were classified correctly. Samples B-0 to B-40 (with FRR-15) were correctly classified by all models with an accuracy of 97%.

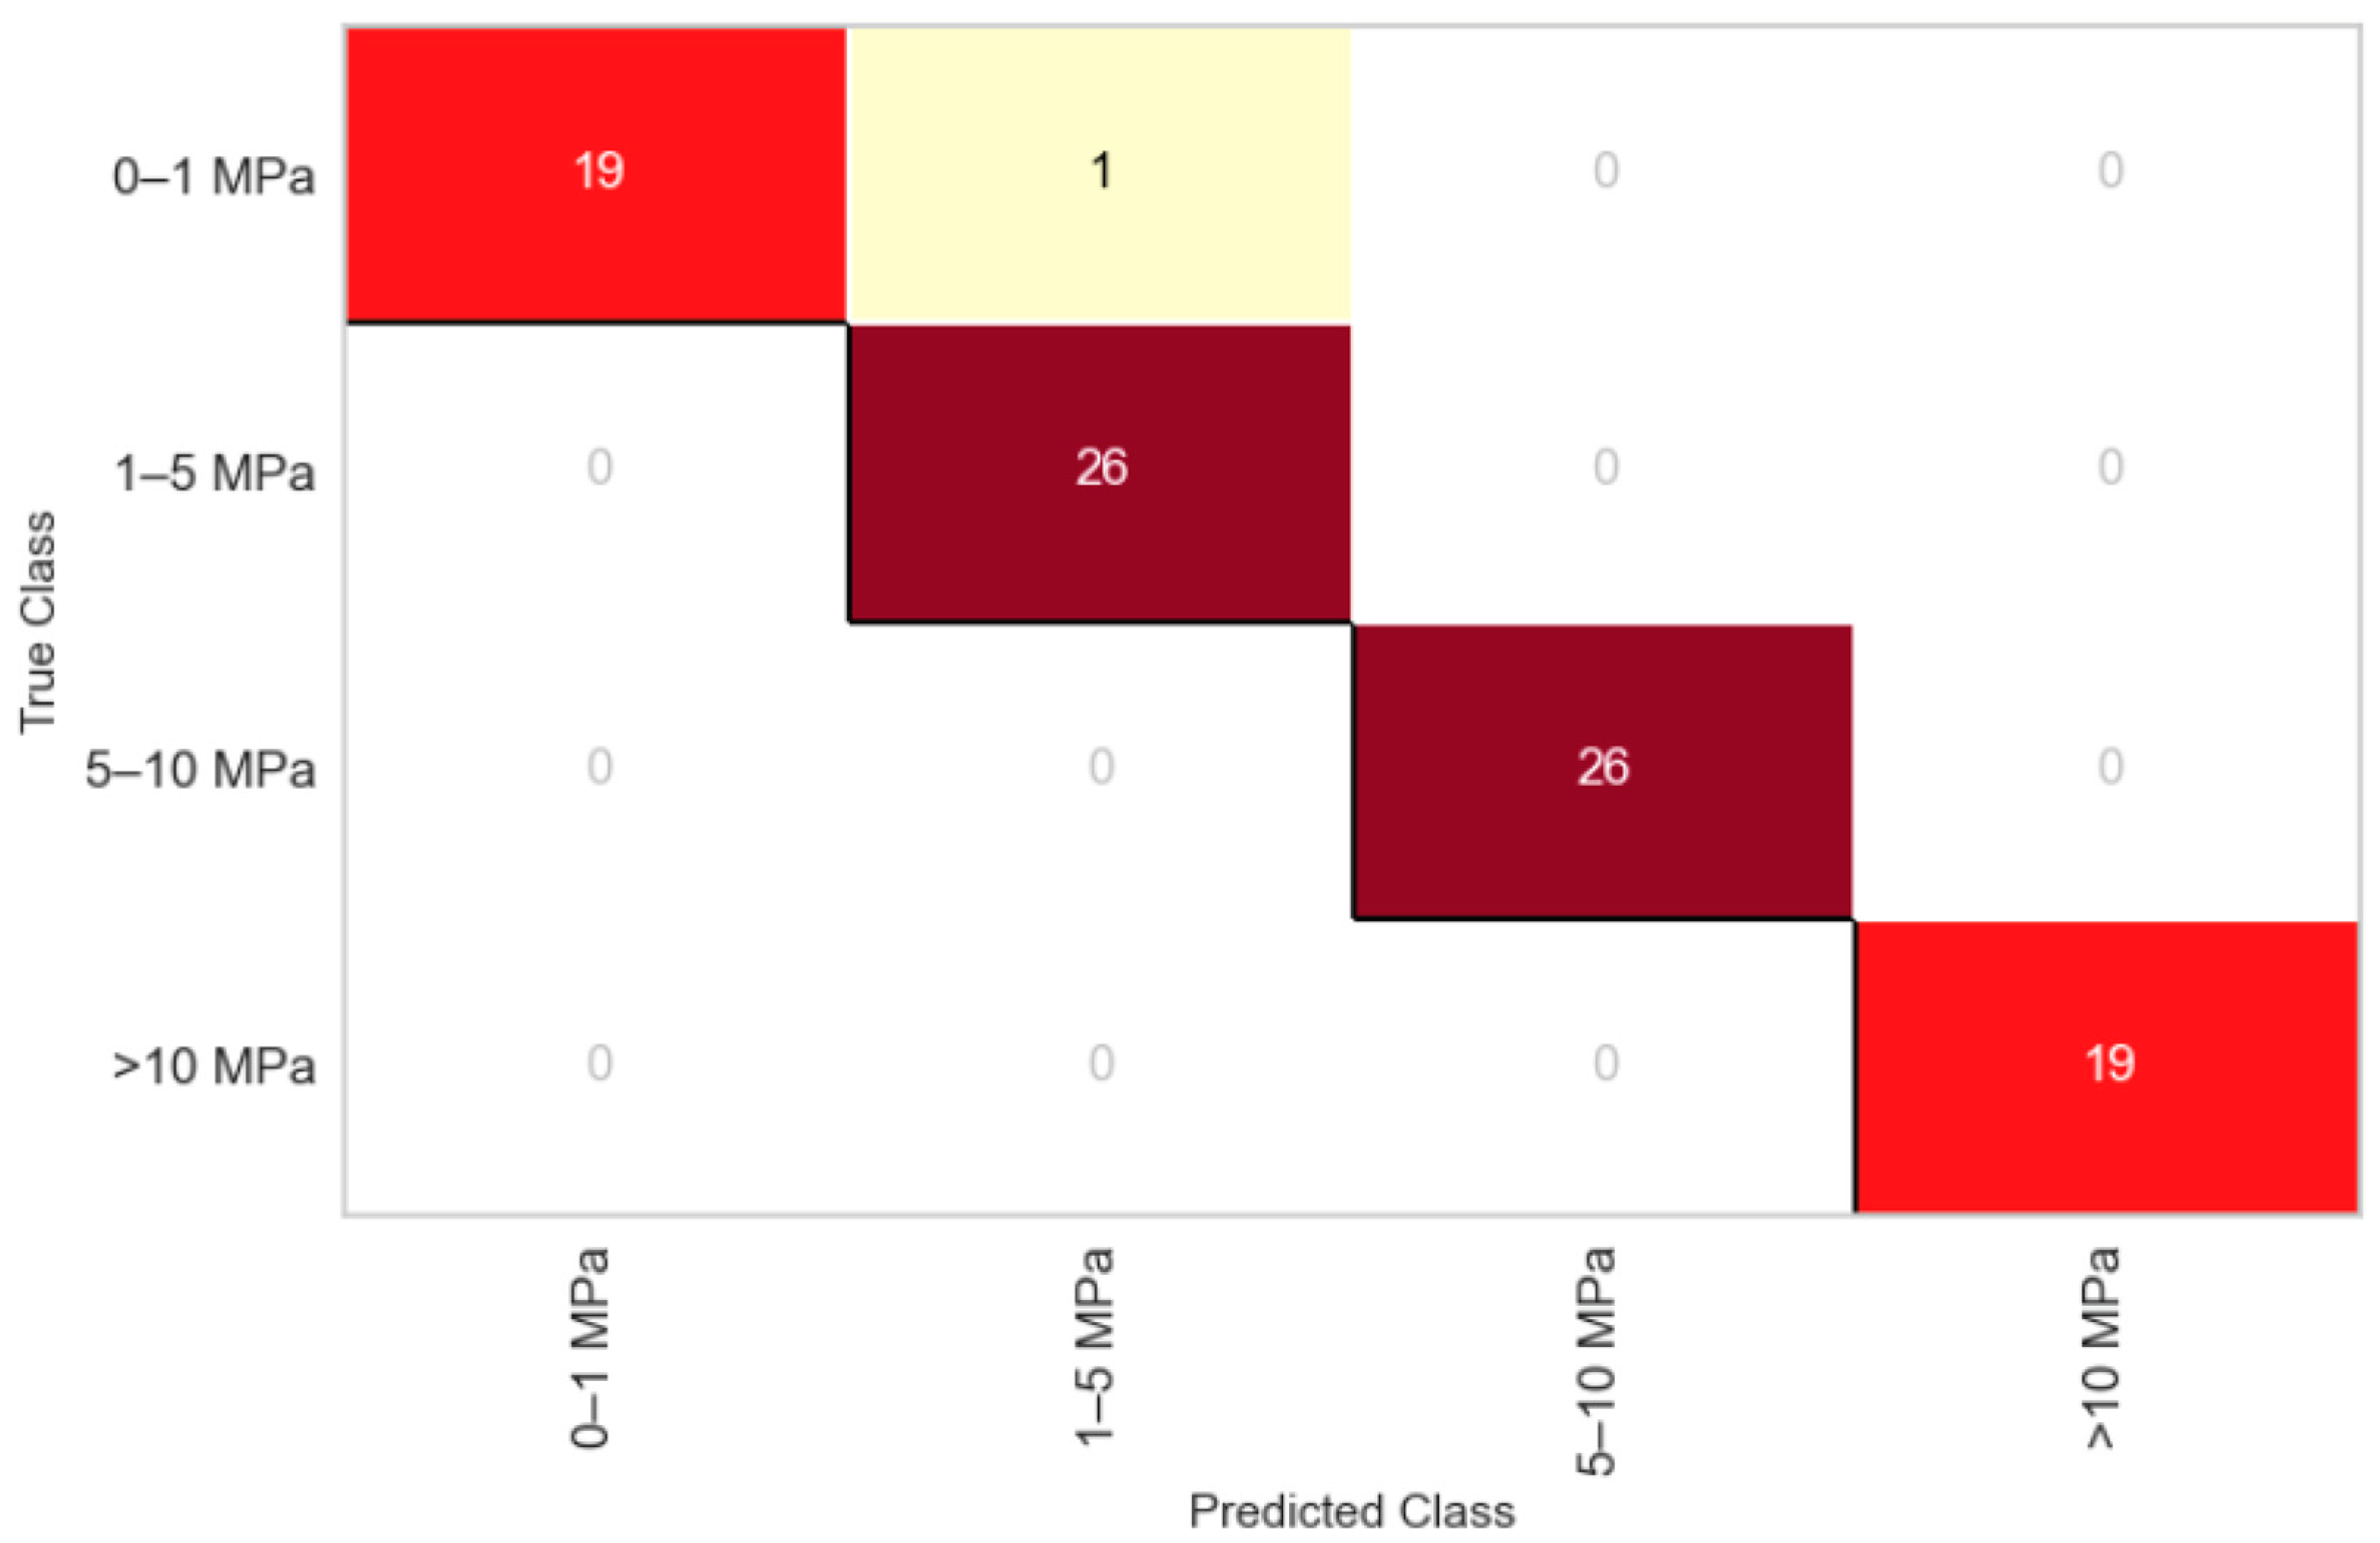
4.3.2. Compressive Strength Rating

It is possible to proceed similarly to the FRR case to predict the compressive strength range. As with regression models, compressive strength is more challenging to predict than fire resistance, resulting in an average test set accuracy ranging from 77% (logistic regression) to 99% (decision tree). So, the compressive strength can be accurately estimated with the parameters selected. As shown in Figure 10, the confusion matrix for the decision tree classifier performs very well in predicting the compressive strength values. For samples B-0 to B-30, the prediction is correct since their actual values clearly fall within the 1–5 MPa range. However, sample B-40 lies very close to the boundary between classes (1 MPa), causing the classifier to behave inconsistently.

4.4. Model Application

The models developed in Section 4.2 and Section 4.3 can be useful not only for predicting the values of the t180 or Rc variables (or the classes to which they belong in the classification problem), thereby reducing the need for experimental testing, but they can also have additional applications. For example, the use of the classification model for FRR can allow the calculation of the required thickness for each plate to reach a specific category, given a certain composition. Figure 11 shows the categories corresponding to each of the samples B-0 to B-40 based on their thickness, ranging from “Does not comply” to FRR-90 (the only classes the model has been trained on).
As seen in Figure 11, for thickness values below 2 cm, the expected FRR is FRR-15. At a thickness of 2.5 cm, the expected FRR is FRR-30 for all samples, increasing to FRR-60 with a thickness of 3.5 cm. FRR-90 would be achieved at around 3.75 cm for all samples except B-40, which would require a thickness of 4 cm. In any case, the results shown in Figure 10 should be interpreted with caution, as they may have higher uncertainty due to the model being used slightly outside the range of values it was trained on.

5. Conclusions

The main conclusions of this work are:
-
The use of BA does not present any leaching problems, FA presents a moderate leaching content of Mo, which could invalidate its use in some European countries, due to the wide variety of different limits established in these countries, even using the same test in all of them.
-
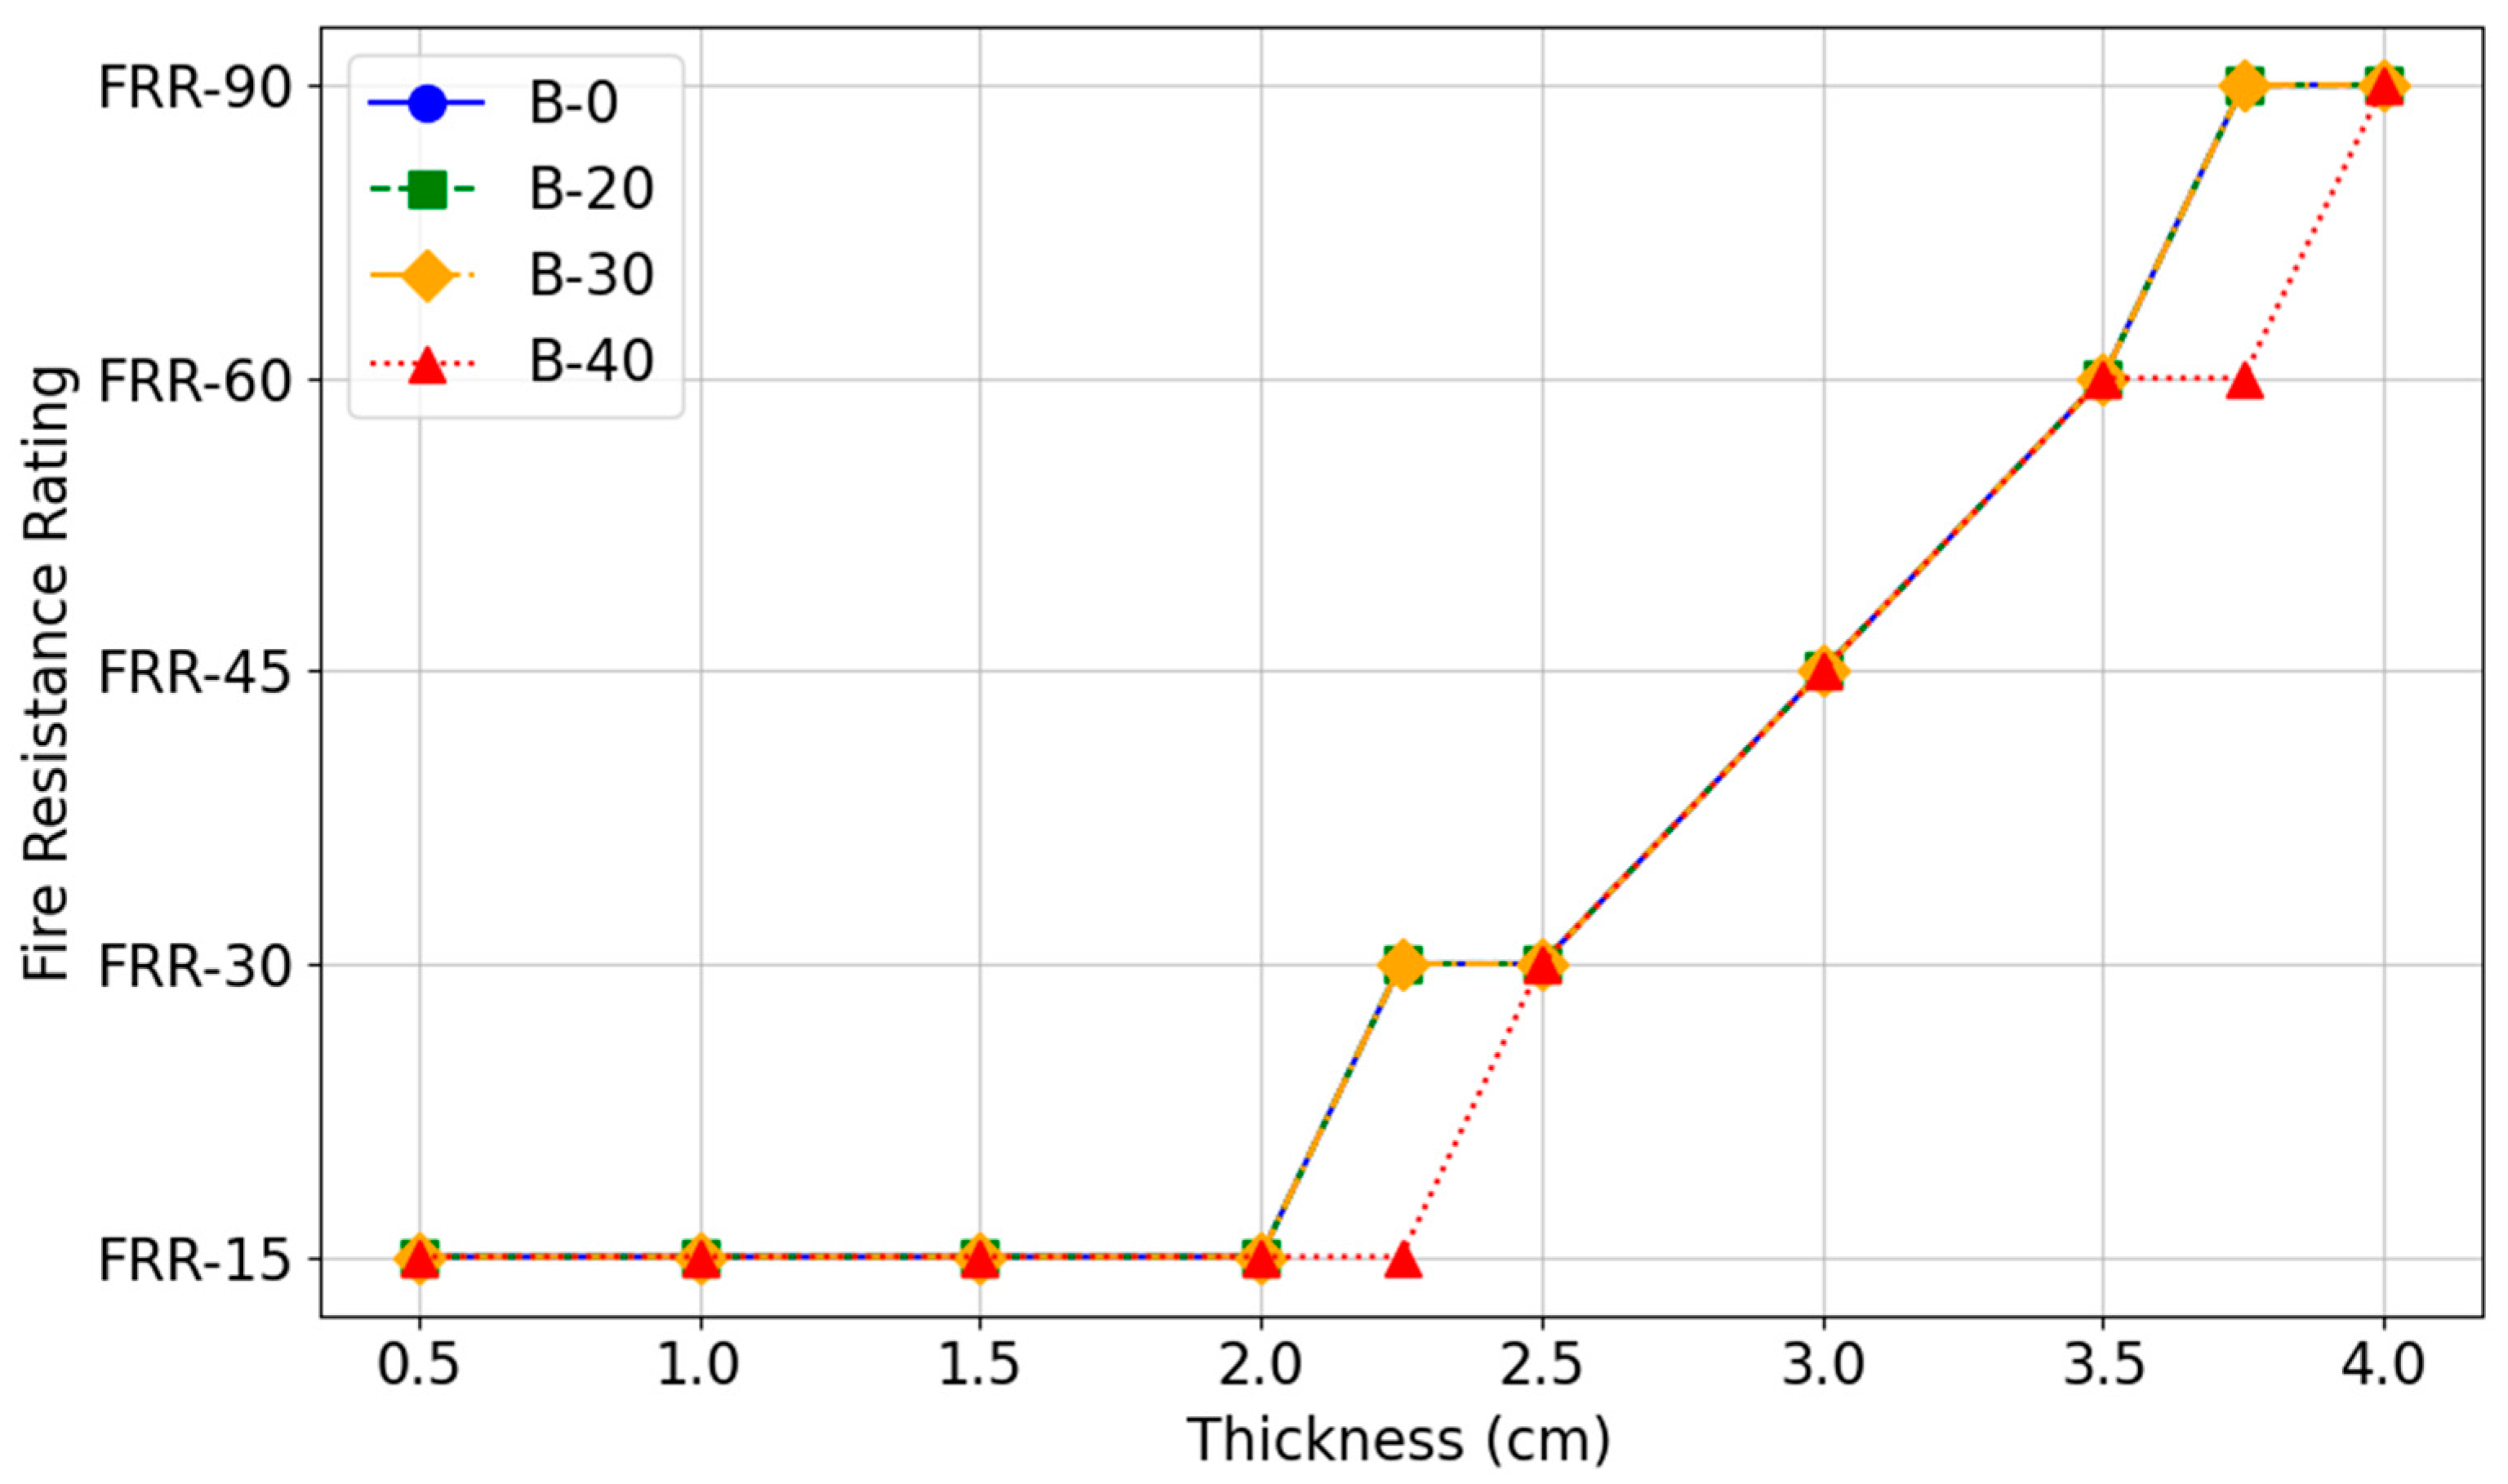
The addition of BA reduces the bulk density due to higher particle size of the BA, slightly decreasing the fire resistance of the panel, mainly due to the decrease in the slope, especially after the evaporation plateau. This significantly decreased the compressive strength, although the flexural strength did not decrease excessively due to the action of the polypropylene fibers in all compositions.
-
The regression models for fire resistance (t180) reached r2 up to about 0.85. The classification results for the fire resistance rating (FRR) showed high accuracy (96%) so the use of machine learning seems a good option to optimize the design of a material (using simple parameters: composition and thickness), reducing time and costs of the trials.
-
The prediction of compressive strength is not as good as t180, which may indicate that more input parameters are necessary (granulometry or porosity, chemical composition of some key components in the hardening of the materials). However, compressive strength classification performs well for some models, like decision tree, reaching up to 99% accuracy using simple parameters.
-
These models can be useful not only for predicting the values of the t180 or Rc variables (or the classes to which they belong in the classification problem), thereby reducing the need for experimental testing.

Supplementary Materials

The following supporting information, including the code used for data preprocessing, feature engineering, model development, and analysis in this study, can be downloaded at https://github.com/mcampoyn/Process-MDPI-Recycling-of-fly-and-bottom-ashes (accessed on 20 March 2025).

Author Contributions

Conceptualization, M.C. and C.L.; methodology, M.C. and C.L.; software, E.G. and M.C.; validation, J.D.R.M., E.G. and M.C.; formal analysis, E.G. and J.D.R.M.; investigation; resources, C.L.; writing—original draft preparation, E.G., M.C. and C.L.; writing—review and editing, E.G. and J.D.R.M.; supervision, C.L. and M.C.; project administration, C.L. All authors have read and agreed to the published version of the manuscript.

Funding

This research was funded by Ministerio de Ciencia e Innovación of Spain, grant number PID2023-147971OB-C32.

Data Availability Statement

The original contributions presented in the study are included in the article/Supplementary Material; further inquiries can be directed to the corresponding author.

Conflicts of Interest

The authors declare no conflict of interest.

References

  1. Sharma, V.; Dash, S.; Gupta, P. Comprehensive Review of Fly Ash: Environmental Impact and Applications. Environ. Qual. Manag. 2024, 34, e22338. [Google Scholar] [CrossRef]
  2. Lu, X.; Liu, B.; Zhang, Q.; Wen, Q.; Wang, S.; Xiao, K.; Zhang, S. Recycling of Coal Fly Ash in Building Materials: A Review. Minerals 2023, 13, 25. [Google Scholar] [CrossRef]
  3. Vilakazi, A.Q.; Ndlovu, S.; Chipise, L.; Shemi, A. The Recycling of Coal Fly Ash: A Review on Sustainable Developments and Economic Considerations. Sustainability 2022, 14, 1958. [Google Scholar] [CrossRef]
  4. Li, M.; Zhang, J.; Li, A.; Zhou, N. Reutilisation of Coal Gangue and Fly Ash as Underground Backfill Materials for Surface Subsidence Control. J. Clean. Prod. 2020, 254, 120113. [Google Scholar] [CrossRef]
  5. Shaheen, S.M.; Hooda, P.S.; Tsadilas, C.D. Opportunities and Challenges in the Use of Coal Fly Ash for Soil Improvements—A Review. J. Environ. Manag. 2014, 145, 249–267. [Google Scholar] [CrossRef]
  6. Luna, Y.; Arenas, C.G.; Cornejo, A.; Leiva, C.; Vilches, L.F.; Fernández-Pereira, C. Recycling By-Products from Coal-Fired Power Stations into Different Construction Materials. Int. J. Energy Environ. Eng. 2014, 5, 387–397. [Google Scholar] [CrossRef]
  7. Chindasiriphan, P.; Meenyut, B.; Orasutthikul, S.; Jongvivatsakul, P.; Tangchirapat, W. Influences of High-Volume Coal Bottom Ash as Cement and Fine Aggregate Replacements on Strength and Heat Evolution of Eco-Friendly High-Strength Concrete. J. Build. Eng. 2023, 65, 105791. [Google Scholar] [CrossRef]
  8. Ali, T.; Buller, A.S.; Abro, F.u.R.; Ahmed, Z.; Shabbir, S.; Lashari, A.R.; Hussain, G. Investigation on Mechanical and Durability Properties of Concrete Mixed with Silica Fume as Cementitious Material and Coal Bottom Ash as Fine Aggregate Replacement Material. Buildings 2022, 12, 44. [Google Scholar] [CrossRef]
  9. Mohammed, S.A.; Koting, S.; Katman, H.Y.B.; Babalghaith, A.M.; Abdul Patah, M.F.; Ibrahim, M.R.; Karim, M.R. A Review of the Utilization of Coal Bottom Ash (CBA) in the Construction Industry. Sustainability 2021, 13, 8031. [Google Scholar] [CrossRef]
  10. Caetano, H.; Laím, L.; Santiago, A.; Durães, L.; Shahbazian, A. Development of Passive Fire Protection Mortars. Appl. Sci. 2022, 12, 2093. [Google Scholar] [CrossRef]
  11. Li, J.; Zhuang, X.; Leiva, C.; Cornejo, A.; Font, O.; Querol, X.; Moeno, N.; Arenas, C.; Fernández-Pereira, C. Potential Utilization of FGD Gypsum and Fly Ash from a Chinese Power Plant for Manufacturing Fire-Resistant Panels. Constr. Build. Mater. 2015, 95, 910–921. [Google Scholar] [CrossRef]
  12. Zheng, S.; Chen, M.; Liu, T.; Yang, G.; Jiang, G.; Gu, H. Research on Compressive Strength and Thermal Conductivity of Lightweight Phosphogypsum-Based Composite Cementitious Materials. Constr. Build. Mater. 2024, 436, 136955. [Google Scholar] [CrossRef]
  13. Du, J.; Tian, L.; Qi, M.; Zhang, C.; Di, H.; Zhi, X.; Zhu, J. Revealing Maleic Acid Role in the Preparation of α-Hemihydrate Gypsum from Titanium Gypsum through Experiments and DFT Calculations. Sci. Total Environ. 2023, 897, 166405. [Google Scholar] [CrossRef] [PubMed]
  14. Huang, X.; Shi, Z.; Wang, Z.; Dong, J.; Wang, X.; Zhao, X. Microstructure and Performances of Sludge Soil Stabilized by Fluorogypsum-Based Cementitious Binder. Constr. Build. Mater. 2022, 325, 126702. [Google Scholar] [CrossRef]
  15. Rashad, A.M. Vermiculite as a Construction Material—A Short Guide for Civil Engineer. Constr. Build. Mater. 2016, 125, 53–62. [Google Scholar] [CrossRef]
  16. Singh, M.; Garg, M. Perlite-Based Building Materials—A Review of Current Applications. Constr. Build. Mater. 1991, 5, 75–81. [Google Scholar] [CrossRef]
  17. Leiva, C.; Vilches, L.F.; Vale, J.; Fernández-Pereira, C. Influence of the Type of Ash on the Fire Resistance Characteristics of Ash-Enriched Mortars. Fuel 2005, 84, 1433–1439. [Google Scholar] [CrossRef]
  18. Leiva, C.; Gómez-Barea, A.; Vilches, L.F.; Ollero, P.; Vale, J.; Fernández-Pereira, C. Use of Biomass Gasification Fly Ash in Lightweight Plasterboard. Energy Fuels 2007, 21, 361–367. [Google Scholar] [CrossRef]
  19. Sakkas, K.; Nomikos, P.; Sofianos, A.; Panias, D. Utilisation of FeNi-Slag for the Production of Inorganic Polymeric Materials for Construction or for Passive Fire Protection. Waste Biomass Valorization 2014, 5, 403–410. [Google Scholar] [CrossRef]
  20. Peceño, B.; Pérez-Soriano, E.M.; Luna-Galiano, Y.; Leiva, C. The Incorporation of Ladle Furnace Slag in Fire Insulating Gypsum-Based Materials. Fire 2023, 6, 416. [Google Scholar] [CrossRef]
  21. Guedri, A.; Abdallah, F.; Mefteh, N.; Hamdi, N.; Baeza-Urrea, O.; Wagner, J.-F.; Zagrarni, M.F. Addition of Phosphogypsum to Fire-Resistant Plaster Panels: A Physic–Mechanical Investigation. Inorganics 2023, 11, 35. [Google Scholar] [CrossRef]
  22. Peceño, B.; Luna-Galiano, Y.; Varela, F.; Alonso-Fariñas, B.; Leiva, C. Study of a Fire-Resistant Plate Containing Fly Ashes Generated from Municipal Waste Incinerator: Fire and Mechanical Characteristics and Environmental Life Cycle Assessment. Materials 2024, 17, 1813. [Google Scholar] [CrossRef] [PubMed]
  23. Ruiz-Martinez, J.D.; Moreno, V.; González-Arias, J.; Peceño Capilla, B.; Baena-Moreno, F.M.; Leiva, C. A Circular Economy Perspective: Recycling Wastes through the CO2 Capture Process in Gypsum Products. Fire Resistance, Mechanical Properties, and Life Cycle Analysis. Fire 2024, 7, 365. [Google Scholar] [CrossRef]
  24. Salazar, P.A.; Fernández, C.L.; Luna-Galiano, Y.; Sánchez, R.V.; Fernández-Pereira, C. Physical, Mechanical and Radiological Characteristics of a Fly Ash Geopolymer Incorporating Titanium Dioxide Waste as Passive Fire Insulating Material in Steel Structures. Materials 2022, 15, 8493. [Google Scholar] [CrossRef]
  25. Peceño, B.; Alonso-Fariñas, B.; Vilches, L.F.; Leiva, C. Study of Seashell Waste Recycling in Fireproofing Material: Technical, Environmental, and Economic Assessment. Sci. Total Environ. 2021, 790, 148102. [Google Scholar] [CrossRef]
  26. Ma, D.-X.; Yin, G.-Z.; Ye, W.; Jiang, Y.; Wang, N.; Wang, D.-Y. Exploiting Waste towards More Sustainable Flame-Retardant Solutions for Polymers: A Review. Materials 2024, 17, 2266. [Google Scholar] [CrossRef] [PubMed]
  27. Valanides, M.; Aivaliotis, K.; Oikonomopoulou, K.; Fikardos, A.; Savva, P.; Sakkas, K.; Nicolaides, D. Geopolymerization of Recycled Glass Waste: A Sustainable Solution for a Lightweight and Fire-Resistant Material. Recycling 2024, 9, 16. [Google Scholar] [CrossRef]
  28. Vilches, L.F.; Leiva, C.; Olivares, J.; Vale, J.; Fernández, C. Coal Fly Ash-Containing Sprayed Mortar for Passive Fire Protection of Steel Sections. Mater. Construcción 2005, 55, 25. [Google Scholar] [CrossRef]
  29. Rane, N.L.; Mallick, S.K.; Kaya, O.; Rane, J. Applications of Deep Learning in Healthcare, Finance, Agriculture, Retail, Energy, Manufacturing, and Transportation: A Review. In Applied Machine Learning and Deep Learning: Architectures and Techniques; Deep Science Publishing: Fresno, CA, USA, 2024; pp. 132–152. [Google Scholar] [CrossRef]
  30. Ranjana, R.; Rao, B.N.K.; Raja, J.; Challa, N.P.; Madhavi, K.R. Machine Learning and Computer Vision—Beyond Modeling, Training, and Algorithms. In Explainable Artificial Intelligence (XAI); The Institution of Engineering and Technology: Perth, Australia, 2024; pp. 293–307. [Google Scholar] [CrossRef]
  31. Chandra, S.P.; Hajra, M.; Ghosh, M. Supervised Classification Algorithms in Machine Learning: A Survey and Review. In Emerging Technology in Modelling and Graphics; Springer: Singapore, 2020; pp. 99–111. [Google Scholar] [CrossRef]
  32. Naeem, S.; Ali, A.; Anam, S.; Ahmed, M.M. An Unsupervised Machine Learning Algorithms: Comprehensive Review. Int. J. Comput. Digit. Syst. 2023, 13, 911–921. [Google Scholar] [CrossRef]
  33. Najjar, E.; Majeed Breesam, A. Supervised Machine Learning a Brief Survey of Approaches. Al-Iraqia J. Sci. Eng. Res. 2023, 2, 71–82. [Google Scholar] [CrossRef]
  34. Zhang, Z.; Huang, S.; Li, Z.; Wang, L.; Shi, Y.; Luo, Q. Machine Learning-Based Model for Prediction of Elastic Modulus of Calcium Hydroxide in Oil Well Cement Under High-Temperature High-Pressure Conditions. Processes 2025, 13, 344. [Google Scholar] [CrossRef]
  35. ASTM D3682-21; Standard Test Method for Major and Minor Elements in Combustion Residues from Coal Utilization Processes by Atomic Spectrometry. American Society for Testing and Materials: West Conshohocken, PA, USA, 2021.
  36. ASTM C618-19; Standard Specification for Coal Fly Ash and Raw or Calcined Natural Pozzolan for Use in Concrete. American Society for Testing and Materials: West Conshohocken, PA, USA, 2019.
  37. EN 196-2; Methods of Testing Cement. Part 2: Chemical Analysis of Cement. European Committee for Standardization (CEN): Brussels, Belgium, 2014.
  38. EN 450-1; Fly Ash for Concrete. Part 1: Definitions, Specifications and Conformity Criteria. European Comittee for Standardization (CEN): Brussels, Belgium, 2013.
  39. EN 13279-1:2009; Gypsum Binders and Gypsum Plasters—Part 1: Definitions and Requirements. European Committee for Standardization (CEN): Brussels, Belgium, 2009.
  40. Leiva, C.; Vilches, L.F.; Vale, J.; Fernández-Pereira, C. Fire Resistance of Biomass Ash Panels Used for Internal Partitions in Buildings. Fire Saf. J. 2009, 44, 622–628. [Google Scholar] [CrossRef]
  41. EN 12457-4:2003; Characterization of Waste—Leaching—Compliance Test for Leaching of Granular Waste Materials and Sludges. European Committee for Standardization (CEN): Brussels, Belgium, 2003.
  42. EN 520:2005+A1:2010; Gypsum Plasterboards—Definitions, Requirements and Test Methods. European Committee for Standardization (CEN): Brussels, Belgium, 2010.
  43. UNE 102042:2023; Gypsum Plasters. Other Test Methods. Asociación Española de Normalización (UNE): Madrid, Spain, 2023.
  44. EN 196-3; Methods of Testing Cement—Part 3: Determination of Setting Times and Soundness. European Committee for Standardization (CEN): Brussels, Belgium, 2017.
  45. EN 1363-1:2021; Fire Resistance Tests—Part 1: General Requirements. European Committee for Standardization (CEN): Brussels, Belgium, 2021.
  46. EN 1015-11; Methods of Test for Mortar for Masonary—Part 11: Determination of Flexural and Compressive Strength of Hardened Mortar. European Committee for Standardization (CEN): Brussels, Belgium, 2000.
  47. EN 13279-2; Gypsum Binders and Gypsum Plasters—Part 2: Test Methods. European Committee for Standardization (CEN): Brussels, Belgium, 2014.
  48. EN 13501-2:2009+A1:2010; Fire Classification of Construction Products and Building Elements—Part 2: Classification Using Data from Fire Resistance Tests, Excluding Ventilation Services. European Committee for Standardization (CEN): Brussels, Belgium, 2010.
  49. Cheung, T.-H.; Yeung, D.-Y. A Survey of Automated Data Augmentation for Image Classification: Learning to Compose, Mix, and Generate. IEEE Trans. Neural Netw. Learn. Syst. 2024, 35, 13185–13205. [Google Scholar] [CrossRef]
  50. Ali, Y.A.; Awwad, E.M.; Al-Razgan, M.; Maarouf, A. Hyperparameter Search for Machine Learning Algorithms for Optimizing the Computational Complexity. Processes 2023, 11, 349. [Google Scholar] [CrossRef]
  51. European Commission. Council Directive 1999/31/EC of 26 April 1999 on the Landfill of Waste; European Commission: Brussels, Belgium, 1999; Available online: https://eur-lex.europa.eu/eli/dir/1999/31/oj (accessed on 16 March 2025).
  52. Córdoba, P.; Diego, R. Oxy-Coal Combustion Fly Ashes: Leachability of Inorganic Trace Contaminants. Energy Fuels 2019, 33, 4531–4541. [Google Scholar] [CrossRef]
  53. EN 12457-2; Characterization of Waste—Leaching; Compliance Test for Leaching of Granular Waste Materials and Sludges—Part 2: One Stage Batch Test at a Liquid to Solid Ratio of 10 l/Kg for Material with Particle Size below 4 Mm (Without or with Size Reduction). European Committee for Standardization (CEN): Brussels, Belgium, 2002.
  54. Blasenbauer, D.; Huber, F.; Lederer, J.; Quina, M.J.; Blanc-Biscarat, D.; Bogush, A.; Bontempi, E.; Blondeau, J.; Chimenos, J.M.; Dahlbo, H.; et al. Legal Situation and Current Practice of Waste Incineration Bottom Ash Utilisation in Europe. Waste Manag. 2020, 102, 868–883. [Google Scholar] [CrossRef]
  55. Ministero dell’Ambiente e della Tutela del Territorio. Individuazione dei Rifiuti non Pericolosi Sottoposti Alle Procedure Semplificate di Recupero, ai Sensi Degli Articoli 31 e 33 del Decreto Legislativo 5 Febbraio 1997, N. 22; Ministero dell’Ambiente e della Tutela del Territorio: Rome, Italy, 2006.
  56. Ministry of the Environment, Lithuanian Government. SAKYMAS—Dėl Atliekų Deginimo Įrenginiuose Ir Bendro Atliekų Deginimo Įrenginiuose Susidariusių Pelenų Ir Šlako Tvarkymo Reikalavimų Patvirtinimo—2016 m. Lapkričio 25 d. Nr. D1-80; Ministry of the Environment, Lithuanian Government: Vilnius, Lithuania, 2016.
  57. Generalitat de Catalunya. Num. 2181-13.3.1996 Ordre de 15 de Febrer de 1996, Sobre Valorització d’ Escóries; Department de Medi Ambient, Ed.; Department de Medi Ambient: Catalunya, Spain, 1995.
  58. DL 183/2009; Waste Disposal at Landfills. Transposition to the Portuguese Law of Council. Directive 1999/31/CE. Government of Portugal: Lisboa, Portugal, 2009.
  59. Doleželová, M.; Scheinherrová, L.; Krejsová, J.; Keppert, M.; Černý, R.; Vimmrová, A. Investigation of Gypsum Composites with Different Lightweight Fillers. Constr. Build. Mater. 2021, 297, 123791. [Google Scholar] [CrossRef]
  60. Caetano, H.; Vilhena, L.; Ramalho, A.; Santiago, A.; Laím, L.; Monteiro, E. Mechanical Characterisation of Gypsum-Based Passive Fire Protection Mortars with Micro and Nano Silica Particles. Appl. Sci. 2024, 14, 8612. [Google Scholar] [CrossRef]
  61. EN 12859; Gypsum Blocks Definitions, Requirements and Test Methods. European Committee for Standardization (CEN): Brussels, Belgium, 2012.
  62. Álvarez, M.; Ferrández, D.; Morón, C.; Atanes-Sánchez, E. Characterization of a New Lightened Gypsum-Based Material Reinforced with Fibers. Materials 2021, 14, 1203. [Google Scholar] [CrossRef]
Figure 1. Particle size distribution of fly and bottom ashes.
Processes 13 00933 g001
Figure 2. Fire resistance test.
Processes 13 00933 g002
Figure 3. ML logic diagram (blocks = processes, lines = input/output).
Processes 13 00933 g003
Figure 4. Temperature on non-exposed surface of different panels during the fire test.
Processes 13 00933 g004
Figure 5. Relative (blue bars) and cumulative (red line) importance of different variables for (a) t180 (regression) and (b) FRR (classification).
Processes 13 00933 g005
Figure 6. Relative (blue bars) and cumulative (red line) importance of different variables for (a) Rc (regression) and (b) compression strength (classification).
Processes 13 00933 g006
Figure 7. At t180, comparing predicted vs. actual values using the training and test sets for the random forest regression model with hyperparameters: # estimators = 42, max depth = 24, max features = 7.
Processes 13 00933 g007
Figure 8. Rc comparing predicted vs. actual values using the training and test sets for the multilayer perceptron regression model with hyperparameters: Hidden layer size = (16, 16), Alpha = 0.2, validation fraction = 0.125, learning rate = 0.081.
Processes 13 00933 g008
Figure 9. Confusion matrix results for FRR comparing predicted vs. true class values using the test set for the random forest classification model with hyperparameters: # estimators = 70, max depth = 10, max features = sqrt.
Processes 13 00933 g009
Figure 10. Confusion matrix results for compressive strength comparing predicted vs. true class values using the test set for the decision tree classification model with the following hyperparameters: max depth = 15.
Processes 13 00933 g010
Figure 11. FRR for each sample (B-0 to B-40) varying the plate thickness for the random forest classification model with hyperparameters: # estimators = 70, max depth = 10, max features = sqrt.
Processes 13 00933 g011
Table 1. Major chemical components of FA and BA (wt%).
SiO2Al2O3Fe2O3MnOMgOCaONa2OK2OTiO2P2O5SO3Loss On Ignition (LOI)Specific Gravity (g/cm3)
FA48.724.37.90.071.82.30.73.71.50.40.026.62.7
BA52.325.19.20.071.82.40.73.71.50.30.031.12.3
Table 2. Compositions of the different mixes.
Bottom AshFly AshGypsumVermiculitePolypropilene FibersWater/Solid Ratio
B-0060309.50.50.4
B-202040309.50.50.4
B-303030309.50.50.4
B-404020309.50.50.4
Table 3. Tuned hyperparameters (including value ranges) for each regression machine learning algorithm.
Algorithm TypeHyperparameterMinimal ValueMaximum ValueOther
Decision treeMax depth130
Random forestNumber of Estimators1100
Max depth150
Max featuresSqrt7
RidgeAlpha0.120
LassoAlpha0.120
k-NeighborsNumber of Neighbors115
Weights Uniform, distance
Gradient boostingLoss Squared error
Learning rate0.011
Number of Estimators130
Max depth530
Max featuresSqrt8
Subsample0.11
XG boostLearning rate0.0010.5
Number of Estimators10200
Max depth120
Multilayer perceptronHidden layer size(4, 4)(32, 32)
Activation ReLU
Solver Adam
Alpha0.00.1
Validation fraction0.050.15
Max iterations 10,000
Learning rate0.0010.5
Early stopping True
Table 4. Tuned hyperparameters (including value ranges) for each classification machine learning algorithm.
Algorithm TypeHyperparameterMinimal ValueMaximum ValueOther
Decision treeMax depth120
Random forestNumbers of Estimators1100
Max depth150
Max featuresSqrt6
RidgeAlpha0.15
Logistic regressionC0.15
k-NeighborsNumber of Neighbors115
Weights Uniform, distance
Gradient boostingLoss Log loss
Learning rate0.051
# Estimators530
Max depth1530
Max featuresSqrt8
Subsample0.51
XG boostLearning rate0.011
Number of Estimators100200
Max depth120
Multilayer perceptronHidden layer size(4, 4)(32, 32)
Activation ReLU
Solver Adam
Alpha0.050.3
Validation fraction0.050.3
Max iterations 10,000
Learning rate0.0010.1
Early stopping True
Table 5. Leaching findings of FA and BA and comparison with the limits imposed by the EULFD and several European nations (mg/kg, dry basis).
Regulation.BAFAEULFDItalyLithuaniaWallonia (Belgium)Catalonia (Spain)
ApplicationInert LandfillNon-HazardousConstruction MaterialsCivil EngineeringBase LayerRoad Sub-Base
As0.0060.210.520.5-11
Ba0.0040.065201000.0520.03--
Cd<0.001<0.0010.0410.5211
Cr<0.0010.0710.5100.51.5--
Cu<0.0010.00082500.010.0012020
Hg<0.01<0.010.010.2--0.2-
Mo0.0090.8270.5100.10.41.5-
Ni0.0050.00090.4100.50.52-
Pb<0.001<0.0010.510--25
Sb<0.0010.0460.060.73031.98
Se<0.0010.0410.10.50.5
Zn<0.001<0.0014500.0520.039.220
Table 6. Physical properties of the different materials.
PARAMETERB-0B-20B-30B-40
Bulk density (kg/m3)1093 ± 801047 ± 351030 ± 451004 ± 21
Free water (%)6.0 ± 0.26.3 ± 0.26.8 ± 0.27.5 ± 0.2
Water absorption(%)16.7 ± 1.319.4 ± 1.721.2 ± 2.026.7 ± 2.1
pH9.5 ± 0.210.0 ± 0.310.1 ± 0.39.6 ± 0.3
Volume stability (mm)0.5 ± 0.10.5 ± 0.10.6 ± 0.10.7 ± 0.1
Table 7. Mechanical properties of the different materials.
ParameterB-0B-20B-30B-40
Rc (before the fire) (MPa)2.0 ± 0.31.5 ± 0.21.3 ± 0.21.0 ± 0.3
Rc (after the fire) (MPa)0.9 ± 0.10.8 ± 0.10.7 ± 0.10.7 ± 0.1
Rf (before the fire) (MPa)0.84 ± 0.060.80 ± 0.050.72 ± 0.040.53 ± 0.04
Rf (after the fire) (MPa)0.29 ± 0.030.22 ± 0.030.19 ± 0.030.14 ± 0.03
Superficial hardness (before the fire)
(Shore C)
66 ± 556 ± 641 ± 428 ± 2
After the fire on exposed surface
(Shore C)
19 ± 214 ± 212 ± 19 ± 1
After the fire on non-exposed surface
(Shore C)
30 ± 221 ± 318 ± 215 ± 2
RI (mm)13.8 ± 0.614.5 ± 0.514.8 ± 0.515.3 ± 0.5
Table 8. Predicted vs. actual t180 values for samples B-0, B-20, B-30, and B-40.
ParameterB-0B-20B-30B-40
t180 (actual) (min)28.226.925.925.3
t180 (prediction) (min)28.429.328.823.2
Error (%)0.79.111.2−8.5
Table 9. Predicted vs. actual Rc values for samples B-0, B-20, B-30, and B-40.
ParameterB-0B-20B-30B-40
Rc (actual) (MPa)2.021.501.260.98
Rc (prediction) (MPa)1.150.930.900.86
Error (%)−42.9−38.3−28.2−11.7
Disclaimer/Publisher’s Note: The statements, opinions and data contained in all publications are solely those of the individual author(s) and contributor(s) and not of MDPI and/or the editor(s). MDPI and/or the editor(s) disclaim responsibility for any injury to people or property resulting from any ideas, methods, instructions or products referred to in the content.

