1. Introduction
The global energy market, valued at approximately
$1.5 trillion, remains heavily dependent on fossil fuels [
1]. However, recent shifts in the energy sector have underscored the growing demand for sustainable and clean energy solutions [
2]. Energy consumption continues to be a critical issue with significant implications for both environmental protection and sustainable development [
3,
4]. As non-renewable fossil fuels are gradually depleted, concerns about their long-term availability have intensified [
5,
6]. Additionally, the increasing use of fossil fuels has led to higher pollutant emissions, exacerbating environmental degradation [
7]. More and more research show that hydrogen plays an important role in global sustainable energy strategies [
8]. Hydrogen not only offers a viable solution to mitigate climate change but also provides a zero-emission alternative to conventional fuels, positioning it as a promising substitute for fossil fuels [
9]. Given its potential for environmental sustainability, hydrogen fuel is well-positioned to meet the energy demands of various sectors, particularly energy-intensive industries such as the drone sector [
10].
In recent years, the drone industry has rapidly grown, with a wide range of drones emerging for various applications. Drones are increasingly deployed across sectors such as defense, entertainment, agriculture, transportation, and aerial surveying, owing to their low cost, high mobility, and safety features. Industry forecasts suggest that the commercial drone market will reach
$6.3 billion by 2026 [
11,
12]. Currently, drones primarily rely on battery systems, which are favored for their low noise and lightweight properties. However, these battery systems present several limitations, including long charging times, low energy density, and limited flight durations. For instance, multirotor drones powered by lithium-ion batteries typically have flight times of less than one hour, and extending flight time often requires increasing the battery capacity [
13]. In contrast, fuel cells offer significant advantages, providing flight durations several times longer than those of battery powered systems [
14]. As a result, adopting fuel cells as the primary power source for drones has emerged as an ideal solution, with the development of lightweight fuel cell systems being a key challenge.
Fuel cell systems typically provide at least twice the power of lithium-ion batteries of the same weight, making them ideal for drones requiring extended flight durations [
15]. Common types of fuel cells include proton exchange membrane fuel cells (PEMFC), alkaline fuel cells (such as phosphoric acid and alkaline fuel cells), molten carbonate fuel cells, and solid oxide fuel cells. Among these, PEMFCs are widely used in both vehicles and drones due to their high energy conversion efficiency [
16]. The basic principle of PEMFCs is that hydrogen enters the diffusion layer through the anode feed channel, where it is oxidized in the catalyst layer to produce protons and electrons, which then recombine to form water. To optimize hydrogen utilization and ensure system safety and cost-effectiveness, high-pressure hydrogen storage tanks are commonly used [
17,
18]. However, while these tanks provide sufficient hydrogen, their pressure typically reaches 35 MPa [
19], far exceeding the atmospheric pressure required for PEMFC [
20]. Therefore, a key challenge in fuel cell system design for drones is stabilizing and reducing this high-pressure hydrogen to a level suitable for fuel cell operation. This challenge becomes particularly critical under complex conditions with high pressure and large pressure differentials, where conventional pressure relief valves often fail to provide precise regulation [
21]. Addressing this issue is essential for the development of efficient hydrogen systems for drones.
Currently, the pressure range of hydrogen storage tanks during use is 10–35 MPa, while the operating pressure of fuel cells is approximately 0.1–0.3 MPa. Therefore, the pressure reduction of high-pressure hydrogen gas is typically achieved through a multi-stage design to ensure system safety and stable operation. Research on pressure reduction systems for fuel cells mainly focus on optimizing the cone angle of pressure-reducing valves and modifying the shape of the secondary pressure-reducing valve. However, most studies remain theoretical, with simulations still at a preliminary stage. Several studies have explored the aerodynamics of pressure relief valves in depth. For example, Ye et al. [
22,
23] developed a transient high-pressure hydrogen flow model for check valves in hydrogen refueling stations, analyzing the velocity, pressure variations, and dynamic characteristics of the valve core during valve opening. They also examined the impact of the valve core shape in high-pressure hydrogen needle valves on flow characteristics. Casari et al. [
24] used a real gas model to study the flow of high-pressure critical methane in pressure relief valves, proposing a mixing factor to simulate static temperature drop. Qian et al. [
25,
26] and Jin et al. [
27] used reverse multi-stage Tesla valves for hydrogen pressure reduction, exploring how structural parameters affect the dynamic characteristics of inlet velocity. They also summarized the relationships between flow velocity, pressure ratio, Mach number, and valve stages, aiming to reduce aerodynamic noise. Zhang et al. [
28] designed a novel multi-stage pressure relief valve by combining traditional relief valves with Tesla orifice plate valves, demonstrating its effectiveness in providing pressure reduction under complex conditions. Additionally, Ariyadi et al. [
21] found that in the rapid refueling process of hydrogen fuel cell vehicle (HFCV), electromagnetic valves generated significant aerodynamic noise. By changing the exit flow path to reduce turbulence, the effect of noise could be remarkably reduced. Conical valve cores, commonly used as throttling components in high-pressure pneumatic relief valves, are integral to various pressure relief systems. However, research on pneumatic valves—particularly regarding fluid jetting characteristics in throttling valves [
29], condensation behavior in conical throttling valves [
30], and minimizing unstable fluid loads on the cone valve plug [
31]—remains limited. Notably, existing studies have shown that the cone angle of conical valves significantly influences vortex formation and flow field characteristics [
32]. Therefore, selecting appropriate structural parameters is crucial when designing high-pressure hydrogen pressure relief systems.
Research on fuel cell pressure reduction systems for drones remains limited, with most studies focusing on fuel cell vehicles and hydrogen refueling stations. While these studies provide foundational insights into hydrogen pressure reduction technology, they are not directly applicable to drone systems, which must operate under more complex dynamic conditions, such as high pressures, elevated temperatures, and large pressure ratios during flight. Consequently, existing pressure reduction technologies are not fully suitable for drones. This paper introduces a novel two-stage valve design specifically developed for fuel cell drones, addressing the limitations of traditional pressure reduction systems under these unique operating conditions. Through a combination of experiments and numerical simulations, this study analyzes the multi-stage flow characteristics of hydrogen at varying valve openings. The results demonstrate that changes in valve opening significantly affect hydrogen flow velocity, pressure distribution, and energy consumption, ultimately impacting pressure reduction performance and system efficiency. This research not only provides valuable technical support for pressure regulation in hydrogen delivery systems for fuel cell drones under extreme conditions, but also lays a theoretical foundation for optimizing pressure reduction devices in similar complex systems in the future.
2. Working Principle of the Drone Bottle Valve
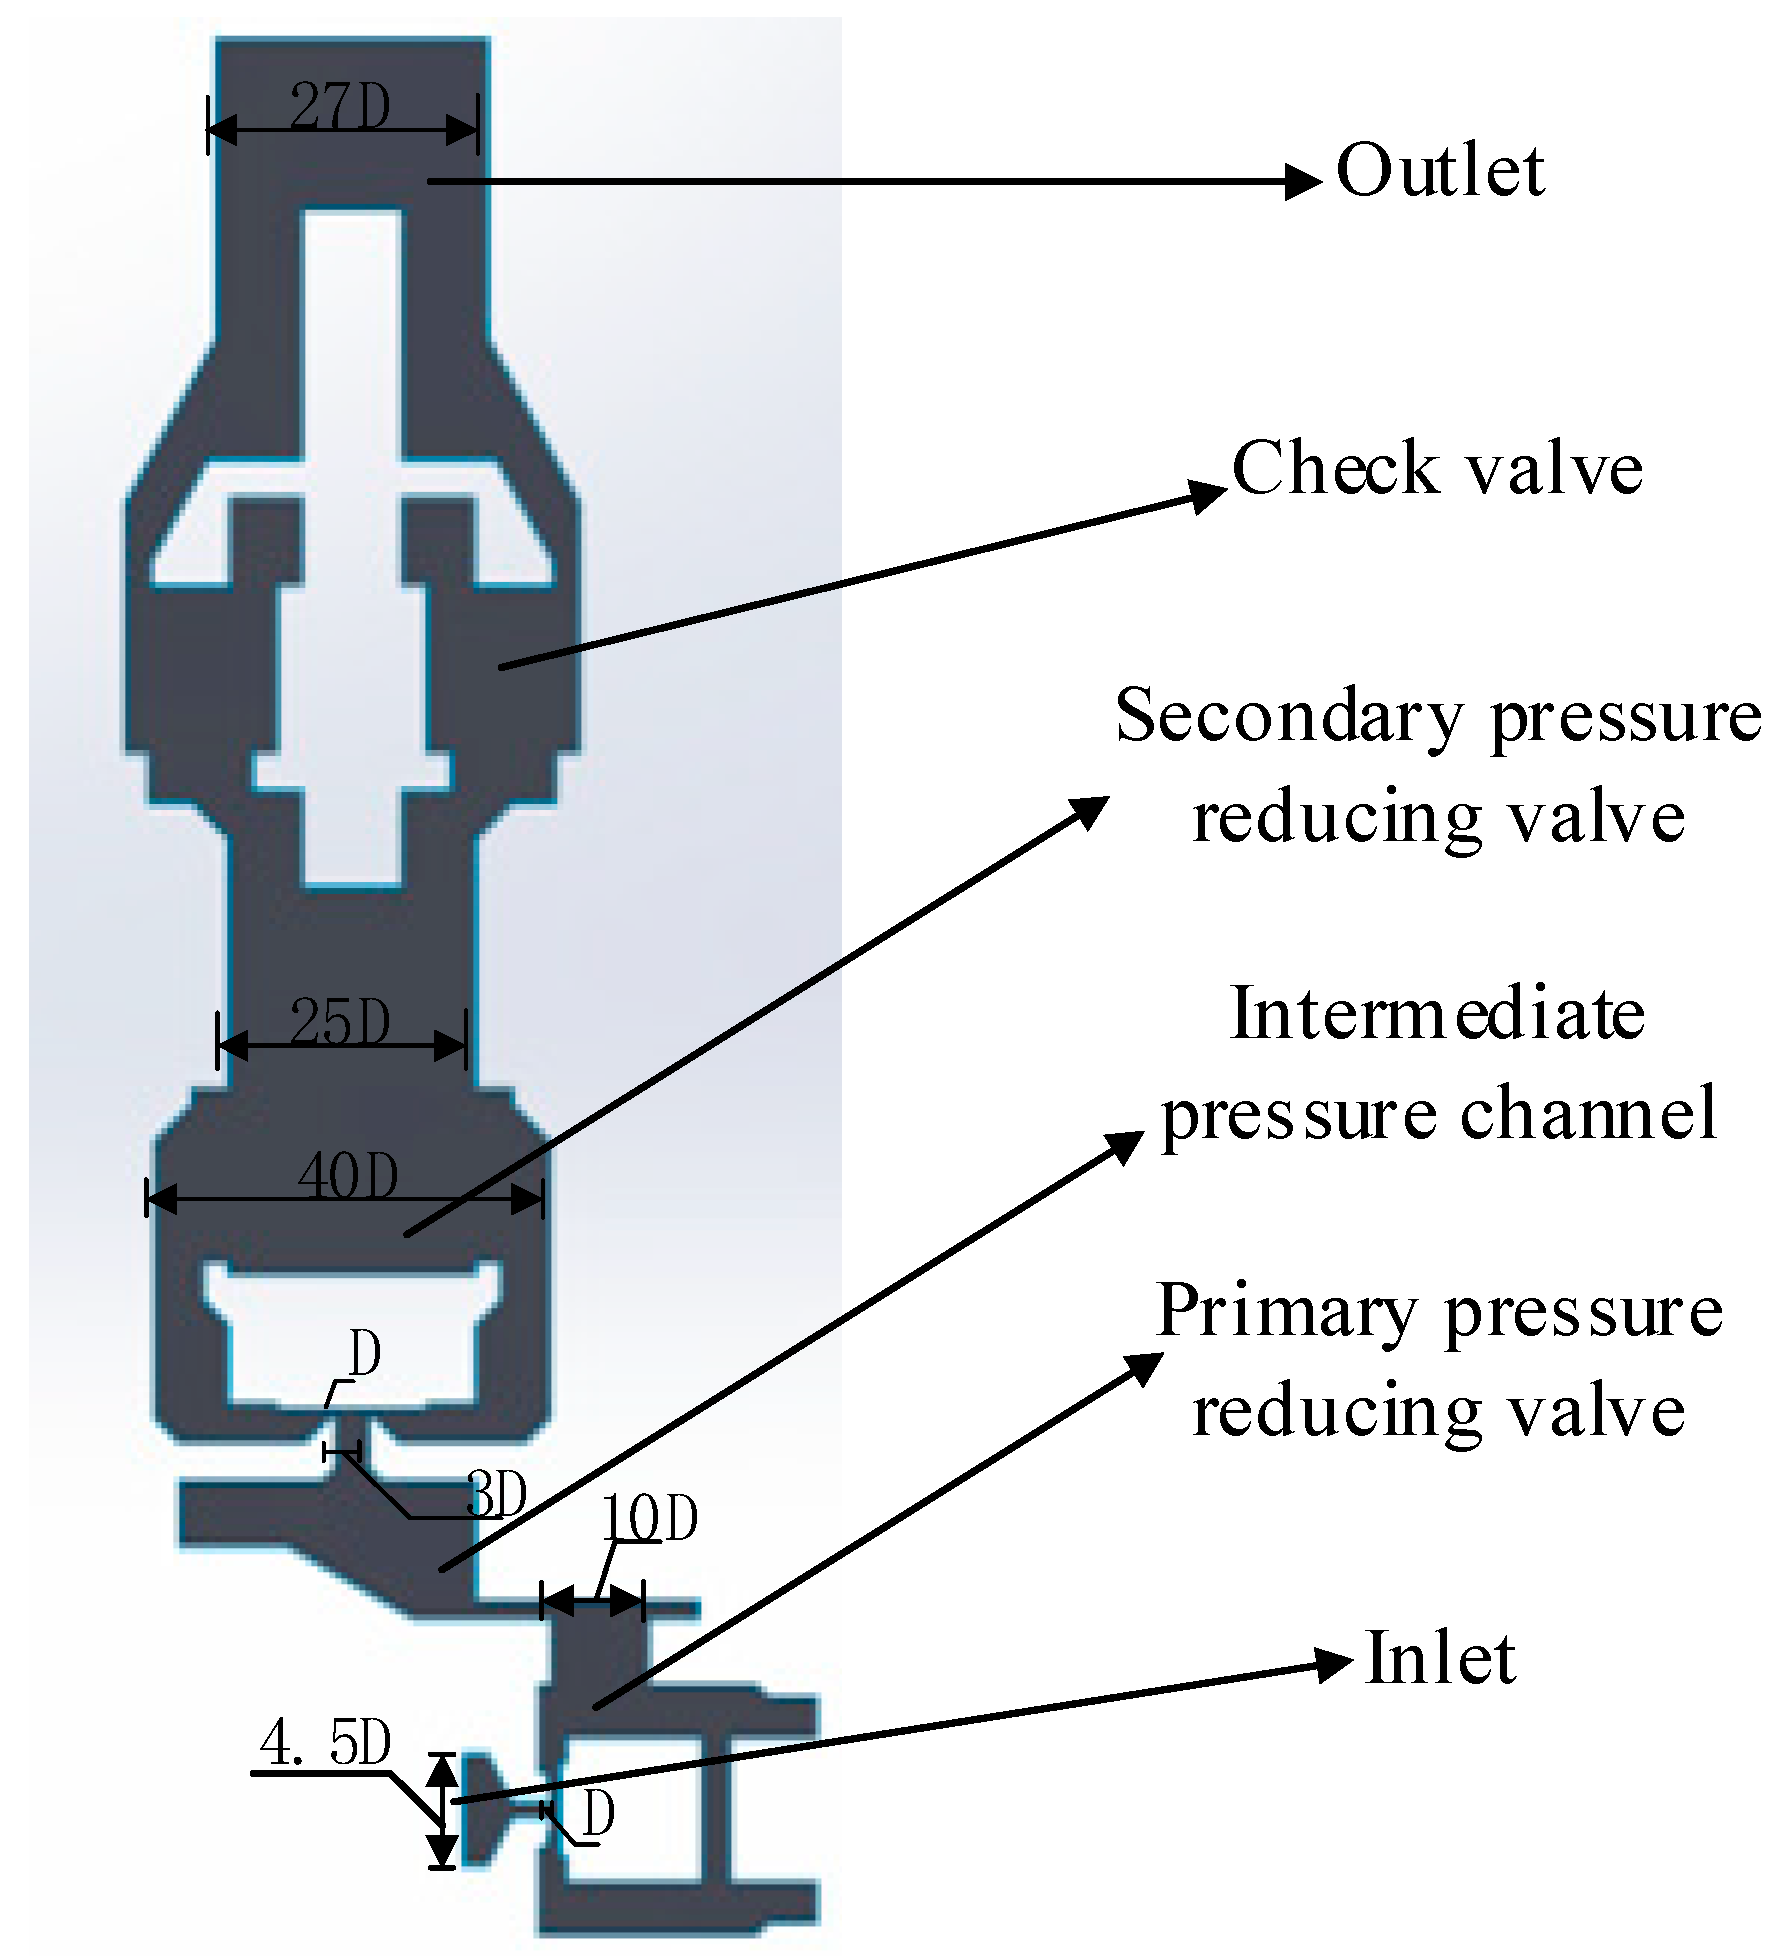
The partial structure of the newly designed drone bottle valve is shown in
Figure 1. The primary goal of this design is to ensure the safe and efficient delivery of high-pressure hydrogen, thereby guaranteeing the stable and secure operation of the fuel cell system. The valve plays a crucial role in transporting hydrogen gas from the storage tank to subsequent components within the system.
The core structure of the valve includes an inlet flow path, a primary pressure reduction valve, a connecting section, a secondary pressure reduction valve, a check valve, and an outlet. Hydrogen gas enters the valve through the inlet flow path, where the primary pressure reduction valve reduces the pressure to a more manageable level. This step minimizes the impact of hydrogen flow on downstream components, such as the valve body and pipework. Following the primary reduction, the hydrogen flows through the connecting section to the secondary pressure reduction valve, which further lowers the pressure to the stable operating level required by the fuel cell system, ensuring the safe and reliable operation of downstream equipment.
A check valve is incorporated within the valve body to prevent hydrogen backflow and protect the system. When the downstream pressure exceeds the upstream pressure, the check valve automatically closes, preventing reverse flow and ensuring system safety. After undergoing double-stage pressure reduction and being safeguarded by the check valve, the hydrogen exits through the outlet and is supplied to the proton exchange membrane (PEM) fuel cell stack, ensuring a continuous and stable hydrogen supply.
To enhance valve performance, this study introduces an innovative design that replaces the traditional angular valve body with a channel-type structure. This modification reduces turbulence during hydrogen flow, optimizes flow distribution, minimizes system noise, and improves flow stability. The integration of the multi-stage pressure reduction process ensures excellent pressure regulation and system stability, even under complex conditions such as high pressure, elevated temperatures, and large pressure ratios. Additionally, the new valve design demonstrates superior adaptability to challenging environments, significantly improving the overall performance of the hydrogen delivery system.
3. Experimental Research on Drone Bottle Valves
3.1. Experimental Platform for Drone Bottle Valves
The overall testing process of the drone bottle valve experiments consists of two main stages: preliminary tests and formal tests. In the preliminary phase, the drone bottle valve is first installed onto a test fixture or mounting device. High-pressure helium gas, with a rated pressure of 35 MPa, is then introduced through the inlet. Due to its small molecular radius and high diffusivity, helium is an ideal detection gas, offering high sensitivity to even the smallest of leaks. A helium mass spectrometer is used to thoroughly inspect the valve body and connections for potential leaks. During this phase, the system continuously monitors gas leakage at the valve body and joints to ensure that the internal and external sealing performance of the high-temperature fuel shut-off valve meets required standards. If any leakage points are detected, technicians can promptly repair or replace the sealing structures or components, ensuring a stable sealing performance under high-pressure conditions. This phase not only helps identify potential defects early but also establishes a solid foundation for the subsequent formal tests. If the drone bottle valve passes the preliminary tests, demonstrating adequate sealing and safety under high-pressure conditions, the experimental platform proceeds to the formal testing phase.
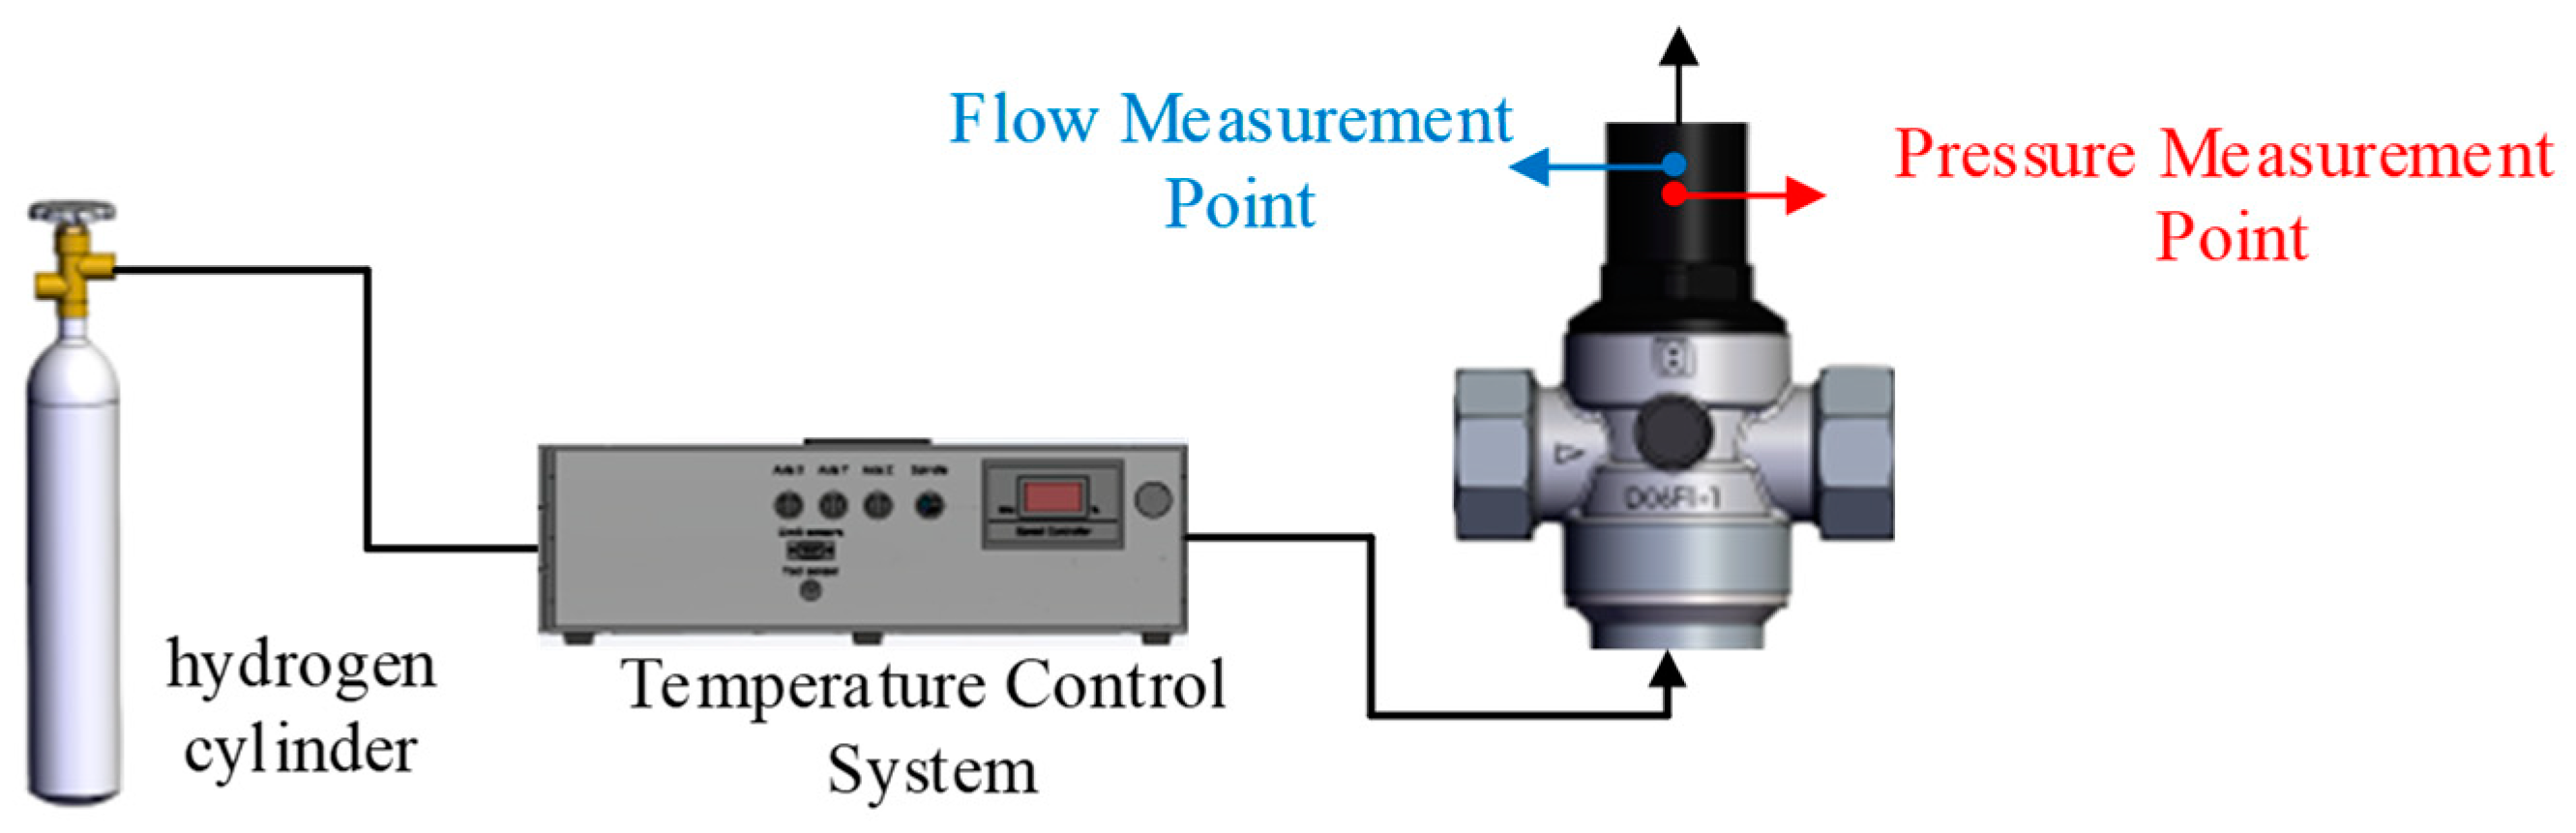
In the formal testing phase, high-pressure hydrogen gas is first extracted from the storage tank and heated to 298.15 K using a temperature control system, simulating actual operating conditions and ambient temperature, as shown in
Figure 2. Once the desired temperature is reached, the hydrogen gas is directed to the drone bottle valve inlet and flows through the pipeline into the valve body for real-world operational testing. During this process, the hydrogen undergoes multi-stage pressure reduction, transitioning from a high-pressure state to the operating pressure suitable for the fuel cell system, thereby simulating the real-world hydrogen delivery environment for drones.
To thoroughly evaluate the sealing performance and flow stability of the bottle valve and its internal check valve during dynamic hydrogen flow, sensors are installed at the probe tail of the check valve. These sensors continuously monitor and record key parameters, such as pressure and flow rate, ensuring that performance variations under different conditions are accurately captured. Pressure sensors measure pressure changes at various points within the valve body, assessing the stability and precision of the pressure reduction process. Flow sensors track the hydrogen flow rate, providing insights into the valve’s ability to regulate flow at varying rates. By analyzing the collected pressure curves and flow data, a deeper understanding of the valve’s operation under different conditions can be obtained. This analysis not only helps determine whether the valve’s performance meets the operational requirements of the drone, but also further validates its ability to maintain stable sealing and flow control during high-pressure hydrogen delivery.
3.2. Experimental Results and Discussion
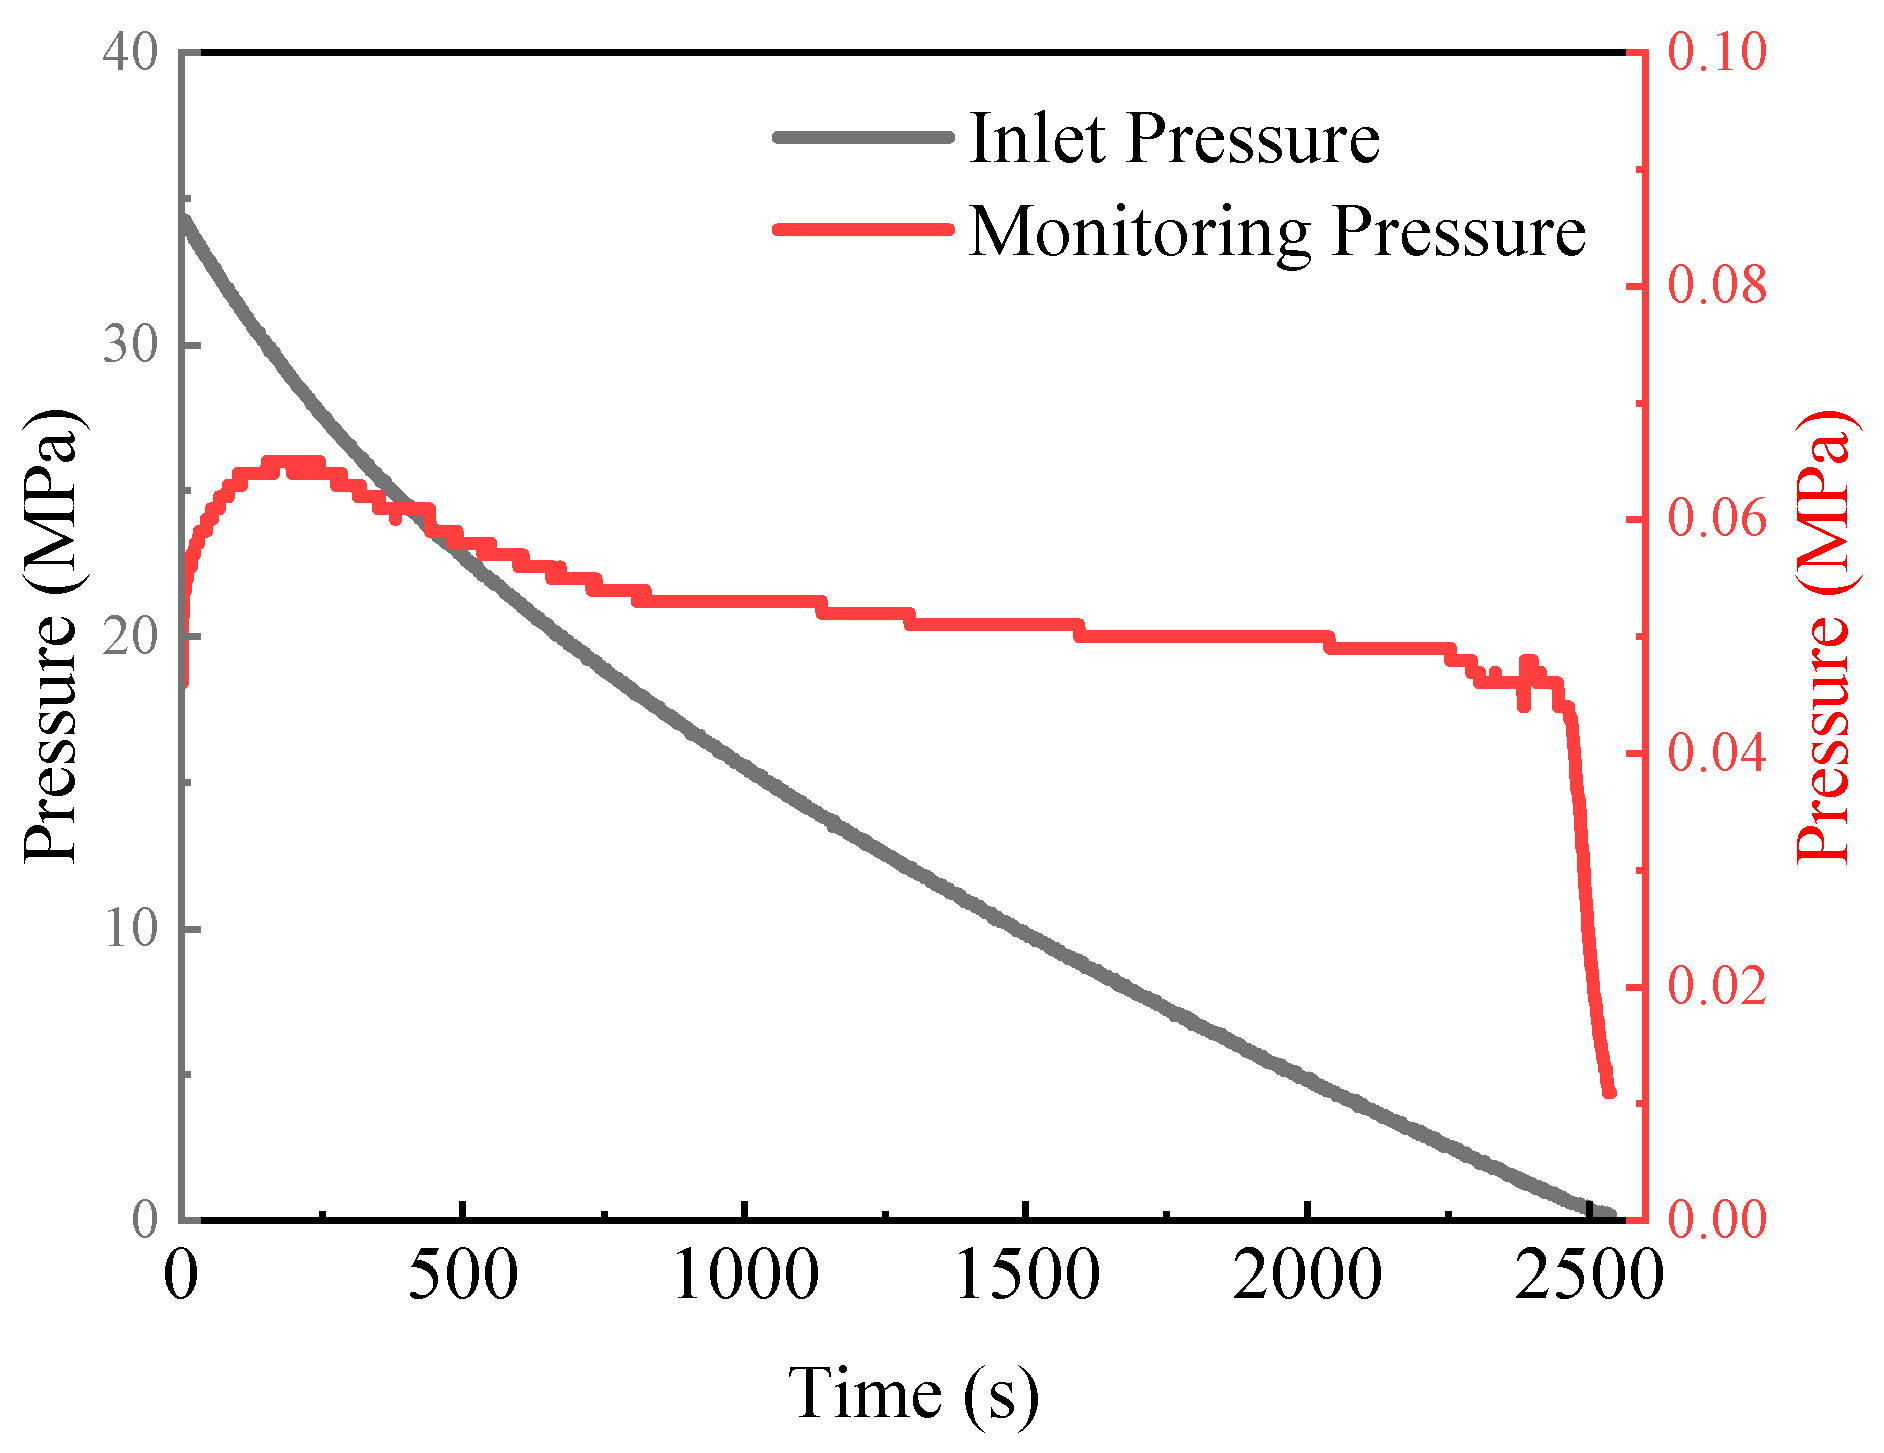
The pressure variation of the novel drone bottle valve is shown in
Figure 3. The black curve represents the inlet pressure, initially around 33 MPa, while the red curve corresponds to the outlet pressure, as measured by the sensor at the back of the check valve probe. As the experiment progresses, the inlet pressure steadily decreases, indicating that the gas source is being consumed or evacuated. This is expected, as hydrogen undergoes gradual pressure reduction and exits the system through the valve body.
In the early stages of the experiment, the outlet pressure initially increases and stabilizes for a period before gradually decreasing as both the inlet pressure and valve opening decrease, eventually approaching zero. This behavior reflects the dynamic adjustment of the valve from a larger to a smaller opening. When the valve opening is still relatively large, the downstream side receives a sufficient pressure supply, allowing the outlet pressure to remain relatively stable. However, as the valve opening narrows further, the hydrogen flow becomes more restricted, and the outlet pressure decreases in line with the diminishing inlet pressure. Eventually, as the inlet pressure continues to drop and the valve opening becomes even smaller, the outlet pressure decreases significantly, approaching zero. This indicates that the gas source is nearly depleted or fully evacuated.
This dynamic pressure change monitoring process helps to verify the valve’s ability to regulate pressure in practical applications, particularly under conditions where valve openings progressively narrow and inlet pressures continue to decrease. It also assesses the valve’s effectiveness in controlling hydrogen flow and pressure. The experimental data provide valuable insights into the valve’s performance, flow stability, and adjustment effectiveness across varying valve openings. Additionally, they serve as crucial data for validating the accuracy of subsequent numerical simulations.
5. Results and Discussion
5.1. Pressure Field Analysis of the Drone Bottle Valve
Figure 7a,b illustrates the pressure distribution within the bottle valve as the valve opening decreases from 100% to 25%. The pressure distribution follows a consistent trend across varying valve openings and pressure ratios. Specifically, the pressure gradient is steep within both the first- and second-stage pressure relief valves, while the gradient at the check valve and outlet becomes more gradual. An analysis of the hydrogen flow behavior reveals that as hydrogen enters the first-stage pressure relief valve, the pressure drops sharply due to throttling effects. The relatively small flow area of the first-stage valve causes significant throttling, resulting in a substantial pressure decrease. As the hydrogen flows through the second-stage relief valve, the pressure ratio between the inlet and outlet gradually decreases, eventually reaching the required outlet pressure at the check valve. Furthermore, as the valve opening decreases, the flow area of the pressure relief valves reduces, further lowering the inlet–outlet pressure ratio. This results in a more uniform pressure distribution across the first- and second-stage pressure relief valves. This analysis emphasizes the substantial impact of valve openings on pressure distribution, particularly in the regions surrounding the pressure relief valves.
Figure 8a shows the pressure variation in the X-direction across the first-stage pressure relief valve at different valve openings (25%, 50%, 75%, and 100%). At a 100% opening, the pressure drops rapidly with significant fluctuations, indicating a high gas flow rate and a less effective pressure reduction. Despite the pressure decrease, it remains relatively high, suggesting insufficient pressure relief. As the valve opening is reduced to 75%, 50%, and 25%, the pressure drop becomes less pronounced, signaling an improvement in pressure relief performance. At a 25% opening, the pressure stabilizes, indicating significant restriction of gas flow, a reduction in flow rate, and a more pronounced pressure relief effect. At this point, the gas flow rate decreases substantially, and the pressure is more precisely controlled, ensuring stable system operation at a lower pressure, thus protecting the downstream equipment.
Figure 8b illustrates the pressure variation in the Y-direction across the second-stage pressure relief valve at different valve openings. The pressure variation trend in the second-stage valve mirrors that observed in the first-stage valve. At a 100% opening, the pressure drops rapidly, accompanied by a high gas flow rate and weaker pressure reduction, indicating minimal restriction to the gas flow and allowing the gas to move relatively freely. As the valve opening decreases to 75%, 50%, and 25%, the rate of pressure drop gradually slows. Notably, at a 25% opening, the pressure stabilizes, indicating a significant improvement in pressure relief. In this state, the valve’s precise control ensures the gas pressure remains stable at a lower level, thereby maintaining safe system operation. Smaller valve openings provide more accurate control, effectively reducing gas pressure and ensuring stable operation within a low-pressure, steady state.
Overall, the pressure variation trends in both the first- and second-stage pressure relief valves show that as the valve opening decreases, gas flow becomes more restricted, the pressure relief effect improves, and pressure variation becomes more gradual, resulting in a more stable system control. In practical applications, appropriately adjusting the valve opening enables precise pressure control, ensuring that the system operates within a safe and stable pressure range while minimizing energy loss and maximizing system efficiency.
5.2. Velocity Field Analysis of the Drone Bottle Valve
Figure 9 shows the hydrogen gas flow velocity distribution within the drone bottle valve as the valve opening decreases from 100% to 25%. The flow behavior inside the valve indicates that at the inlet of both the first- and second-stage pressure relief valves, significant throttling occurs due to the sudden reduction in flow area. This leads to a pressure drop and an increase in flow velocity. As the gas flows through the valve, its direction continuously changes, causing the airflow to impact the valve walls at higher speeds, which, in turn, alters both lateral and longitudinal velocities. The uneven distribution of these velocities generates vortex flow, which will be examined further in subsequent analyses.
Additionally, as the hydrogen jet impacts the valve walls, its kinetic energy is significantly reduced upon collision. As the valve opening decreases, the flow velocity inside the valve progressively decreases as well. However, the overall flow pattern remains consistent. After passing through the second-stage pressure relief valve, the gas velocity shows a symmetrical distribution, indicating that, at different valve openings, the flow distribution and velocity variations follow a consistent pattern. This ensures stable pressure control within the system.
From the airflow velocity distributions, as shown in
Figure 10, the variation in gas flow velocity within the drone bottle valve at different valve openings is apparent. As the valve opening increases, flow conductivity improves, and the gas velocity increases accordingly. At a 100% valve opening, in both the first- and second-stage pressure relief valves, the flow velocity is relatively high, particularly near the valve inlet, indicating that the airflow is nearly unrestricted and the velocity reaches its maximum. As the valve opening gradually decreases to 75%, 50%, and 25%, the gas velocity progressively decreases, especially in the downstream regions of the valve, where the velocity drops significantly. This suggests that smaller valve openings restrict the gas flow, slowing the velocity and enhancing the pressure reduction effect.
At a 25% valve opening, the flow is highly restricted, with the velocity dropping to its lowest point, resulting in the most significant pressure reduction. This demonstrates that smaller openings effectively limit gas flow, improving pressure reduction and ensuring that the gas pressure remains at a lower level. In contrast, larger openings permit faster gas flow, leading to weaker pressure reduction. Therefore, adjusting the valve opening properly is crucial for controlling gas flow velocity, achieving precise pressure reduction, and ensuring stable system operation.
5.3. Energy Dissipation Analysis of the Drone Bottle Valve
As previously mentioned, the drone bottle valve generates vortices during operation, and the formation of these vortices significantly intensifies turbulence in the hydrogen flow, leading to energy losses. This section focuses on the impact of valve opening on energy dissipation.
Figure 11 illustrates the vortex flow in different regions inside the valve when the valve opening is at 100%, with six vortices (Vortex 1 to Vortex 6) labeled sequentially. Six vortices form in the primary flow regions of the hydrogen gas. Vortex 1, located in the first-stage pressure relief valve, contains three smaller vortices, while Vortex 2 appears in the middle pressure channel. Vortices 3 through 5 are found in the second-stage pressure relief valve, and Vortex 6 forms at the probe tail. Flow separation occurs due to sharp changes in the flow area, generating vortices. This separation also leads to the formation of low-pressure, high-speed regions at the vortex centers, making the flow more complex and exacerbating turbulence.
The formation of Vortex 1 indicates that the flow is initially restricted, with higher velocity and the onset of disturbances. Vortex 2, located in the middle pressure channel, shows that this area is significantly influenced by the flow, with the vortex becoming more pronounced. As the flow passes through the second-stage pressure relief valve, structural factors and valve opening cause the intensity of Vortices 3 through 5 to gradually increase, indicating a more complex flow. In the outlet region upstream of the valve, Vortex 6 grows larger, suggesting significant expansion and disturbance of the gas flow, resulting in a more prominent turbulent structure. Overall, as the gas flows from the valve inlet to the outlet, the flow becomes increasingly complex. The formation of multiple vortices reflects the strong influence of structural changes, pressure differences, and velocity variations on the flow in different regions. These vortices not only affect flow efficiency but also have a significant impact on the valve’s operational stability and flow control accuracy. In particular, the vortices increase turbulence in the hydrogen flow, leading to higher energy dissipation. Therefore, valve design should focus on the formation locations of vortices and their effects on overall flow performance to optimize energy efficiency and enhance system stability.
In addition to increasing energy dissipation, flow vortices can cause blockages within the fluid channels. Therefore, this section investigates the distribution of flow vortices and variations in turbulent kinetic energy (TKE) at different valve openings.
Figure 12 shows the distribution of TKE in the first- and second-stage pressure relief valve regions of the drone bottle valve for valve openings of 25%, 50%, 75%, and 100%.
As the valve opening increases, the peak TKE increases significantly, particularly at a 100% opening, where the TKE reaches its maximum near the valve inlet. This indicates that larger openings lead to more intense flow and higher turbulence strength. As the valve opening decreases to 75%, 50%, and 25%, the TKE progressively decreases, turbulence strength weakens, and the distribution range of TKE narrows. This suggests that smaller valve openings help stabilize the flow and reduce turbulence intensity. At a 25% opening, the TKE drops significantly, and the flow becomes smoother, with the weakest turbulence observed. In conclusion, larger valve openings result in stronger TKE and a more unstable flow, while smaller openings effectively reduce turbulence and improve flow stability. This underscores the importance of properly adjusting the valve opening to optimize flow stability and reduce energy losses. Specifically, controlling the valve opening plays a critical role in ensuring stable system operation and minimizing energy dissipation.
As mentioned earlier, flow vortices significantly amplify turbulence in the hydrogen flow, leading to higher energy dissipation. Therefore, it is essential to consider the locations of these vortices during the structural design process.
6. Conclusions
Through experiments and numerical simulations, the key conclusions are drawn as follows:
(1) The valve opening plays a crucial role in the pressure distribution within the bottle valve. At larger openings, the pressure drops rapidly, resulting in weaker pressure reduction. In contrast, at smaller openings, the pressure drop becomes more gradual, leading to more effective pressure reduction and improved system stability. This pattern is consistent with the analysis of airflow velocity: at larger openings, the airflow velocity is higher, with less restriction and weaker pressure reduction, whereas at smaller openings, the airflow velocity decreases significantly, the flow becomes more restricted, and the pressure reduction effect is most pronounced.
(2) The formation of vortices increases turbulence in the hydrogen flow, which in turn raises energy consumption. At larger openings, the vortices are more intense, leading to greater energy loss. Conversely, smaller valve openings effectively reduce turbulence, enhancing flow stability and reducing energy loss. Therefore, proper control of the valve opening is essential for minimizing energy dissipation and optimizing both flow stability and system efficiency.
(3) Smaller valve openings can stabilize the flow, reduce vortex formation, and lower energy loss. Properly adjusting the valve opening is vital for optimizing flow stability, minimizing energy loss, improving pressure reduction, and ensuring stable system operation.
In conclusion, the novel drone bottle valve demonstrates excellent pressure reduction control, particularly under complex conditions. It effectively stabilizes gas pressure, ensuring the safe operation of the fuel cell system.


