Abstract
Sand screenout is a critical challenge in hydraulic fracturing, affecting both the construction process and operational safety. This paper proposes a sand screenout warning model that integrates a combinatorial neural network and physical approaches to enhance both the speed and accuracy of sand screenout warnings. Firstly, the combined neural network uses a Transformer to capture key features during fracturing construction from historical data, and the extracted features are input to the Gated Recurrent Unit (GRU) for temporal prediction and the Crested Porcupine Optimizer (CPO) to further optimise the GRU-Transformer hyperparameters of the model. Additionally, the physical model improves the conventional inverse slope method by incorporating a threshold and sliding module, which enhances slope calculation and warning accuracy. The results showed that for fracturing pressure prediction, the proposed CPO-GRU-Transformer model obtained an RMSE value of 0.842 MPa, MAE of 0.613 Mpa, and of 0.971, a smaller RMSE and MAE and a larger than the three pressure prediction models, namely LSTM, GRU, and CPO-GRU. The proposed sand screenout warning model has been applied in the field construction of the U shale gas area in the Sichuan Basin. The warning points of the model proposed in this study were advanced by 73.5 s on average compared with the manual warning points in the three validated fracturing segments, with a successful warning rate of 85.71%, which greatly avoids the possibility of sand screenout and provides a method of fast calculation speed and high prediction accuracy, providing an early warning of sand screenout.
1. Introduction
Hydraulic fracturing is a key technology for unconventional oil and gas extraction [1]. However, sand screenout leads to artificially induced crack-plugging [2], reducing extraction efficiency or even causing production disengagement. This significantly hinders the effective implementation of production-enhancing modifications. Some scholars have evaluated the likelihood of sand screenout using both work experience and mathematical models. For instance, in 1981, Nolte and Smith [3] discovered the double logarithmic relationship between pressure and time at the fracture. This discovery introduced the Nolte diagram, a valuable tool for fracking and the first model assessing sand screenout likelihood. The Massaras Brothers developed the slope inversion method based on pressure fluctuation patterns during fracturing operations [4]. While these two methods offer high theoretical prediction accuracy, they fail to account for objective factors such as human operations and abnormal pressure fluctuations. They heavily rely on engineers’ subjective judgment during operations, limiting their effectiveness in complex environments. In this context, with advances in computing power, deep learning (DL) has emerged as an effective approach for tackling complex problems and real-time computations [5,6]. DL excels at handling large datasets and uncovering hidden data sequence relationships [7], and it is increasingly being adopted in the oil industry. For instance, DL has been applied to drilling speed prediction [8,9], wellbore stability analysis [10], lithology prediction [11,12], and production forecasting [13,14]. These applications demonstrate DL’s effectiveness in complex data analysis and offer novel insights and methodologies for sand screenout early warning systems.
In the research on sand screenout in the last decade, the Nolte diagram and the slope inversion method provide a theoretical basis for real-time warning of sand screenout, and some scholars have applied a time series prediction model to the research related to real-time warning of sand screenout, taking into account that sand screenout has the characteristic of cyclic changes. For example, Madasu and Rangarajan [15] introduced a wellhead pressure prediction model using Deep Recurrent Neural Networks (DRNN) to predict wellhead pressure fluctuations during hydraulic fracturing in real time. This was the first time that DL had been introduced to fracturing pressure prediction. Liang, et al. [16] used a coupled autoregressive integral sliding average model (ARIMA) and a generalised regression neural network (GRNN) for fracture pressure prediction. They then used slope change combined with a double logarithmic curve model to achieve an early sand screenout warning. Hu, et al. [17] predicted fracture pressure by the locally weighted linear regression (LWLR) method, and they optimised it by combining the particle filter (PF) algorithm and ARMA, which outperformed the reverse slope method. Yu, et al. [18] proposed a sand screenout classification model based on Gaussian Hidden Markov Models (GHMMs), which learnt to simulate the change of surface pressure signals for sand screenout early warning, with 86% accuracy of sand screenout. However, all these models mentioned above are single neural networks, which may make it difficult to predict the true value of the fracturing pressure considering the large variations in the input parameters, and there are some limitations in their application to complex situations. With a model integration strategy, we can maximise the unique strengths of each model to achieve a stronger overall performance [5]. Recent studies involve the integration of different models; for example, Sun, et al. [19] proposed a real-time sand screenout warning model by combining the inverse slope method with the CNN-LSTM neural network. Bin, et al. [20] used a combination of Attention and Bidirectional Long Short-Term Memory (BiLSTM) networks to construct a real-time prediction model for fracturing pressure in the fracturing process and to improve the Unet++ network for the recognition of events in the category of ‘stage’, which includes sand screenout.
In summary, deep learning models have been increasingly applied in sand screenout early warning systems. By forecasting fracturing pressure and integrating conventional warning methods, these models contribute to more reliable and proactive decision-making, thereby significantly reducing construction costs and risks. However, two major challenges remain in current research on sand screenout prediction. First, the development of deep learning models often relies on subjectively selected hyperparameters or empirical comparisons across multiple architectures, which compromises model robustness and generalizability. Second, traditional sand screenout warning approaches tend to generate false alarms under complex field conditions, limiting their practical effectiveness and failing to provide accurate guidance for field engineers. These limitations underscore the need for more intelligent, adaptive, and robust prediction frameworks tailored to real-world hydraulic fracturing scenarios, which forms the core motivation of this study.
Therefore, this paper proposes a new sand screenout early warning model, which is mainly composed of two parts: a combinatorial neural network and a physical model. In the combinatorial neural network part, Transformer is used to capture the long-term fluctuation characteristics of hydraulic structure parameter data, the Gate Control Unit (GRU) is numerically predicted, and the Crested Porcupine Optimizer (CPO) is used to optimize the hyperparameters of the GRU-Transformer to better capture dependencies between construction parameters. At the same time, the physical model is improved by the traditional slope inversion method, and the difference between the maximum and minimum pressure values is calculated to adapt to the complex structural situation. Finally, the real-time predicted pressure is input into the physical model for sand screenout judgement, which provides a faster and more accurate method for the sand screenout early warning model.
2. Methodology
2.1. Data Description
The dataset in this paper is from the U shale gas block in the Sichuan Basin, which has been in production since 2013 and has cumulatively produced 75 billion cubic metres of gas by the end of 2024, with data collected from 1391 fracturing stages of the treatment curve. To minimise the prediction error to a great extent, the training set used for prediction in this paper is derived from well data from wells adjacent to the target well or from geologically similar wells. The training set was processed, the missing values in the training set were deleted and the abnormal values were eliminated based on the fracturing construction design report.
Based on some scholars’ research on the influencing factors of pressure fluctuation, this paper concluded that fluid viscosity, discharge size and sand ratio are the main factors affecting the effectiveness of fracking [21,22]; these factors not only determine the extension and support effect of cracks, but are also closely related to the occurrence of sand screenout phenomenon. In this paper, natural language processing (NLP) techniques have been used to extract the design documents of the fracturing construction parameters for the proppant addition phase, and the detailed data required for the extraction are shown in Table 1.

Table 1.
Fracturing Construction Parameters.
In this paper, the fracturing construction data with data interval time of 1 s were selected, which have good time series characteristics, and the analysis of time series can reveal the cyclical changes, trends, etc. of the data. Due to the large unit differences between the data, which will lead to the model analysis process ignoring its hidden influence relationship, and to accelerate the model convergence speed and improve the model stability and accuracy, this paper adopted maximum and minimum normalisation to converge the fracturing construction data to the [0, 1] interval. The formula is shown in Equation (1).
where represents the feature raw data and represents the value after feature normalisation.
2.2. Pressure Prediction Based on Combinatorial Neural Networks
2.2.1. GRU-Transformer Model
Current models used for time series prediction are based on variants of Recurrent Neural Networks (RNN), such as the classic LSTM model, but due to its complex internal structure, training LSTM networks usually takes a long time due to their complex internal structure. Therefore, Chung, et al. [23] proposed an LSTM variant called Gated Recurrent Unit (GRU) based on the LSTM network model, which constructs an update door and reset door based on the three-gate structure of LSTM’s forget gate, input gate, and output gate, which are also the keys to the efficient computation of GRU. The module structure of LSTM and GRU is shown in Figure 1. The unoptimised GRU parameters are shown in Table 2.

Figure 1.
LSTM and GRU structures.
Table 2.
Unoptimised GRU parameters.
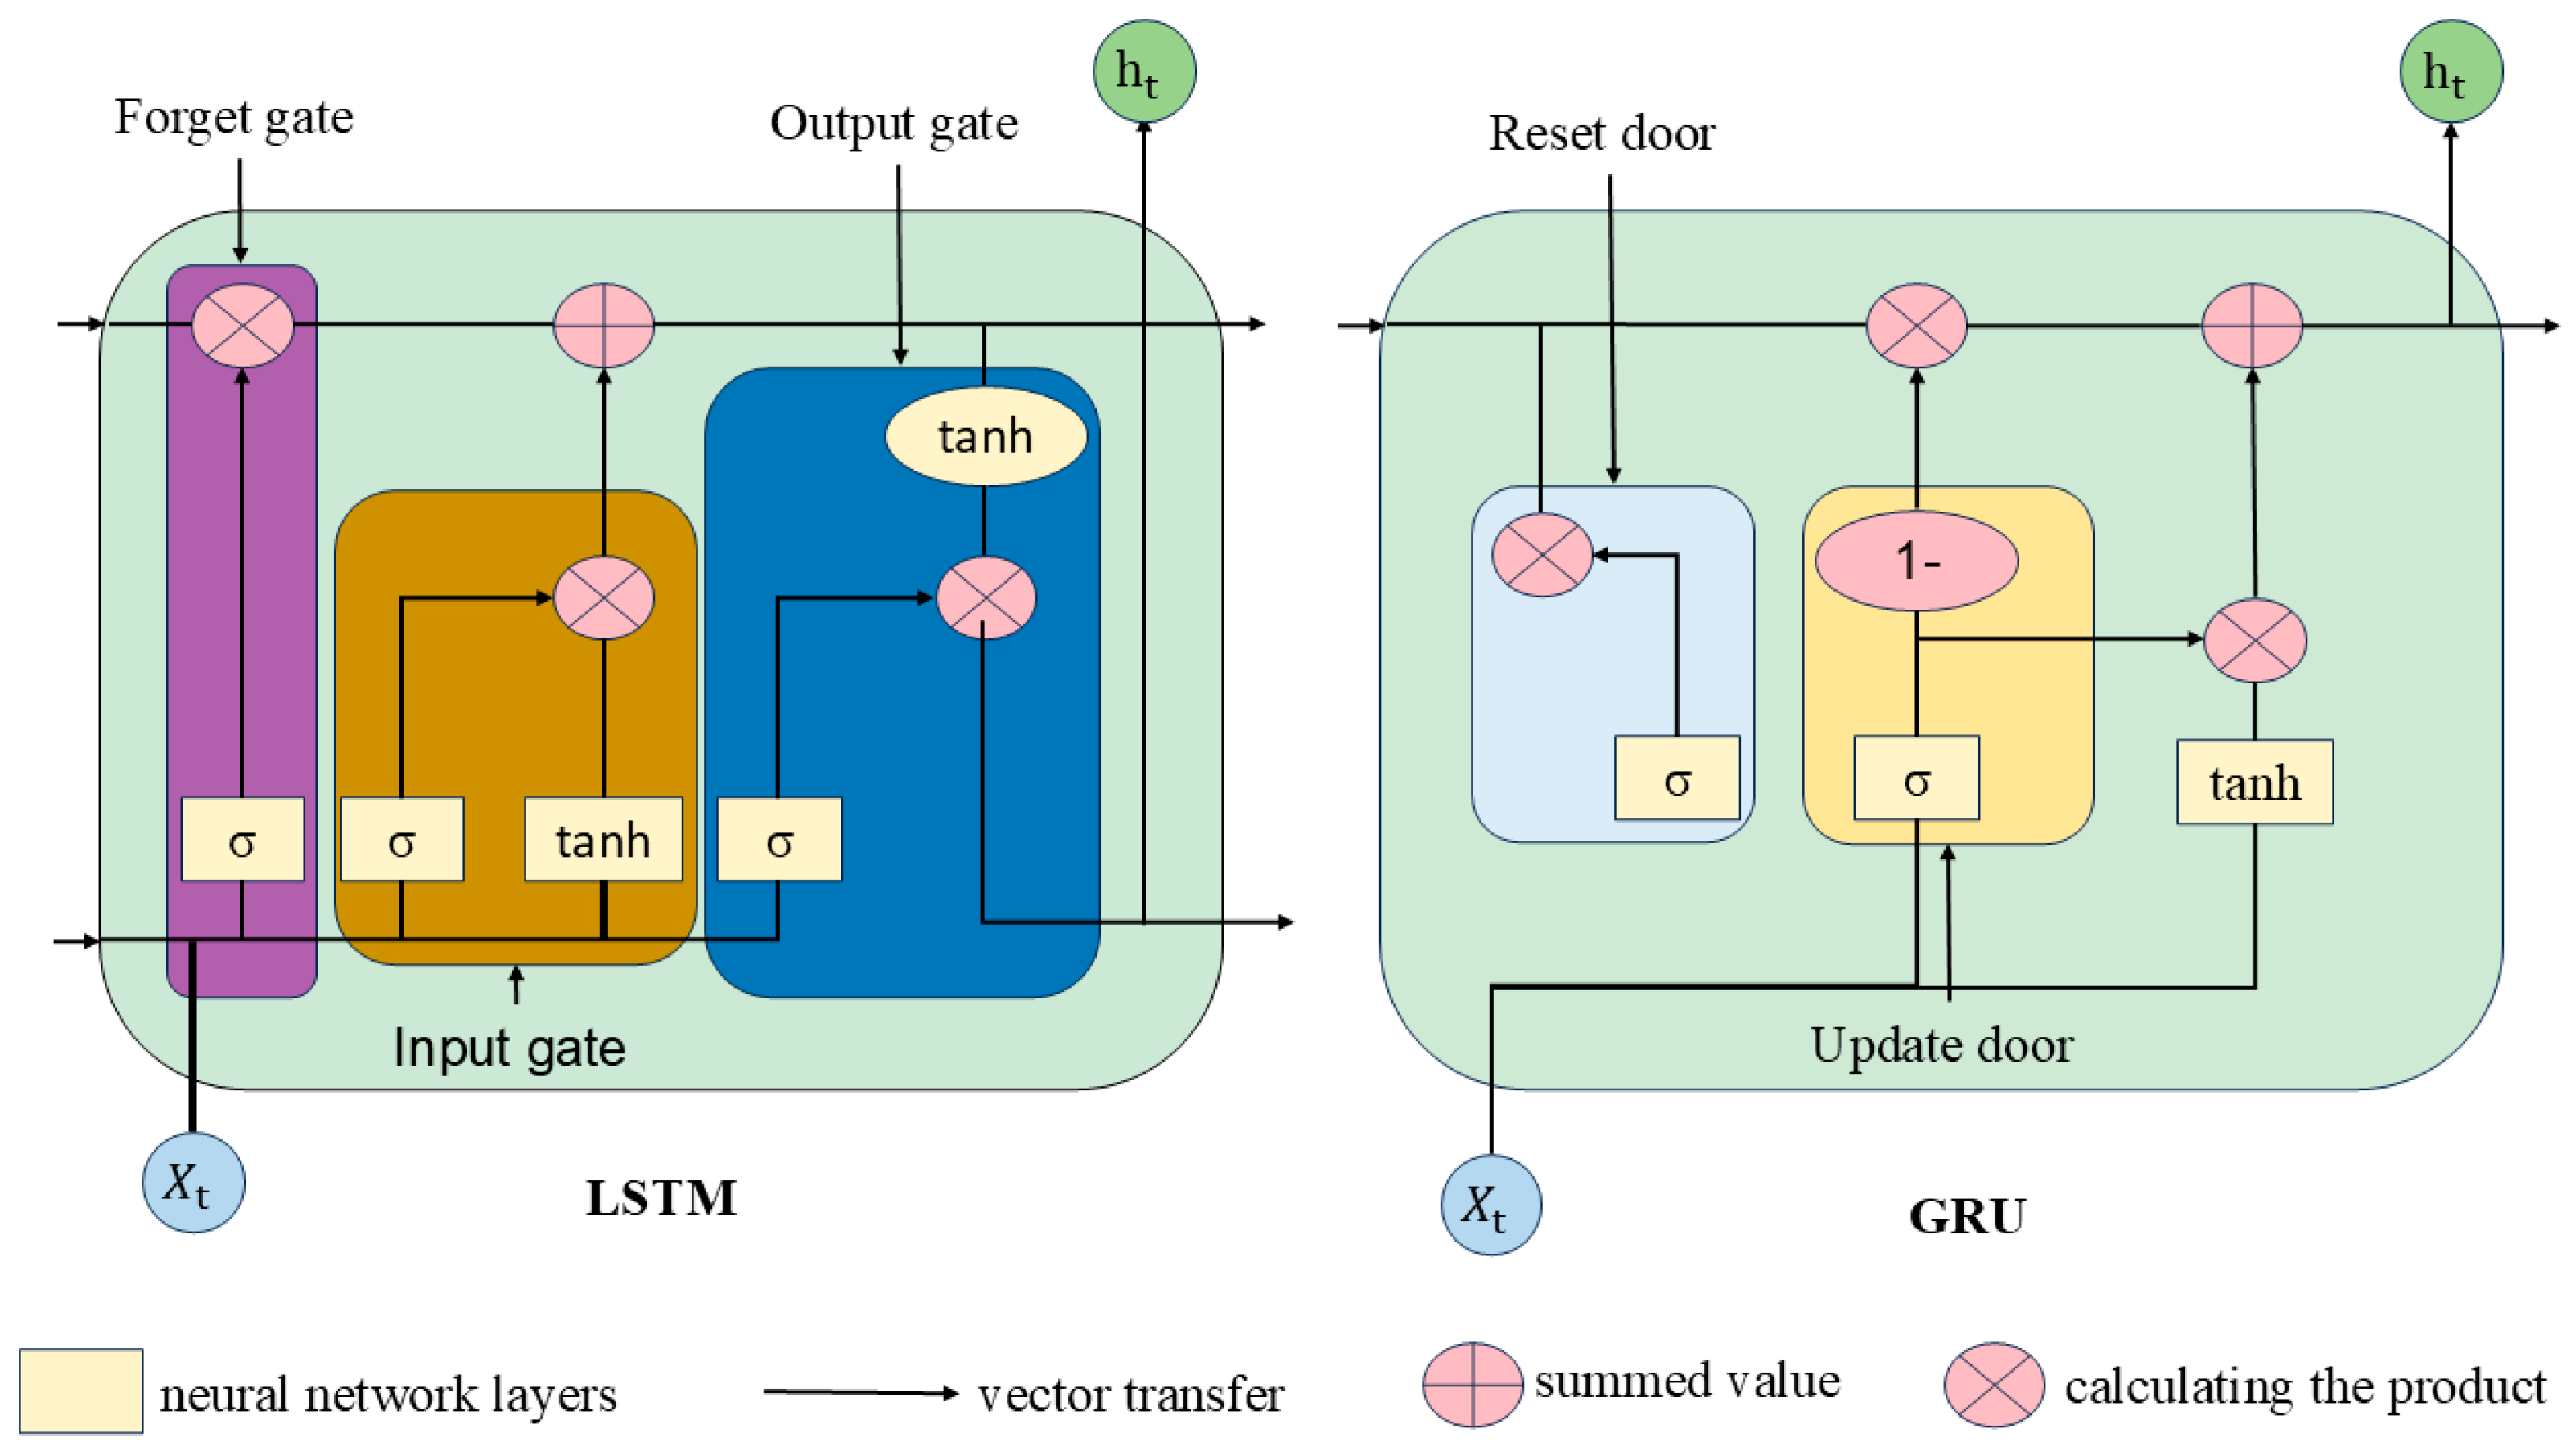
Transformer is a neural network framework based on the self-attention mechanism [24], proposed by the Google team in 2017. It has been successfully applied in fields such as natural language processing [25], machine vision [26], and long-term sequence prediction [27]. The core mechanism of the Transformer model is the self-attention mechanism (Self-Attention), which enables it to automatically learn the importance of different variables in a sequence without being influenced by the temporal order, making it an ideal choice for long sequence modelling [28]. The network structure of Transformer is shown in Figure 2, where Add&Norm represents residual link and normalization.
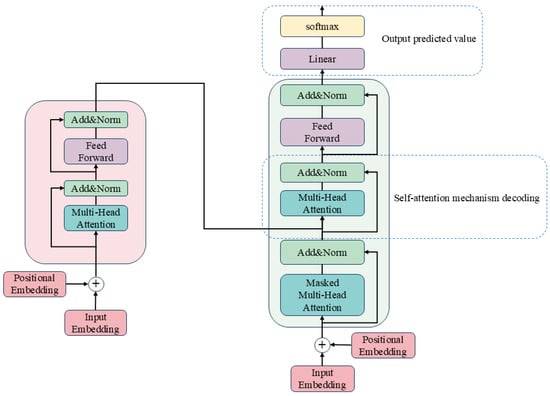
Figure 2.
Transformer framework.
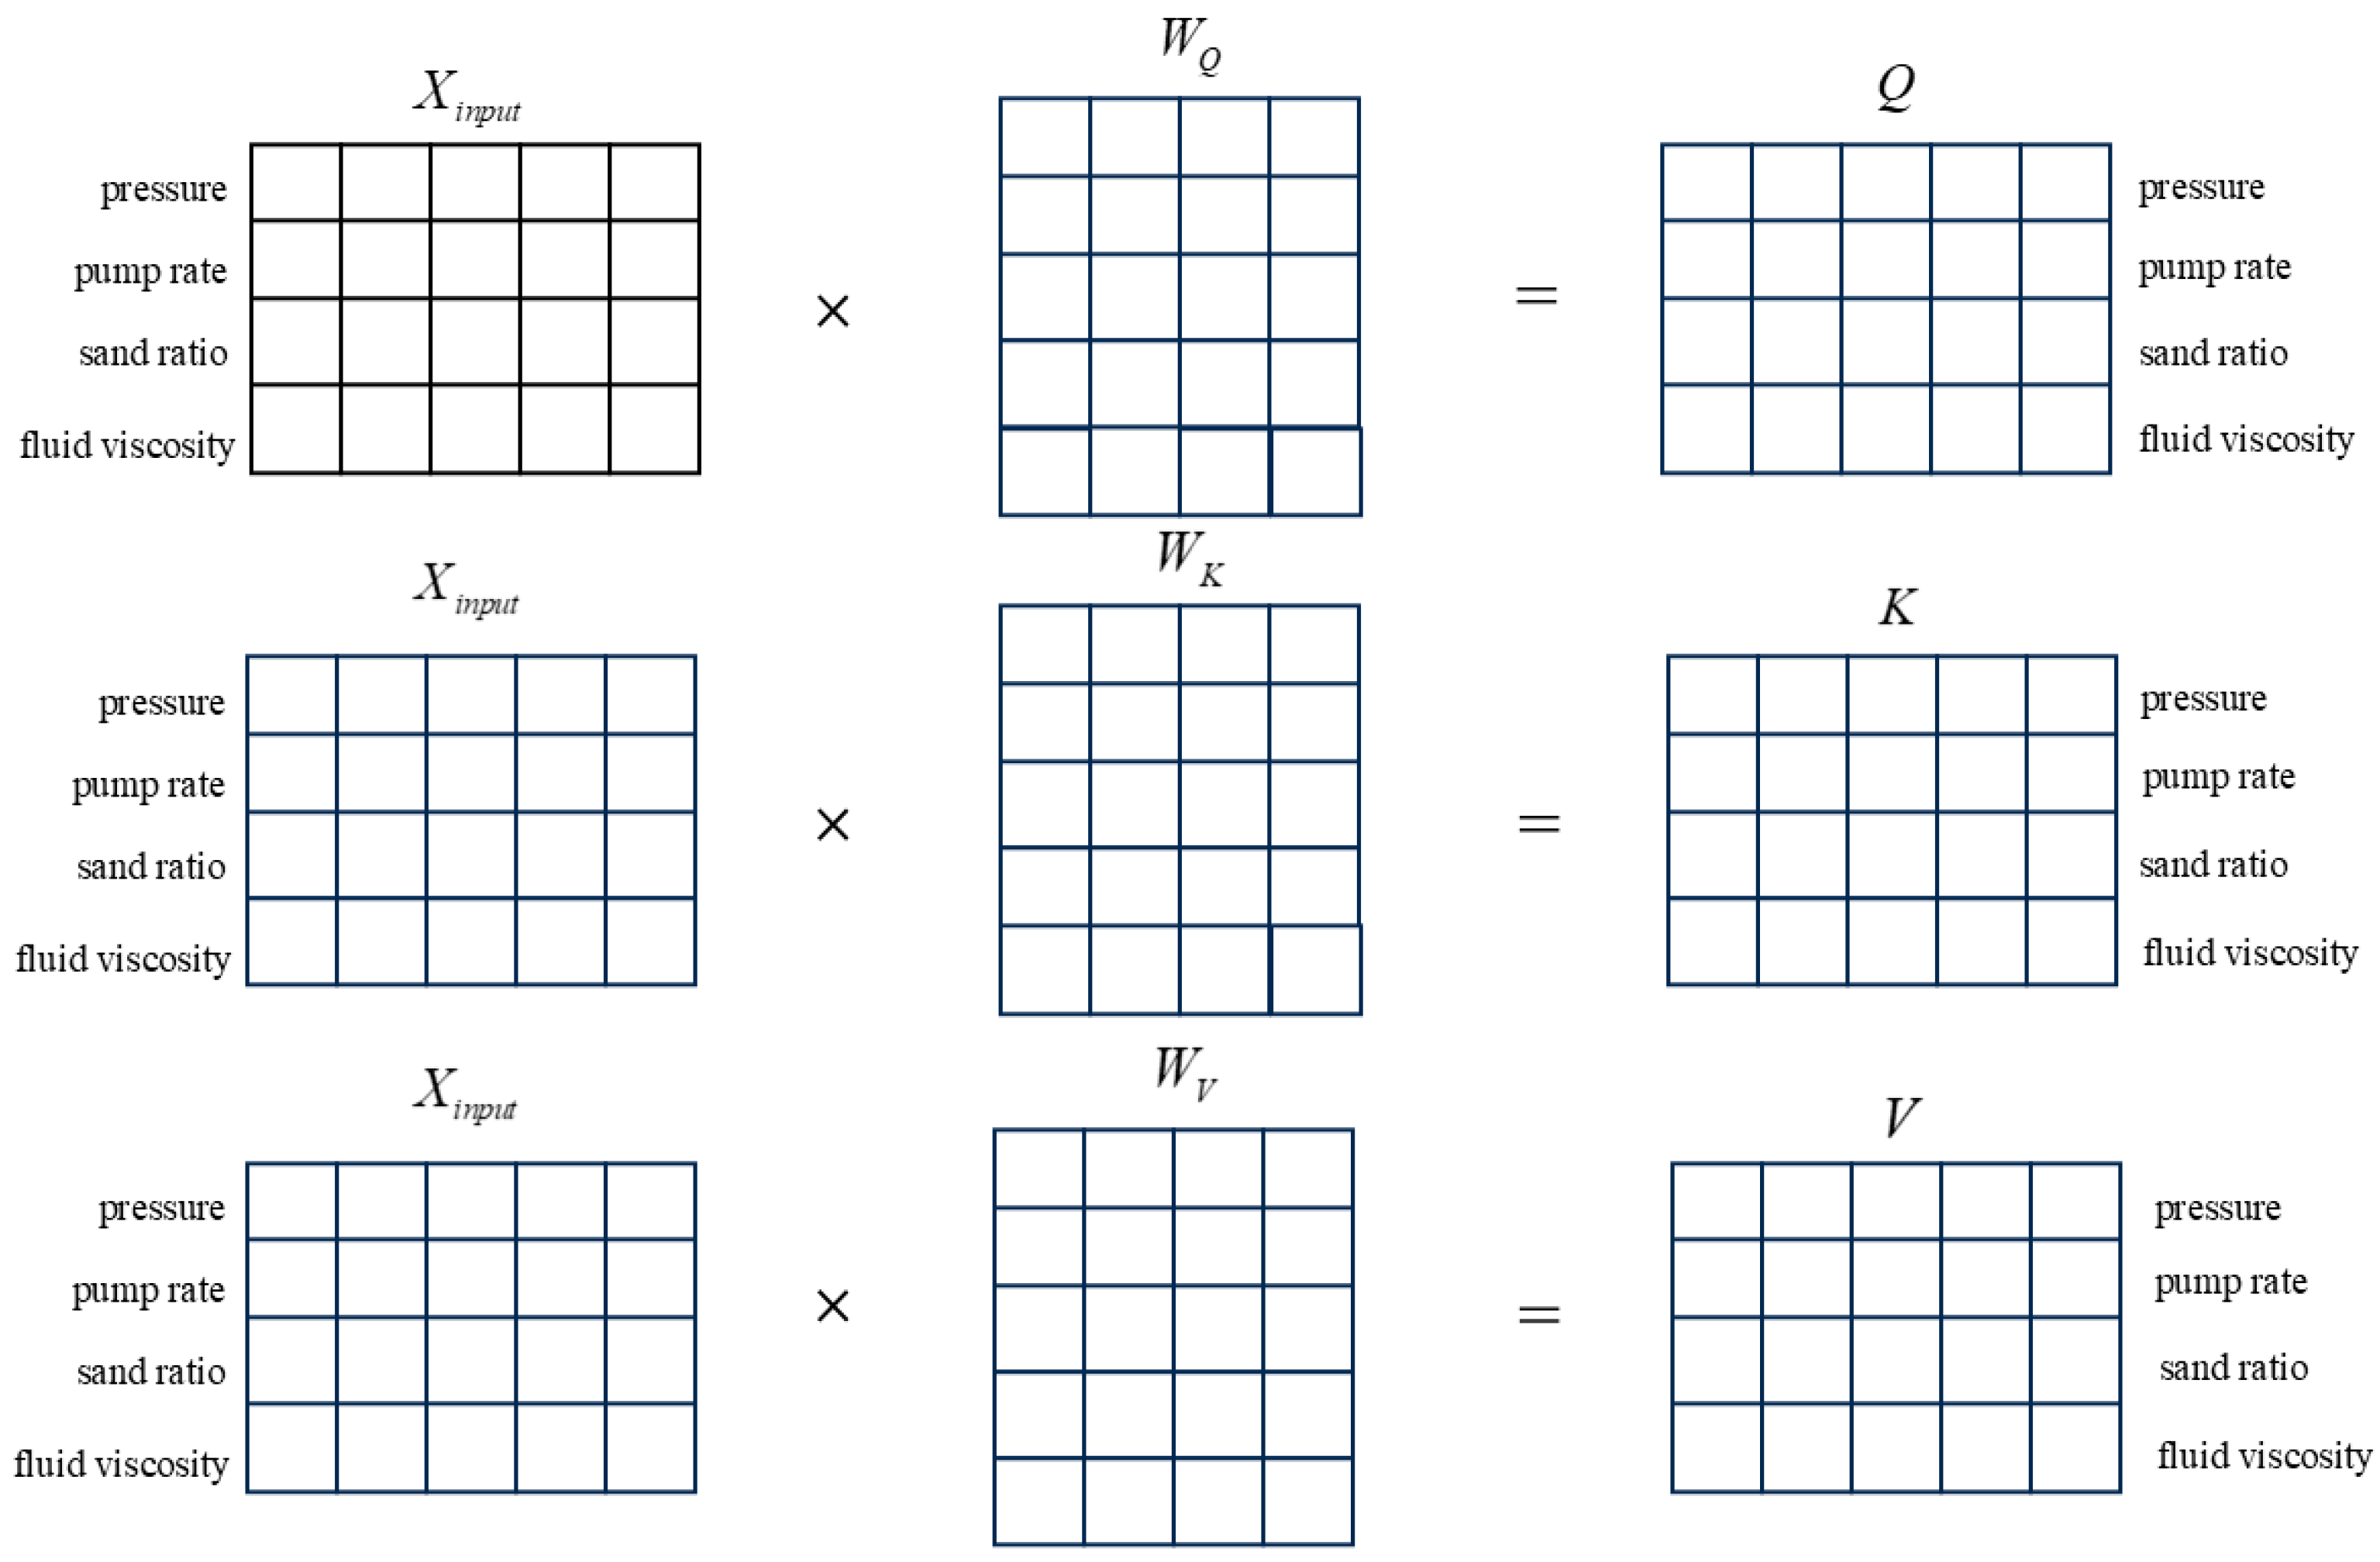
The self-attention mechanism first calculates the input sequence Query (Q), Key (K), and Value (V), and the calculation formulas are shown in Equations (2)–(4). The calculation process of Q, K, and V in the pressure prediction process is shown in Figure 3. During the calculation process, the model performs a weighted average on the input of each position, with weights determined by the input of other positions, to capture the relationships between different positions.
where , and represent the weight matrix. Next, the model calculates attention weights using Q, K, and V, with the specific formula shown in Equation (5).
where is the dimension of the key vector, softmax is the activation function used for multiclassification, and is a scaling factor used to prevent the dot product from being too large.
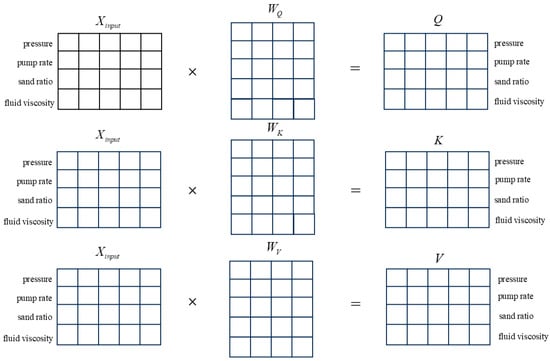
Figure 3.
The calculation process of the self-attention mechanism.
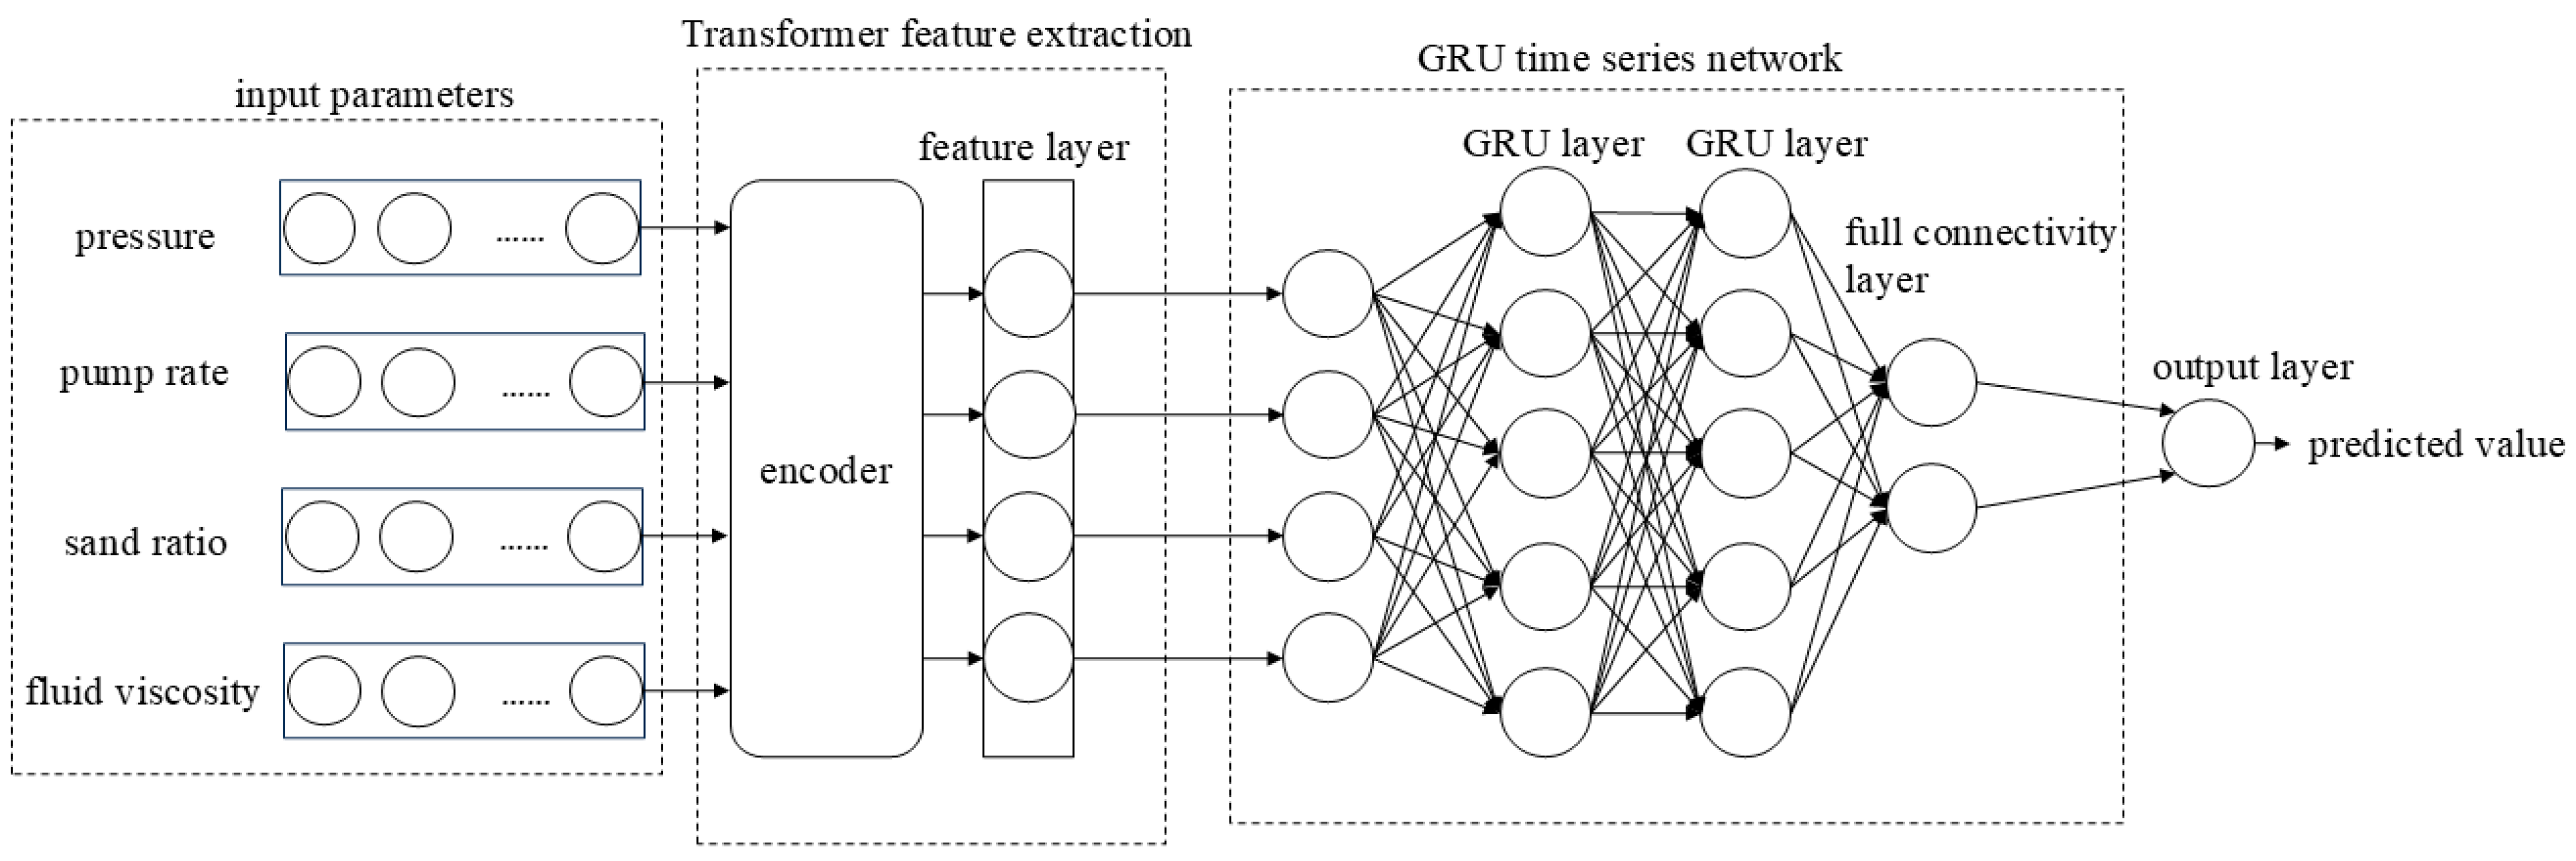
GRU can capture parameter information and long-term dependencies on pressure in fracturing pressure data, while Transformer can effectively capture the relationship between any two positions in fracturing pressure data, thus dealing with long-distance dependency problems and greatly avoiding the influence of noise in the original data on pressure prediction. Therefore, this paper connected GRU and Transformer to establish a GRU-Transformer model, mainly by inputting normalized fracturing construction data. Transformer uses an encoder to perform a high-dimensional transformation on fracturing construction, captures its data features, and transmits the data to GRU for pressure prediction. The structure of the GRU-Transformer model is shown in Figure 4.
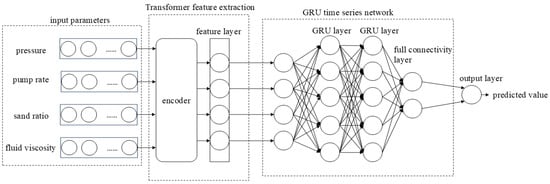
Figure 4.
GRU-Transformer model.
2.2.2. Crested Porcupine Optimizer
CPO is a nature-inspired optimisation algorithm inspired by the defences of crested porcupines against predators, using four different protection mechanisms. Its optimization results are optimal compared to optimization algorithms such as gray wolf optimizer (GWO), whale optimization algorithm (WOA) and salp swarm algorithm (SSA) [29]. Like other population-based meta-heuristic algorithms, CPO initiates the search process by initialising a set of individuals as shown in Equation (6).
where is the population size, denotes the candidate solution; and denote the upper and lower bounds of the search range, respectively; and is a random number between [0, 1].
The overall after initialisation is shown in Equation (7).
where denotes the position of the solution and denotes the number of candidate solutions.
During the optimisation process, the CPO removes a number of CPs from the population to speed up convergence and reintroduces them back into the population to improve diversity and avoid falling into local minima, as shown in Equation (8).
where is the variable that determines the number of cycles; is the current function evaluation; is the maximum number of function evaluations, which is the maximum number of times a single CP attacks the target; and is the minimum number of individuals in the newly generated population, and the corresponding behaviour will occur only when it reaches a certain value.
The global exploration phase applies when the predator is far away, in which case, the CP has two defence strategies, i.e., visual defence strategy and acoustic defence strategy. The local exploitation phase applies when the predator is close, in which case, the CP has two defence strategies, i.e., odour attack strategy and physical attack strategy.
Visual defence strategy:
Acoustic defence strategy:
Odour attack strategy:
Physical attack strategy:
where is a random number based on a normal distribution;,,, and are random numbers between [0, 1]; is the optimal CP position; is the vector generated between the current CP and the random CP; is a randomly generated binary vector of 0 or 1; is a parameter controlling the search direction; is a defence factor; ; is an odour diffusion factor; and is a convergence speed factor. The specific calculation process can be found in [29].
CPO optimization of GRU models can avoid problems such as gradient vanishing or exploding, help GRU models find better parameter configurations, improve their performance in predicting fracturing pressure, and enhance GRU’s robustness and generalization ability.
2.2.3. Combination Neural Network Prediction Process
The pressure prediction process adopts a sliding window mode along the time axis to achieve data partitioning, and the data shape is a window at the end of the time when the dataset is reached. The input variables are construction parameters such as pressure, time, displacement, liquid viscosity, and sand ratio. A combined neural network model is established through CPO, GRU, and Transformer to simulate the nonlinear relationship between pressure and construction parameter data, and finally, output the predicted pressure data. The implementation process of the composite neural network is shown in Figure 5 and the model prediction process is described. The specific process from input to output is as follows: (1) Divide the training set and the testing set; (2) Establish the GRU-Transformer model; (3) Model training and CPO optimization of model parameters; (4) Input the test set for prediction; (5) Output of pressure prediction results.
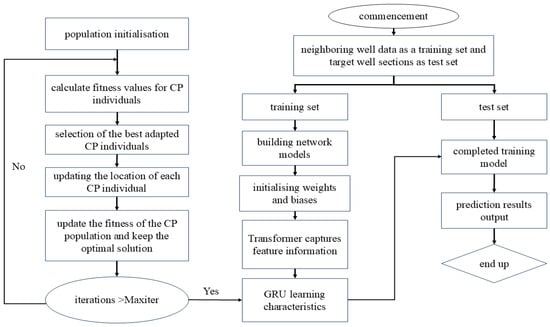
Figure 5.
Implementation process of combination neural network.
2.3. Physical Model
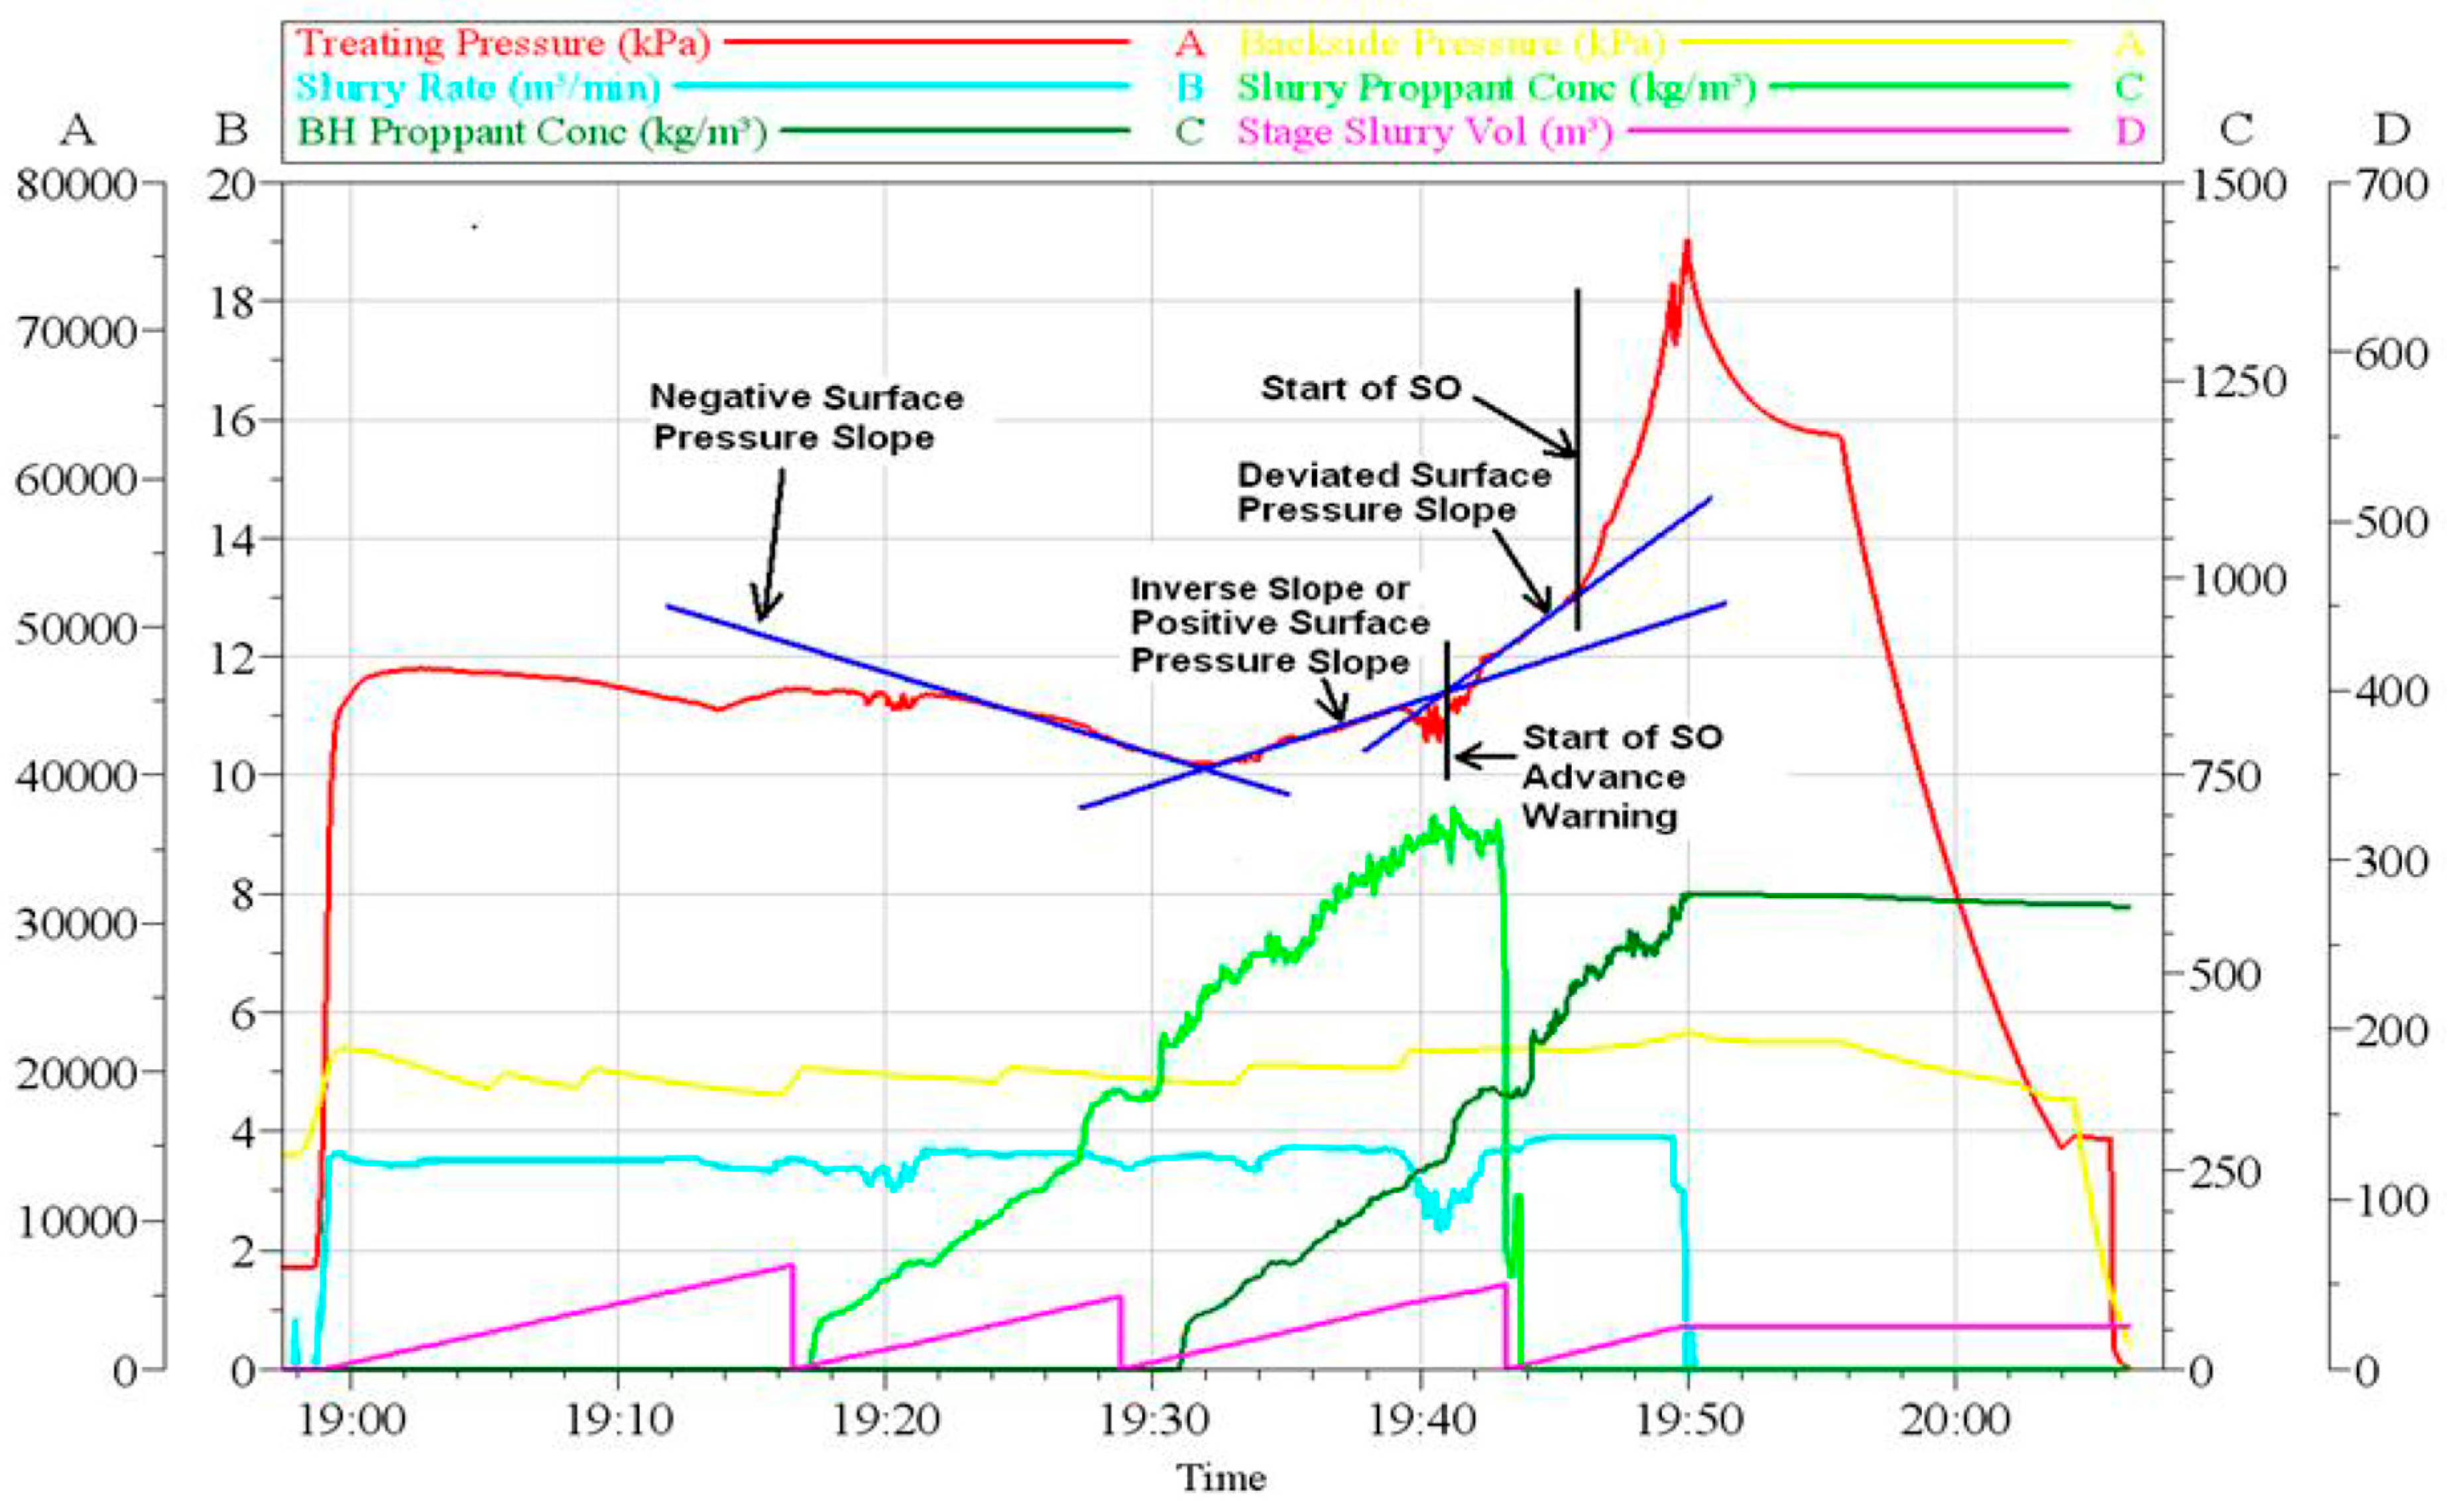
The slope inversion method avoids the problem of calculating the net pressure and has been applied with good results in some fields [30], the implementation of which is shown in Figure 6. However, its prediction performance deteriorates in certain complex scenarios. For instance, when there are continuous fluctuations in pressure, the model tends to produce a higher rate of false alarms. This results in an ineffective warning system that fails to provide reliable information for predicting sand screenout.
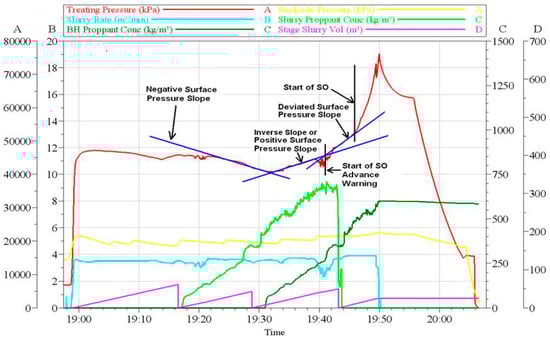
Figure 6.
Slope reversal method process [4].
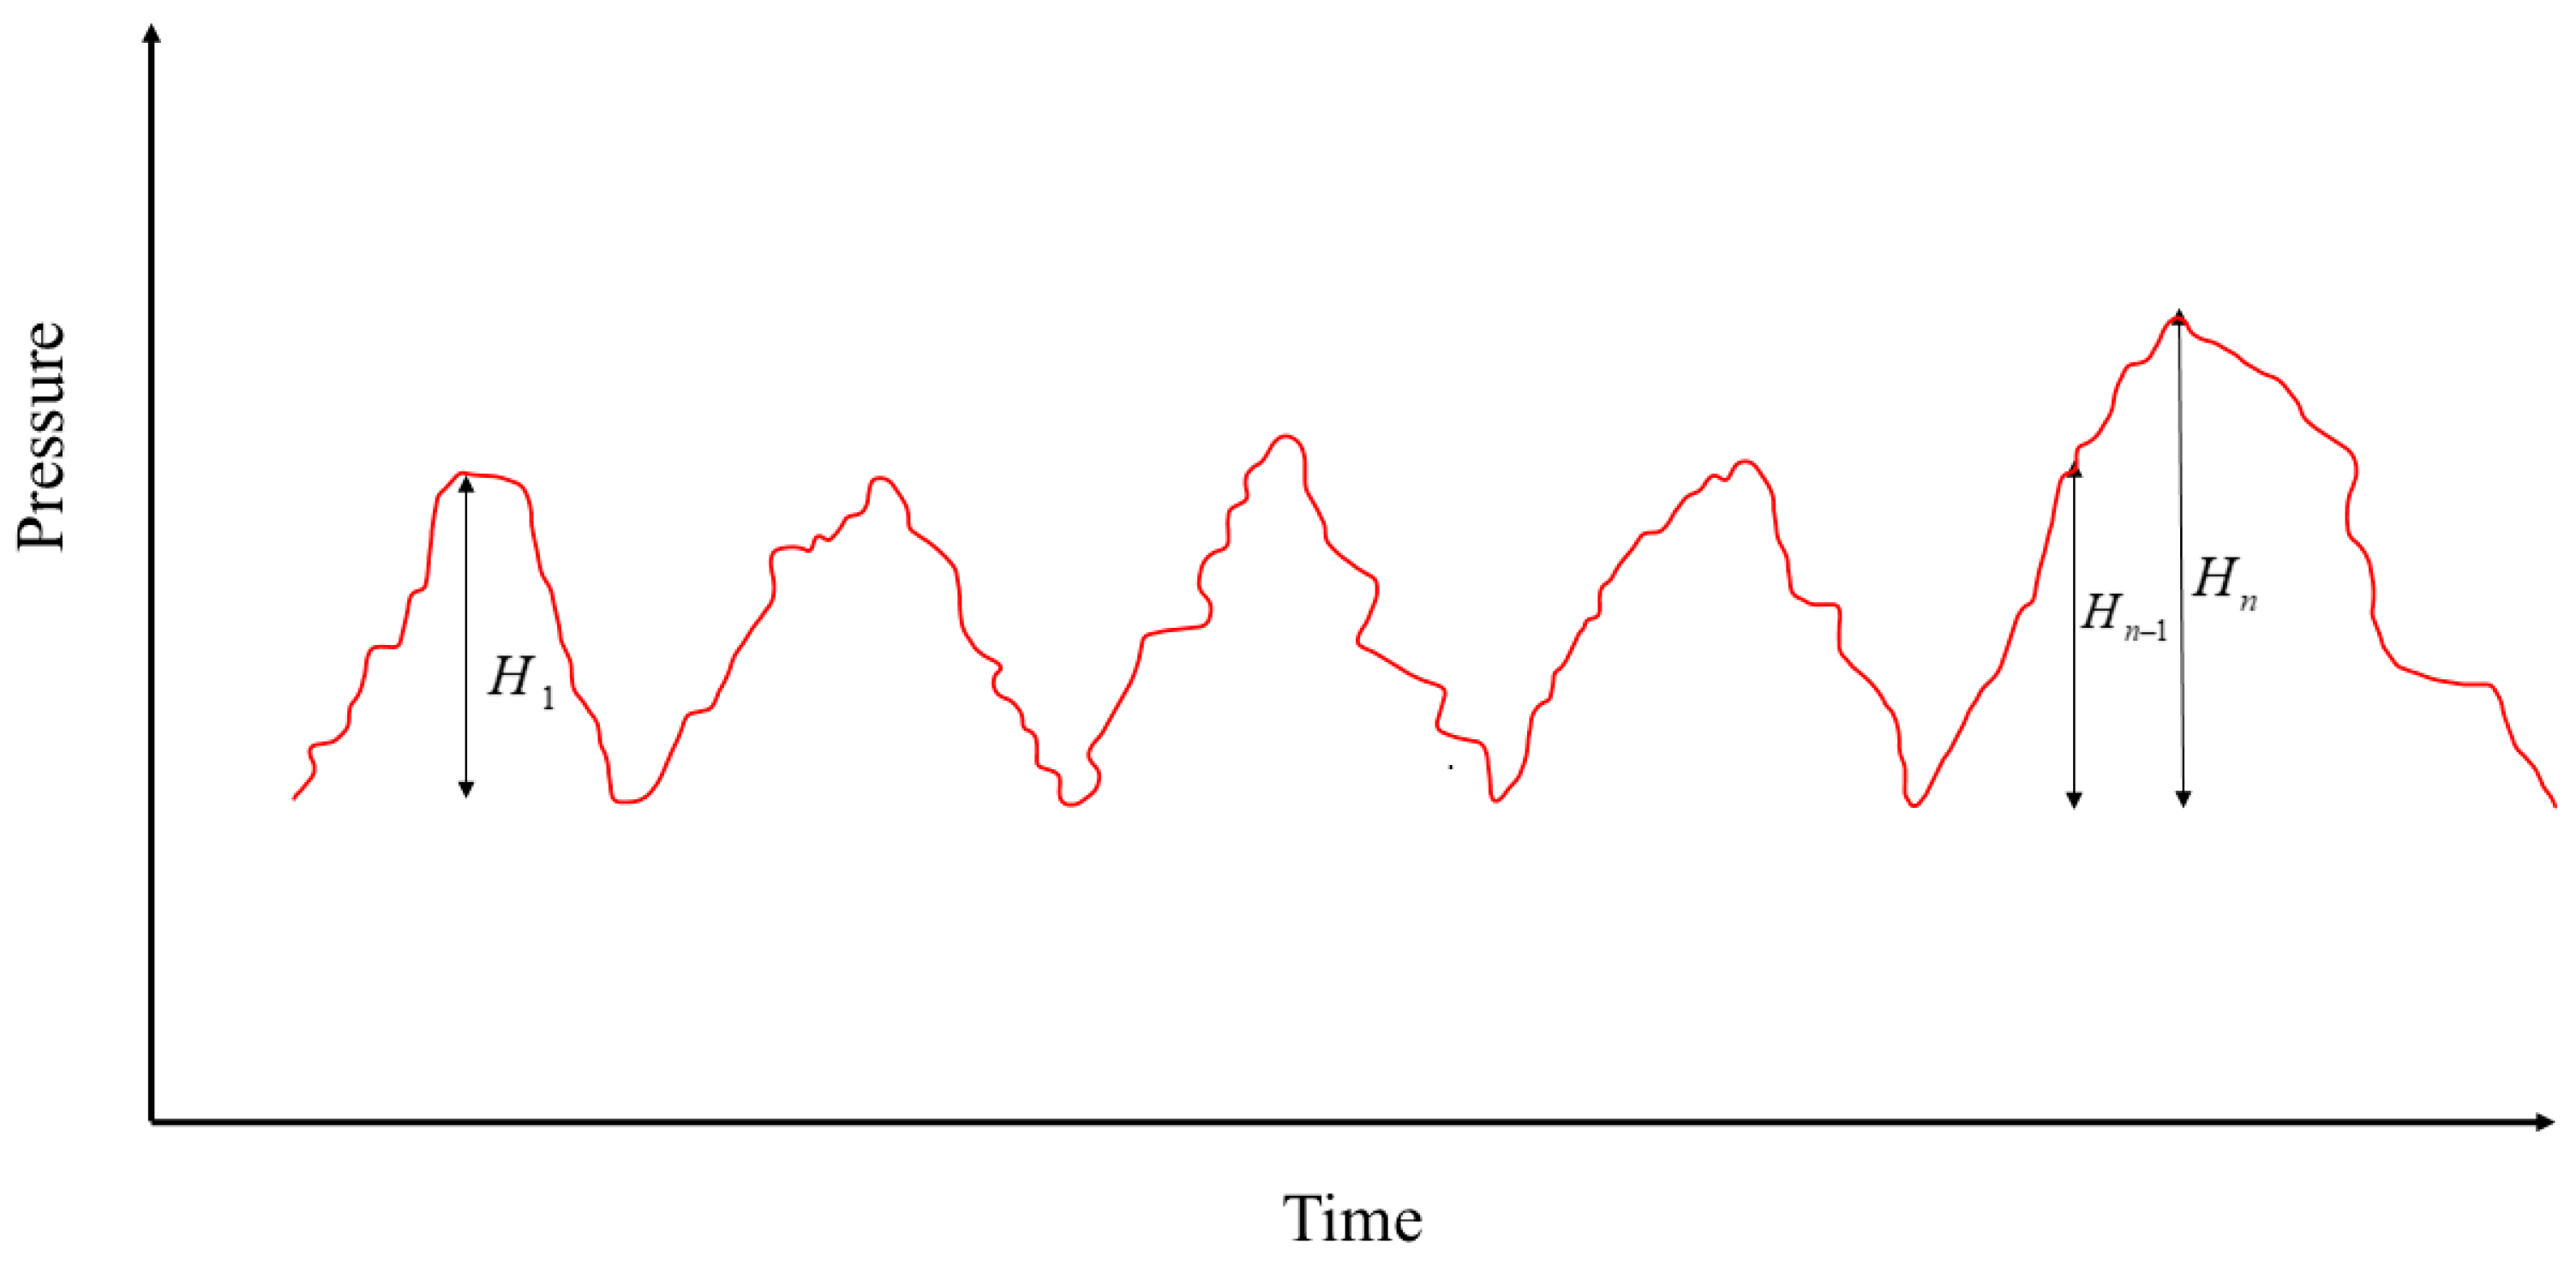
To save computational efficiency and provide a more intuitive sand screenout warning, the physical model proposed in this paper is improved based on the slope reversal method. Based on the research of some scholars on sand screenout [31,32,33] and the analysis of oilfield data, it is found that an important characteristic of fracturing pressure when sand screenout is about to occur is the formation of an abnormal peak, which is also the basis of the slope reversal method. However, it does not consider the relationship between the maximum and minimum values of the peak, that is, the threshold, as shown in Figure 7. The maximum and minimum difference for one cycle under normal construction conditions will not exceed this range for subsequent construction cycles. However, the last peak has reached the difference range at , but its difference continues to soar to , indicating that sand screenout may occur in this area and sand-stopping operations are needed to avoid sand screenout. Based on this, this article has added evaluation criteria to avoid erroneous alarm situations caused by slope reversal method warning and improve the accuracy of the sand screenout warning model.
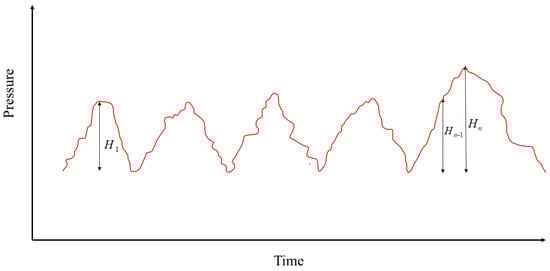
Figure 7.
Pressure surge indication.
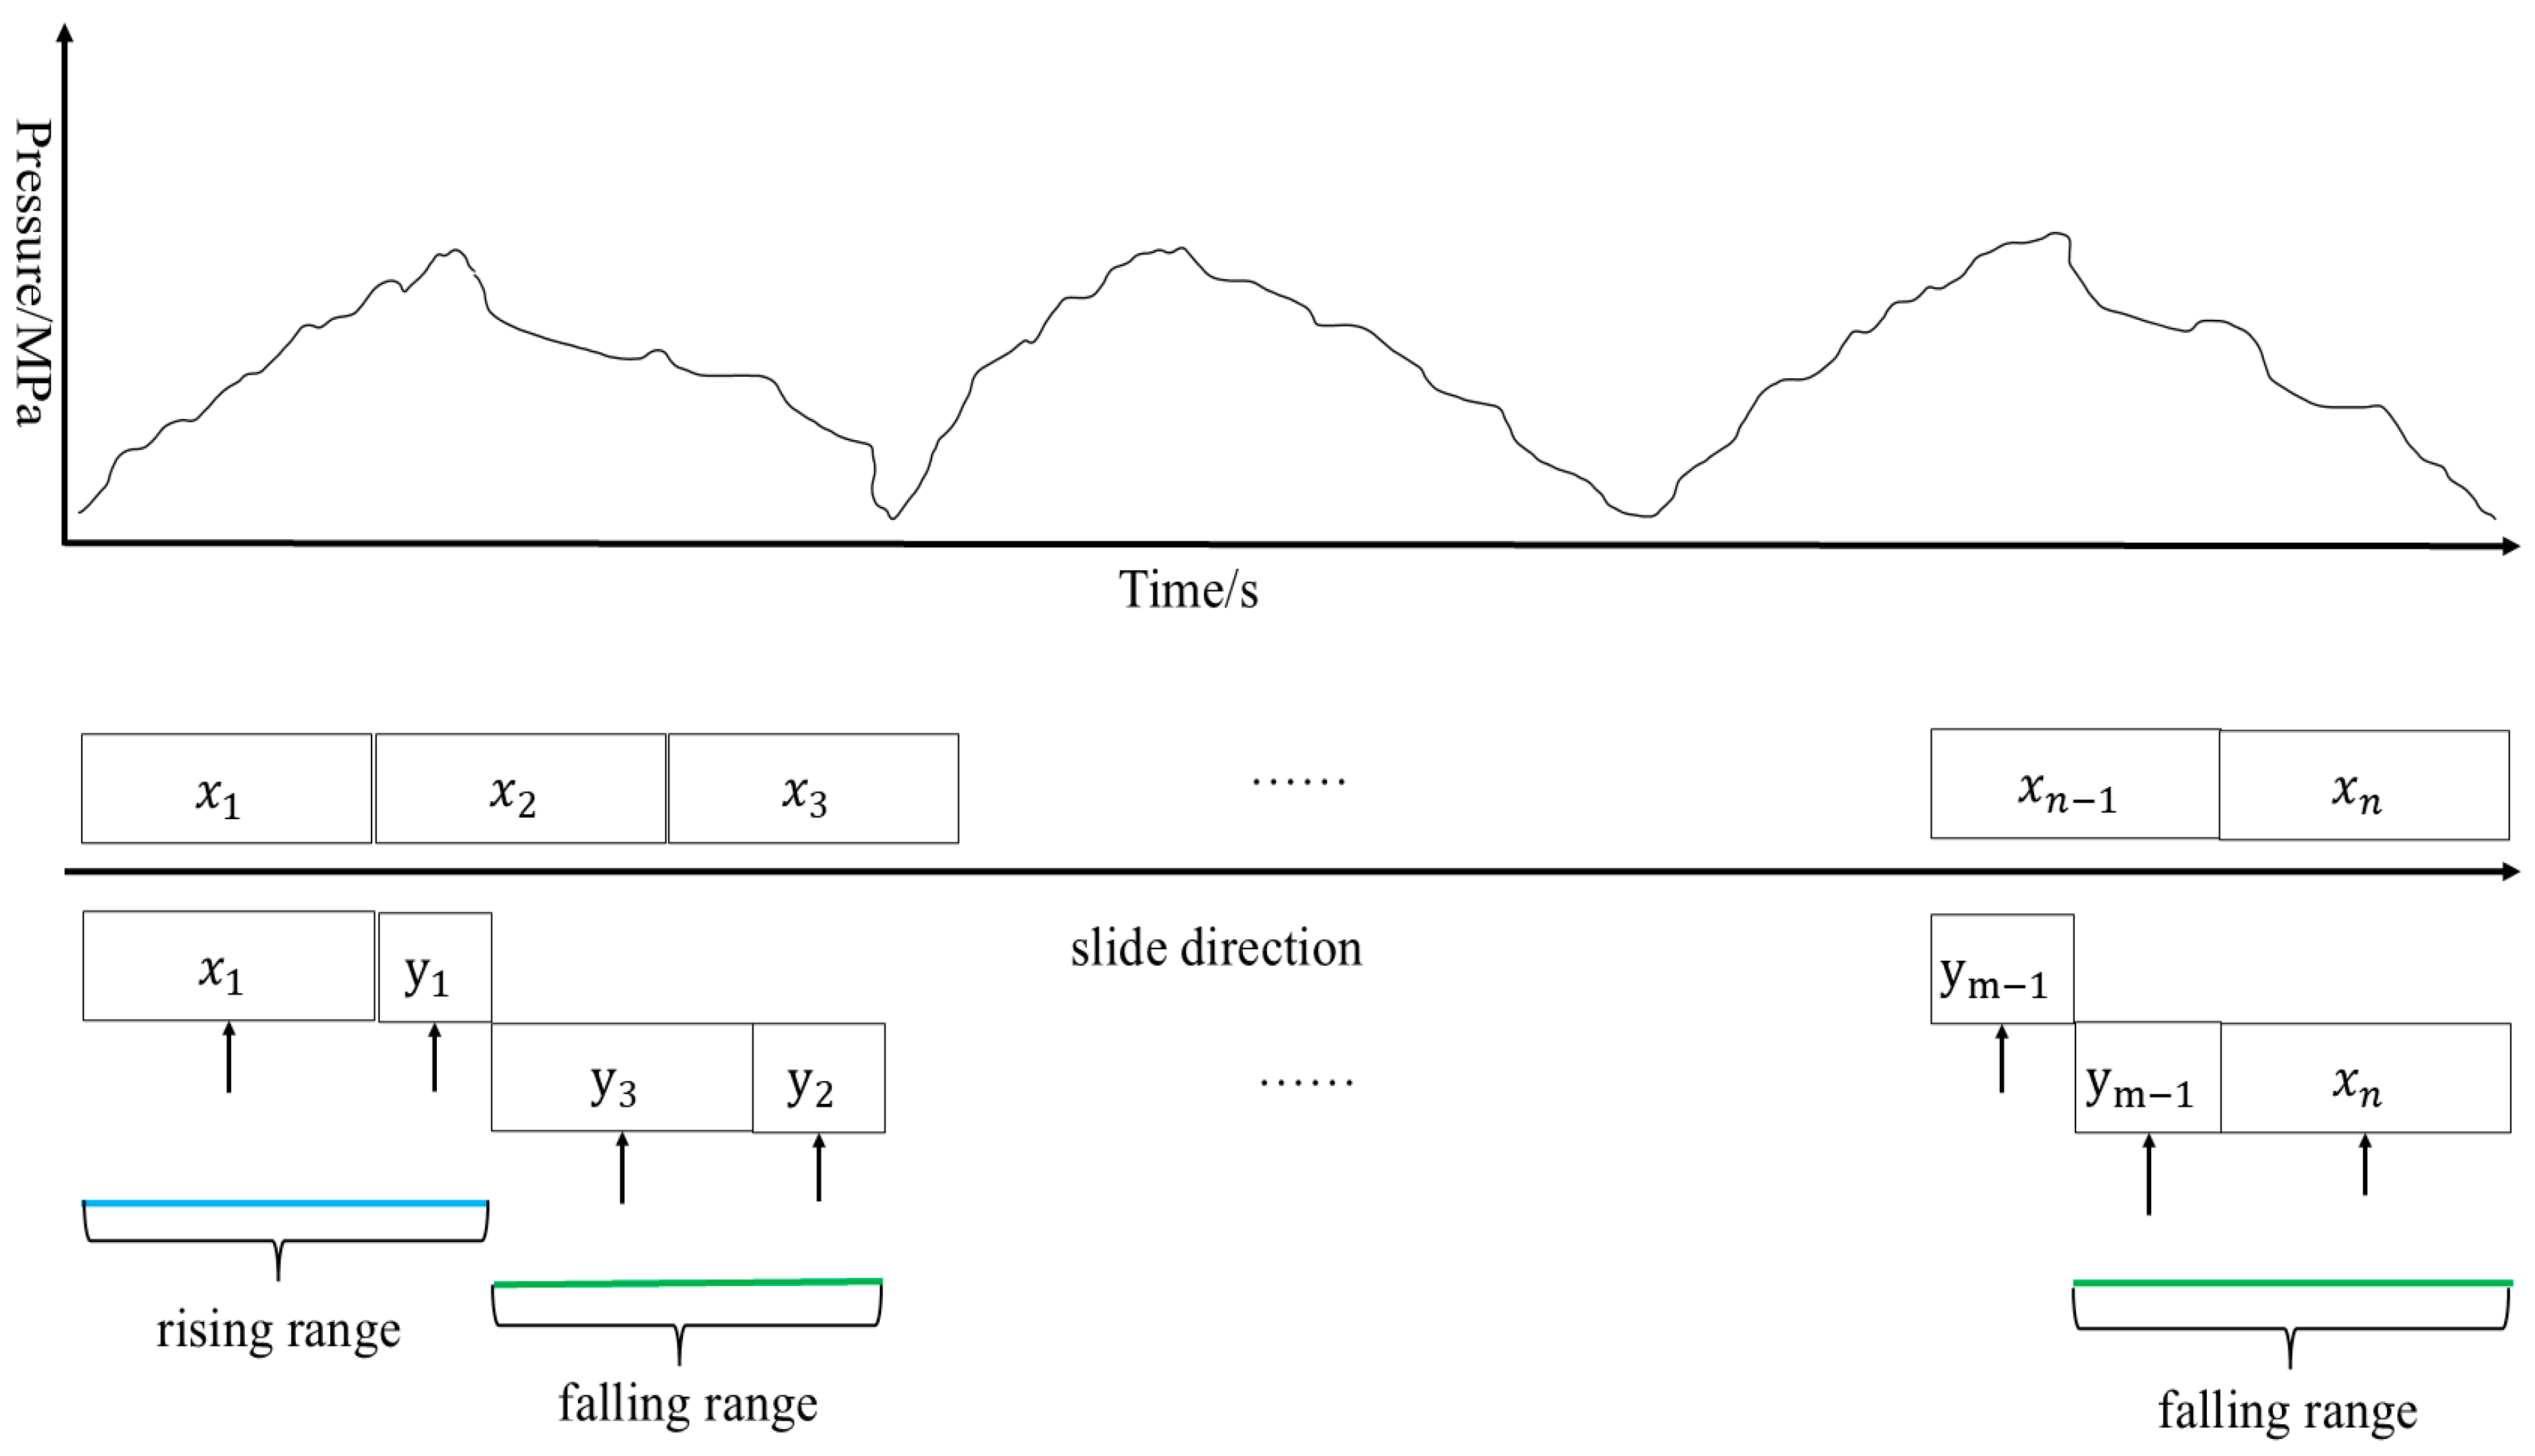
The pressure curve uses a sliding window algorithm to move the sampling for the calculation, and after calculating the slope of the model for classification, if the results are normal, then skip the sliding region; if the results are not normal, then it is sliding in turn; and if several consecutive sliding regions belong to the same type of superimposed display, then the sliding algorithm mechanism is applied as shown in Figure 8.
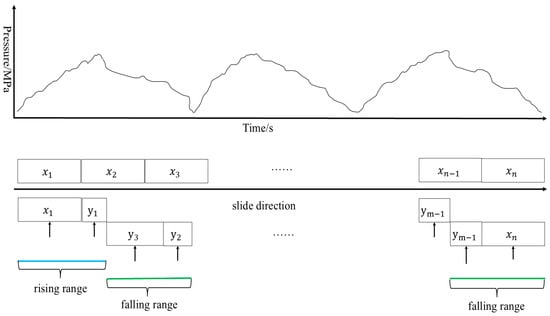
Figure 8.
Sliding Module Algorithm.
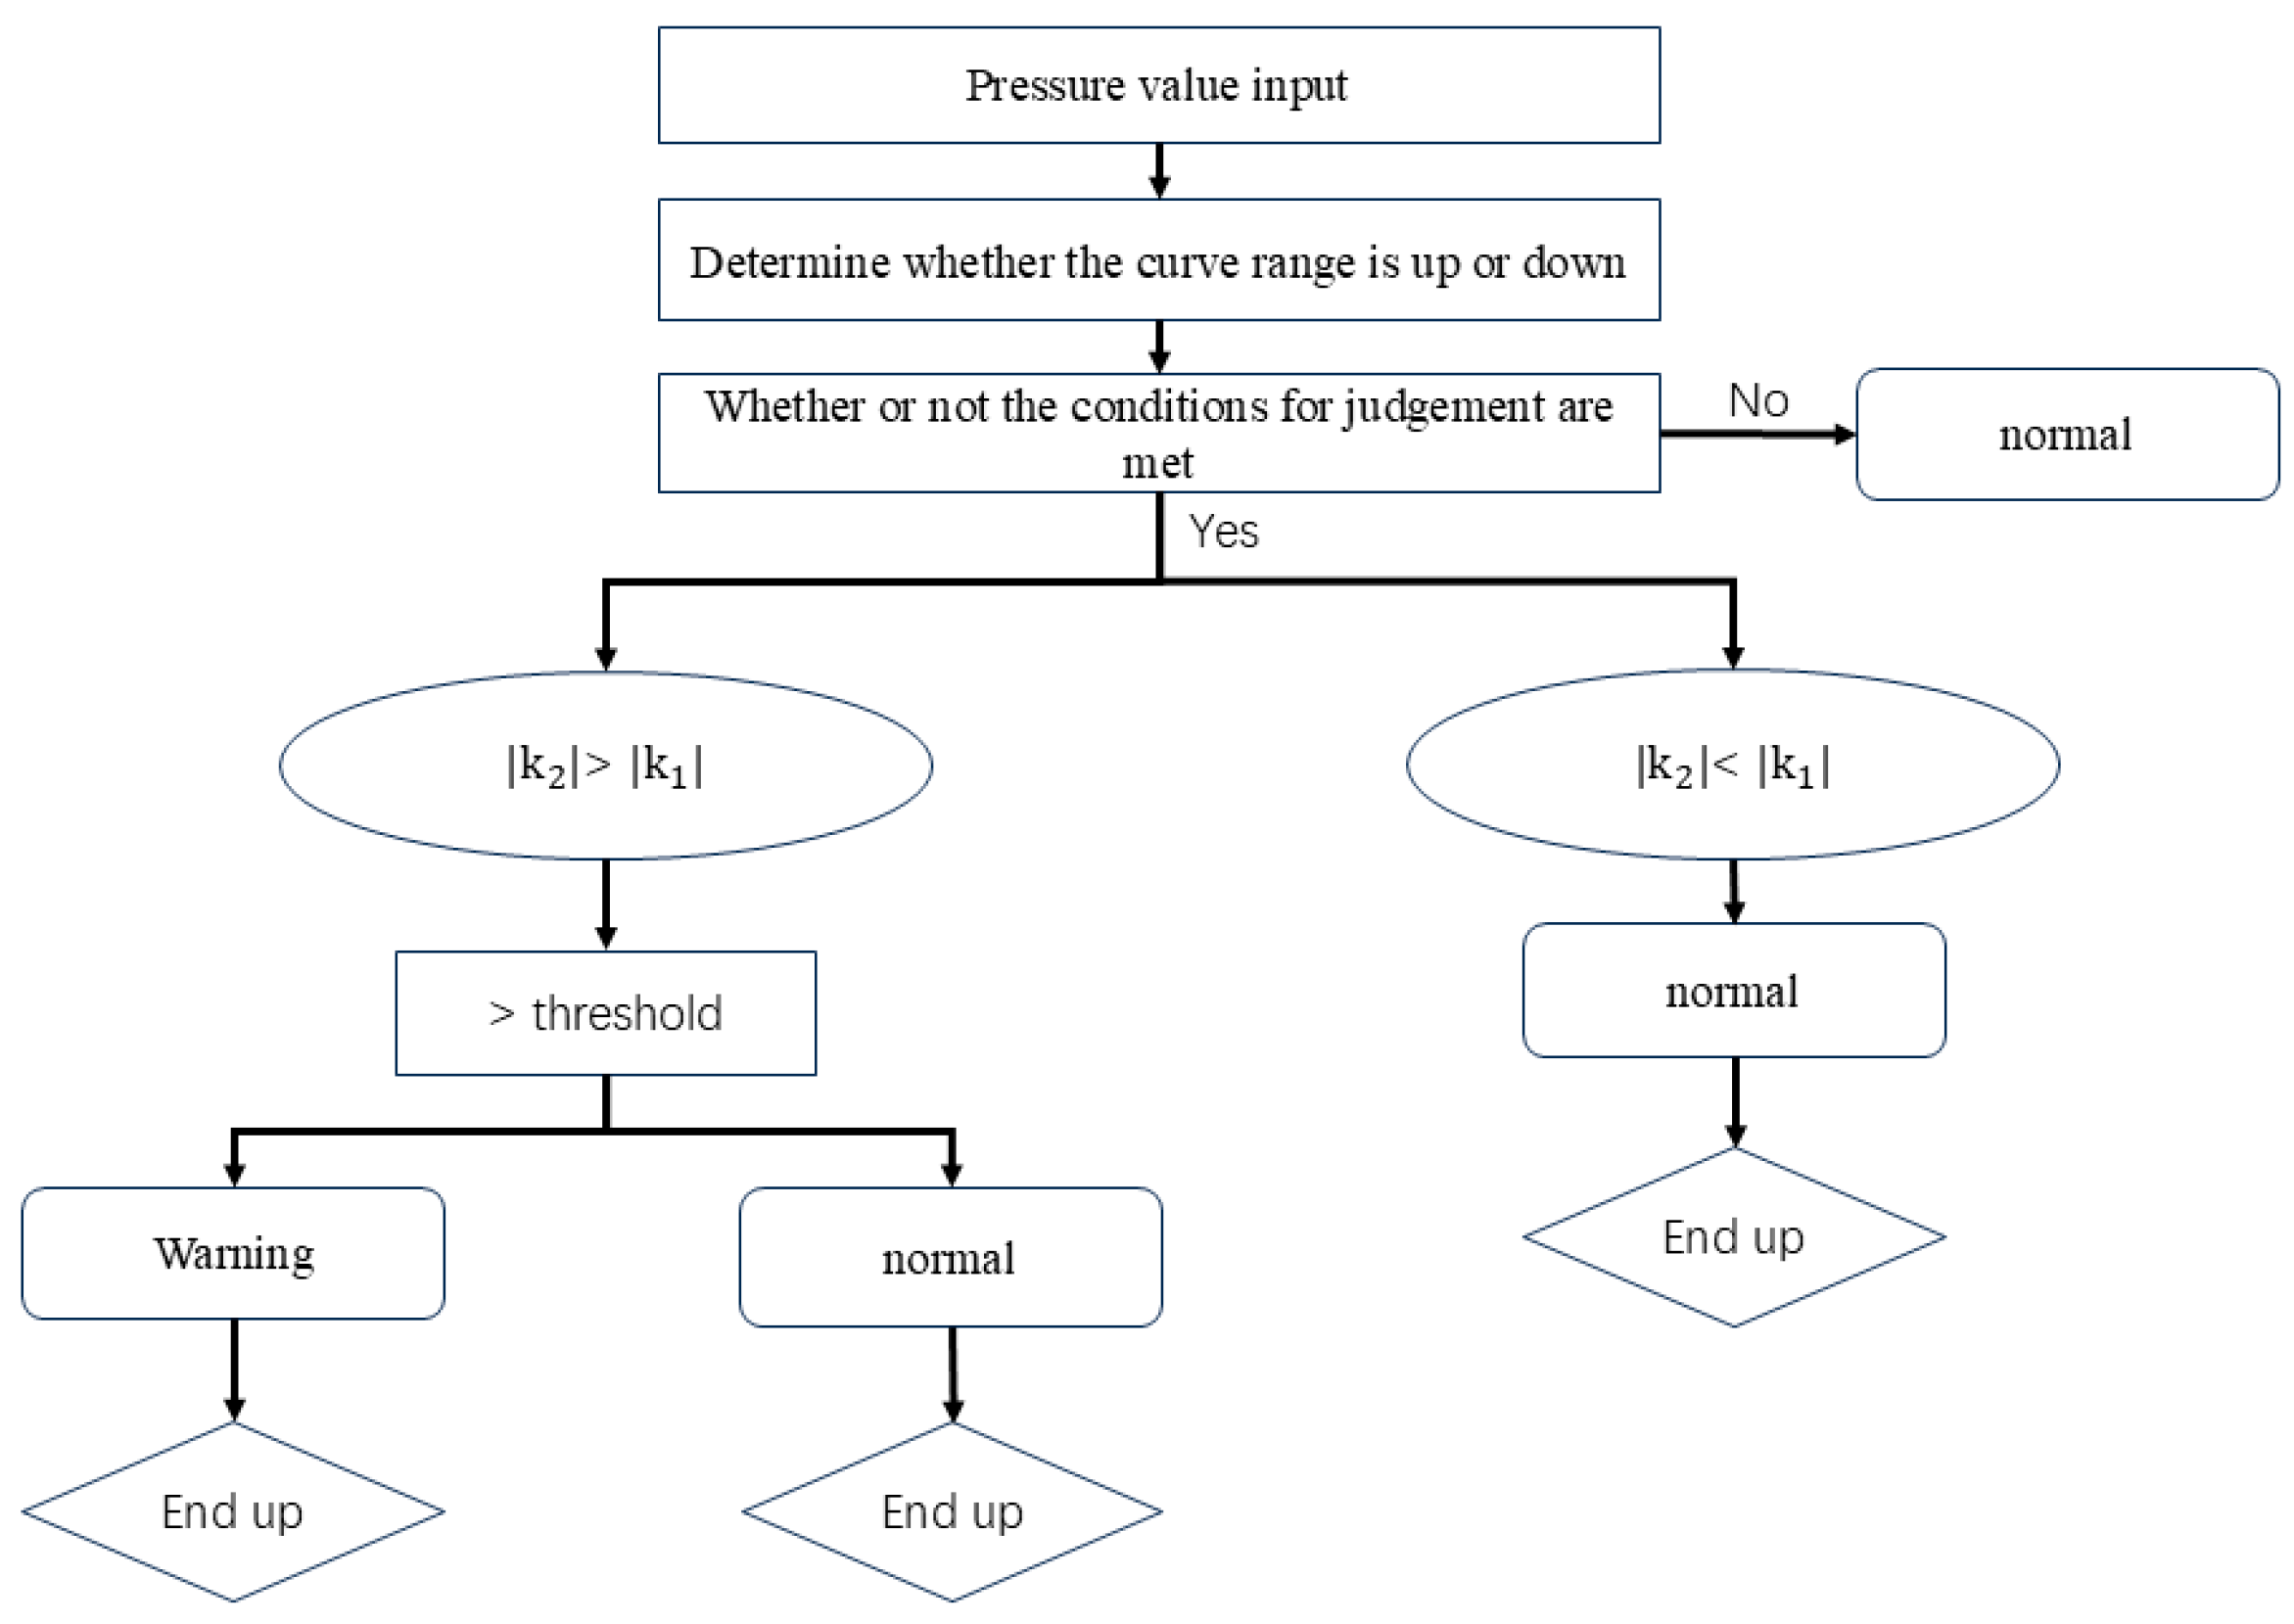
In this paper, through the extracted historical construction data of the block, the slider size is set to 30 and the threshold value is 2 MPa, and the warning level mainly consists of two kinds of normal and Class I as shown in Table 3. The physical model flow is shown in Figure 9. Additionally, the slider size and threshold can be dynamically adjusted to suit different operational environments, which enhances the stability and adaptability of the warning model. This flexibility allows for real-time tuning of the model to accommodate varying geological and operational conditions, ensuring more accurate and reliable sand screenout warnings across diverse scenarios.
Table 3.
Sand screenout warning level.
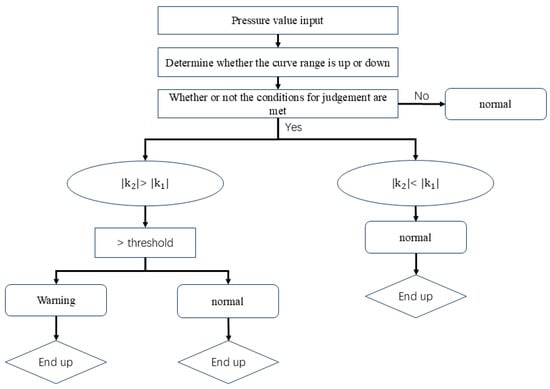
Figure 9.
Sand screenout early warning model.
2.4. Combinatorial Model
The model proposed in this article is mainly composed of two parts: a combinatorial neural network and a physical model. The combined neural network is based on the three models of GRU, Transformer, and CPO, and establishes the CPO-GRU-Transformer model. The physical model is an improvement of the slope reversal method by adding a slider algorithm and threshold to modify it, avoiding false alarms, improving the accuracy of model warnings, and providing effective sand blocking warning information for operators.
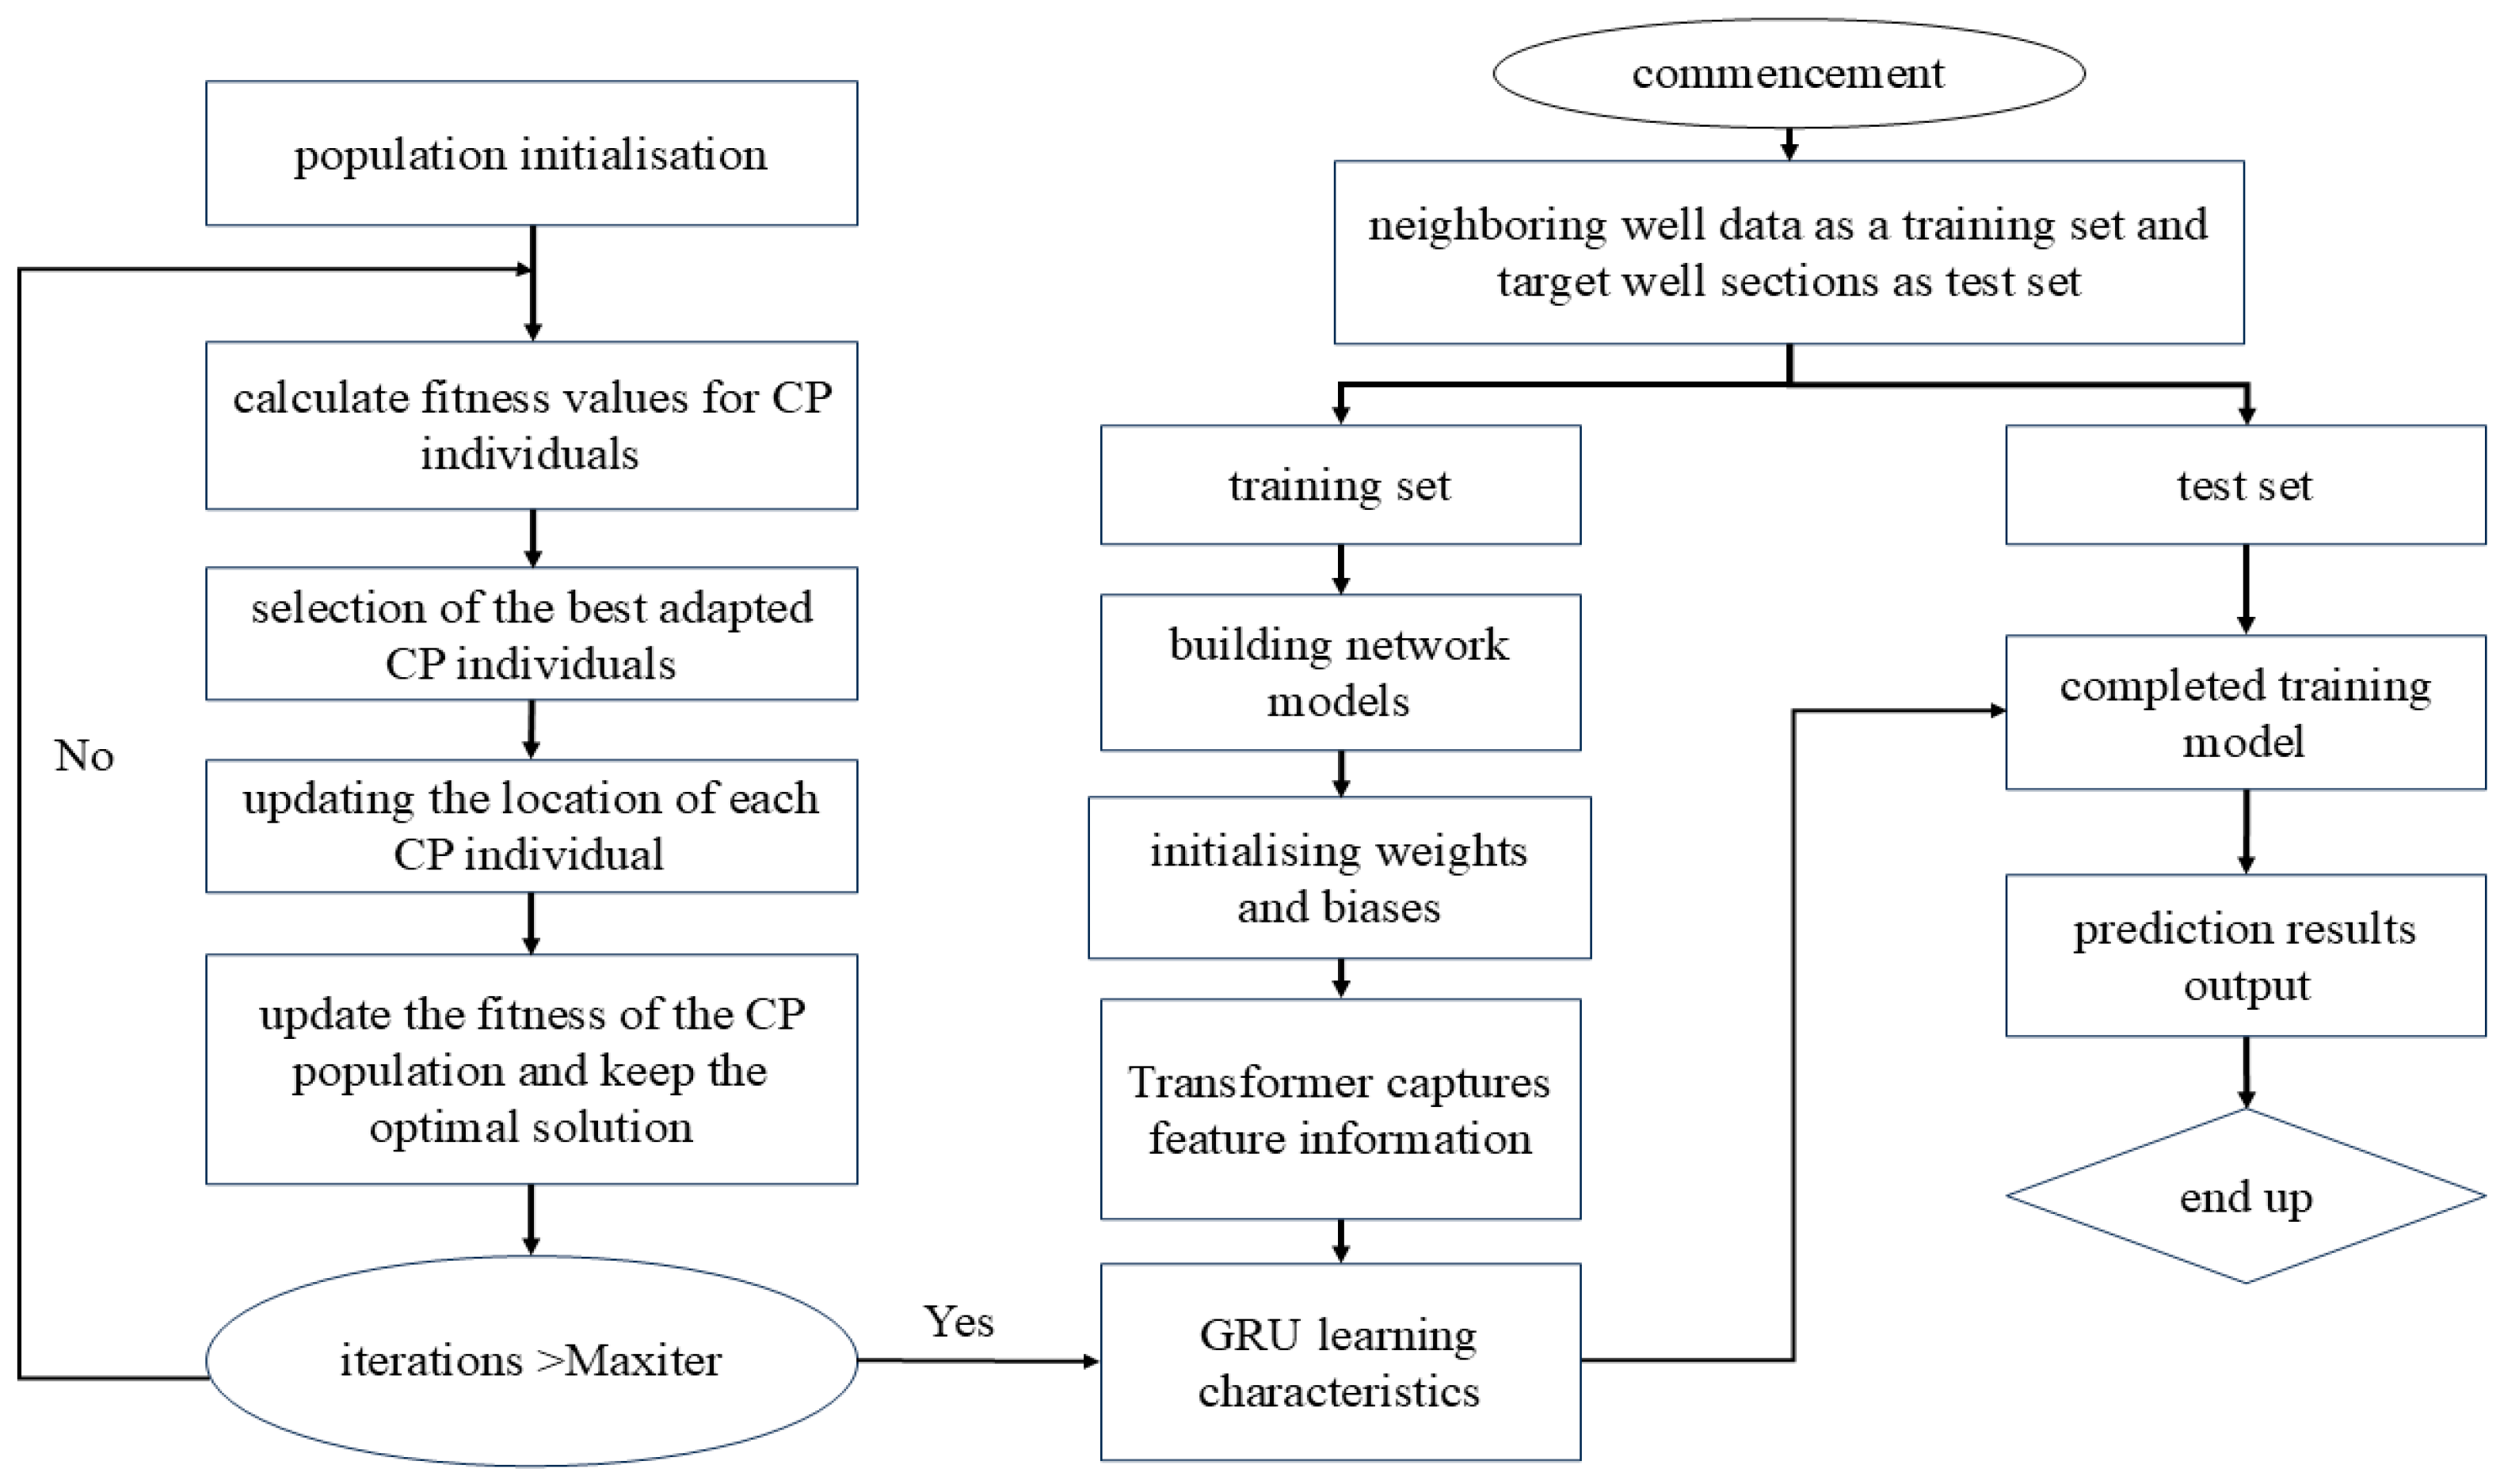
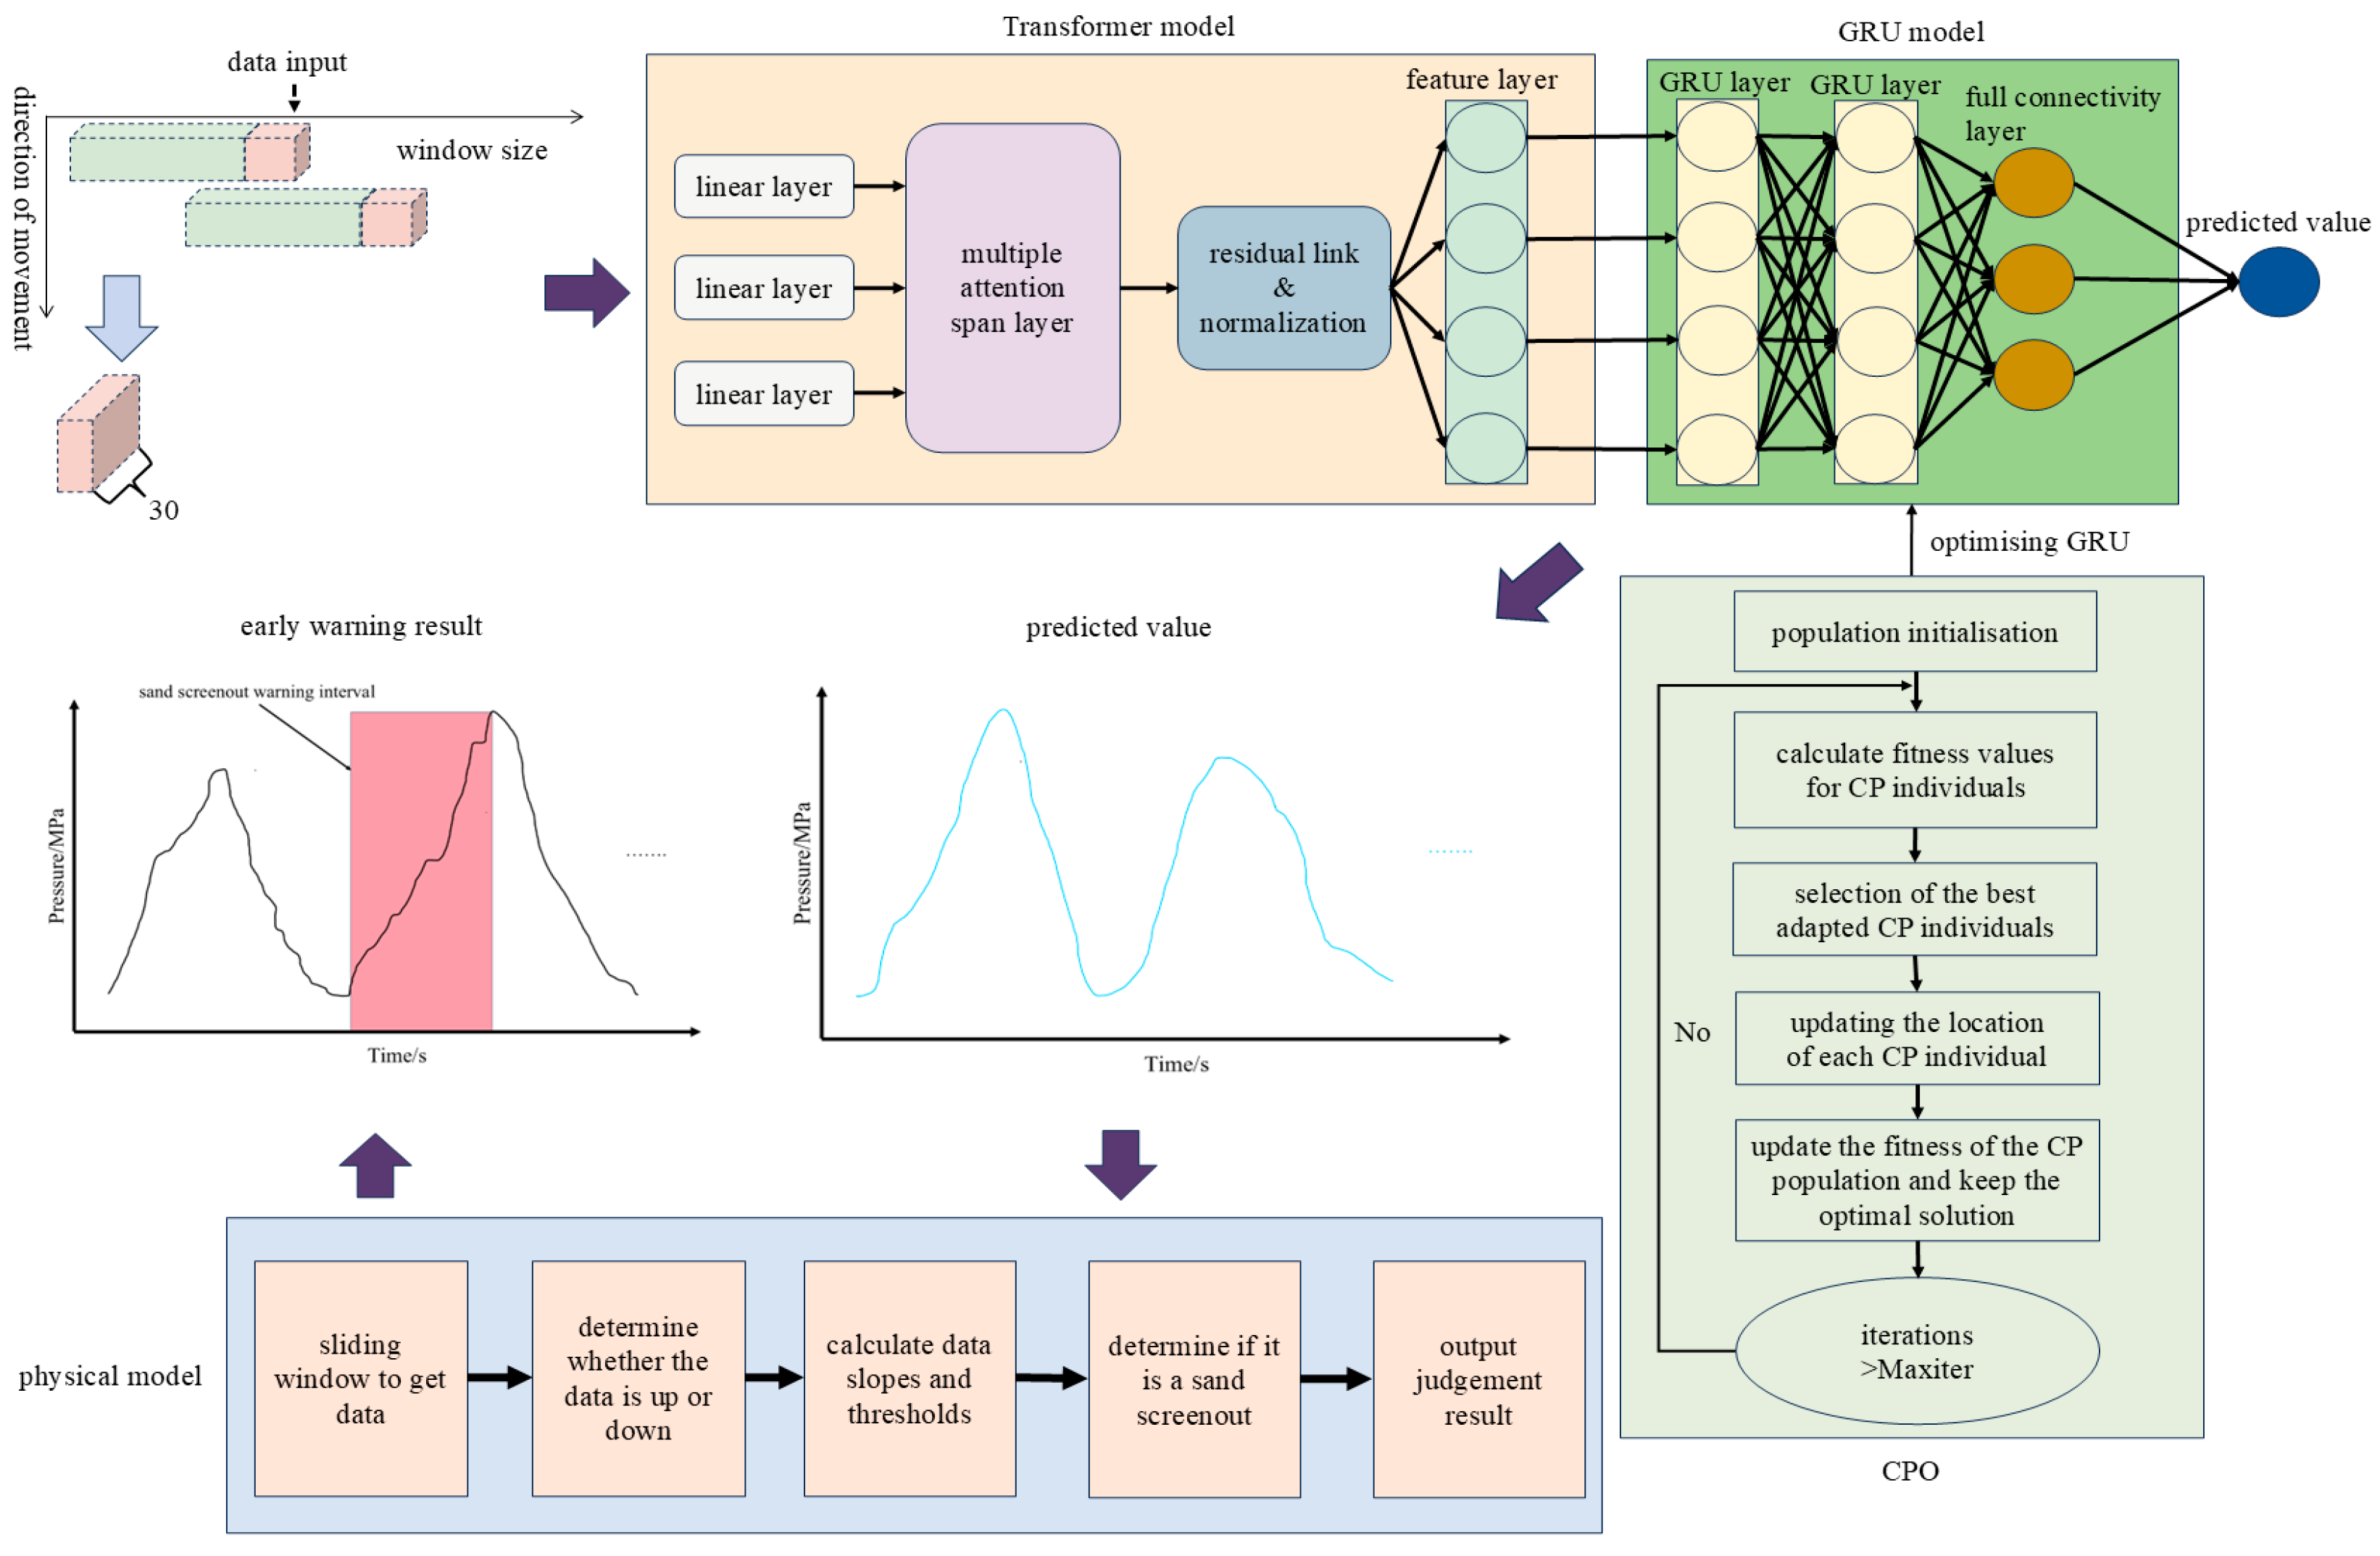
The implementation steps of a sand screenout warning model based on a combination of combinatorial neural networks and physical models are as follows: (1) sliding window extraction of time-series data sequence; (2) The Transformer model captures the nonlinear relationships of sequences; (3) GRU model training and CPO optimization of the model parameters; (4) Output the pressure prediction data; (5) The predicted results are input into the sand screenout warning model for judgement; (6) Output the judgement result. The specific implementation steps are shown in Figure 10.
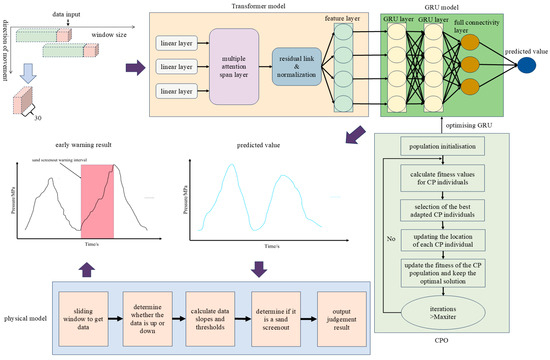
Figure 10.
Combinatorial model realisation process.
3. Results
3.1. Comparison of Pressure Prediction Models
Although traditional methods such as RSM and ANOVA are widely used in engineering modelling, they are less suitable for handling complex, nonlinear, and time-dependent data [34]. Therefore, in this paper, the mean absolute error (MAE), coefficient of determination (), and root mean square error (RMSE) were selected as the evaluation indexes for predicting the fracture pressure [35], and their calculation formulas are shown in Equations (13)–(15).
where and denote the true and predicted values of fracture pressure, respectively, and denotes the number of samples. The principle of the evaluation index is that the smaller the value of both MAE and RMSE, the higher the prediction accuracy of the model. The closer is to 1, the higher the variance of the data explained by the model, and the better the prediction.
The data used for the model comparison are from the fracturing construction data of a section of well X in this shale gas block. They are used for the pressure prediction test of the four models: LSTM model, GRU model, CPO-GRU model and CPO-GRU-Transformer model. Hyperparameter optimisation of the GRU-Transformer model was performed using CPO optimisation, and the optimised model hyperparameters are shown in Table 4.
Table 4.
CPO hyperparameter optimisation results.
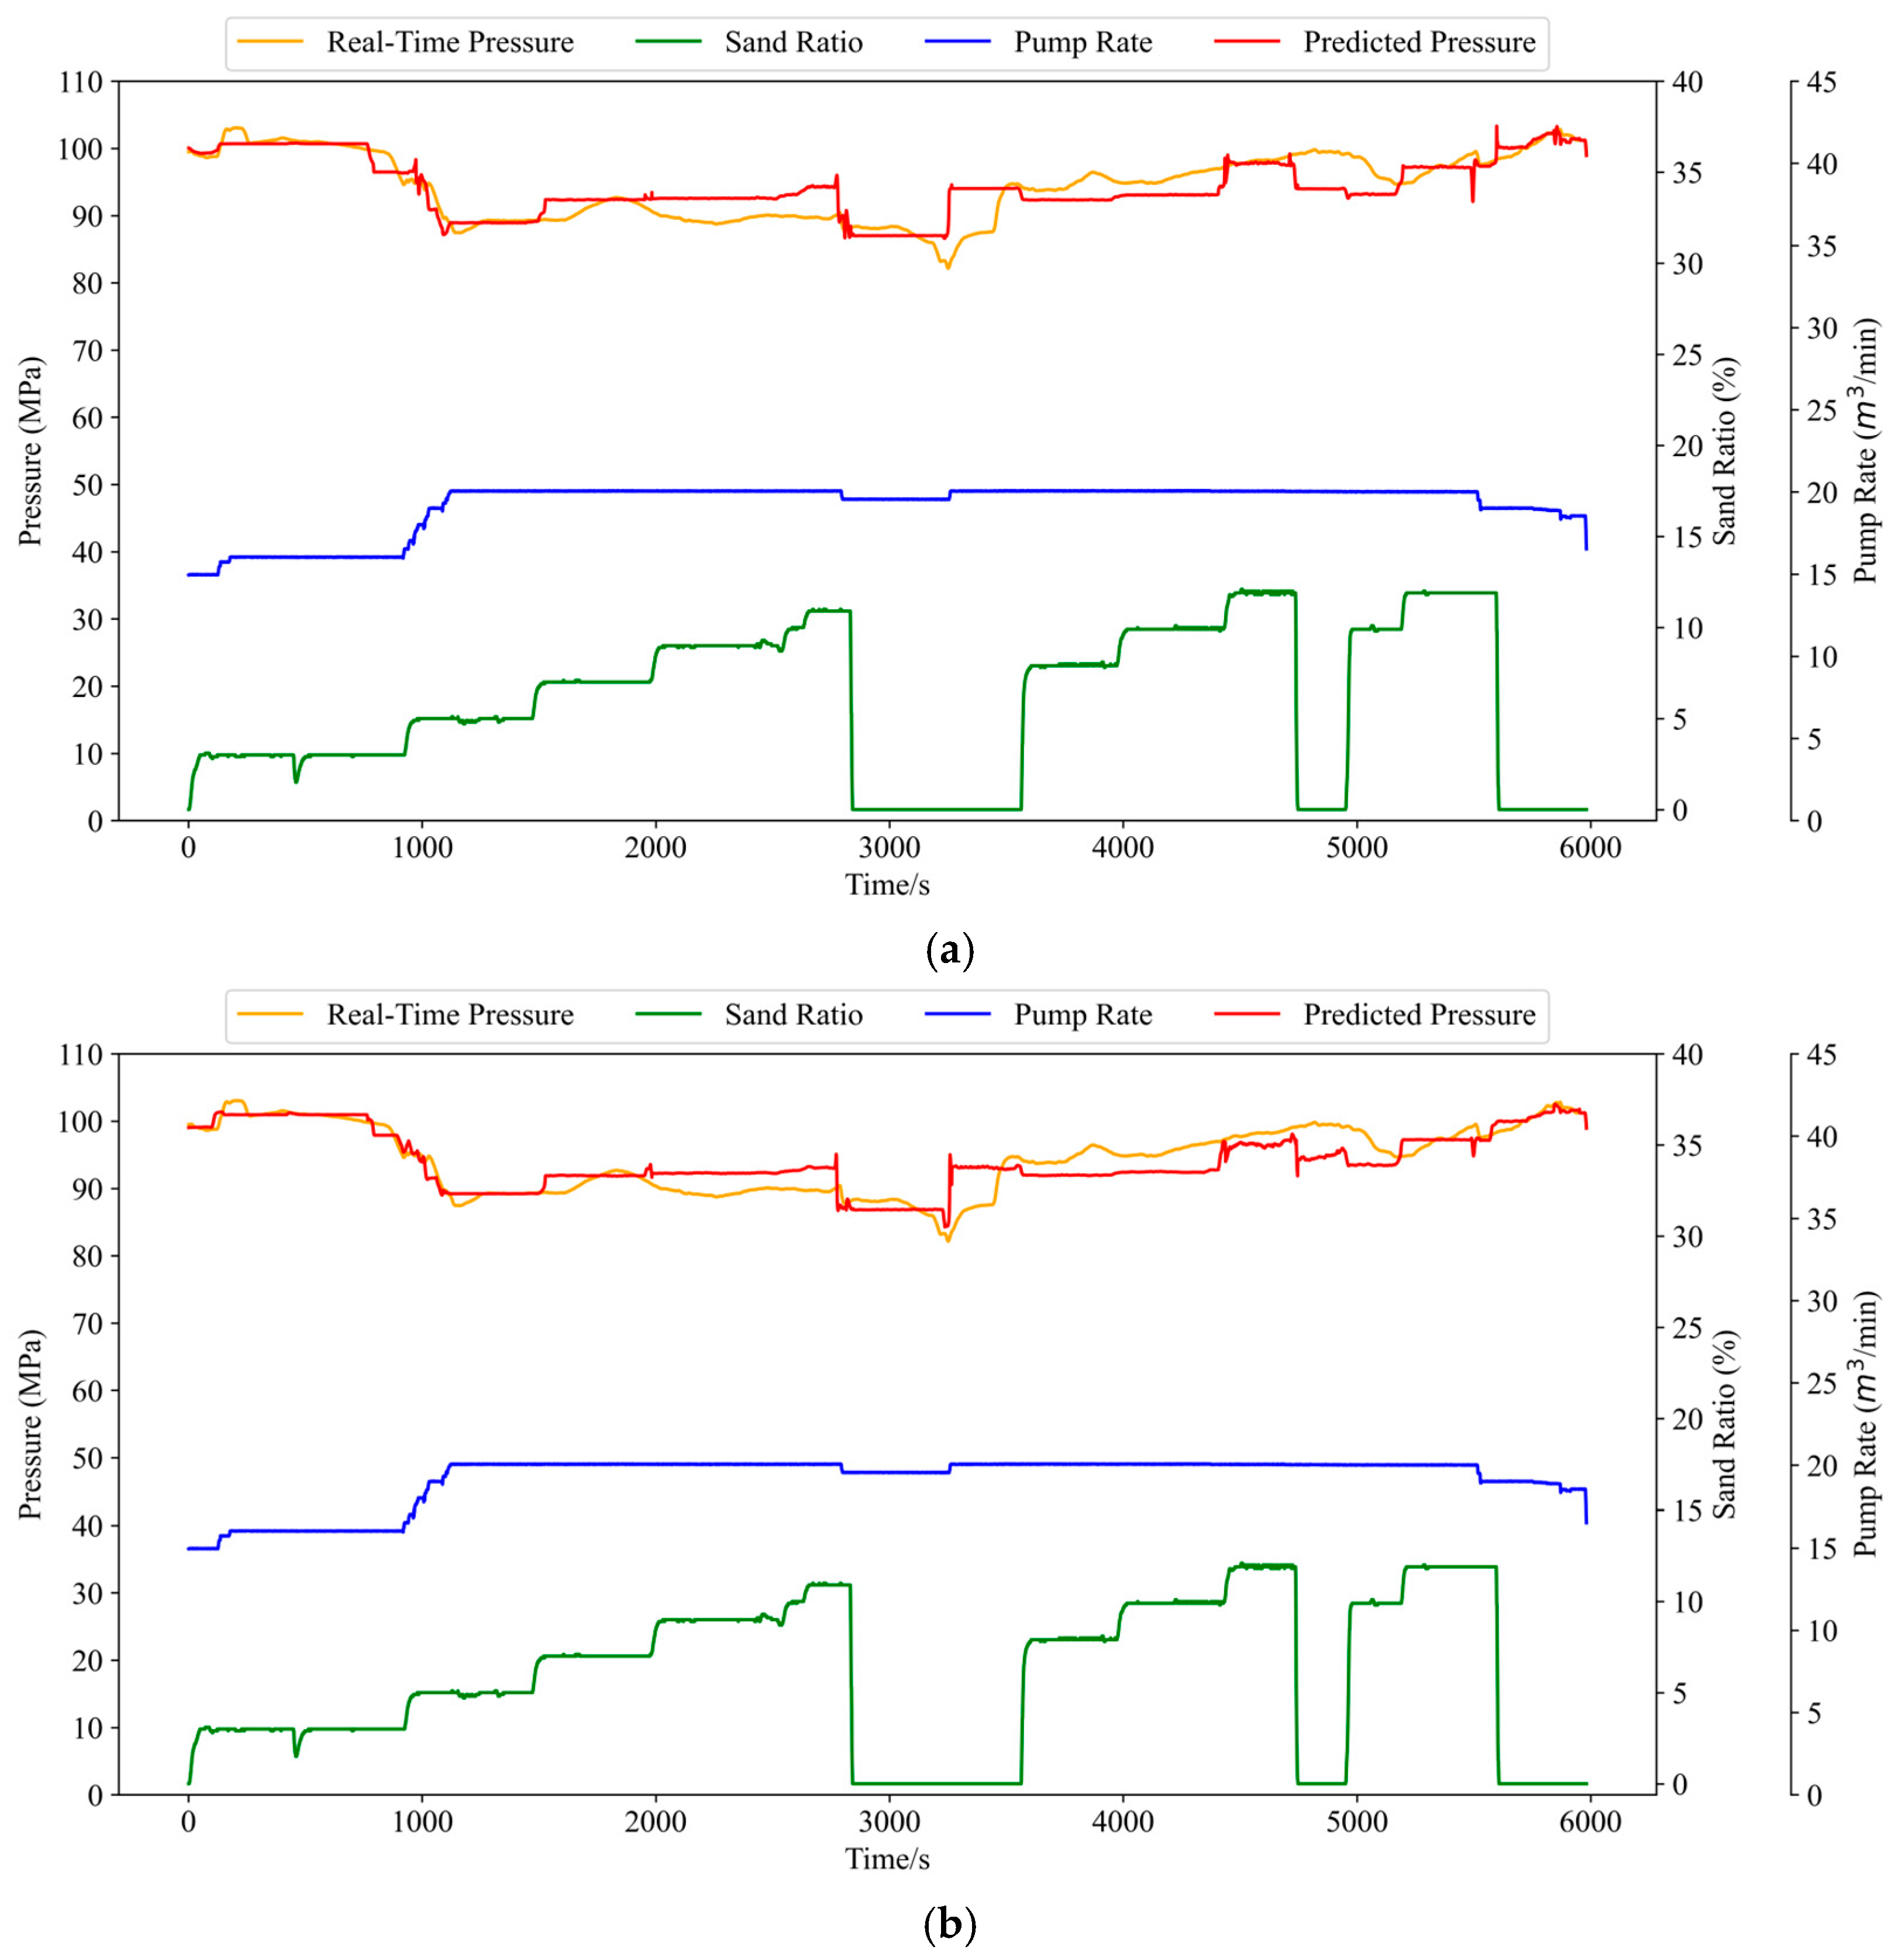
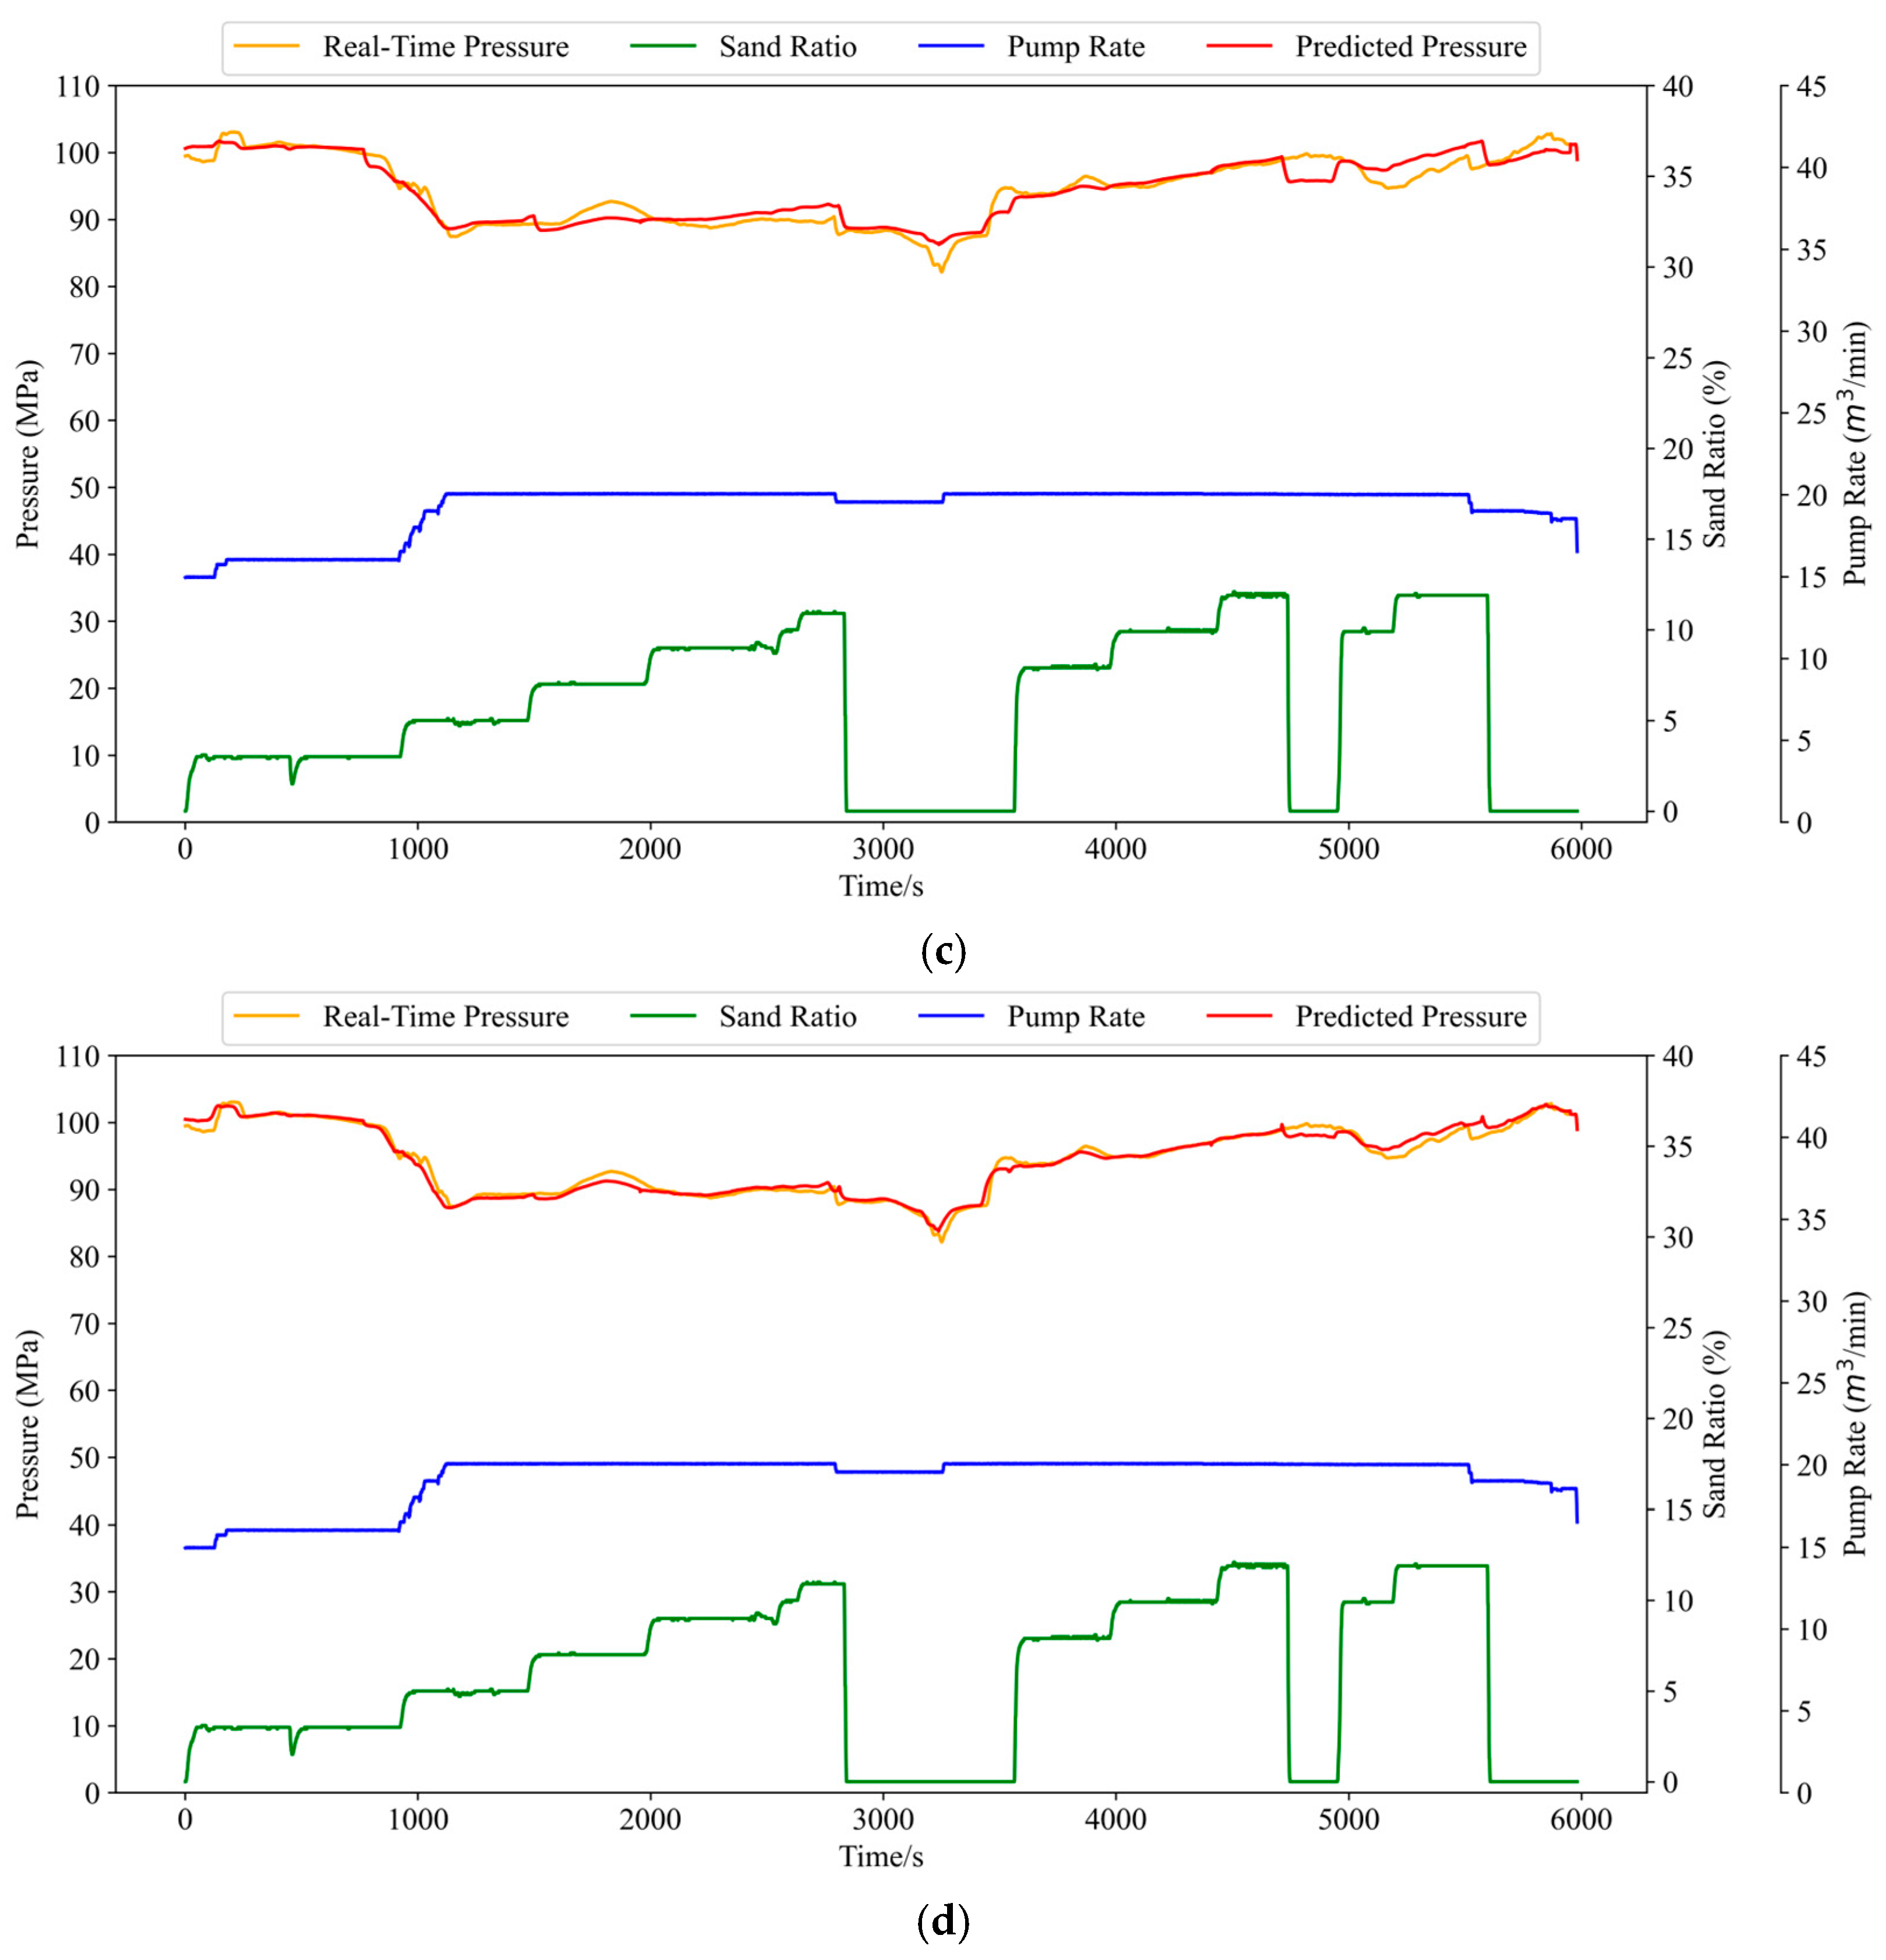
The prediction result curves for each model are shown in Figure 11. From Figure 11, it can be seen that the trend of the fracture pressure prediction results of the four models is basically consistent with the trend of the actual fracture pressure. From the point of view of prediction accuracy, the predicted fracture pressure curve of the CPO-GRU-Transformer model is the closest to the actual fracture pressure curve.
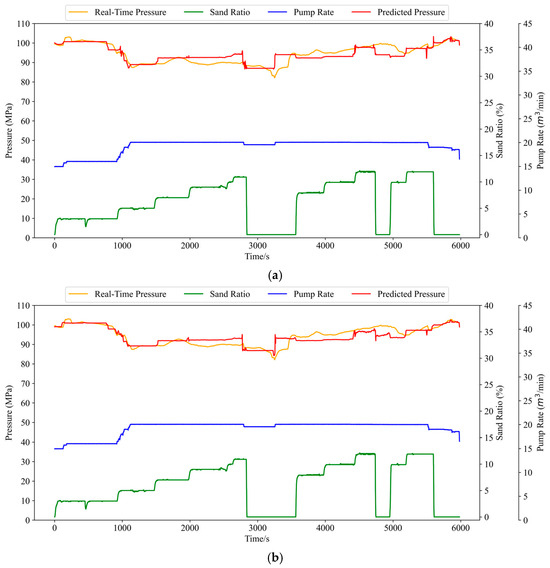
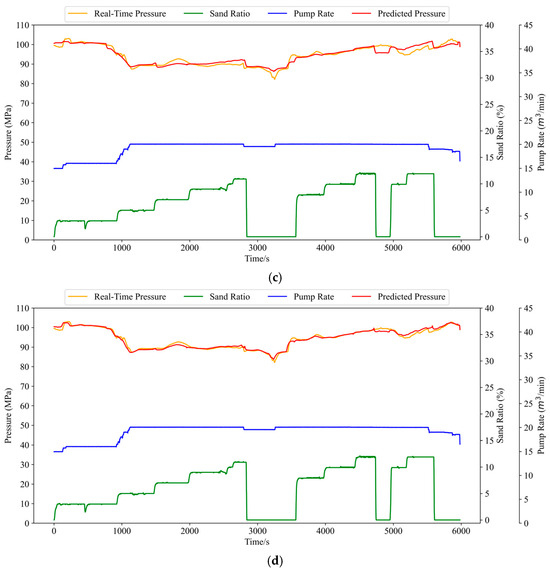
Figure 11.
Prediction Result Curves for Four Models. (a) LSTM pressure prediction curve. (b) GRU pressure prediction curve. (c) CPO-GRU pressure prediction curve. (d) CPO-GRU-Transformer pressure prediction curve.
As shown in Figure 11a–d, both the LSTM and GRU models align well with the predicted trend in pressure prediction. However, the unoptimized GRU model exhibits a rectangular-like behaviour under fluctuating conditions. This issue was addressed, and the evaluation metrics were significantly improved after the GRU model parameters were optimized using the CPO.
As observed in Figure 11c, although the data predicted by the CPO-GRU model fit the prediction model, there are some limitations in its enhancement effect in some small fluctuations. After introducing Transformer, the prediction results in Figure 11d show that Transformer can accurately find the relationship between the individual eigenvalues on the fracturing pressure at each time step, and its results can accurately predict the curve fluctuation condition. The proposed combined neural network model shows optimal prediction performance compared to the other three models, especially for the time point 3000 s–4000 s, in which the trough after sand stopping is accurately predicted by the model, and the pressure fluctuation can be accurately captured throughout the prediction process. These results are highly consistent with the actual curves, which proves the superiority of the model.
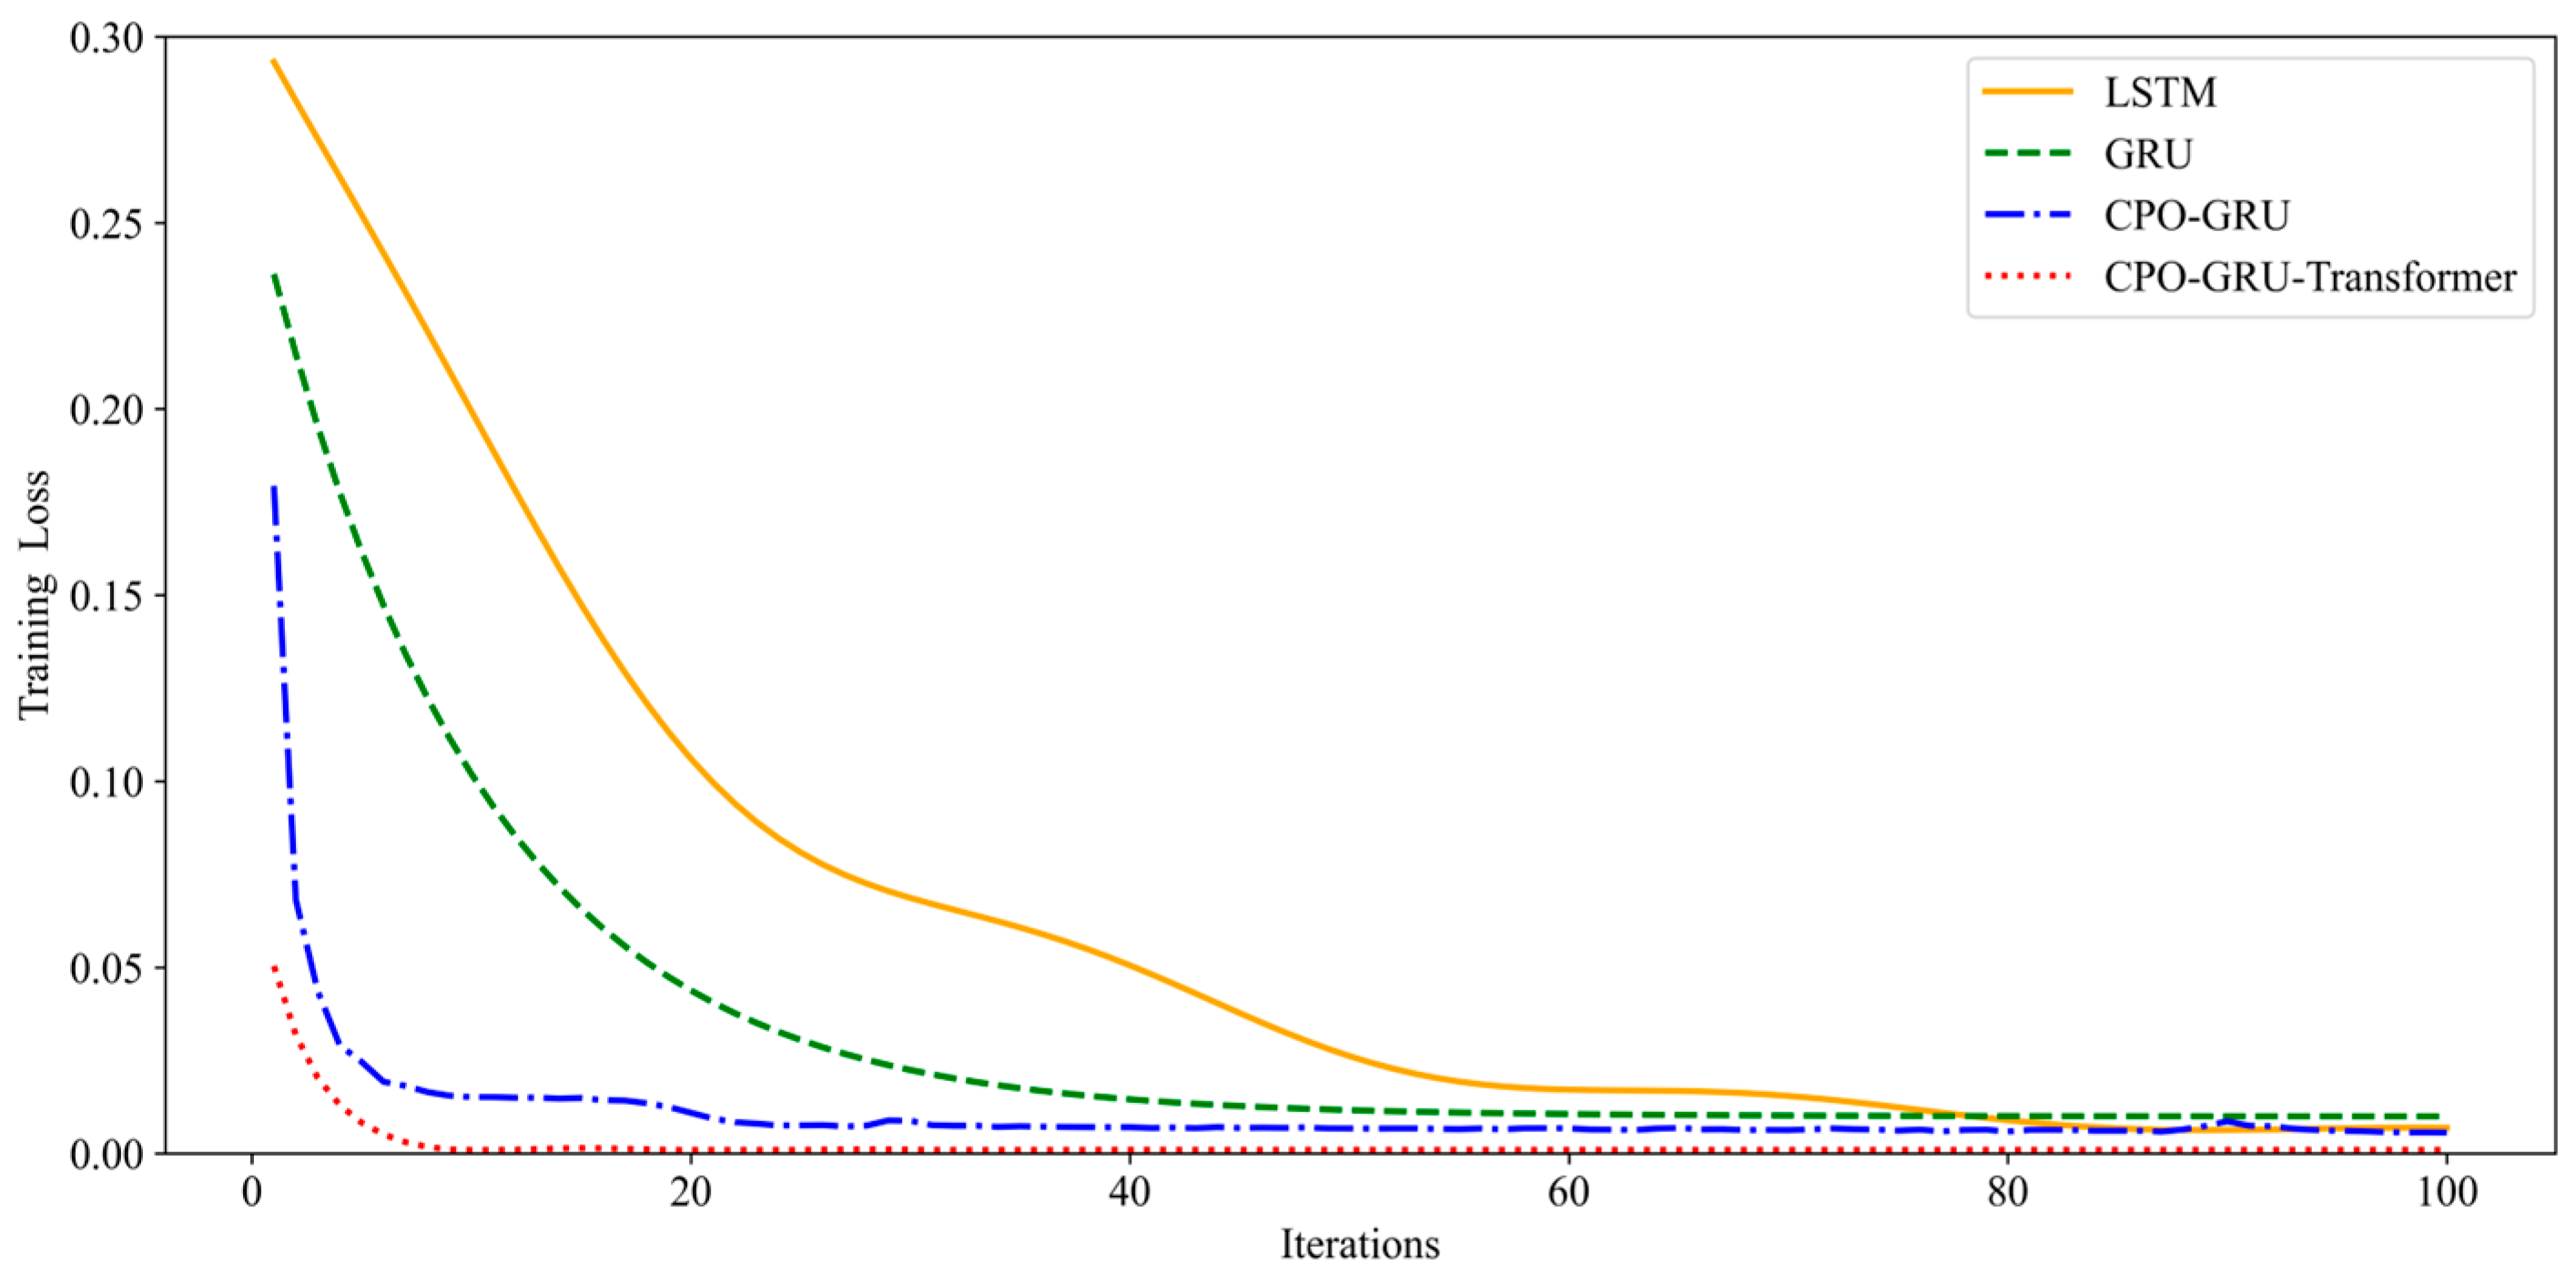
Figure 12 represents the curve of training loss with training number for LSTM, GRU, CPO-GRU and CPO-GRU-Transformer, all with 100 training times. The results show that under the same conditions, the combined neural network training loss proposed in this paper decreases the fastest, indicating that it has the quickest convergence speed, which effectively shortens the training time and improves learning efficiency. Figure 9 shows the evaluation metrics for fracture pressure prediction by the four models.

Figure 12.
Training losses for the first 100 training sessions of the four models.
From Figure 13, it can be seen that the single neural network models LSTM and GRU still have some defects in prediction, and their prediction results are not optimal. For CPO-GRU compared with GRU, the MAE decreases by 36.24%, the RMSE decreases by 36.97%, and improves by 0.156, which means that the prediction results of this model are closer to the actual values after CPO optimises the hyperparameters of GRU. Compared with CPO-GRU, the MAE of CPO-GRU-Transformer decreases by 49.51%, RMSE decreases by 46.54%, and improves by 0.073, which indicates that Transformer greatly improves the performance of GRU. Therefore, the combined neural network proposed in this paper has the highest fracture pressure prediction accuracy and the fastest computational efficiency among the four models. Therefore, the combined neural network proposed in this paper drives the highest accuracy and fastest computational efficiency in fracture pressure prediction among the four models.
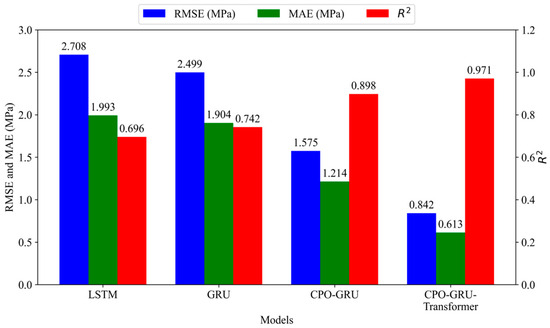
Figure 13.
Evaluation metrics for fracture pressure prediction in four models.
3.2. On-Site Warning Effect
At present, the sand screenout warning in Block U is mainly based on manual observation and the results of pressure changes in the historical fracturing section for early warning, and the operator observes whether the pressure surge phenomenon occurs based on the slope inversion method and double logarithmic curves, and then manually stops the sand, which has limitations such as subjectivity and a slow reaction speed.
Therefore, the artificial sand stopping point and the sand screenout early warning method proposed in this paper were compared and analysed. In this paper, a total of three fracturing sections, namely, Section A of Well Y and Section B and Section C of Well Z were selected for on-site application in this block. The pressure prediction results have a smaller error value than the actual pressure results, which is close to the exact pressure curve, and the results of the pressure prediction and evaluation indexes are shown in Table 5.
Table 5.
Fracture pressure prediction results.
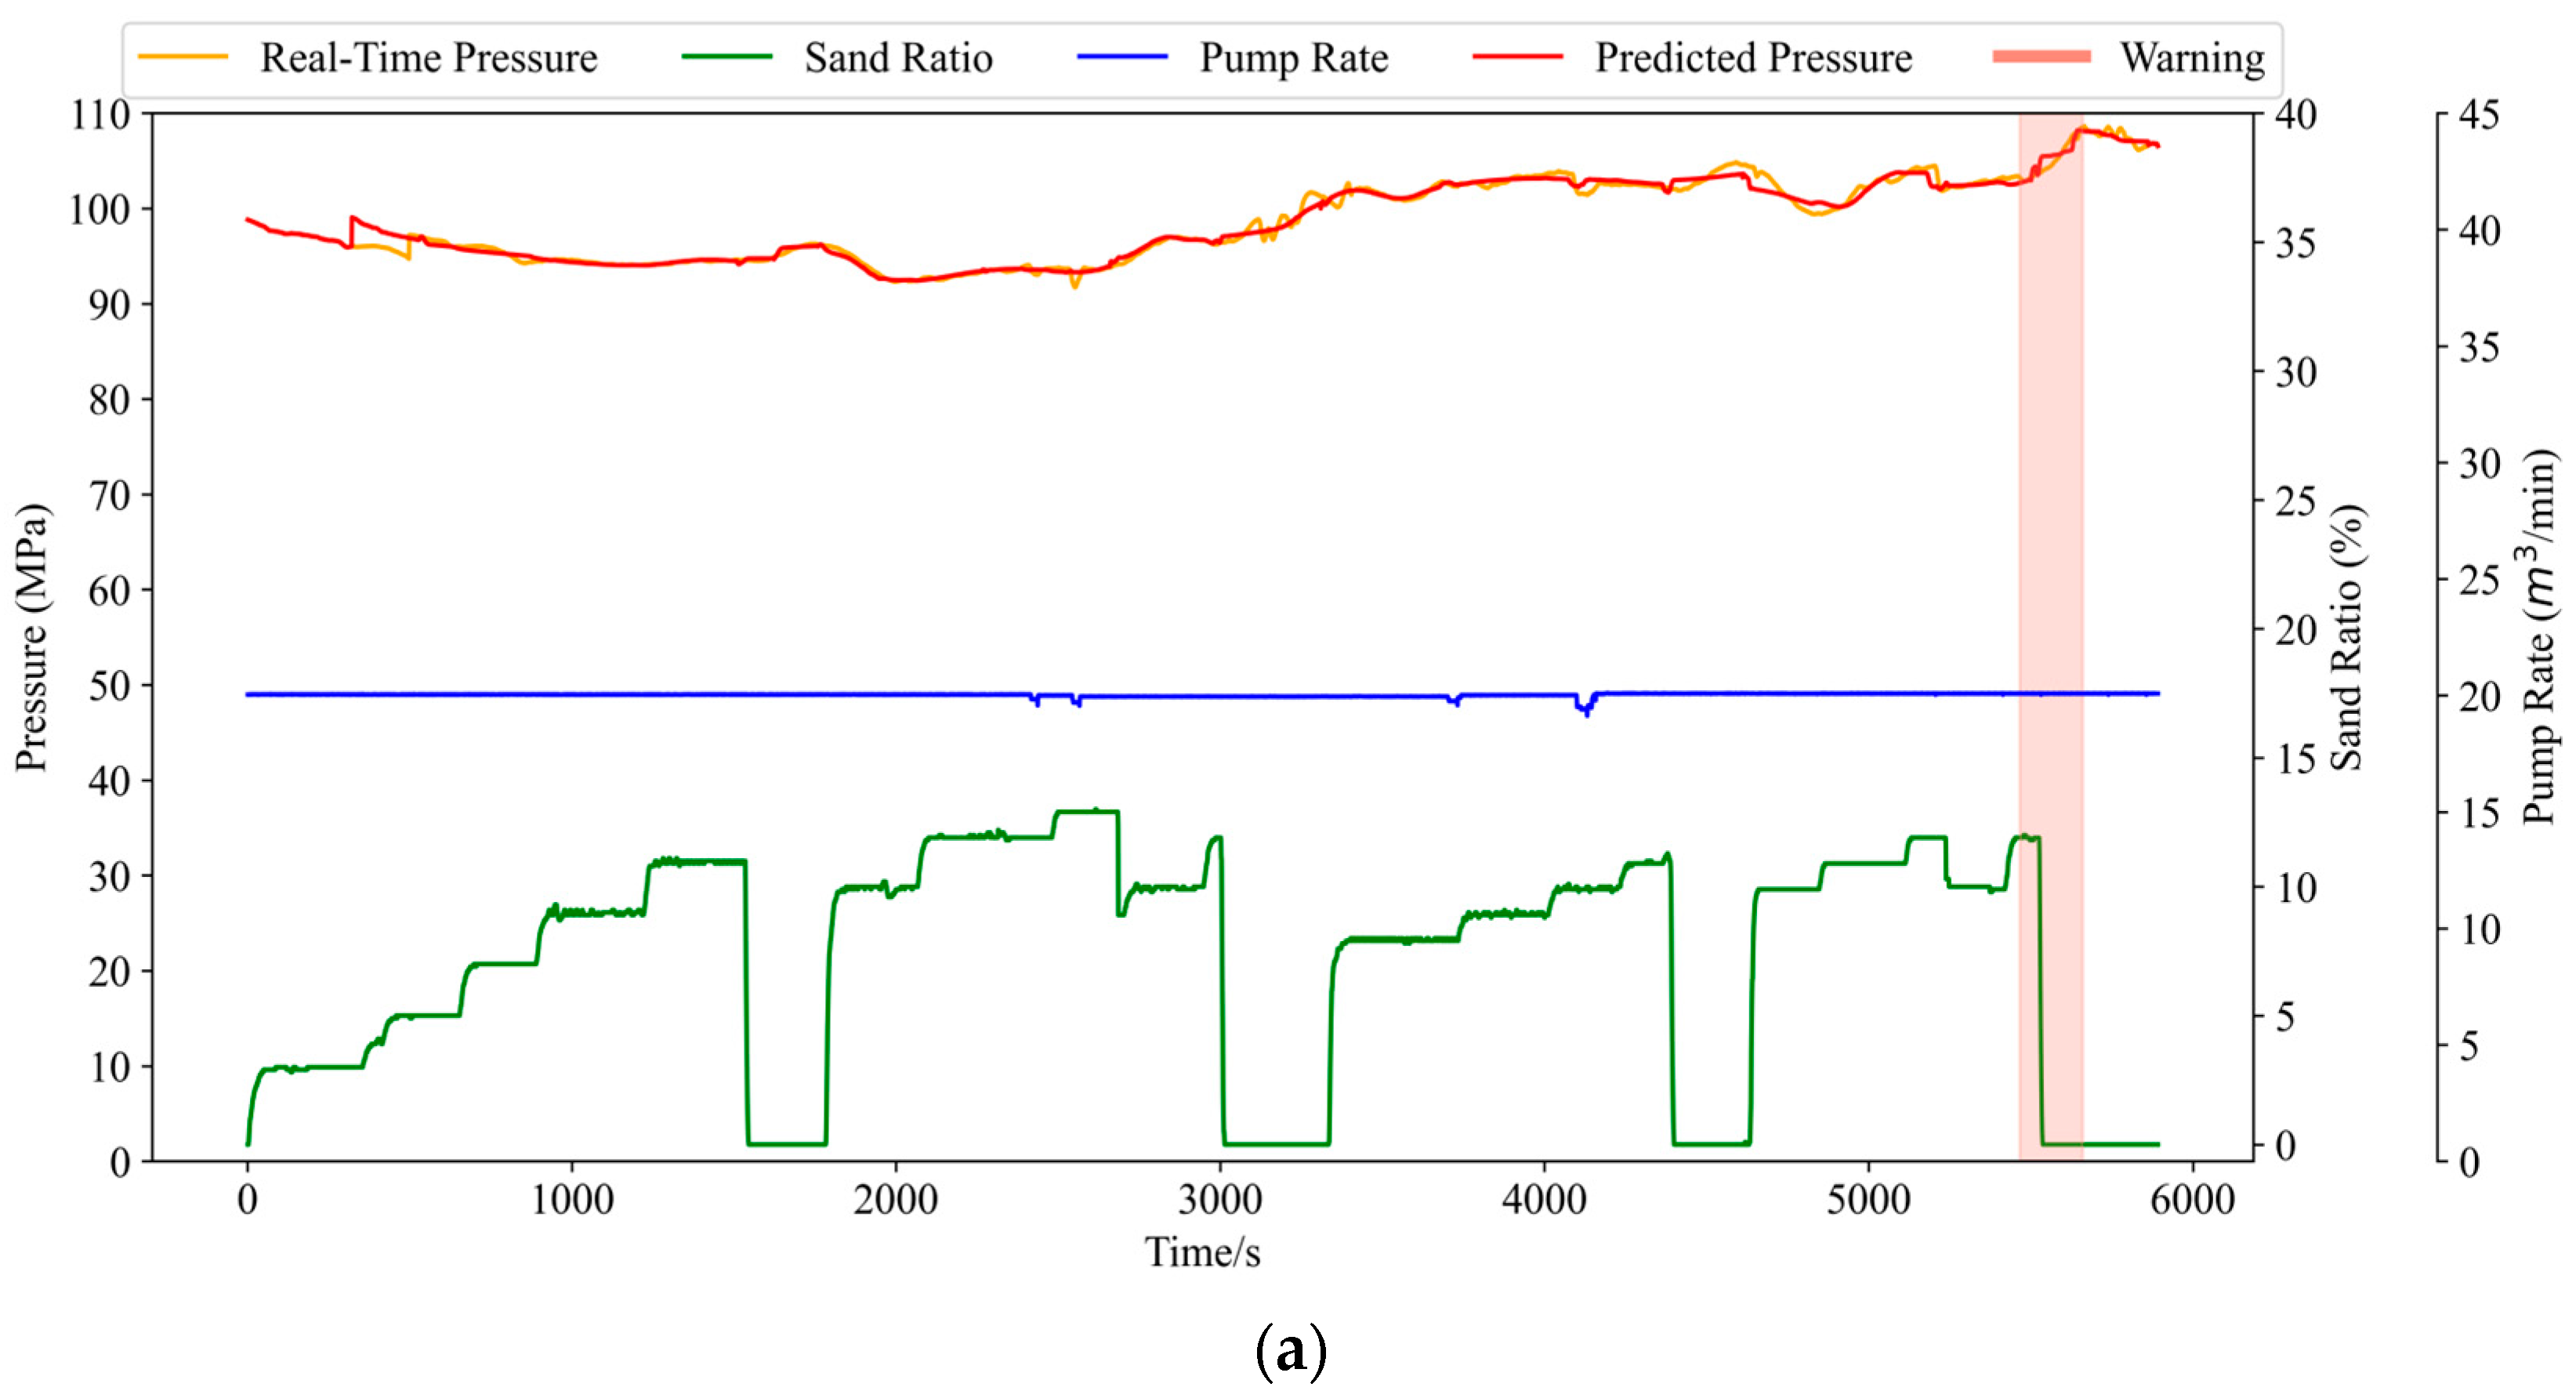
To evaluate the effectiveness of the proposed model in practical applications, we compared its early warning performance with manual judgement across three representative fracturing stages. As shown in Table 6 and Figure 14, the model issued a total of seven early warnings, among which six were true positives, correctly indicating actual sand screenout risks, and one was a false positive, where no actual screenout occurred. No false negatives were observed during the testing process, indicating that the model successfully captured all actual screenout events. These results yield a successful warning rate of 85.71% and demonstrate the model’s strong reliability in detecting genuine risks while maintaining a low false alarm rate.
Table 6.
On-site warning intervals.
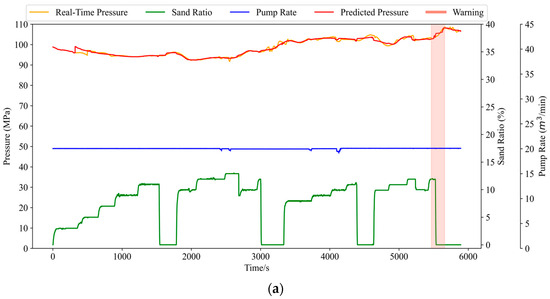
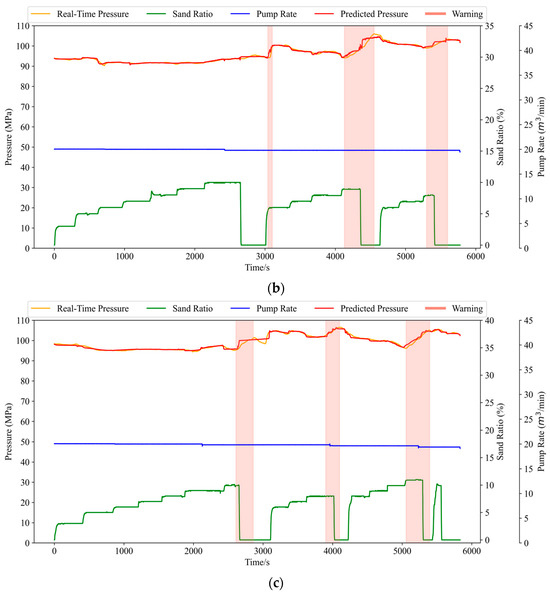
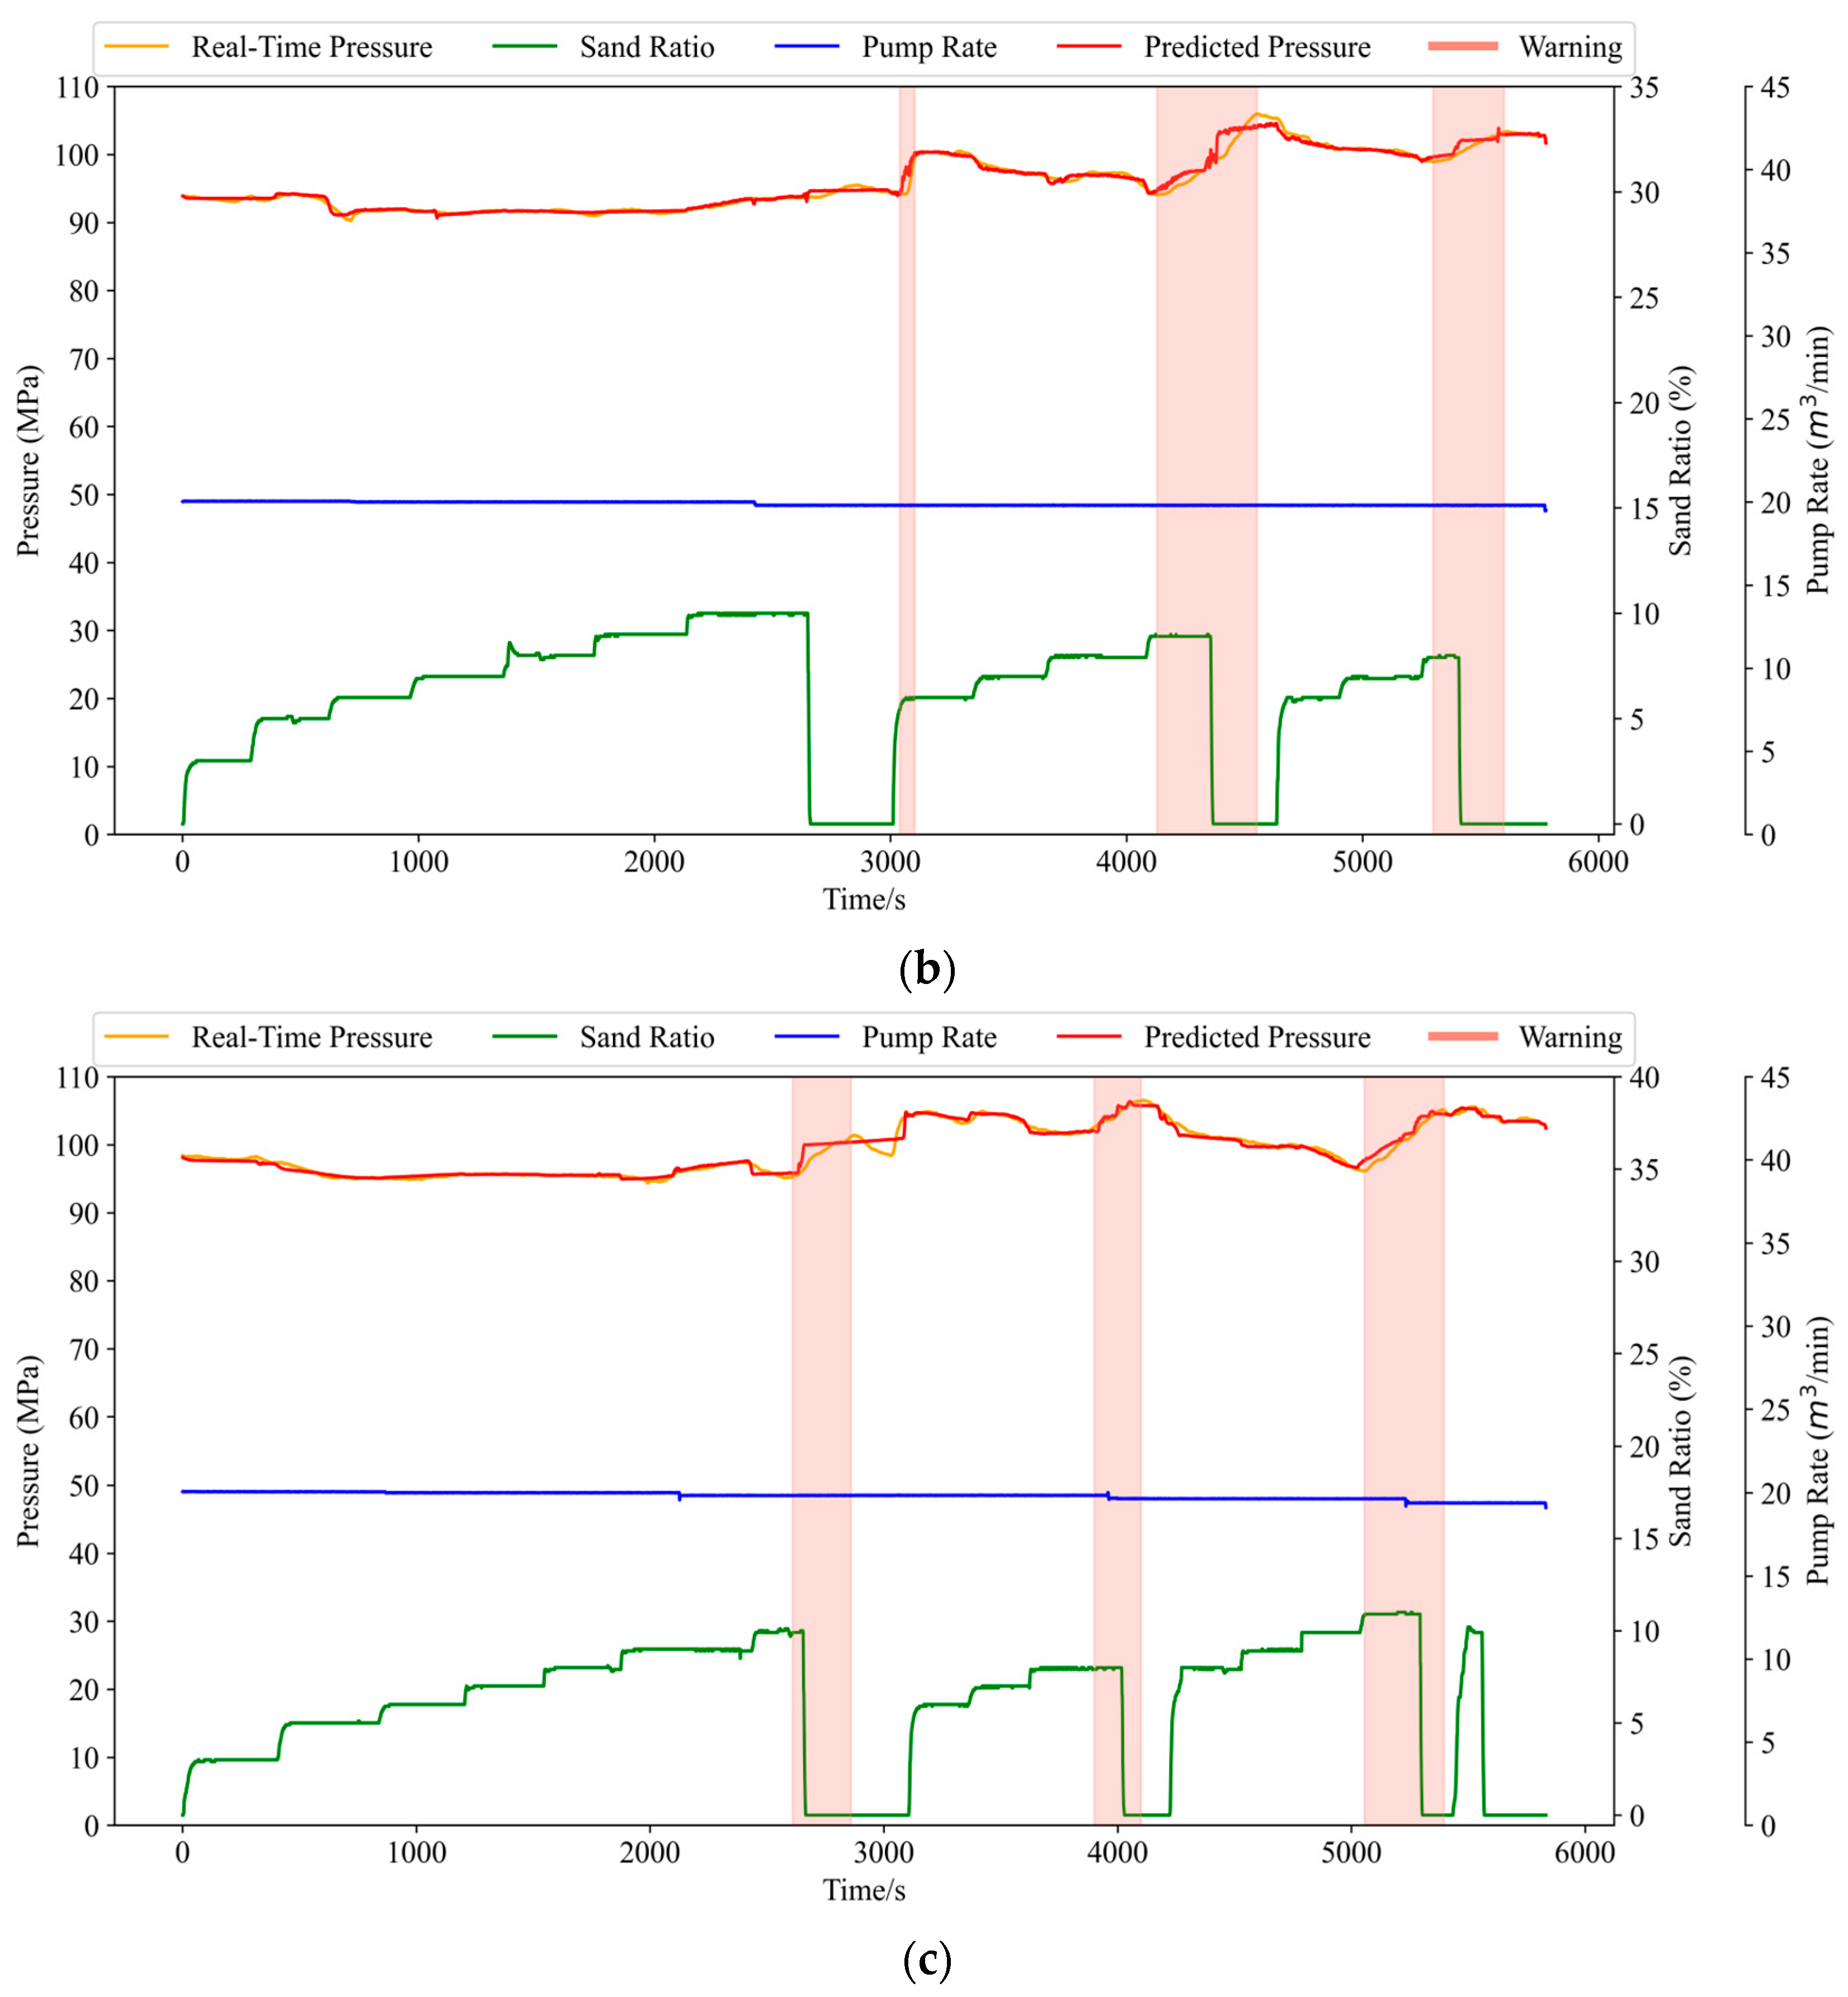
Figure 14.
Y and Z well test section results. (a) Early warning results for section a of well Y; (b) Early warning results for section b of well Z; (c) Early warning results for section c of well Z.
In terms of timeliness, the model demonstrated a clear advantage by triggering alarms an average of 73.5 s earlier than the corresponding manual sand-stopping decisions. This lead time is critical in field operations, as it provides engineers with additional time to adjust the pumping parameters or stop the operation, effectively avoiding the onset of sand screenout.
Furthermore, manual judgment often suffers from subjectivity and delay, especially under fluctuating pressure signals or complex downhole conditions. In contrast, the model’s ability to continuously monitor pressure trends and issue objective warnings improves both the response speed and operational consistency. These results highlight the model’s practical value as a reliable decision-support tool in hydraulic fracturing operations.
4. Conclusions
The combined neural network pressure prediction model constructed in this paper, CPO-GRU-Transformer, was compared with LSTM, GRU and CPO-GRU. It had the smallest MAE and RMSE and the largest , 0.613, 0.842 and 0.971, respectively, and it was the prediction method that best fit the pressure curve. It was experimentally verified that this model has the following advantages over LSTM, GRU and CPO-GRU in fracture pressure prediction: compared with other neural network models, this model has higher prediction accuracy, faster learning speed and faster convergence.
Three fracturing sections were verified in the field, with six successful alarms and one false alarm, resulting in an early warning rate of 85.71%, and the alarm point was 73.5 s earlier than the artificial sand stopping point on average, which greatly avoided the possibility of sand screenout. However, the study presented in this paper has limitations. Firstly, the sliding window size and thresholds must be set for different geological environments, which is too dependent on empirical judgement; secondly, the model requires a certain amount of computational resources, which may not be available in working environments where computational resources are scarce, which will limit the robustness of the model and prevent it from reaching the optimal prediction state. The method proposed in this paper provides a faster calculation and the most accurate warning method for sand blockage warning, which greatly avoids the occurrence of false alarms and provides effective sand screenout warning information for operators.
Author Contributions
Y.S.: Writing—original draft. Q.L.: Resources. F.Z.: Writing—review and editing. L.Z.: Methodology. All authors have read and agreed to the published version of the manuscript.
Funding
This research received no external funding.
Data Availability Statement
The original contributions presented in this study are included in the article. Further inquiries can be directed to the corresponding author.
Conflicts of Interest
Author Feng Zhu was employed by Yumen Drilling Branch, China Petroleum Western Drilling Engineering Co., Ltd. Author Lefan Zhang was employed by EISC Southwest Branch Center of PetroChina Logging Southwest Company. The remaining authors declare that the research was conducted in the absence of any commercial or financial relationships that could be construed as a potential conflict of interest.
Abbreviations
The following abbreviations are used in this manuscript:
| GRU | Gated Recurrent Unit |
| CPO | Crested Porcupine Optimizer |
| LSTM | Long Short-Term Memory |
| NLP | natural language processing |
| raw data | |
| normalized data | |
| Q | query in Transformer input sequence |
| K | key in Transformer input sequence |
| V | value in Transformer input sequence |
| dimension of key vectors in Transformer | |
| scale factor in Transformer | |
| MAE | mean absolute error |
| RMSE | root mean square error |
| coefficient of determination |
References
- Chen, B.; Barboza, B.R.; Sun, Y.; Bai, J.; Thomas, H.R.; Dutko, M.; Cottrell, M.; Li, C.J. A review of hydraulic fracturing simulation. Arch. Comput. Methods Eng. 2021, 29, 1–58. [Google Scholar] [CrossRef]
- Cai, X.; Guo, B.; Li, G.; Yang, X. A semi analytical model for predicting proppant screen-out during hydraulic fracturing unconventional reservoirs. In Proceedings of the SPE/IATMI Asia Pacific Oil & Gas Conference and Exhibition, Jakarta, Indonesia, 17–19 October 2017; p. D021S011R006. [Google Scholar]
- Nolte, K.G.; Smith, M.B. Interpretation of fracturing pressures. J. Pet. Technol. 1981, 33, 1767–1775. [Google Scholar] [CrossRef]
- Massaras, L.V.; Massaras, D.V. Real-time advanced warning of screenouts with the inverse slope method. In Proceedings of the SPE International Symposium and Exhibition on Formation Damage Control, Lafayette, LA, USA, 15–17 February 2012; p. SPE-150263-MS. [Google Scholar]
- Jordan, M.I.; Mitchell, T.M. Machine learning: Trends, perspectives, and prospects. Science 2015, 349, 255–260. [Google Scholar] [CrossRef] [PubMed]
- Qiu, J.; Wu, Q.; Ding, G.; Xu, Y.; Feng, S. A survey of machine learning for big data processing. EURASIP J. Adv. Signal Process. 2016, 2016, 67. [Google Scholar] [CrossRef]
- LeCun, Y.; Bengio, Y.; Hinton, G. Deep learning. Nature 2015, 521, 436–444. [Google Scholar] [CrossRef]
- Brenjkar, E.; Delijani, E.B. Engineering. Computational prediction of the drilling rate of penetration (ROP): A comparison of various machine learning approaches and traditional models. J. Pet. Sci. Eng. 2022, 210, 110033. [Google Scholar] [CrossRef]
- Matinkia, M.; Sheykhinasab, A.; Shojaei, S.; Vojdani Tazeh Kand, A.; Elmi, A.; Bajolvand, M.; Mehrad, M. Developing a new model for drilling rate of penetration prediction using convolutional neural network. Arab. J. Sci. Eng. 2022, 47, 11953–11985. [Google Scholar] [CrossRef]
- Xu, K.; Liu, Z.; Chen, Q.; Zhang, Q.; Ling, X.; Cai, X.; He, Q.; Yang, M. Application of machine learning in wellbore stability prediction: A review. Geoenergy Sci. Eng. 2024, 232, 212409. [Google Scholar] [CrossRef]
- Pan, S.; Zheng, Z.; Guo, Z.; Luo, H. An optimized XGBoost method for predicting reservoir porosity using petrophysical logs. J. Pet. Sci. Eng. 2022, 208, 109520. [Google Scholar] [CrossRef]
- Zhang, Z.; Zhang, H.; Li, J.; Cai, Z. Permeability and porosity prediction using logging data in a heterogeneous dolomite reservoir: An integrated approach. J. Nat. Gas Sci. Eng. 2021, 86, 103743. [Google Scholar] [CrossRef]
- Wang, S.; Qin, C.; Feng, Q.; Javadpour, F.; Rui, Z. A framework for predicting the production performance of unconventional resources using deep learning. Appl. Energy 2021, 295, 117016. [Google Scholar] [CrossRef]
- Zhou, G.; Guo, Z.; Sun, S.; Jin, Q. A CNN-BiGRU-AM neural network for AI applications in shale oil production prediction. Appl. Energy 2023, 344, 121249. [Google Scholar] [CrossRef]
- Madasu, S.; Rangarajan, K.P. Deep recurrent neural network DRNN model for real-time multistage pumping data. In Proceedings of the OTC Arctic Technology Conference, Houston, TX, USA, 5–7 November 2018; p. D033S017R005. [Google Scholar]
- Liang, H.; Zou, J.; Khan, M.J.; Jinxuan, H. An sand plug of fracturing intelligent early warning model embedded in remote monitoring system. IEEE Access 2019, 7, 47944–47954. [Google Scholar] [CrossRef]
- Hu, J.; Khan, F.; Zhang, L.; Tian, S. Data-driven early warning model for screenout scenarios in shale gas fracturing operation. Comput. Chem. Eng. 2020, 143, 107116. [Google Scholar] [CrossRef]
- Yu, X.; Trainor-Guitton, W.; Miskimins, J. A data driven approach in screenout detection for horizontal wells. In Proceedings of the SPE Hydraulic Fracturing Technology Conference and Exhibition, The Woodlands, TX, USA, 4–6 February 2020; p. D022S015R002. [Google Scholar]
- Sun, J.J.; Battula, A.; Hruby, B.; Hossaini, P. Application of both physics-based and data-driven techniques for real-time screen-out prediction with high frequency data. In Proceedings of the SPE/AAPG/SEG Unconventional Resources Technology Conference, Virtual, 20–22 July 2020; p. D023S027R003. [Google Scholar]
- Bin, Y.; Mingze, Z.; Siwei, M.; Zhang, W.; Zheng, H. Intelligent identification and real-time warning method of diverse complex events in horizontal well fracturing. Pet. Explor. Dev. 2023, 50, 1487–1496. [Google Scholar] [CrossRef]
- Tang, Y.; Ranjith, P.G.; Perera, M.S.A. Major factors influencing proppant behaviour and proppant-associated damage mechanisms during hydraulic fracturing. Acta Geotech. 2018, 13, 757–780. [Google Scholar] [CrossRef]
- Edirisinghe, E.A.A.V.; Perera, M.S.A. Review on the impact of fluid inertia effect on hydraulic fracturing and controlling factors in porous and fractured media. Acta Geotech. 2024, 19, 7923–7965. [Google Scholar] [CrossRef]
- Chung, J.; Gulcehre, C.; Cho, K.; Bengio, Y. Empirical evaluation of gated recurrent neural networks on sequence modeling. arXiv 2014. [Google Scholar] [CrossRef]
- Waswani, A.; Shazeer, N.; Parmar, N.; Uszkoreit, J.; Jones, L.; Gomez, A.; Kaiser, L.; Polosukhin, I. Attention is all you need. In Proceedings of the 31st Conference on Neural Information Processing Systems (NIPS 2017), Long Beach, CA, USA, 4–9 December 2017. [Google Scholar]
- Tang, M.; Cui, S.; Jin, Z.; Liang, S.-N.; Li, C.; Zou, L. Sequential recommendation by reprogramming pretrained transformer. Inf. Process. Manag. 2025, 62, 103938. [Google Scholar] [CrossRef]
- Ren, S.; Li, X. HResFormer: Hybrid Residual Transformer for Volumetric Medical Image Segmentation. IEEE Trans. Neural Netw. Learn. Syst. 2025. early access. [Google Scholar] [CrossRef]
- Zhao, J.; Wang, Z.; Wu, Y.; Burke, A.F. Predictive pretrained transformer (PPT) for real-time battery health diagnostics. Appl. Energy 2025, 377, 124746. [Google Scholar] [CrossRef]
- Bashir, T.; Wang, H.; Tahir, M.; Zhang, Y. Wind and solar power forecasting based on hybrid CNN-ABiLSTM, CNN-transformer-MLP models. Renew. Energy 2025, 239, 122055. [Google Scholar] [CrossRef]
- Abdel-Basset, M.; Mohamed, R.; Abouhawwash, M. Crested Porcupine Optimizer: A new nature-inspired metaheuristic. Knowl.-Based Syst. 2024, 284, 111257. [Google Scholar] [CrossRef]
- Hou, L.; Cheng, Y.; Wang, X.; Ren, J.; Geng, X. Effect of slickwater-alternate-slurry injection on proppant transport at field scales: A hybrid approach combining experiments and deep learning. Energy 2022, 242, 122987. [Google Scholar] [CrossRef]
- Barree, R. Processes of screenout development and avoidance. In Proceedings of the SPE Hydraulic Fracturing Technology Conference and Exhibition, The Woodlands, TX, USA, 1–3 February 2022; p. D021S004R005. [Google Scholar]
- Qu, H.; Xu, Y.; Liu, Y.; Li, Z.; Liu, X.; Zeng, Z.; Guo, R. Experimental study of fluid-particle flow characteristics in a rough fracture. Energy 2023, 285, 129380. [Google Scholar] [CrossRef]
- Zhao, J.; Zhao, X.; Zhao, J.; Cao, L.; Hu, Y.; Liu, X. Coupled model for simulating proppant distribution in extending fracture. Eng. Fract. Mech. 2021, 253, 107865. [Google Scholar] [CrossRef]
- Ahmadi, S.; Khormali, A.; Razmjooie, A. Experimental investigation on separation of water in crude oil emulsions using an oil-soluble demulsifier. Iran. J. Chem. Chem. Eng. 2023, 42, 2332–2343. [Google Scholar]
- Ouadi, B.; Khatir, A.; Magagnini, E.; Mokadem, M.; Abualigah, L.; Smerat, A. Optimizing silt density index prediction in water treatment systems using pressure-based gradient boosting hybridized with Salp Swarm Algorithm. J. Water Process. Eng. 2024, 68, 106479. [Google Scholar] [CrossRef]

Disclaimer/Publisher’s Note: The statements, opinions and data contained in all publications are solely those of the individual author(s) and contributor(s) and not of MDPI and/or the editor(s). MDPI and/or the editor(s) disclaim responsibility for any injury to people or property resulting from any ideas, methods, instructions or products referred to in the content. |
© 2025 by the authors. Licensee MDPI, Basel, Switzerland. This article is an open access article distributed under the terms and conditions of the Creative Commons Attribution (CC BY) license (https://creativecommons.org/licenses/by/4.0/).