Abstract
Large-scale hydraulic fracturing is a prevalent technique for exploiting low-porosity and low-permeability shale reservoirs. The propagation and morphology of the hydraulic fracture in the laminated shale formations are significantly influenced by densely developed bedding planes, which can be classified into three categories: continuous, transitional, and discontinuous, with each characterized by distinct properties. This categorization complicates the prediction of the fracture propagation and the optimization of fracturing plans. In this research, a comparative study was proposed to describe fracture propagation and morphology in laminated shale with different types of bedding planes, employing the hydromechanically coupled discrete element method (DEM). The simulation results revealed that bedding planes of different types produce distinct impacts on the fracture propagation, leading to diverse fracture morphologies. In particular, it was found that the plane thickness affected the fracture propagation under low permeability, but the impact was insignificant under high permeability. Under different orientation angles, the continuous bedding planes showed distinct impacts on fracture propagation, while the transitional and discontinuous bedding planes consistently captured the hydraulic fracture. Moreover, the fluid viscosity and injection rate significantly influenced continuous and transitional bedding planes while having a minor effect on the discontinuous bedding planes. The optimal injection schemes incorporating varying injection rates or fluid viscosities were investigated. In addition, the impacts of small-scale bedding planes on fracture propagation were revealed. Furthermore, the bottom hole pressure variation and seismic event distribution were presented to provide complementary evidence of the fracture propagation. The simulation results can promote a comprehensive understanding of the fracture development in shale reservoirs.
1. Introduction
Shale reservoirs have emerged as primary targets for unconventional oil and gas resource development in recent years [1,2]. In basins such as Sichuan, Junggar, and Ordos, China, companies have consistently intensified their efforts, leading to significant breakthroughs in shale oil and gas development [3]. These reservoirs typically exhibit low porosity, low permeability, and distinctive heterogeneity characterized by laminated structures and natural fractures [4]. To enhance oil recovery in shale reservoir reconstruction, widespread adoption of the large-scale hydraulic fracturing technique is evident. However, studies indicate that geological discontinuities, such as bedding planes, exert complex influences on the fracture morphology [5,6,7,8].
Bedding planes denote discontinuities developed in formations due to variations in the sedimentary environment. Owing to the intricate sedimentary environments and tectonic movements, the occurrences of bedding planes are diverse, and various classification criteria for bedding planes were proposed based on different standards, such as the composition, texture, and structure [9,10,11,12]. The composition refers to the mineral components of the bedding planes; the texture discloses the distributions and connections of the organic matter and pores within the bedding planes; and the structure denotes the continuities, shapes, and geometrical relationships of the bedding planes [13]. Among these criteria, the structure differences are deemed to be the most obvious based on the observations of typical shale samples [13,14,15]. Particularly, the continuities between the bedding planes and the rock matrix are critical factors affecting the fracture propagation and should be emphasized in fracturing design.
Various taxonomies of bedding planes are proposed based on plane structure. According to thickness, Ingram [16] classified bedding planes into seven classes, ranging from “thinly laminated” (<3 mm) to “very thickly bedded” (>100 cm). Jin et al. [12] categorized bedding planed into laminated (<1 mm), bedded (1–10 mm), and massive (>10 mm). Moreover, Gale et al. [17] noted that cracked bedding planes, represented as natural fractures, commonly exist in shale reservoirs. Drawing on existing theoretical analysis and field observation, this study categorized three representative types of bedding planes based on their continuities: continuous, transitional, and discontinuous. In particular, continuous bedding planes are ultra-thin layers (<1 mm), while transitional bedding planes are layers with specific thinness (1–10 mm). Both are spatially continuous and filled with calcite, quartz, and organic matter. However, continuous bedding planes behave like interfaces embedded in the rock matrix, whereas transitional bedding planes manifest as layers with distinct lithological variations relative to the rock matrix. Furthermore, discontinuous bedding planes are spatially discontinuous interfaces (<1 mm) resembling natural fractures. Continuous bedding planes were commonly formed in low-energy sedimentary environments where seasonal variations in sedimentation or microbial mat development can create such laminations, while transitional bedding planes resulted from fluctuations in depositional energy or changes in sediment supply. Discontinuous bedding planes were caused by tectonic stresses or overpressure-induced fracturing during burial. Continuous and discontinuous bedding planes are interconvertible, as post-depositional diagenesis can fill in the discontinuous bedding planes through mineral cementation, while continuous bedding planes can crack as weak interfaces during tectonic movements [13].
The assessment of hydraulic fracturing under the influence of bedding planes is challenging. A comprehensive understanding of the underlying law of the fracture propagation is crucial for optimizing construction parameters and enhancing Stimulated Reservoir Volume (SRV) [18,19]. The True Triaxial Fracturing Experiment (TTFE) is a widely adopted approach for investigating fracture propagation in shale [2,18,20,21,22,23,24,25]. Specifically, Huang and Liu [22] conducted the TTFE on cement blocks with artificial bedding planes and established a three-dimensional (3D) propagation model. Tan et al. [18], Zhang et al. [24], and Hou et al. [23] employed natural shale outcrops in their TTFE and conducted fracturing tests under different conditions, including in situ stress, injection rate, and fluid viscosity. Tan et al. [18] categorized fracture morphology into four classes: simple fracture, fishbone-like fracture, fishbone-like fracture with fissure opening, and a multilateral fishbone-like fracture network. Hou et al. [23] concluded that low-viscosity fracturing fluid and periodic variable pump rate fracturing are preferable for generating a complex fracture network.
Numerical simulation provides a detailed analysis of both the qualitative and quantitative results. Various numerical approaches have been employed, including the finite element method [26,27,28], finite difference method [29], phase field method [30], and discrete element method (DEM) [2,31,32]. However, numerical methods based on the continuous medium face challenges in accurately characterizing the heterogeneity of rock samples, such as natural fractures and bedding planes. The dense, discontinuous surface seriously impacts the stability and convergence of the simulation [33,34]. In contrast, the DEM, based on a discontinuous medium, excels in characterizing rock materials as aggregations of discrete elements, showcasing its superiority in modeling hydraulic fracturing in heterogeneous conditions. Specifically, the DEM can arbitrarily define natural fractures and bedding planes among particle aggregations without additional computational consumption [33,35]. Liu et al. [36] and Lei et al. [37] employed the DEM in a three-point bending simulation on laminated shale, exploring the influence of bedding planes on fracture morphology. Additionally, some research proposed fracture propagation models in shale reservoirs based on the DEM and discussed fracture behavior in the discontinuous medium [38,39,40,41,42,43]. Yoon et al. [38] simulated the hydraulic fracturing process in intact and naturally fractured rock samples on the Particle Flow Code (PFC) 2D platform, revealing statistics on induced microseismic events. Furthermore, Zhang et al. [41] investigated the fracture propagation when encountering natural fractures by adopting a coupled continuous–discontinuous numerical scheme based on the finite difference method and the DEM.
Few studies have considered different types of bedding planes and investigated their influences on the shale rocks. Liu et al. [44] conducted uniaxial compressive tests on rock samples containing bedding planes with different cementation types, namely, embedded cementation, oriented cementation, and cracked cementation, and measured their compressive strengths under various conditions. Wang et al. [45] established DEM shale models with bedding planes of different bonding strengths and evaluated the tensile strengths of the samples. However, these studies mainly focus on the impact of bedding planes on the mechanical strength of the shale samples, and the findings and conclusions might not reveal the propagation behavior and morphology of the hydraulic fracture in shale formations containing different types of bedding planes; thus, they cannot offer direct guidance for fracturing plan optimization. To this end, a study dedicated to investigating the effect of different types of bedding planes on the propagation of hydraulic fracture is needed. In this study, a 3D DEM model was developed to simulate the process of fracture initialization and propagation in shale containing various types of bedding planes. The propagation behavior of the hydraulic fracture when encountering bedding planes in different types was investigated, with the geometrical settings of bedding planes and injection parameters being consistent across different types. Strategies replicating the mechanical and hydraulic properties of different bedding planes were introduced, with the relevant parameters undergoing strict calibration. Specifically, the mechanical parameters were determined through the simulation of uniaxial compressive tests on shale models, and the hydraulic parameters were determined by comparing the bottomhole pressure curves in the fracturing simulation and the parallel–perpendicular permeability ratios in the simulation of permeability testing. Additionally, the effects of multiple influential factors, including the bedding plane thickness, scale, permeability, orientation angles, fracturing fluid properties, and injection schemes on the fracture propagation, were discussed. A comprehensive comparison of the distinct influence of different types of the bedding planes under various conditions can enhance the understanding of the fracture propagation in shale reservoirs and facilitate the optimization of fracturing plans.
2. DEM-Based Hydromechanical Coupling Model
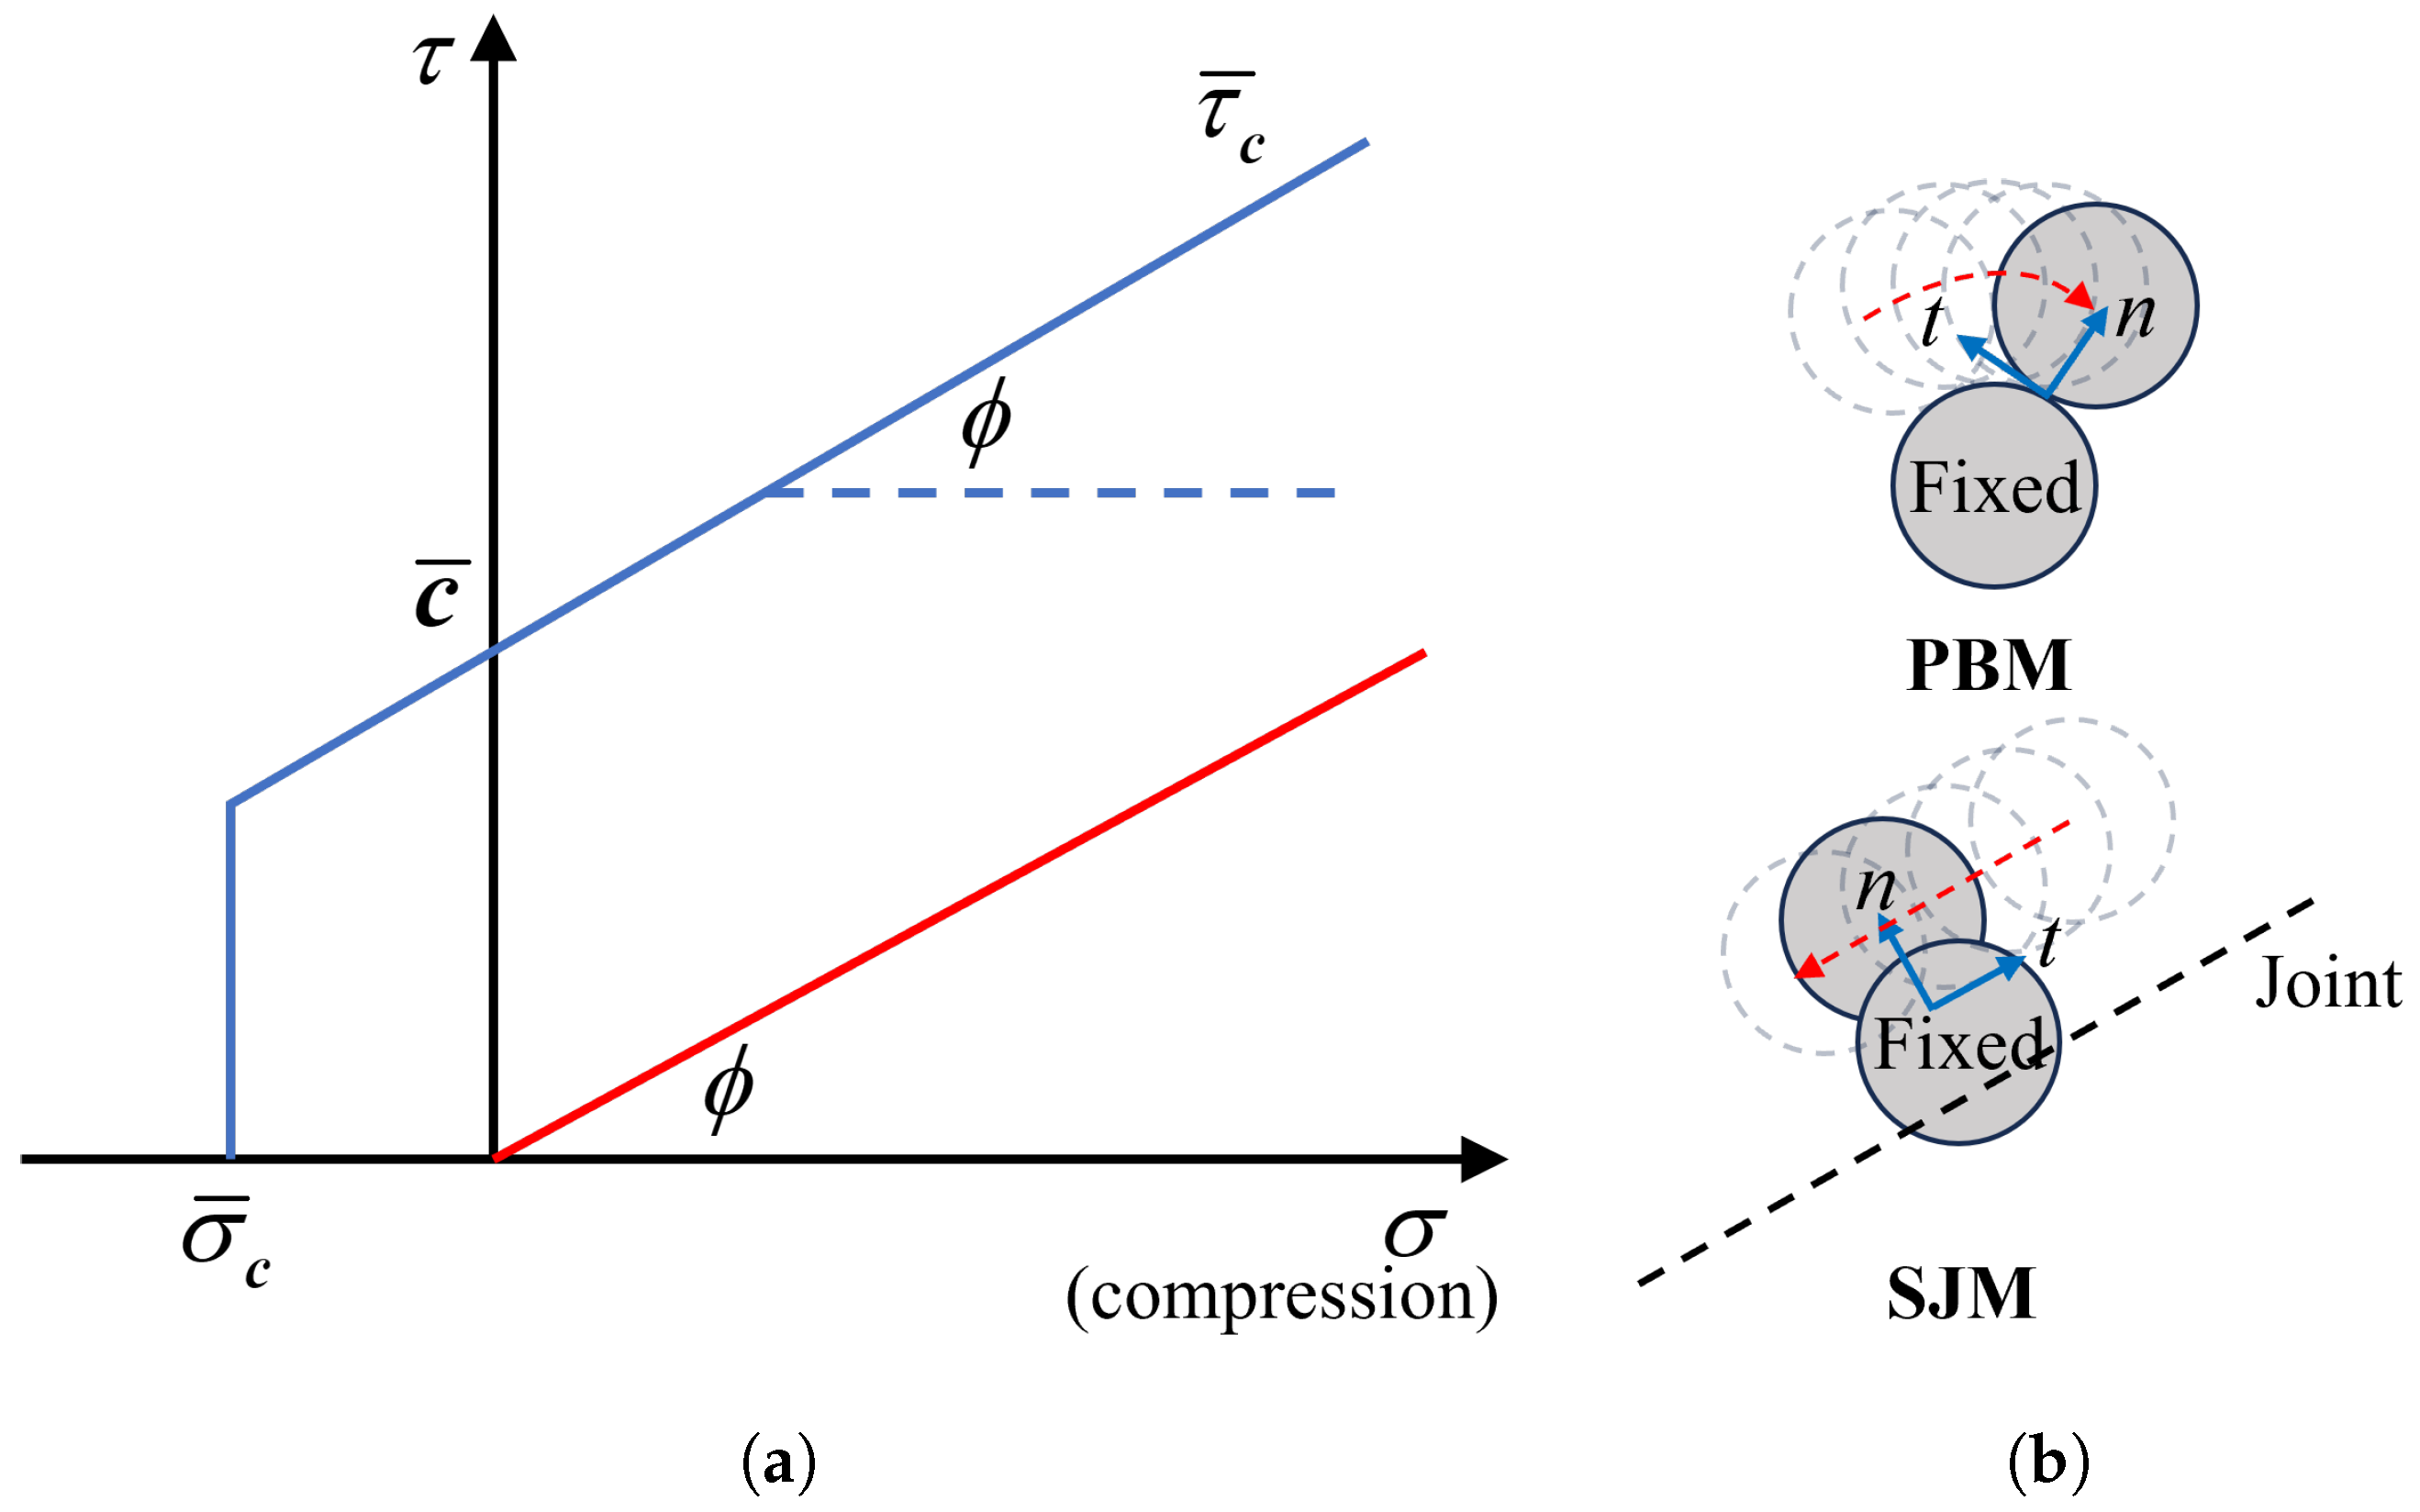
The DEM, proposed by Cundall and Strack [35] based on the molecular dynamics theory, is an explicit algorithm that employs disks (2D) or spheres (3D) as the fundamental elements of material aggregations. This method applies Newton’s second law and force–displacement law to all elements for the calculation of their movement [46]. The utilization of different contact models enables the DEM to simulate the mechanical behaviors of various types of geomaterials. Specifically, the application of the Parallel Bond Model (PBM) generates inter-particle bondings in the DEM model, thereby characterizing the DEM with continuous deformation and specific strengths [47]. Additionally, the Smooth Joint Model (SJM) was developed to model natural fractures in rocks, allowing simulation of the relative slip of the rock media on the two sides of a smooth interface [48,49,50]. The strength envelopes of the PBM and SJM are elaborated in Figure 1a. For the PBM, the bond breaks when the tensile stress exceeds the tensile strength limit or the shear stress exceeds the shear strength limit , which is given by
where is the cohesion (Pa), and is the friction angle (°). On the other hand, the SJM assigns shear strength for unbonded joints, and the shear stress is proportional to the friction angle and normal stress . Figure 1b shows the relative motion of two unbonded particles in the PBM and SJM. It can be observed that particles tend to roll along others’ surfaces in the PBM while sliding along the predefined joint in the SJM.
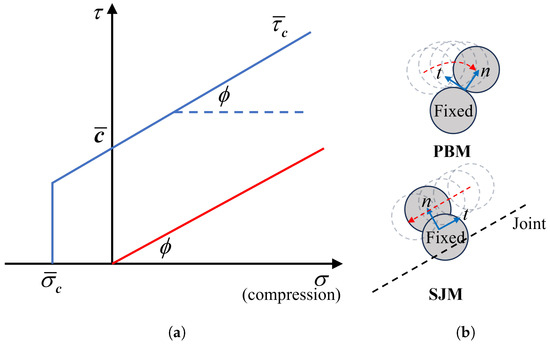
Figure 1.
Schematic diagrams of (a) strength envelops (blue: PBM; red: SJM) and (b) relative motion of unbonded particles in PBM and SJM (modified from Zhang et al. [32]).
2.1. Pore Network Model
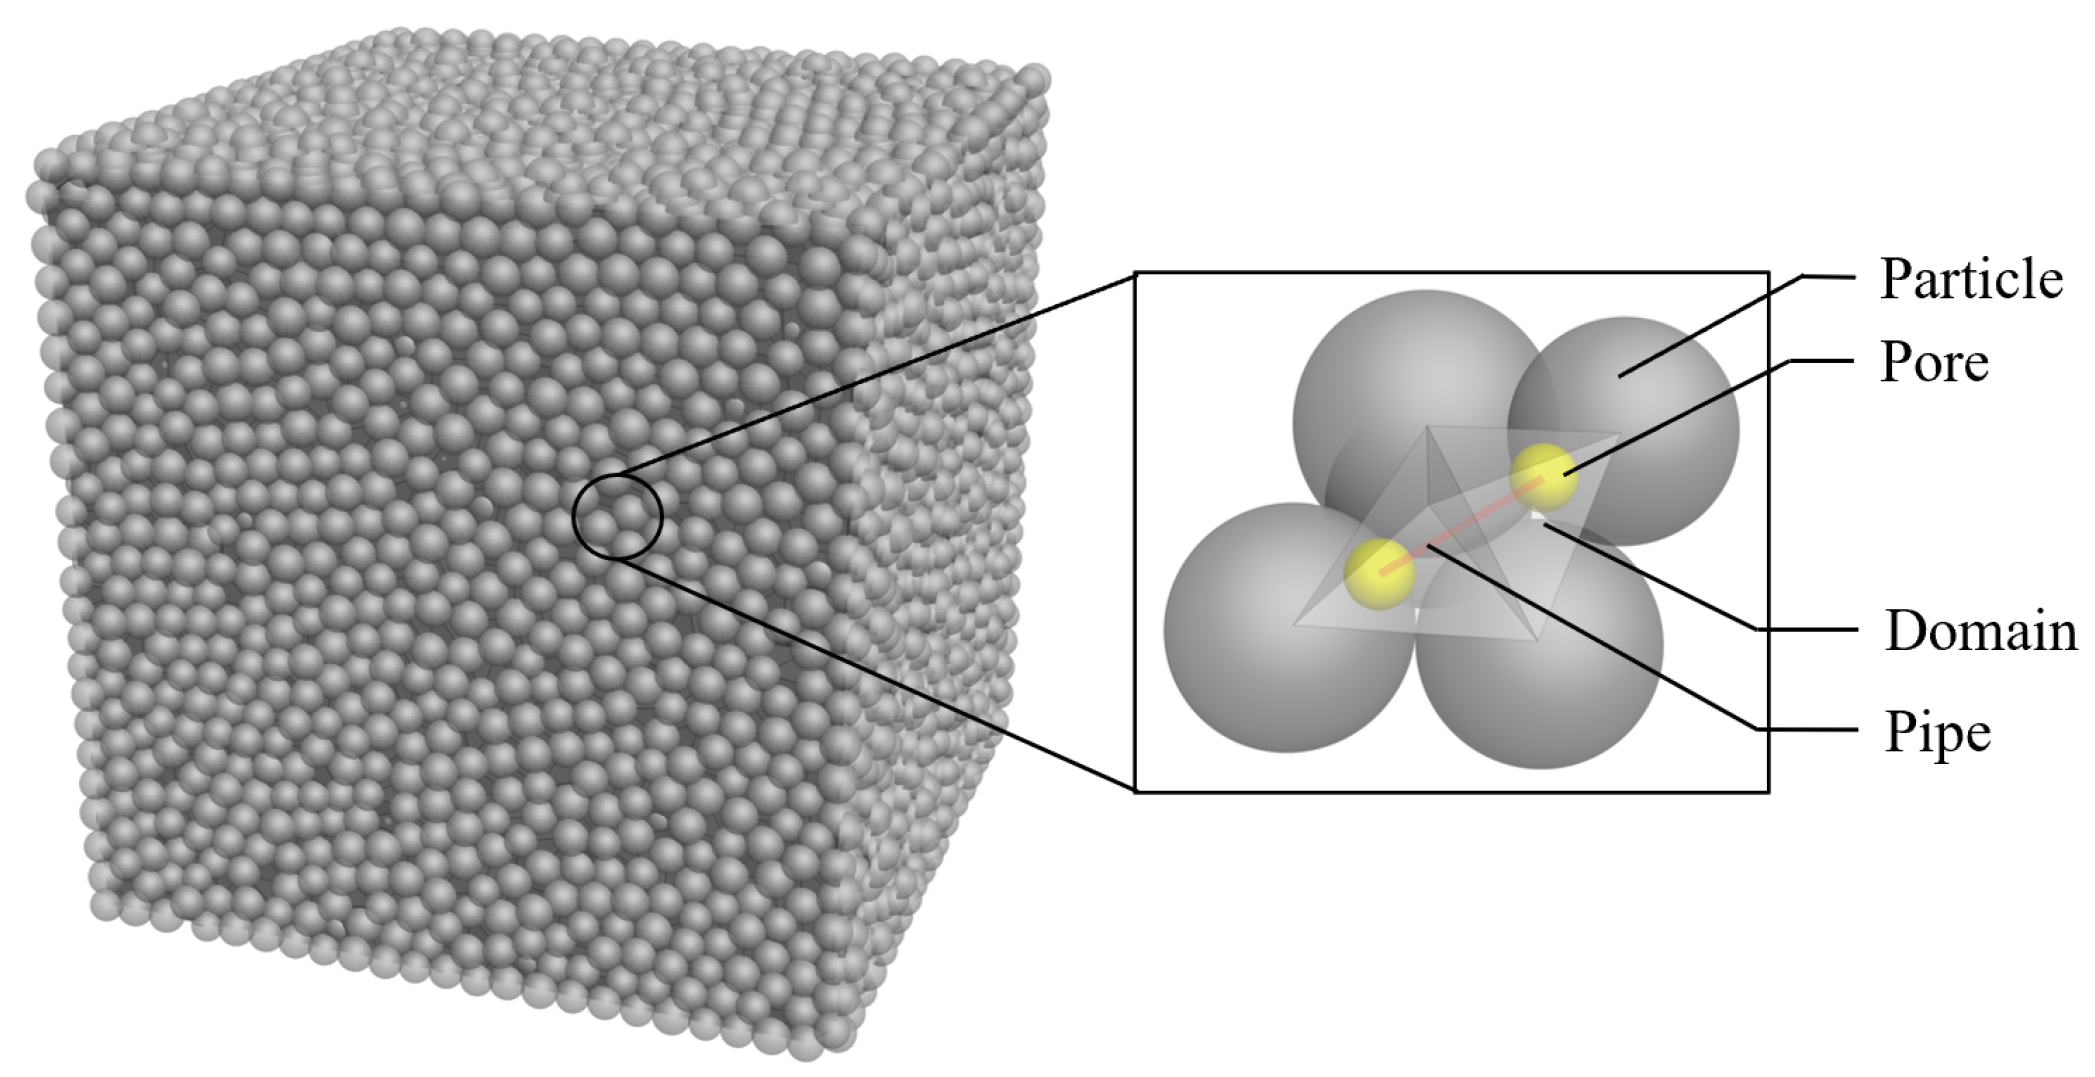
The DEM is inherently designed for solid materials; thus, achieving multifield or multiphase coupling simulations poses a significant challenge [30]. By integrating the DEM with the pore network model [51], hydromechanical coupling becomes feasible. In this coupling, the DEM evolves the stress distribution in the particle skeleton and manages bond breakage, while the pore network model calculates the fluid flow and updates the distribution of pore pressure. The hydromechanically coupled model is illustrated in Figure 2.
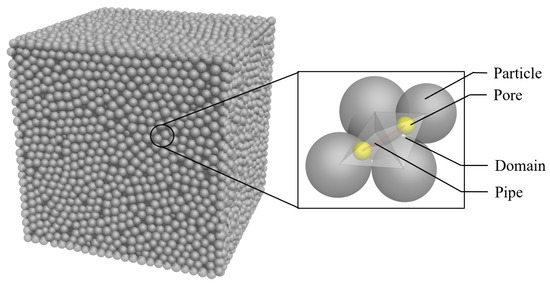
Figure 2.
Hydromechanical coupling based on DEM and pore network model.
The pore network model is constructed based on the distribution of a particle skeleton, encompassing polyhedral domains with vertices corresponding to neighboring particles. The fundamental unit of the pore network model is defined as a domain with a specific pore pressure. Within this model, the term “pipe” denotes the fluid channel connecting two neighboring domains. When a pressure difference exists, the resulting flow rate (q, ) in the pipe can be determined by the Hagen–Poiseuille equation:
where is the dynamic viscosity of the fluid (Pa·s); is the pressure difference between the domains (Pa); is the length of the pipe (m); and is the hydraulic radius of the pipe (m), which is calculated by
where is a sensitivity coefficient representing the sensitivity of the pipe radius decreasing with the increase in normal stress; and are the pipe radius under zero and infinite external load (m); and denotes the pipe radius after the bond breaks (m). The permeability k of the intact rock model () can be determined by
where is the volume of the pore network model (), and denote all pipe objects in the pore network model. Within a single timestep , the pressure increment in a specific domain can be expressed as
where is the bulk modulus of the fluid (Pa), and is the domain volume (). is the net volume of fluid flowing in/out of the pore (), and is the domain volume variation caused by mechanical deformation ().
2.2. Model Adaptation for Bedding Planes
By combining the PBM and SJM, the mechanical behaviors of different types of the bedding planes can be characterized. Specifically, the modeling of the continuous bedding planes and transitional bedding planes can be realized by assigning different values to the microparameters of the PBM and particles in the specific regions of the model. Meanwhile, the modeling of the discontinuous bedding planes involves introducing the SJM joints into the model.
Furthermore, it is essential to consider the hydraulic properties of the bedding planes. As illustrated in Equation (4), the permeability of a rock model with a fixed particle skeleton is determined by the hydraulic radius . In the case of shale rocks, the bedding planes exhibit different permeability from the rock matrix. Therefore, the distribution of should be adapted to the specific settings of the bedding planes. The expressions of the for each type of the bedding planes are as follows:
where is a scaling coefficient for adjusting the hydraulic radius of the continuous or transitional bedding planes to characterize the different permeability of filling minerals. For the discontinuous bedding planes that present as spatially discontinuous interfaces, the hydraulic radius is set to .
2.3. Seismicity Computation
During the initialization and propagation of the hydraulic fractures, the strain energy released by rock cracking can induce seismicity. In the DEM, the seismic energy is released by bond breakage, where part of the accumulated strain energy is released to the surrounding media by seismic waves [39]. Based on the position and variation of the contact forces around the seismic event, the moment tensor is given by the following [52,53]:
where is the ith component of the contact force change (N), is the jth component of the distance between the contact point and the event centroid, and S denotes the surface enclosing the event. Then, the scalar moment can be calculated by the moment tensor:
where is the jth eigenvalue of the moment tensor matrix. The moment magnitude of the seismic event can then be calculated by
In practice, seismic events that occur within a short time interval and a specific region are clustered into a single event. With a preset time window and space window for a given set , where all occurs within and the maximum distance is less than , the clustered moment tensor is
The moment tensor and moment magnitude are then calculated by .
3. Model Setup, Calibration, and Validation
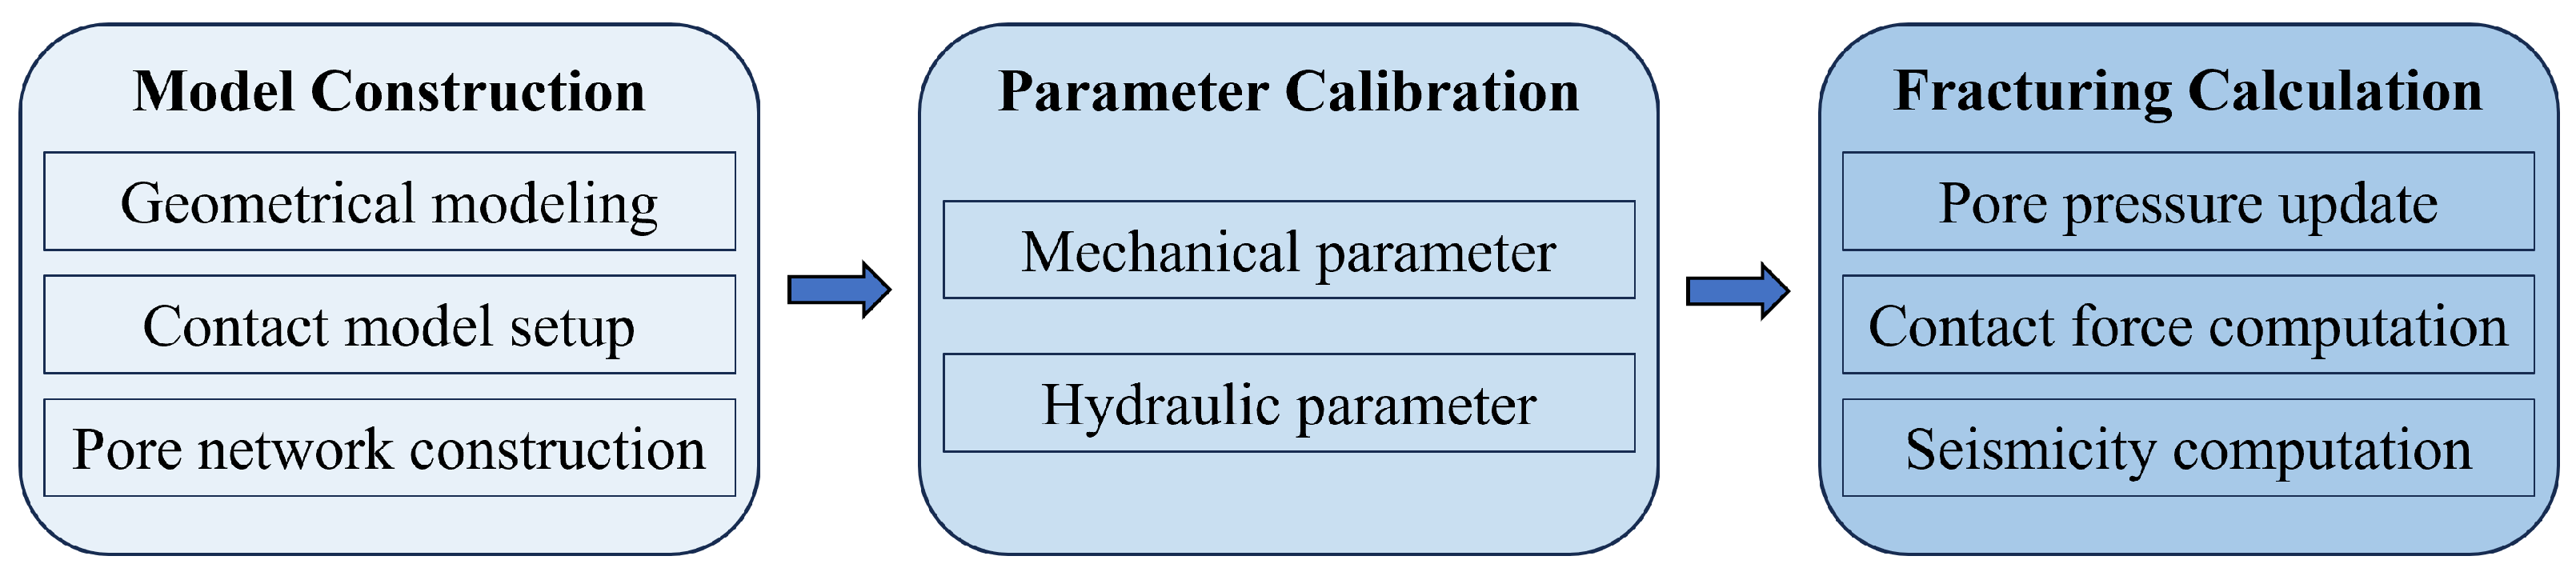
An overall illustration of the proposed method is presented in Figure 3, in which the model setup and parameter calibration process will be elaborated in this section.
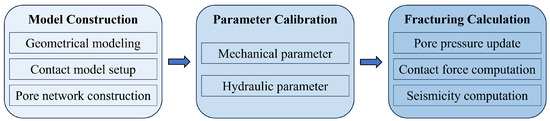
Figure 3.
Overview of the proposed method for simulating hydraulic fracturing in shale samples based on DEM.
3.1. Model Setup
This study established a DEM model to depict the hydraulic fracturing process using the PFC 3D platform [46]. The dimensions of the model were set to 300 × 300 × 300 mm to match the sample size used in the TTFE. For realistic shale properties [23], a porosity of 5.0% was applied. The minimum particle size was set to 0.012 m, and the ratio between the maximum and minimum particle sizes was 1.2, resulting in 21,103 particles. The PBM was assigned to all the inter-particle contacts, creating a homogeneous rock model. The general model parameters are detailed in Table 1.

Table 1.
Macroscopic model parameters and mechanical properties.
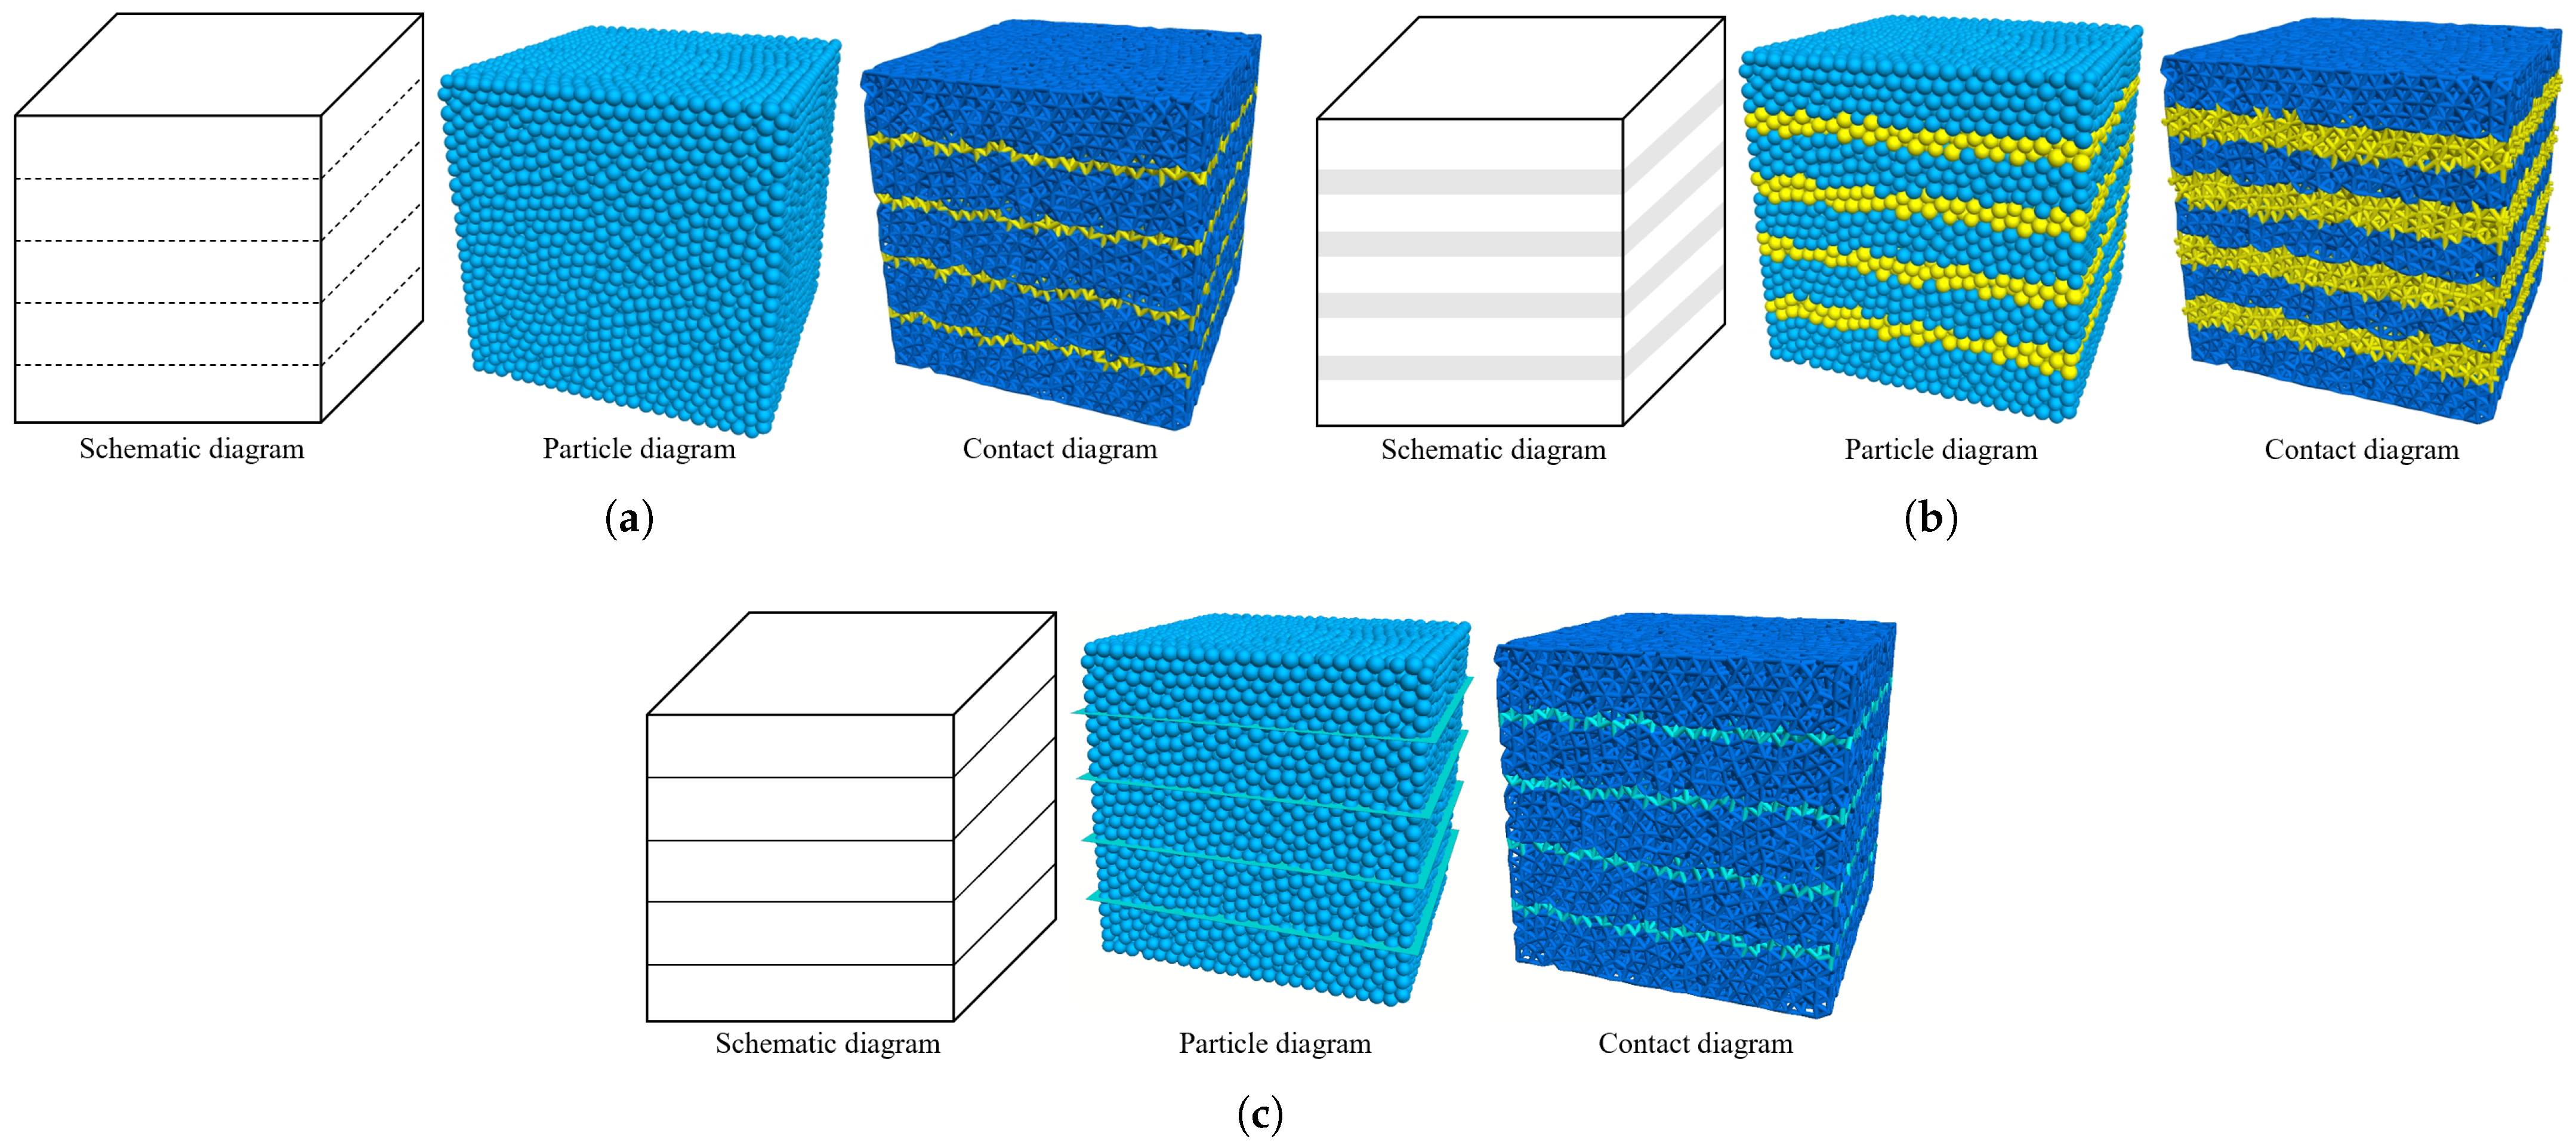
Following the establishment of the homogeneous rock model, different types of the bedding planes were introduced into the model. To clarify the differences, the structural characteristics in natural rock samples and the corresponding modeling strategies of each type are presented in Table 2, and an illustration is shown in Figure 4. Specifically, due to the ultra-thin nature of continuous bedding planes, they were mimicked as interfaces with no thickness. The particles on the two sides of the continuous bedding planes were all assigned to the “rock matrix” group, while only the inter-particle contacts on these interfaces were categorized into the “continuous bedding planes” group (Figure 4a). On the other hand, the transitional bedding planes were layers with specific thicknesses (2 mm in this study); thus, both the particles and inter-particle contacts within these layers were assigned to the “transitional bedding planes” group (Figure 4b). The PBM was applied to the inter-particle contacts in both the “continuous bedding planes” and “transitional bedding planes” groups, and different values of the PBM microparameters were assigned to them. In particular, the particles in the “transitional bedding planes” group were also assigned with distinct properties. Additionally, the discontinuous bedding planes were represented by a series of preset discrete joints using the SJM, mimicking the unbonded characteristics of discontinuous bedding planes (Figure 4c). Similar to the continuous bedding planes, only the inter-contacts on the joint interfaces were assigned to the “discontinuous bedding planes” group because of the low thickness, while the particles on the two sides were still grouped into the “rock matrix” group. Note that the number of all types of bedding planes was fixed at four in this study unless otherwise specified.
Table 2.
Structural characteristics and modeling strategies of the bedding planes.

Figure 4.
Illustration of the shale samples containing the different types of the bedding planes: (a) continuous bedding planes; (b) transitional bedding planes; (c) discontinuous bedding planes (blue particle—rock matrix; yellow particle—transitional bedding planes; blue contact—rock matrix; yellow contact—continuous/transitional bedding planes; cyan contact—discontinuous bedding planes; cyan plane—preset SJM joint).
3.2. Calibration of Mechanical Parameters
The microparameters of the model require calibration using real-world data before executing the hydraulic fracturing simulation. The calibration of mechanical parameters involves simulating the uniaxial compressive tests on shale samples and comparing the results with experimental conclusions. The strength of the rock matrix is referenced from measurements conducted by Hou et al. [23] on natural shale outcrops. Since continuous and transitional bedding planes are filled with minerals different from the rock matrix, they present distinct mechanical behaviors [54]. Additionally, no evident relationship between the mineral composition and the thickness of bedding planes has been reported, and the composition is dependent on the sedimentary environment [12,13]. Thus, the microparameters of the PBM for the continuous and the transitional bedding planes were consistent in this study for simplicity, but different microparameters of particles were additionally set for the transitional bedding planes. In addition, the microparameters of the SJM were referred from the DEM models calibrated by Liu et al. [55]. The macroparameters and properties of the rock matrix and the bedding planes are detailed in Table 1, while the corresponding microparameters are listed in Table 3.
Table 3.
Microparameters of the rock matrix and the bedding planes.
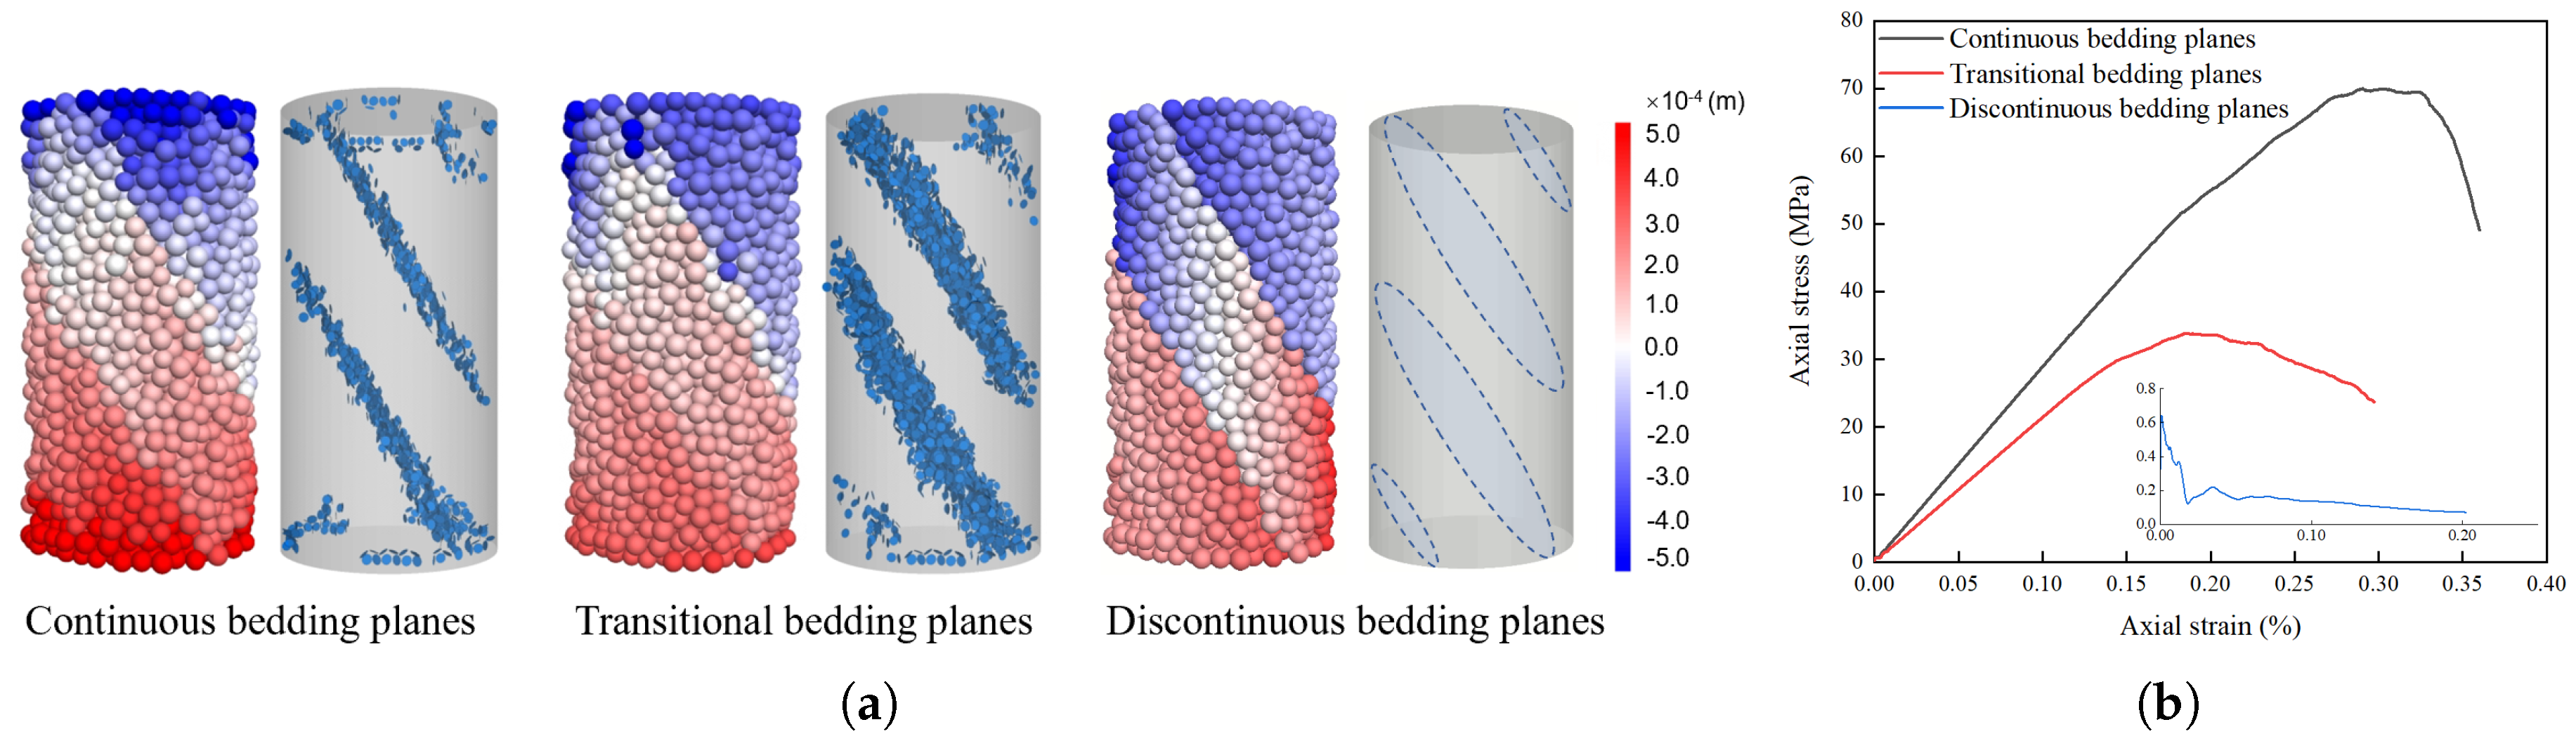
To examine the calibration, the failure status and particle displacement of shale samples with different types of bedding planes after uniaxial compressive simulations are presented in Figure 5. In these sample cases, the orientation angle of the bedding planes, defined as the angle between the bedding planes and the axial stress [56], was set to 30°. Observations reveal that the failure regions in the samples align with the bedding planes, indicating the weaker strength of the bedding planes compared to the rock matrix (Figure 5a). Especially, the cracking bands developed in the sample containing the transitional bedding planes are thicker than those developed in the sample containing the continuous bedding planes, accounting for a lower uniaxial compressive strength (UCS) (35.4 MPa) and a lower elastic modulus (12.6 GPa) of the former than those of the latter, as illustrated in the strain–stress diagram (Figure 5b). Due to the unbonded nature of the discontinuous bedding planes, deformation occurred along the preset joints represented by semitransparent interfaces with no microcrack developing, and the sample exhibited neglectable resistance to axial stress. Correspondingly, the strain–stress diagram depicts an abrupt increase at the start of loading, followed by a decrease to a steady stage where the sample experienced frictional slipping along the bedding planes, where the friction stress was around 0.1 MPa (Figure 5b).

Figure 5.
Illustration of the (a) failure status and particle displacement and the (b) strain–stress diagram of shale samples containing different types of bedding planes in uniaxial compressive tests (blue disk—microcrack; blue interface—preset SJM joint).
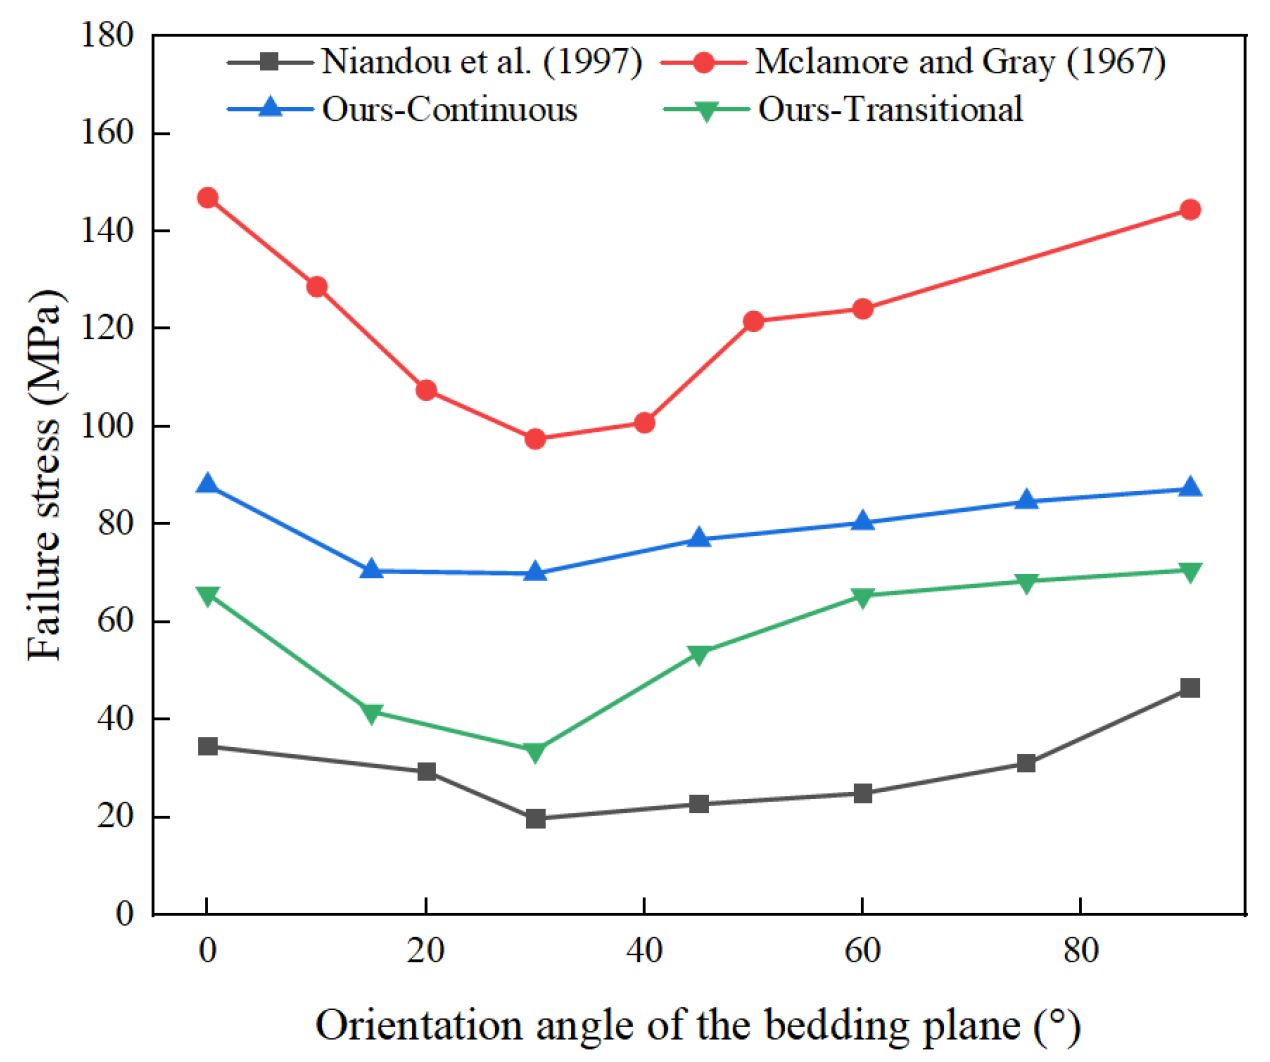
Moreover, Mclamore [57] and Niandou et al. [56] conducted compressive strength tests on natural shale samples under different orientation angles. For comparison, uniaxial compressive simulations on samples containing the continuous and the transitional bedding planes under the same orientation angle settings as the experiments were conducted, and all the results are presented in Figure 6. The results reveal a similar variation trend concerning the orientation angle of bedding planes. When the orientation angle was 0 or 90°, the compressive strength of the shale samples was relatively high. However, it decreased when the orientation angle was between 0 and 90°, with the lowest strength value for all experimental and simulation samples occurring around 30°. This finding further validates the capability of the calibrated shale model for simulating the mechanical properties of the natural shale samples.
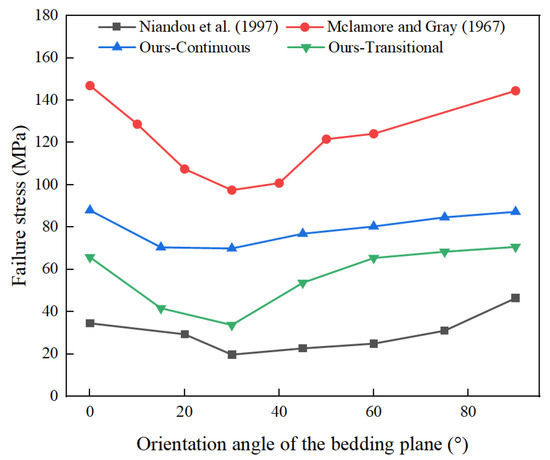
Figure 6.
Compressive strength of shale samples under different orientation angles of bedding planes [56,57].
3.3. Calibration of Hydraulic Parameters
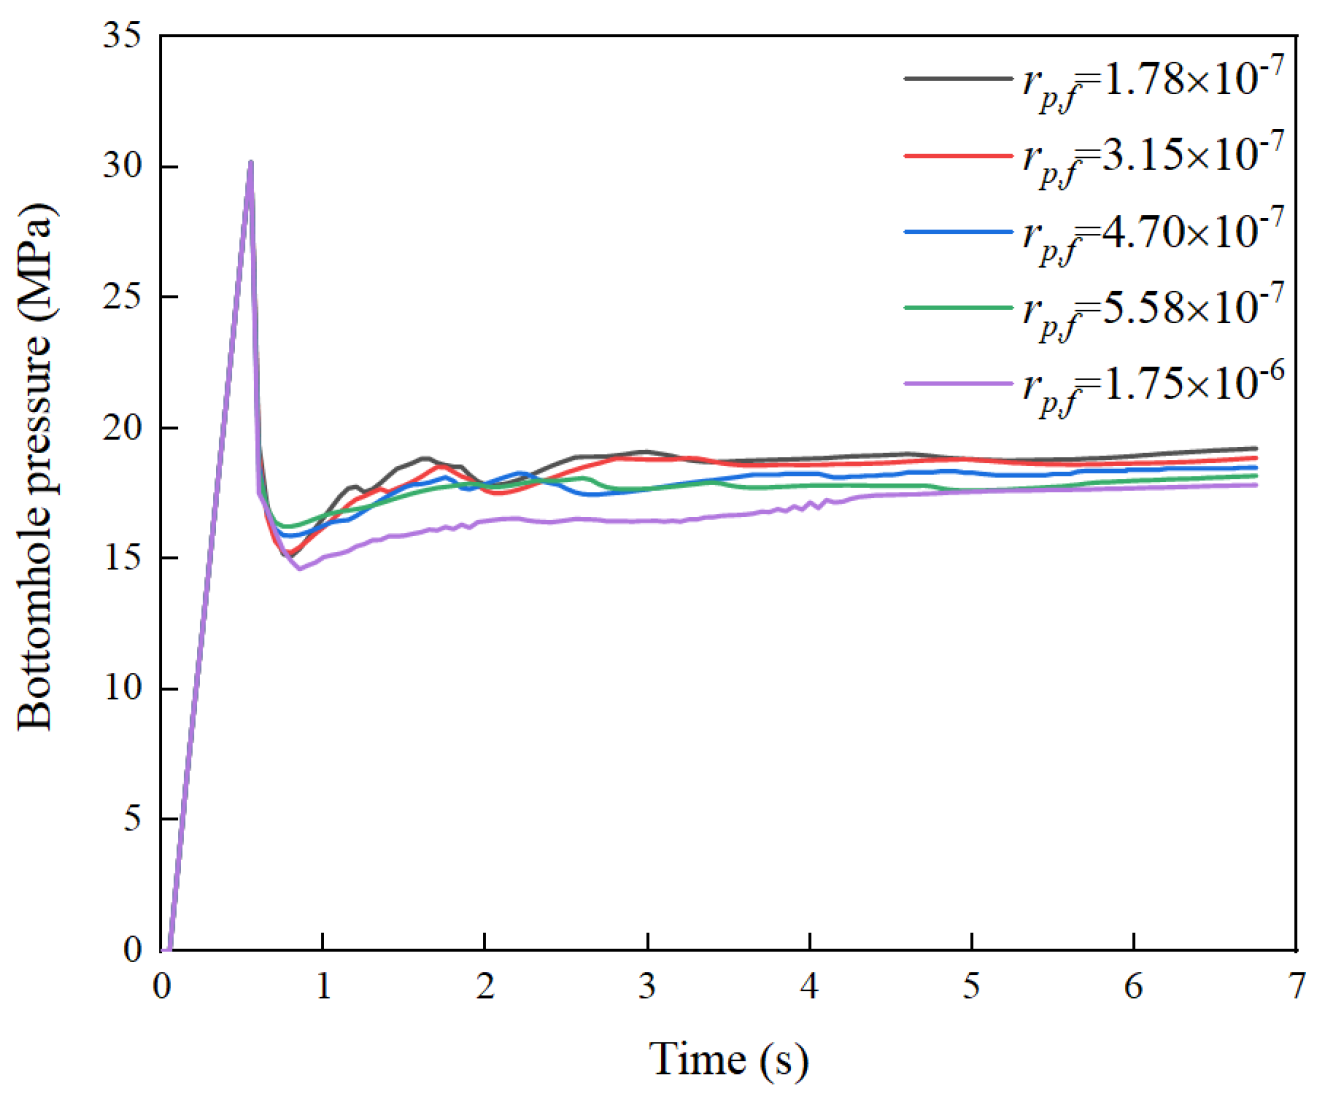
The hydraulic parameters of the hydromechanical coupled model also require calibration to accurately characterize the permeability of the bedding planes. As outlined in Equation (3), the hydraulic radius of the pipes, influencing the flow rate between neighboring pores, depends on four parameters: , , , and . Among them, was empirically set as −1.5 [38,58], and the values of and were determined from Equation (4), establishing a connection between the permeability of the intact rock sample and microscopic parameters. The reported average permeability of the shale formation is as low as 0.1 mD [23], with the permeability under infinite external load significantly lower than that under zero external load. Consequently, the values of and were set at m and m, respectively. To understand the influence of on the fracturing outcome, a series of comparative simulations under different values of were conducted in homogeneous models. The bottomhole pressure curves are presented in Figure 7. Observations indicate that as increases, the fracture extension pressure decreases due to higher fracture permeability. However, the difference in fracture extension pressure under various values is not significant, suggesting a relatively broad range for selecting the value. Therefore, a median value m was set for in this study.
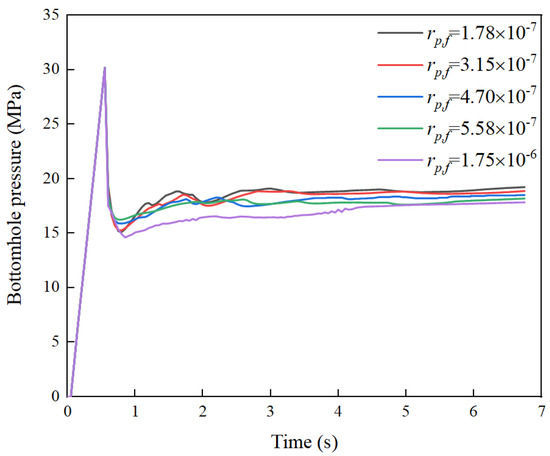
Figure 7.
Bottomhole pressure curves under different value of breakage pipe radius .
The permeability scaling coefficient in Equation (6) underwent calibration through a series of flow test simulations. Each simulation involved measuring the permeability in different flow directions, parallel and perpendicular to bedding planes, with different values of being set. The model size was 0.15 × 0.15 × 0.3 m, with 0.3 m representing the sample size in the flow direction. The inlet pressure was maintained at 1.0 MPa, while the outlet pressure was set at 0. A surrounding pressure of 12.0 MPa was applied to the shale models [59]. By monitoring the flow rate, the permeability of the shale models could be calculated using Darcy’s law:
where Q is the flow rate (); k is the permeability (); is the fluid viscosity (); is the pressure different between inlet and outlet (Pa); A and L are cross-area () and length (m) of the sample.
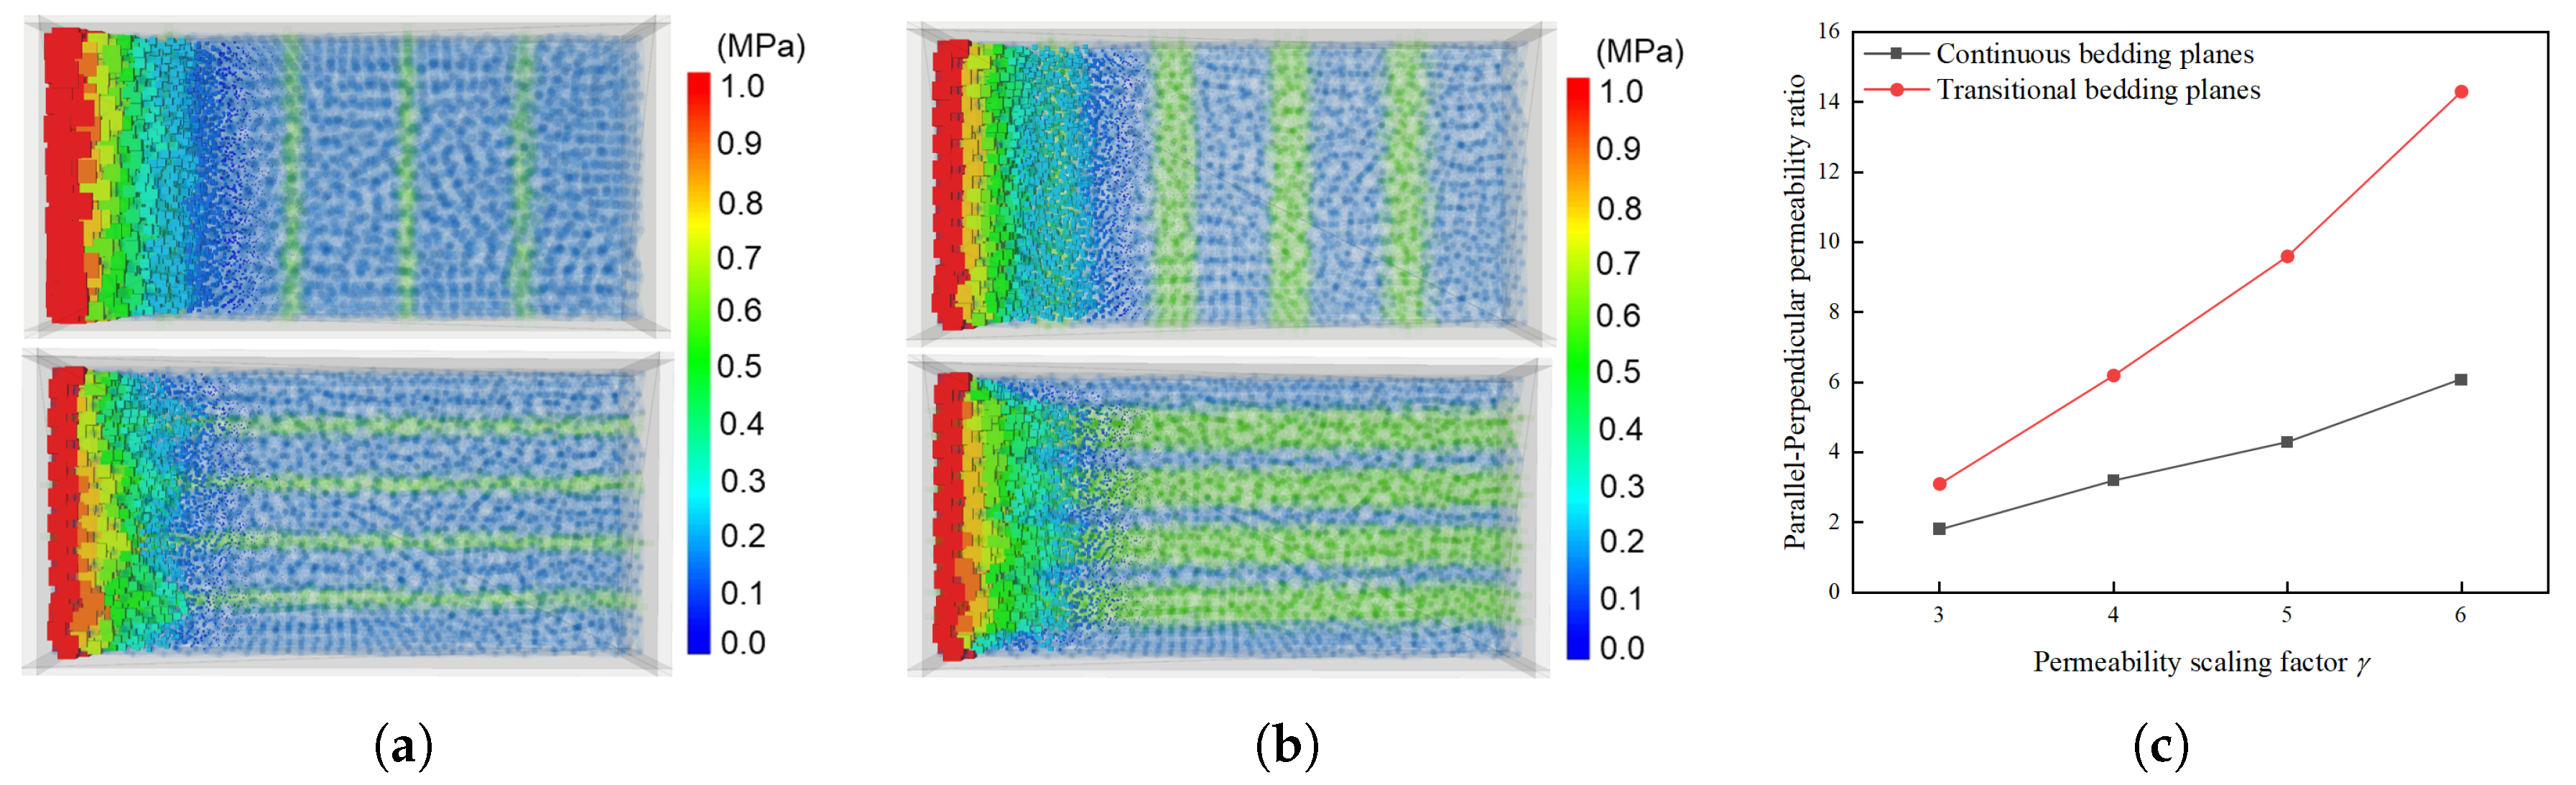
Figure 8a,b present the distribution of fluid pressure during the flow test simulations in the shale models containing the continuous and transitional bedding planes before the steady state was reached, respectively. Note that the rock matrix and bedding planes are illustrated by semitransparent inter-particle contact groups. It can be observed that the fluid front appeared to have a smooth transition in terms of the pressure distribution when the bedding planes were perpendicular to the flow direction. On the other hand, the pressure transition on the fluid front was relatively rough when the bedding planes were parallel to the flow direction, and the fluid front within the bedding planes was ahead of the front within the rock matrix due to the higher flow rate within bedding planes compared to that in the matrix, resulting in a comparatively higher intact permeability value. Figure 8c displays the permeability ratio measured from the shale models containing bedding planes parallel and perpendicular to the flow direction under different values of permeability scaling coefficient . It is indicated that both of the models containing the continuous and transitional bedding planes exhibited a nearly linear increasing trend in the parallel-to-perpendicular permeability ratio with . In addition, the shale model with the transitional bedding planes showed a more profound increasing trend in permeability ratio than that with the continuous bedding planes, as it contains a larger range of high-permeability area. By referencing the permeability values measured parallel/perpendicular to the bedding planes in the natural shale samples [13,59], an appropriate value of was determined to be 5.0. All the values of the hydraulic parameters can be found in Table 4.

Figure 8.
Calibration of the permeability scaling coefficient : fluid pressure distribution in shale models with the (a) continuous and (b) transitional bedding planes being perpendicular (top) or parallel (bottom) to the flow direction; (c) variation in parallel-to-perpendicular permeability ratio under different values of the permeability scaling coefficient (blue semitransparent contact group—rock matrix; green semitransparent contact group—bedding planes.
Table 4.
Hydraulic model parameters.
3.4. Model Validation
For validation, the model was first compared with the radial model [60], which describes a penny-shaped fracture developed in a homogeneous media and provides the fracture aperture:
where r is the radio coordinate (dimensionless); t is time (s); () is a coordinate (dimensionless); is a small number (dimensionless); and is a length scale, (m), and these are expressed as
where E is the elastic modulus (Pa); is the Poisson’s ratio of the rock (dimensionless); is the fracture radius (m); denotes the fluid viscosity (); and is a parameter monotonically related to t (dimensionless). The opening estimate is parameterized by
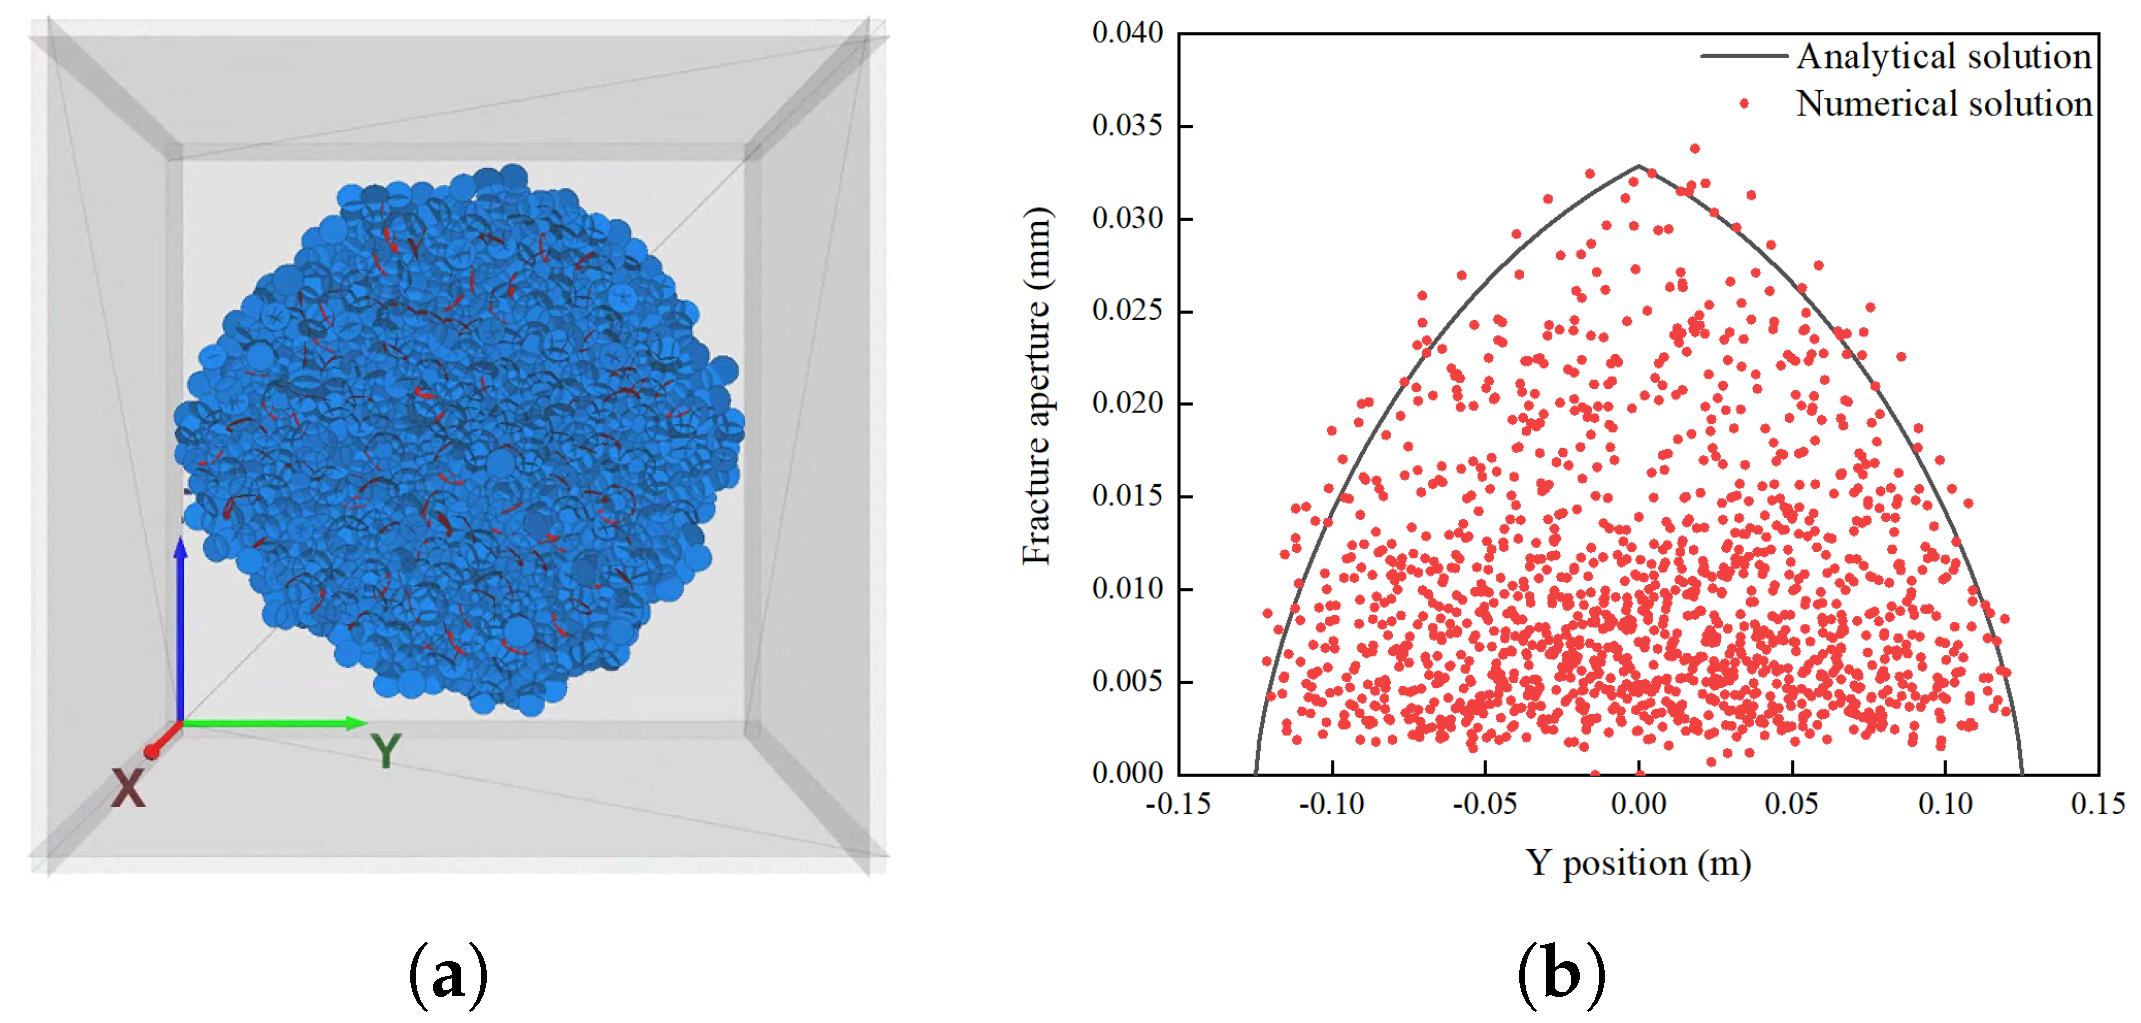
where , , and . To verify the proposed model, the simulated hydraulic fracture developed in a homogeneous rock model is presented in Figure 9a, and a typical penny-shaped simple fracture can be observed, which is in accord with the radial model. Note that the hydraulic fracture simulated in this study refers to the whole fracture, which consists of a lot of microcracks denoting the inter-particle bonding breakages. Furthermore, the analytical fracture aperture calculated by Equation (12) to
Equation (14) was compared with the numerical results. Figure 9b showcases the comparison results, in which the fracture apertures in the numerical simulation are presented by red dots, while the analytical solution is presented by a gray line. It can be observed that most of the dots are located within the enclosed area of the curve of the analytical solution, while the envelope of the dot set aligns closely with the curve, implying that the fracture aperture distribution has been accurately depicted.

Figure 9.
Model validation in the homogeneous media: (a) developed hydraulic fractures; (b) fracture aperture distribution of numerical simulation and analytical solution (blue disk—tensile microcrack; red disk—shear microcrack).
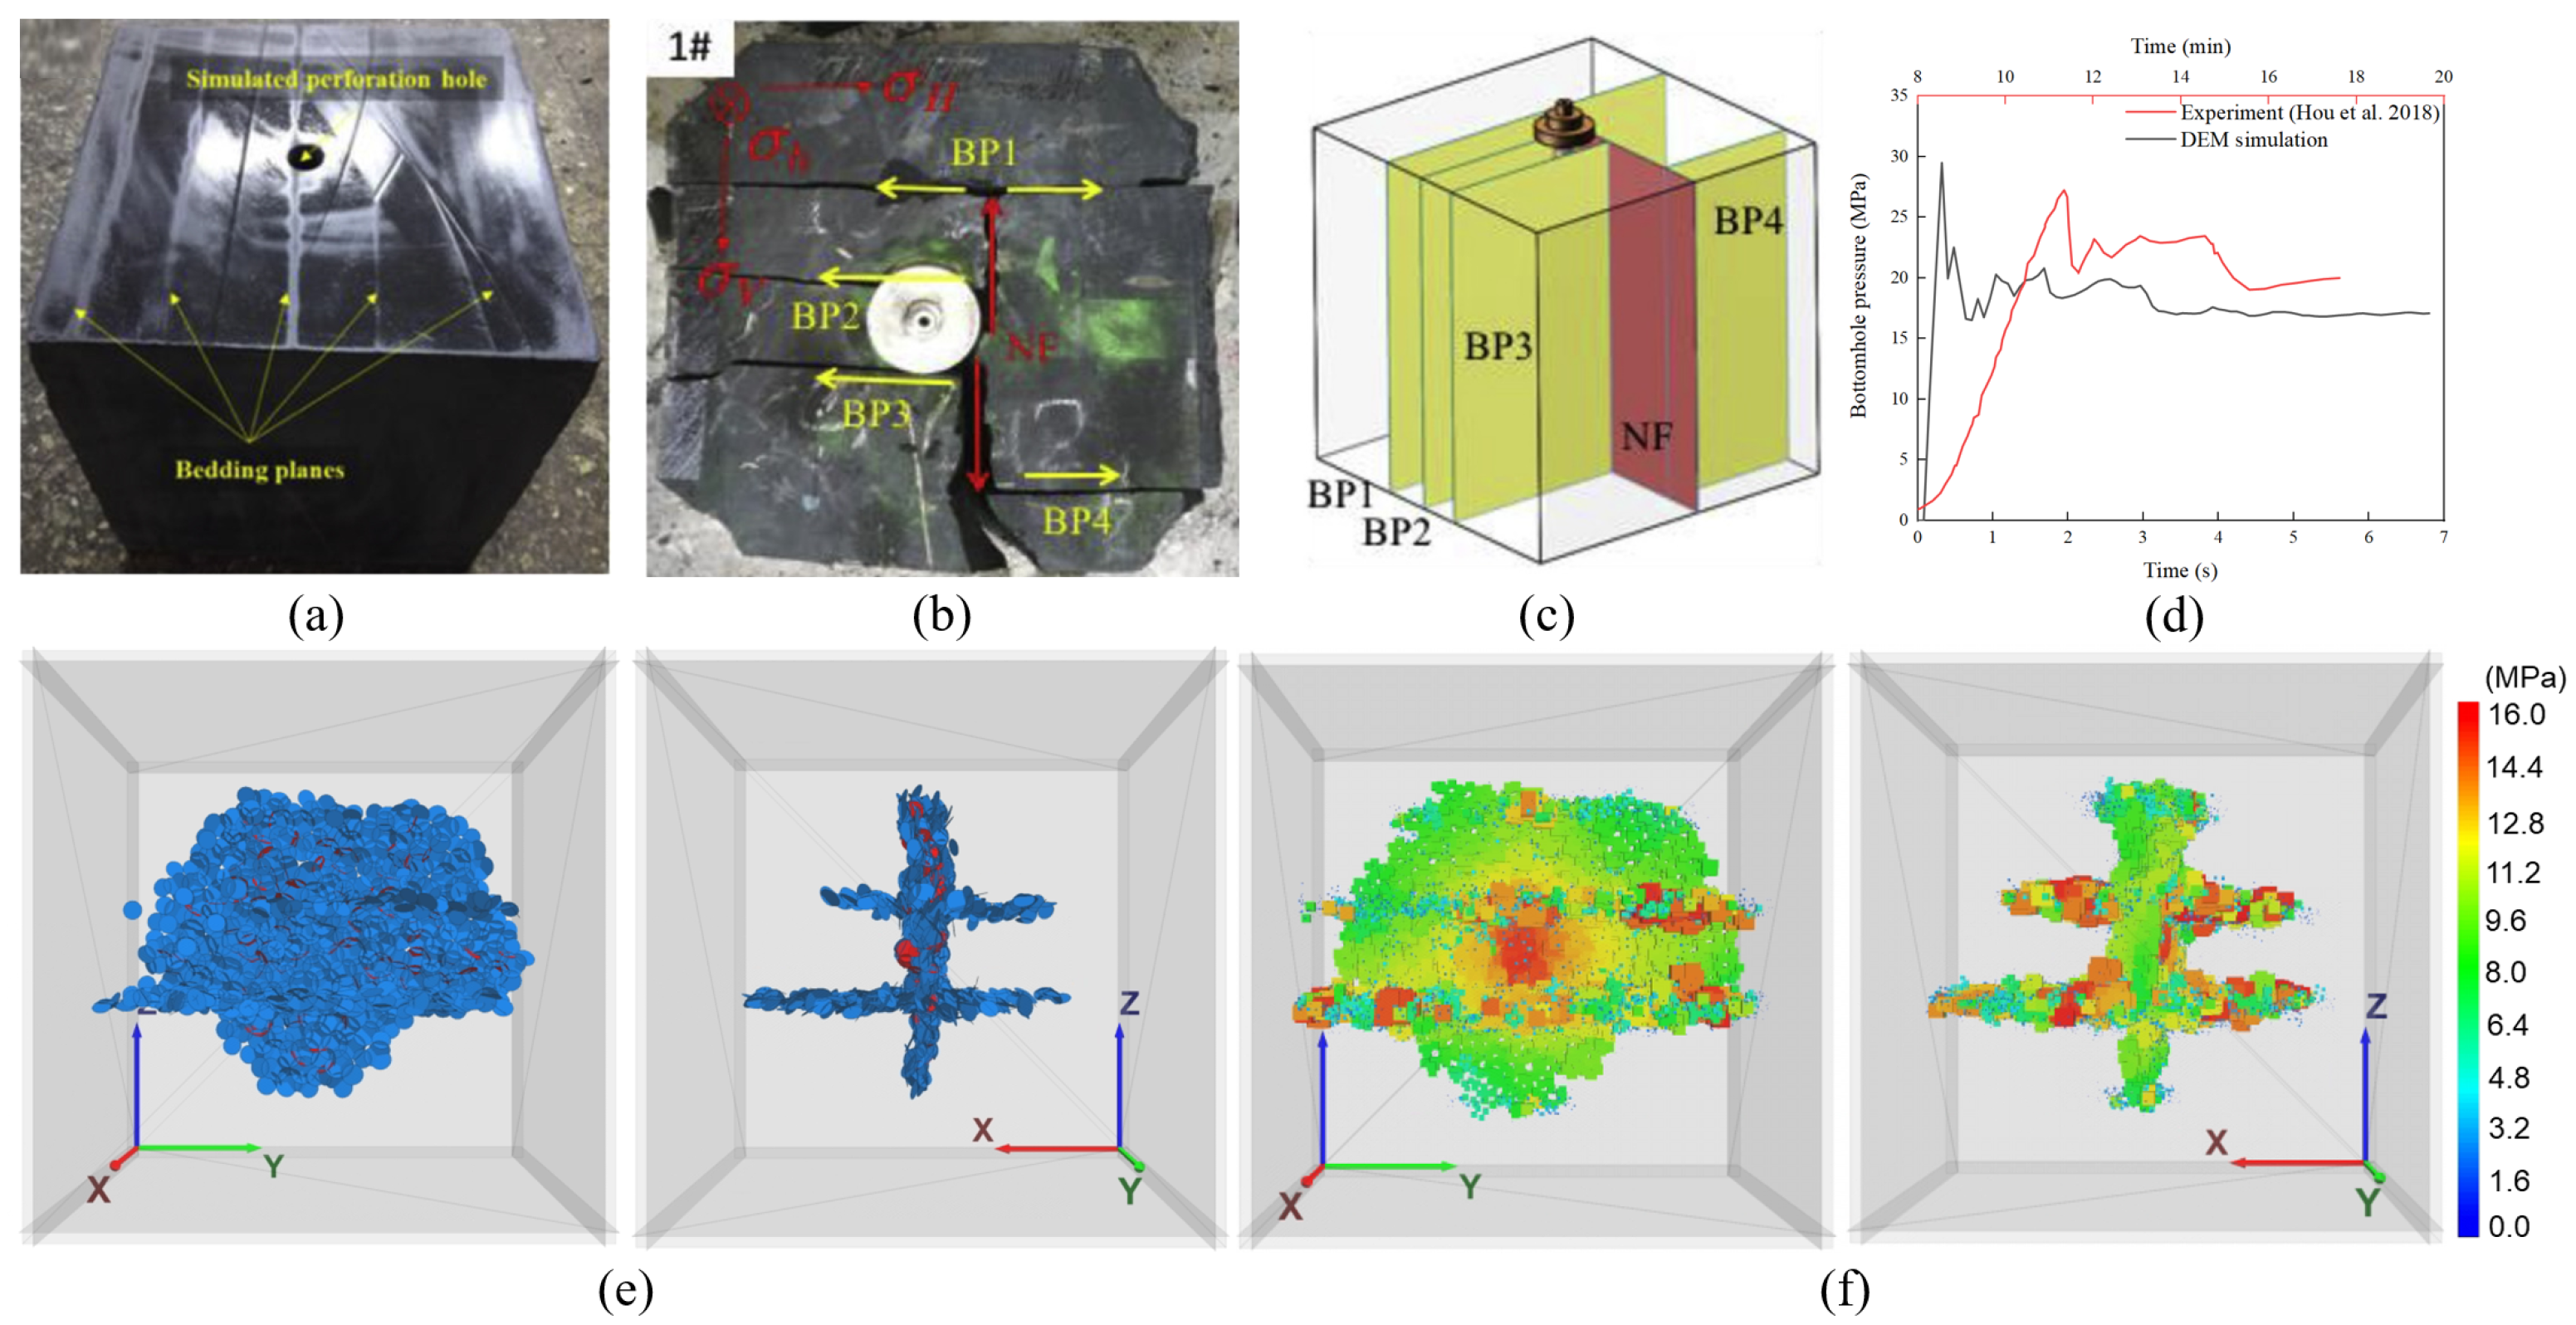
The model was further validated by the experimental results on shale. The chosen case involved sample 1 from Hou et al. [23], which is a natural shale outcrop containing bedding planes, as depicted in Figure 10a. The bedding planes observed in the natural shale outcrops are spatially continuous but present as interfaces with no obvious thickness. Thus, they were considered as continuous bedding planes, and the DEM model was initialized correspondingly as described in Figure 4a. The experimental parameters outlined in Table 5 were also adopted in the simulation. Examination of Figure 10b,c reveals that the hydraulic fracture in sample 1 triggered the activation of bedding planes within the shale sample, forming a complex fracture network. Similarly, the simulation results also demonstrated the formation of a complex fracture network (Figure 10e) as the hydraulic fracture activated and penetrated the bedding planes. Additionally, the bottomhole pressure curves from both the experiment and simulation are detailed in Figure 10d. It was found that the values of breakdown pressure and extending pressure in both curves are similar, signifying the capability of the proposed DEM model to replicate fluid pressure variations in the fracturing process. Note that since the fluid was injected through a wellbore in the experiment, while it was injected at the injection point in the model, so more fluid leak-off happened in the experiment, resulting in the breakdown pressure in the experiment being 2.25 MPa (8.25 %) lower than that in the simulation. Overall, the model was confirmed to be valid in samples featuring bedding planes.

Figure 10.
Model validation in shale sample: (a) natural shale outcrop containing bedding planes; (b) hydraulic fracture developed in sample 1; (c) fracture reconstruction; (d) bottomhole pressure curves from the experiment and simulation [23]; (e) front view and lateral view of the hydraulic fracture from simulation; (f) front view and lateral view of the fluid pressure distribution from simulation.
Table 5.
Experimental parameters on shale sample.
4. Results and Discussion
4.1. Impact Comparison of Different Bedding Planes
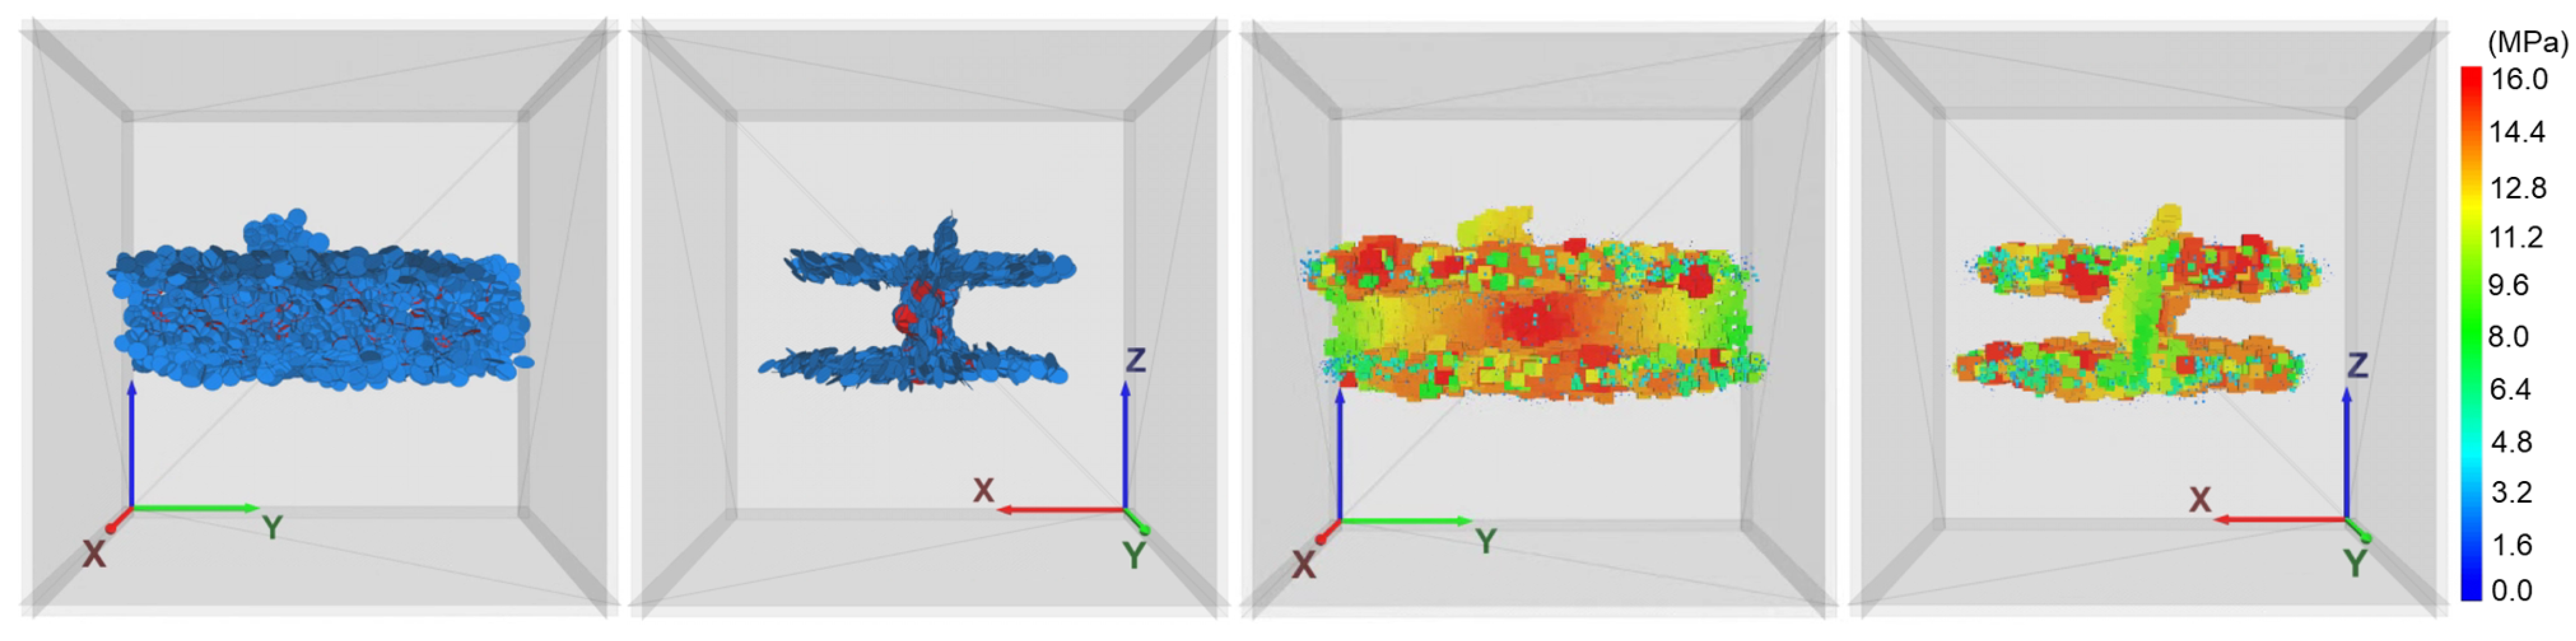
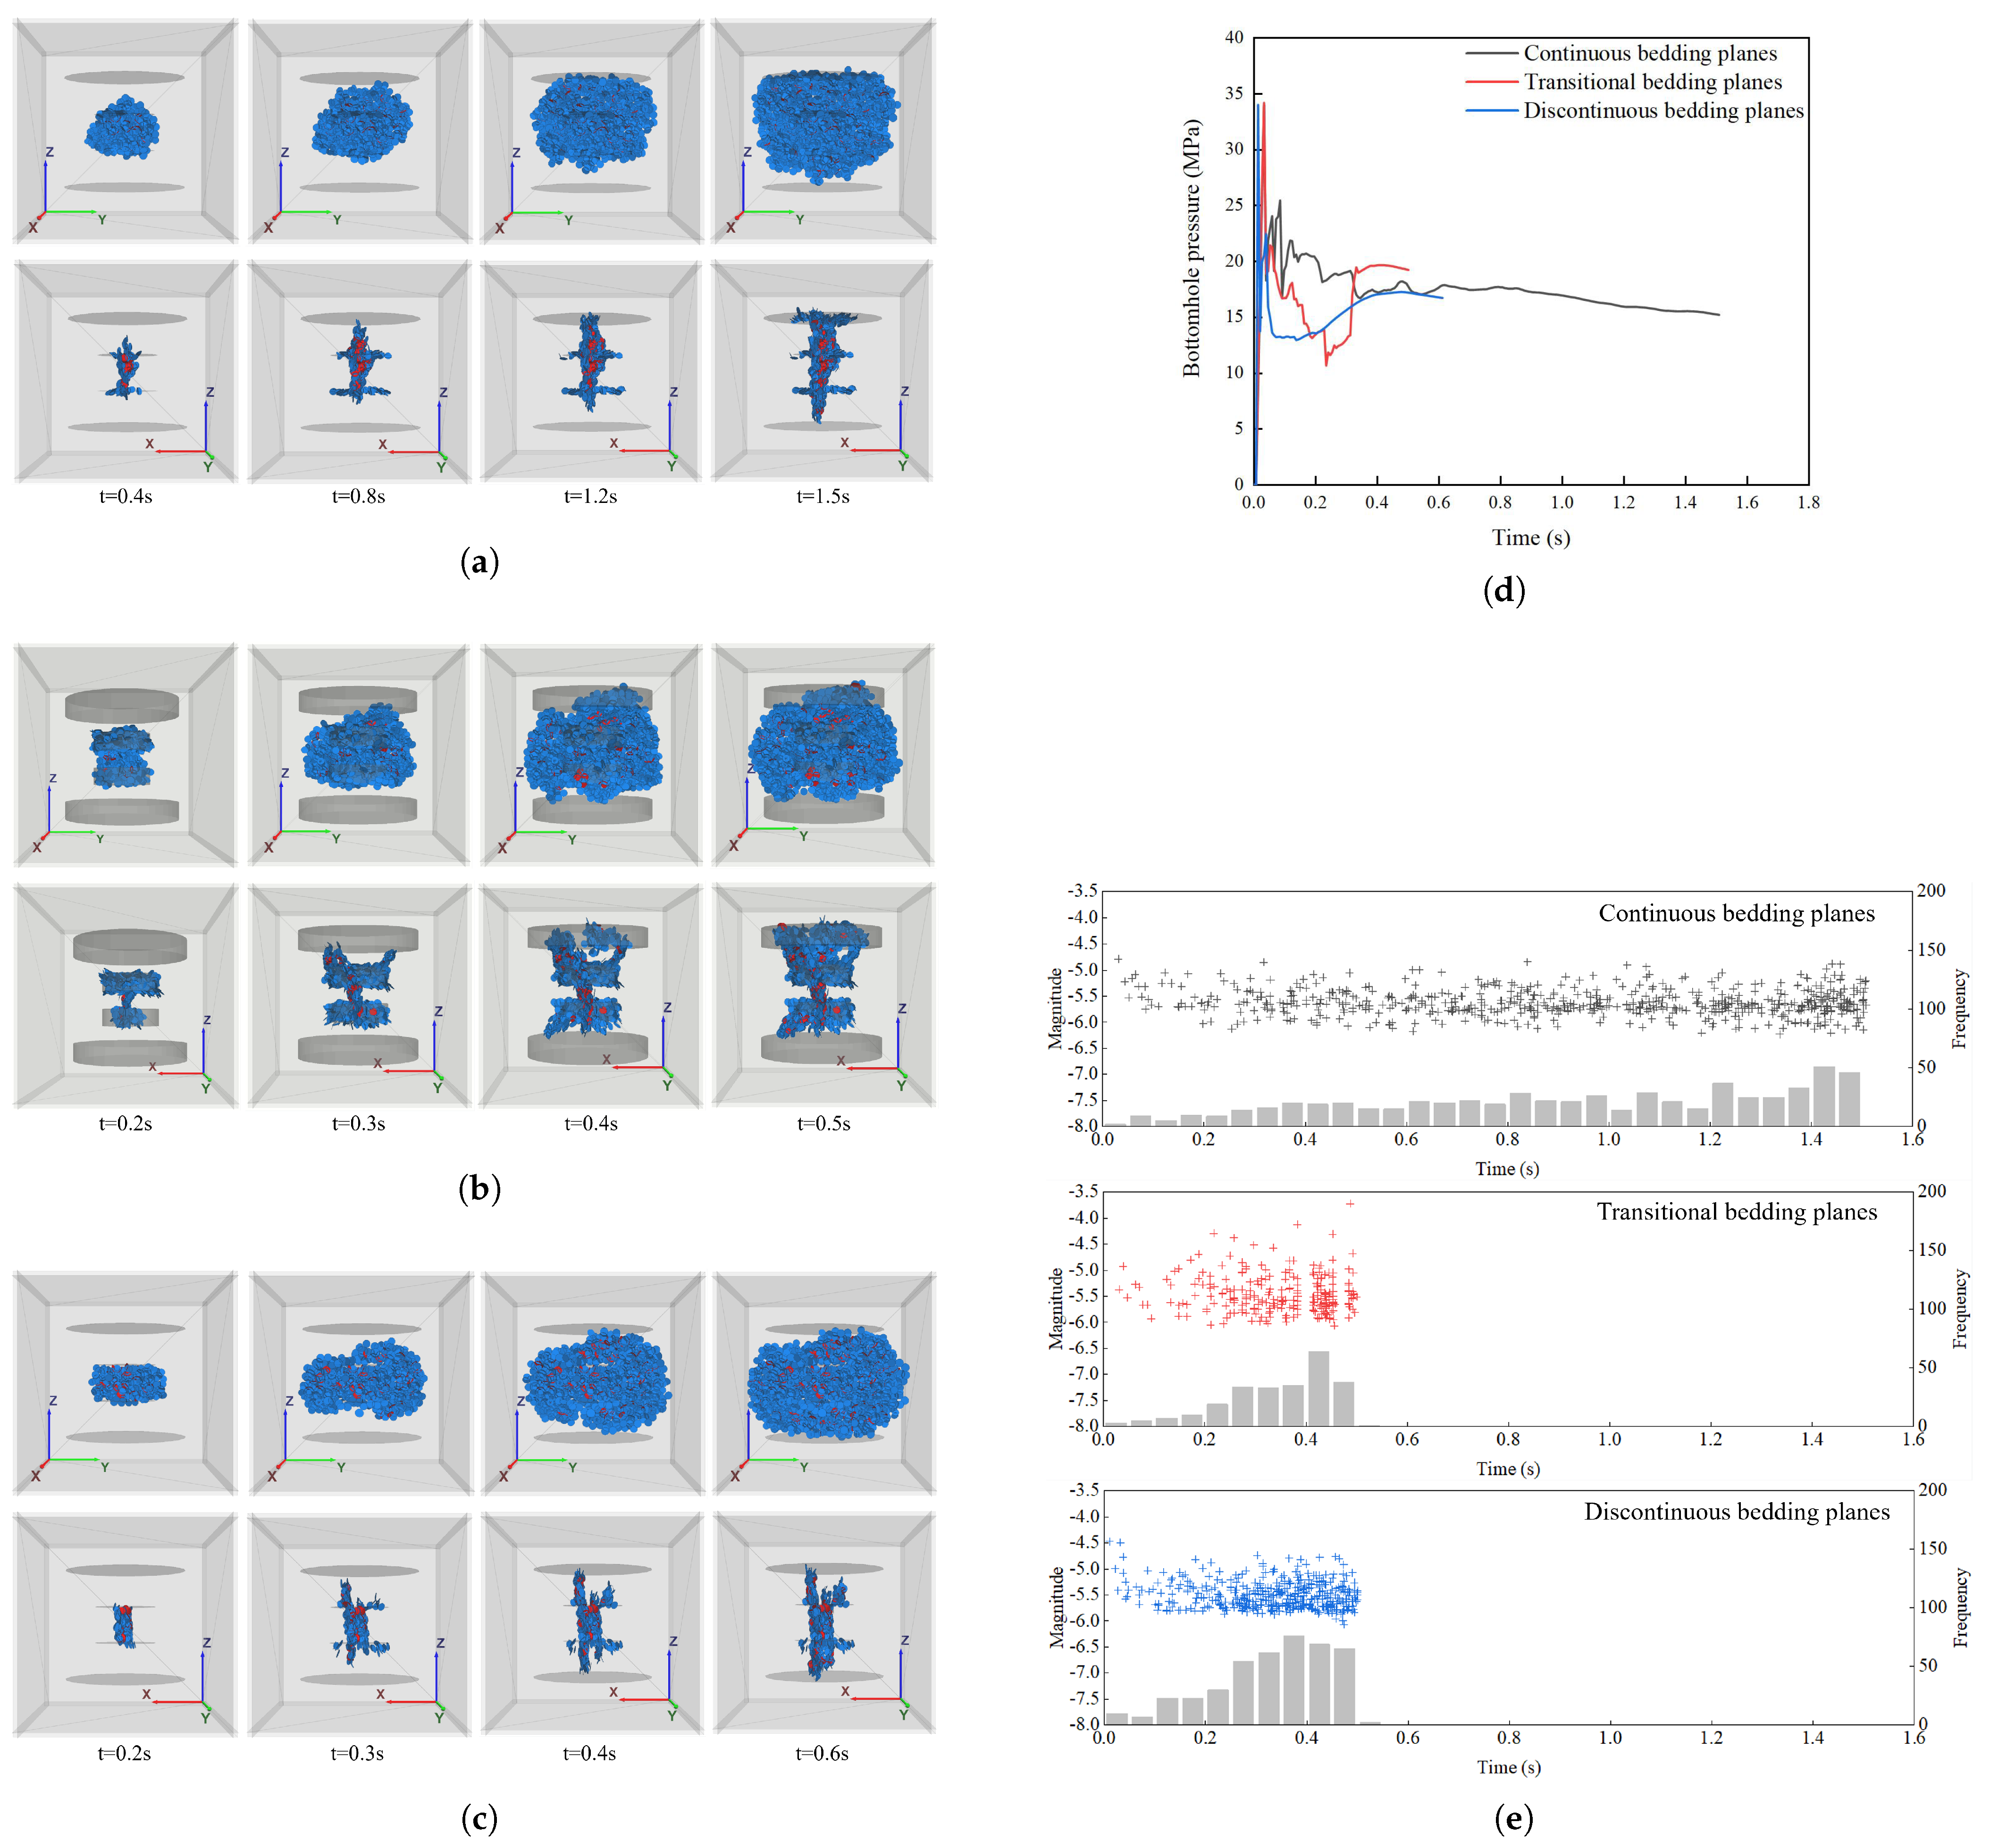
Hydraulic fracturing simulations were executed on the shale models featuring different types of bedding planes, and the parameters from Table 1 to Table 5 were employed unless otherwise specified. The hydraulic fracture and fluid pressure distribution in the shale models containing the transitional and discontinuous bedding planes are depicted in Figure 11a, and Figure 11b, respectively. Combining with the simulation results in the shale model containing the continuous bedding planes presented in Figure 10e,f, it can be found that all the three types of the bedding planes applied restrictions on the fracture propagation. Specifically, the continuous bedding planes induced the fracture to divert and branch into the interfaces of the bedding planes, forming a crisscrossed fracture network. Additionally, the part of the fracture under the lower bedding plane in Figure 10e was not geometrically continuous with the rest, presenting a phenomenon defined as “discontinuous propagation” [22]. Moreover, in the shale model containing the transitional bedding planes, the main body of the hydraulic fracture was captured by the bedding planes, while a tiny branch of the fracture initiated from the upper bedding plane and propagated along the original propagating direction. The fracture branch was not directly connected to the main fracture, and such a propagation pattern is defined as “offset crossing” [8,61]. Furthermore, the hydraulic fracture was thoroughly diverted into the lower bedding plane, presenting a propagation pattern defined as “diversion” [8]. Owing to the fluid transfer within the bedding planes, the entire layers of the bedding planes were fractured, forming damaged bands with specific thicknesses. In the shale model with discontinuous bedding planes, hydraulic fractures were halted by the bedding planes but were not diverted into the interfaces of bedding planes. This propagation pattern aligns with experimental observations [8,24] and is defined as “arrest”.
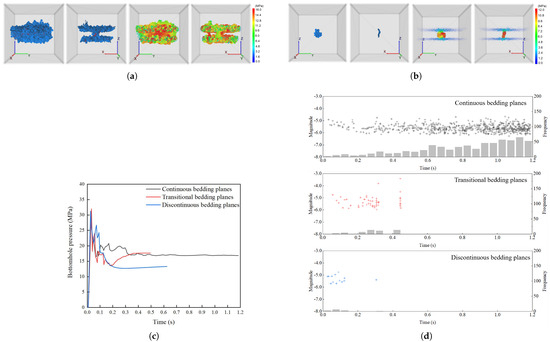
Figure 11.
The hydraulic fracture and fluid pressure distribution in the shale models containing the (a) transitional bedding planes; (b) discontinuous bedding planes; the (c) bottomhole pressure curves; and the (d) magnitude distribution and frequency of seismic events in shale models containing all types of the bedding planes.
The bottomhole pressure curves in each case are depicted in Figure 11c, where the curve ended when the fracture or fluid pressure extended to the model boundary in each case. The breakdown pressures in all the cases were similar, while the extending pressure in the shale model with the discontinuous bedding planes was lower. This is because the hydraulic fracture ceases propagating when encountering the discontinuous bedding planes, while the fracture continues propagating in other cases, requiring a more significant accumulation of bottomhole pressure to sustain the propagation of the fracture front. Moreover, it can be observed that the hydraulic fracture in the shale model with continuous bedding planes took the longest time to reach the model boundary, which is a result of the fracture penetrating the bedding planes. Since the fracture was propagating not only horizontally along the bedding planes but vertically in the rock matrix, the fluid energy was distributed on a larger region, delaying the fracture propagation.
Furthermore, the magnitude distribution and frequency of all the seismic events during fracture propagation in each case are illustrated in Figure 11d. It can be found that the seismic event frequency in the shale model with continuous bedding planes was gradually increasing, since the front region of fracture was increasing. In comparison, the event frequency in the shale model with transitional bedding planes was much lower, indicating a faster fracture propagation. Moreover, the event magnitude was higher due to the fast propagation, with the highest magnitude higher than −4. In addition, in the shale model with discontinuous bedding planes, both the event magnitude and frequency were at low levels, since the fracture propagation was restricted.
4.2. Influences of the Plane Thickness and Permeability
As shown in Figure 10 and Figure 11, the propagation pattern and morphology differ in the shale models containing the continuous and transitional bedding planes. To delve into the contributions of the different influences between the continuous and transitional bedding planes, transitional bedding planes with an intermediate thickness (0.01 m) were introduced, and the resulting hydraulic fracture is depicted in Figure 12. It can be observed that the hydraulic fracture was confined to the transitional bedding planes (0.01 m), and only a small branch of the fracture encroached on the upper bedding plane. Therefore, it can be concluded that the thickness of bedding planes has a notable impact on fracture propagation and morphology, since more fluid will flow into the thicker bedding planes, increasing the probability of fracture diversion. To validate this hypothesis, a permeability test on the shale model containing bedding planes with a thickness of 0.01 m was conducted following the process in Section 3.3. The results indicate that the parallel–perpendicular permeability ratio of the shale sample was 5.8 when the permeability scaling coefficient was 5 and was located between the permeability ratios evaluated on shale models with continuous and transitional bedding planes. Therefore, it can be revealed that the thickness of highly permeable bedding planes can affect fracture propagation dynamics by rendering permeability of the shale sample.
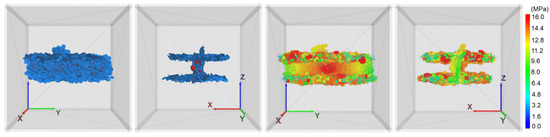
Figure 12.
The hydraulic fracture and fluid pressure distribution developed in shale model containing the transitional bedding planes with a thickness of 0.01 m.
Moreover, the different influences of the continuous and transitional bedding planes were examined under varying permeability. Specifically, the permeability scaling coefficient in Equation (6) was varied to adjust the hydraulic radius of the bedding planes, leading to distinct permeability. The hydraulic fracture and the fluid pressure distribution are illustrated in Figure 13a,c,e when was set to 3, signifying a relatively lower bedding plane permeability. It was observed that the hydraulic fracture penetrated the bedding planes in all scenarios. However, as the bedding plane thickness increased, the restriction of the bedding planes became more pronounced. In the shale model containing the continuous bedding planes (Figure 13a), the hydraulic fracture exhibited a penny-shaped morphology characteristic of fractures developed in homogeneous media. Conversely, in the shale model containing the transitional bedding planes (Figure 13c–e), the propagation of the hydraulic fracture was constrained, and it is evident that the fluid pressure extended over a greater distance in the transitional bedding planes compared to the continuous bedding planes. In addition, the hydraulic fracture was asymmetrically distributed in the case containing the transitional bedding planes, with a thickness of 0.02 m (Figure 13e), as it tended to propagate toward the upper part of the model, while being seriously restricted by the lower bedding plane, reflecting a strong influence of the transitional bedding planes on the fracture propagation. In addition, in the model containing the transitional bedding planes with a thickness of 0.01 m (Figure 13c), the fracture morphology and fluid pressure distribution exhibited an intermediate status between the two cases mentioned above. Concretely, the hydraulic fracture penetrated the bedding planes close to the injection point but was arrested by the bedding planes far from the injection point.
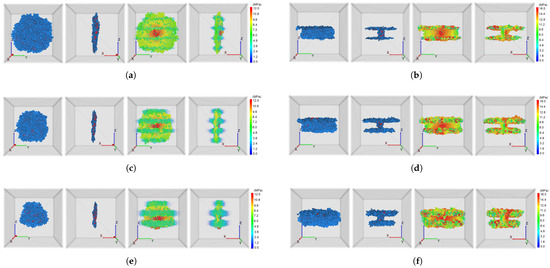
Figure 13.
The hydraulic fracture and fluid pressure distribution in the shale models containing the (a,b) continuous bedding planes; (c,d) transitional bedding planes with a thickness of 0.01 m; (e,f) transitional bedding planes with a thickness of 0.02 m (The permeability scaling coefficient was set to 3 for (a,c,e) and 7 for (b,d,f)).
Furthermore, Figure 13b,d,f illustrates the hydraulic fracture and the fluid pressure distribution when the permeability scaling coefficient was set to 7. In such cases under a relatively higher bedding plane permeability, the hydraulic fracture was consistently diverted by the bedding planes, indicating that the influence of the bedding plane thickness was overridden by the permeability. As the propagation pattern of the fracture when encountering the bedding planes is determined by the energy at the fracture front, excessive energy loss happens when too much fluid flows into the bedding planes, resulting in fracture diversion. When the permeability is relatively high, even thin bedding planes can induce huge energy loss at the fracture front and cause fracture diversion. In summary, it can be concluded that the influence of the bedding plane thickness is more pronounced under a relatively lower permeability but is limited under a relatively higher permeability.
4.3. Influences of the Orientation Angle
Due to tectonic movements, bedding planes are generally distributed at specific angles in the formation. Previous studies have discussed the influences of the orientation angle of bedding planes on fracture propagation [32,62]. In this section, the bedding planes of different types were arranged at various orientation angles (, , or ) symmetrically to the injection point. Subsequently, the fracture simulations were conducted, with the results presented in Figure 14. It can be found that the hydraulic fracture penetrated the continuous bedding planes with an orientation angle of , while the “offset crossing” phenomenon occurred at an orientation angle of , where the hydraulic fracture reinitiated at a distance from the intersection point with the lower bedding plane instead of directly penetrating the bedding plane. A complete diversion of the hydraulic fracture by the bedding planes was observed at an orientation angle of . Consequently, a distinct transformation in the propagation pattern concerning the orientation angle of the continuous bedding planes was demonstrated. Additionally, in the models containing the transitional bedding planes, the hydraulic fracture was consistently diverted by the bedding planes at orientation angles of , , or . Furthermore, the hydraulic fracture was arrested by the discontinuous bedding planes under all three orientation angles, as shown in Figure 14c.

Figure 14.
The hydraulic fracture and fluid pressure distribution in the shale models containing (a) continuous bedding planes; (b) transitional bedding planes; (c) discontinuous bedding planes in different orientation angles (From left to right: , , ).
4.4. Influences of the Fluid Properties
The experimental results have highlighted the influences of the fluid properties on the fracture propagation and morphology in shale. Specifically, comparatively high values of the injection rate and viscosity of the fracturing fluid generally result in a single fracture rather than a complex fracture network [18,23,24]. Nevertheless, the impacts of the fluid properties on various types of the bedding planes have not been thoroughly explored. To this end, a higher injection rate () and a greater fluid viscosity () were applied in the fracturing simulations and compared with the benchmark cases (Figure 10e,f) with an injection rate of and a fluid viscosity of , respectively. The resulting fracture morphology and fluid pressure distribution under the comparatively higher injection rate are depicted in Figure 15a,c,e. Specifically, in the shale model with the continuous bedding planes, the higher injection rate led to the formation of a simple fracture. The hydraulic fracture penetrated the bedding planes, forming a penny-shaped fracture, while only a small part of the bedding planes was activated (Figure 15a). In addition, the higher injection rate also facilitated the hydraulic fracture to penetrate the transitional bedding planes, activating additional bedding planes in the shale model and generating a complex fracture network (Figure 15c). On the other hand, in the shale model with discontinuous bedding planes, the higher injection rate had little impact on the fracture morphology (Figure 15e), as the hydraulic fracture was consistently arrested by the bedding planes.
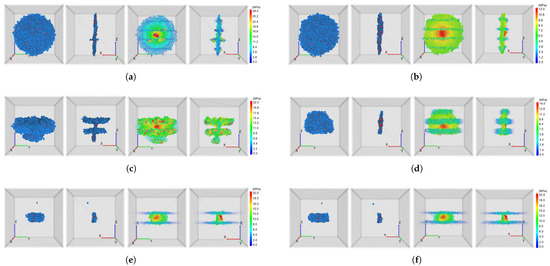
Figure 15.
The hydraulic fracture and fluid pressure distribution in the shale models containing the (a,b) continuous bedding planes; (c,d) transitional bedding planes; (e,f) discontinuous bedding planes (The injection rate was set to for (a,c,e), and the fluid viscosity was set to for (b,d,f)).
For the cases under the comparatively greater fluid viscosity, the fracture morphology and fluid pressure distribution in each case are presented in Figure 15b,d,f. It is observed that the greater fluid viscosity was favorable for the fracture to propagate along the vertical direction and form a simple hydraulic fracture, as the hydraulic fracture penetrated the continuous bedding planes (Figure 15b) and the upper transitional bedding plane (Figure 15d). However, the transitional bedding planes still exhibited stronger restrictions on the fracture propagation than the continuous bedding planes, as the hydraulic fracture was arrested by the lower transitional bedding plane (Figure 15d). Moreover, the fracture failed to penetrate the discontinuous bedding planes under the greater fluid viscosity (Figure 15f). In particular, the random distribution of the particles led to local heterogeneity, sometimes having contacts with low bonding strength exist near the bedding planes. Such heterogeneity can cause the fracture to propagate further at the low-strength places which would thenextend at other places on the bedding planes, resulting in an unsymmetrical morphology of the fracture presented in Figure 15c,d. In conclusion, comparatively high values of the injection rate and viscosity of the fracturing fluid can facilitate fracture to penetrate the continuous and transitional bedding planes, albeit with distinct outcomes. Specifically, the greater fluid viscosity resulted in a single fracture in all cases, whereas the higher injection rate contributed to the formation of a complex fracture network in the shale models containing the transitional bedding planes. Regarding the discontinuous bedding planes, both settings exhibited a limited impact on the fracture propagation.
4.5. Injection Scheme Optimization
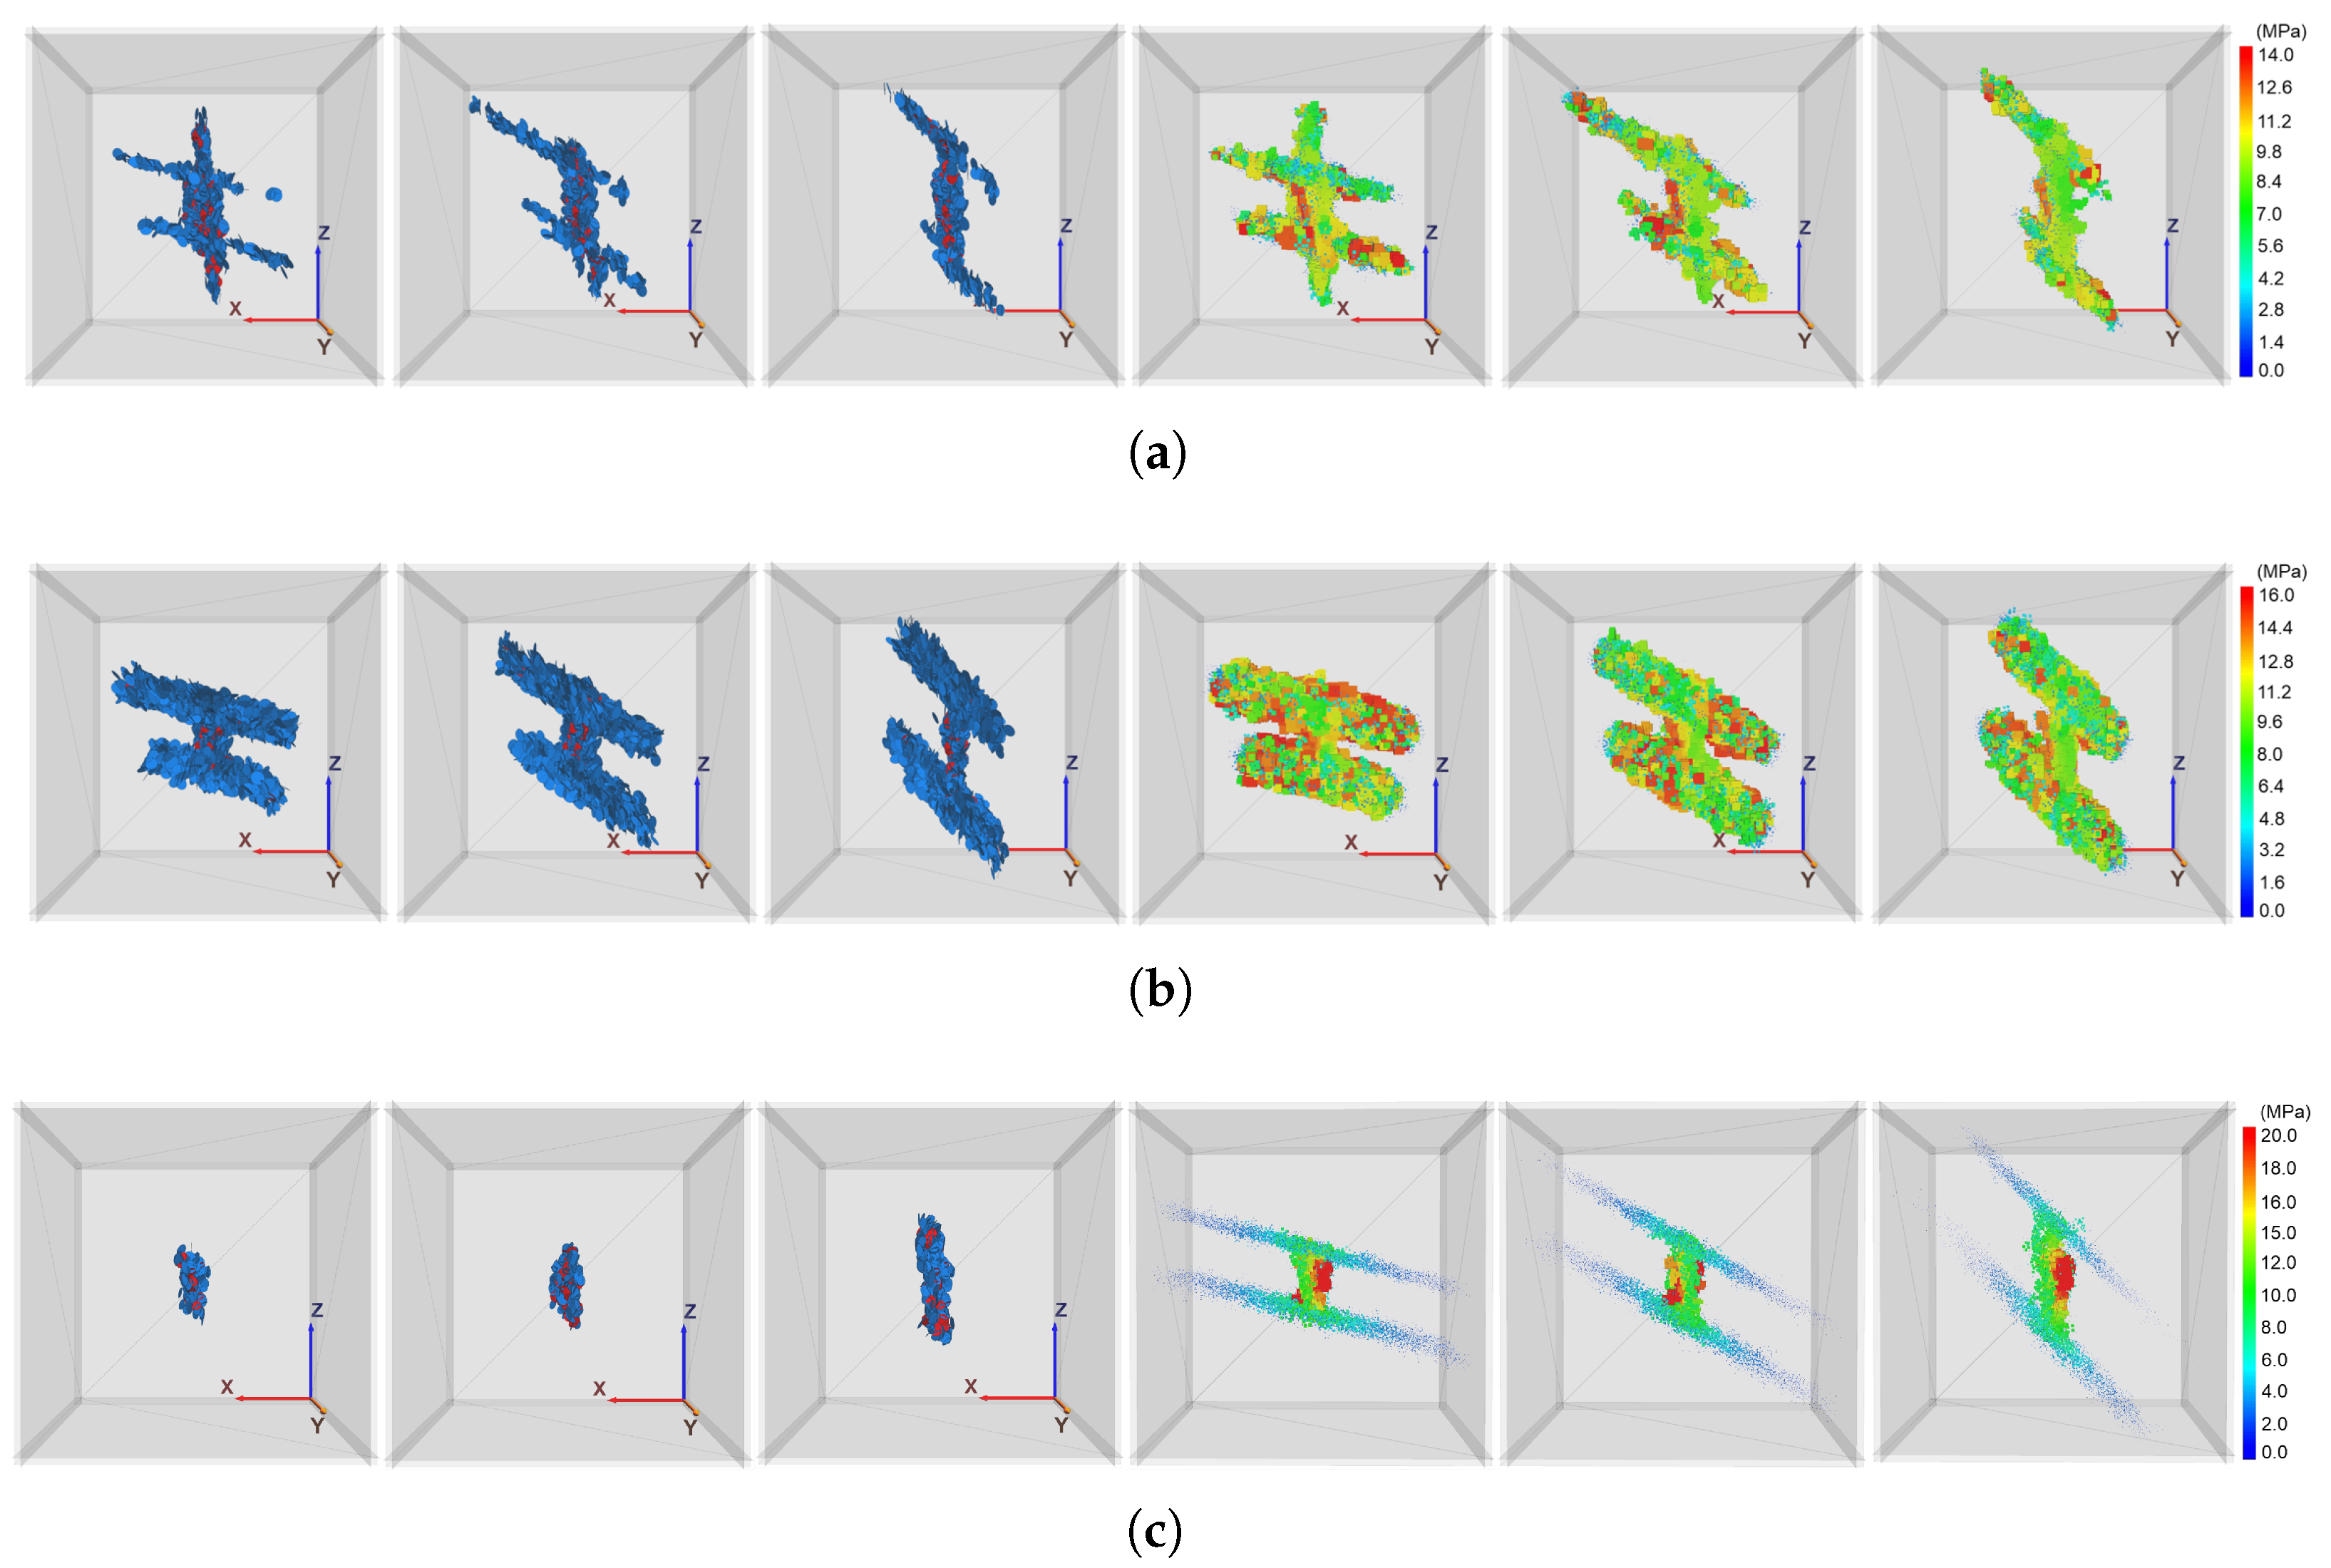
Based on the influences of the fluid properties on the fracture propagation, the effects of the injection schemes were investigated. Instead of adopting monotonic injection schemes that apply consistent injection rates or fluid viscosity, complex injection schemes apply varying injection rates or fluid viscosities during the fracturing process. In particular, the continuous and transitional bedding planes are examined, since the discontinuous bedding planes are not sensitive to fluid property variations. Each scenario applies two distinct values for the injection rate ( and ) or fluid viscosity (3.0 and 15.0 ) sequentially. Figure 16a,b presents the fracture morphology in samples with continuous bedding planes under different injection schemes. In the first stage in Figure 16a, a low injection rate confined the fracture within the bedding planes, whereas a high injection rate caused the fracture to penetrate them. When the injection rate increased from low to high, the fracture penetrated the bedding planes far from the injection point, forming a penny-shaped fracture. At the same time, the fracture kept propagating within the bedding planes activated in the first stage. Conversely, when the injection rate decreased from high to low, the fracture propagation was constrained by the far-end bedding planes. Note that the high injection rate had a shorter duration than the low rate to maintain a consistent injection volume in each stage. Similar behavior was observed under varying fluid viscosity, as shown in Figure 16b. The fracture penetrated the far-end bedding planes when the fluid viscosity increased from low to high. On the other hand, when the fluid viscosity decreased from high to low, the fracture was constrained by the far-end bedding planes, although it penetrated bedding planes near the injection point in the first stage.
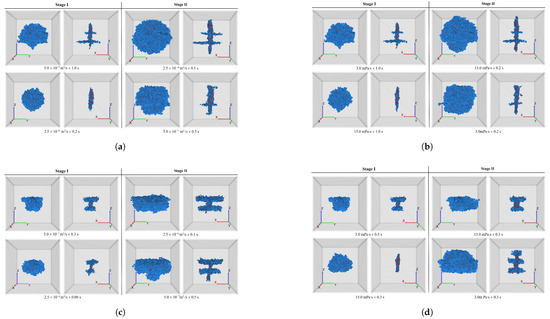
Figure 16.
The hydraulic fracture developed under varying the (a) injection rate; (b) viscosity in the shale models containing the continuous bedding planes and developed under varying the (c) injection rate; (d) viscosity in the shale models containing the transitional bedding planes.
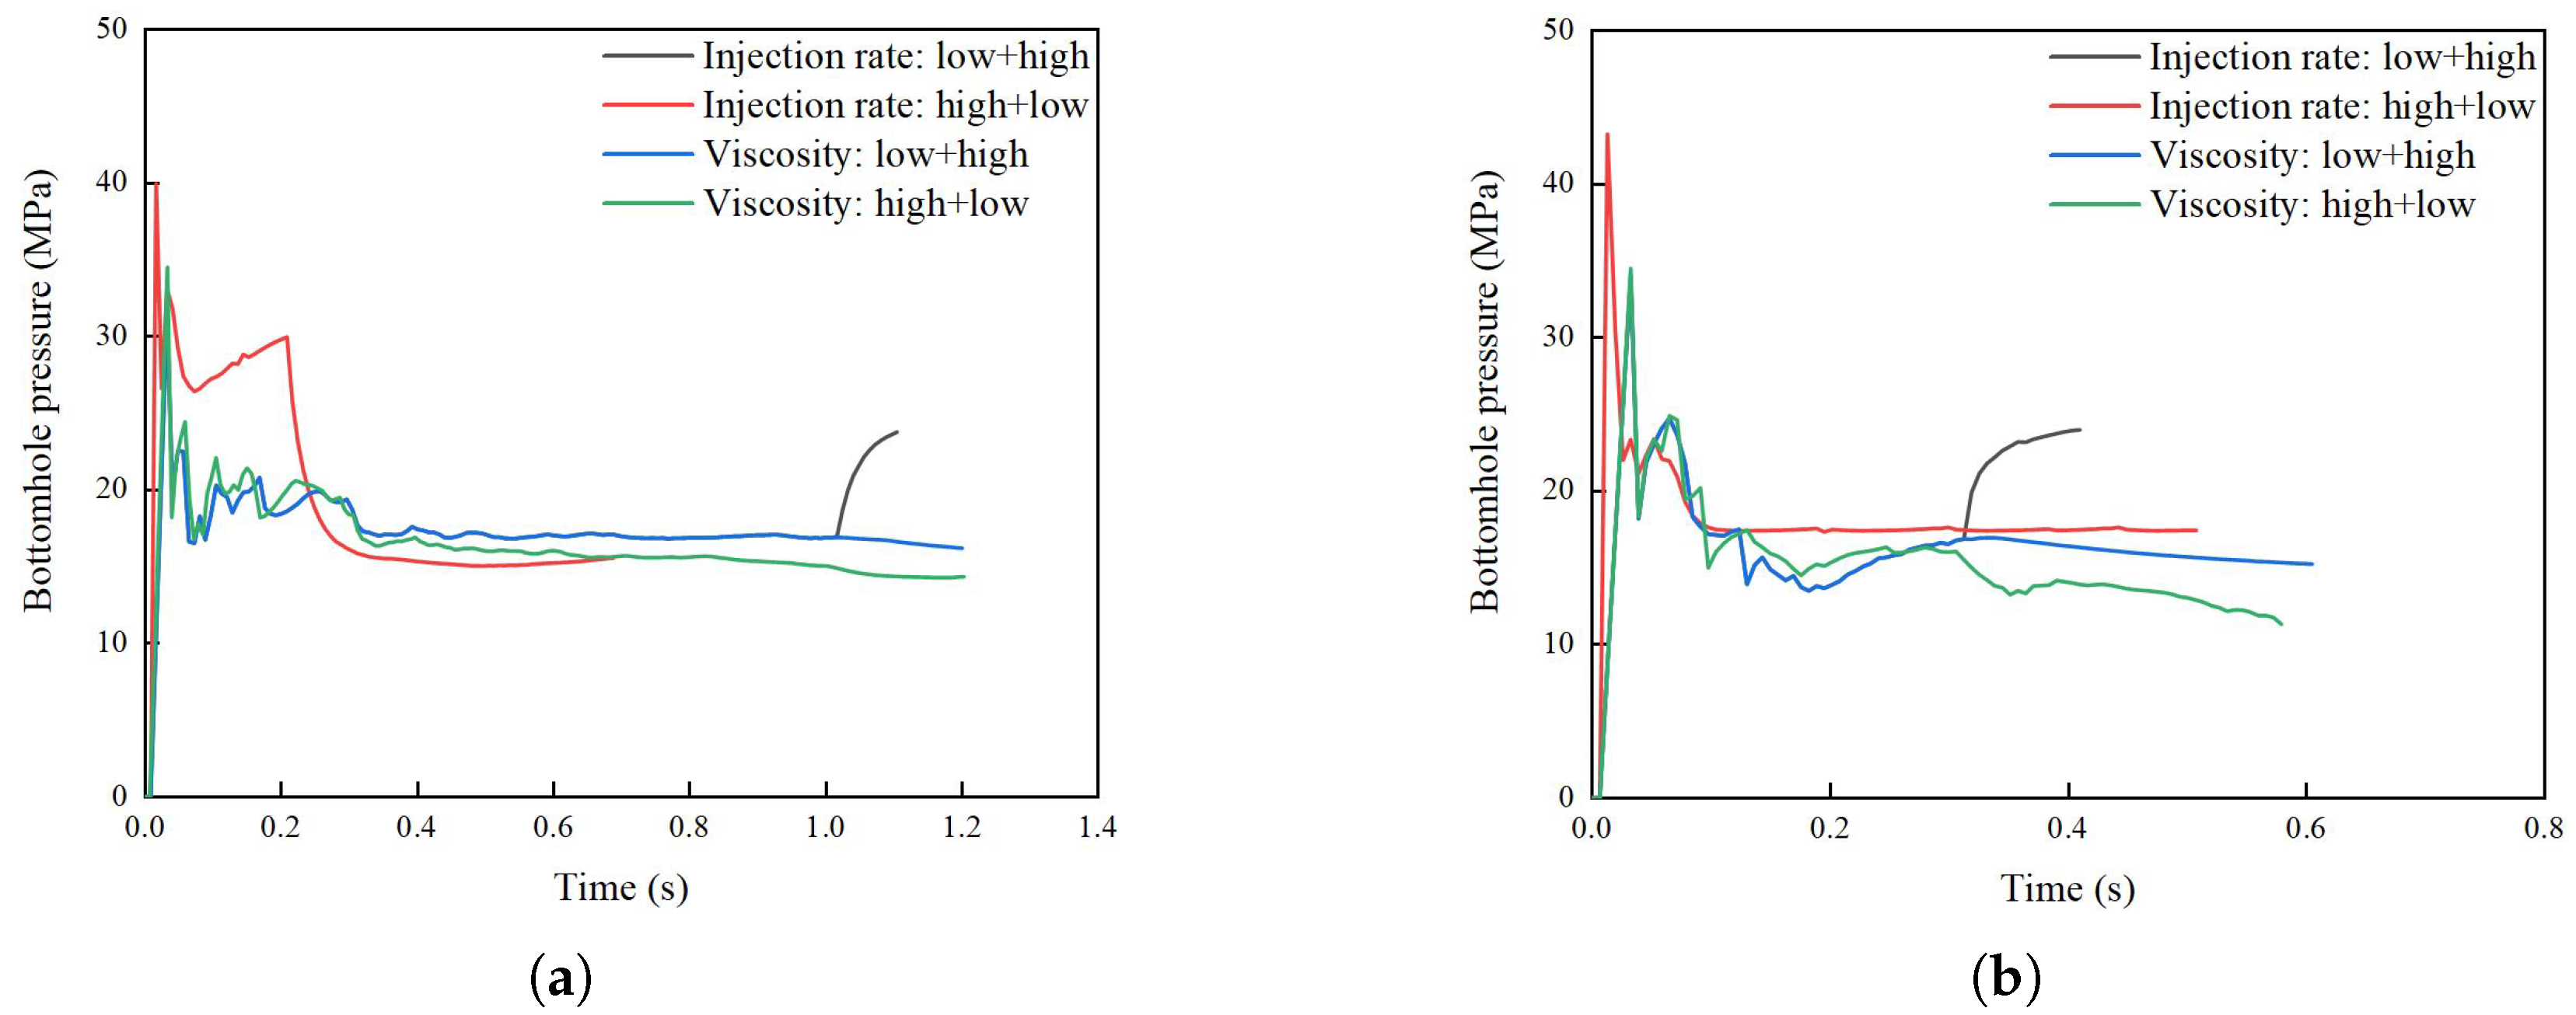
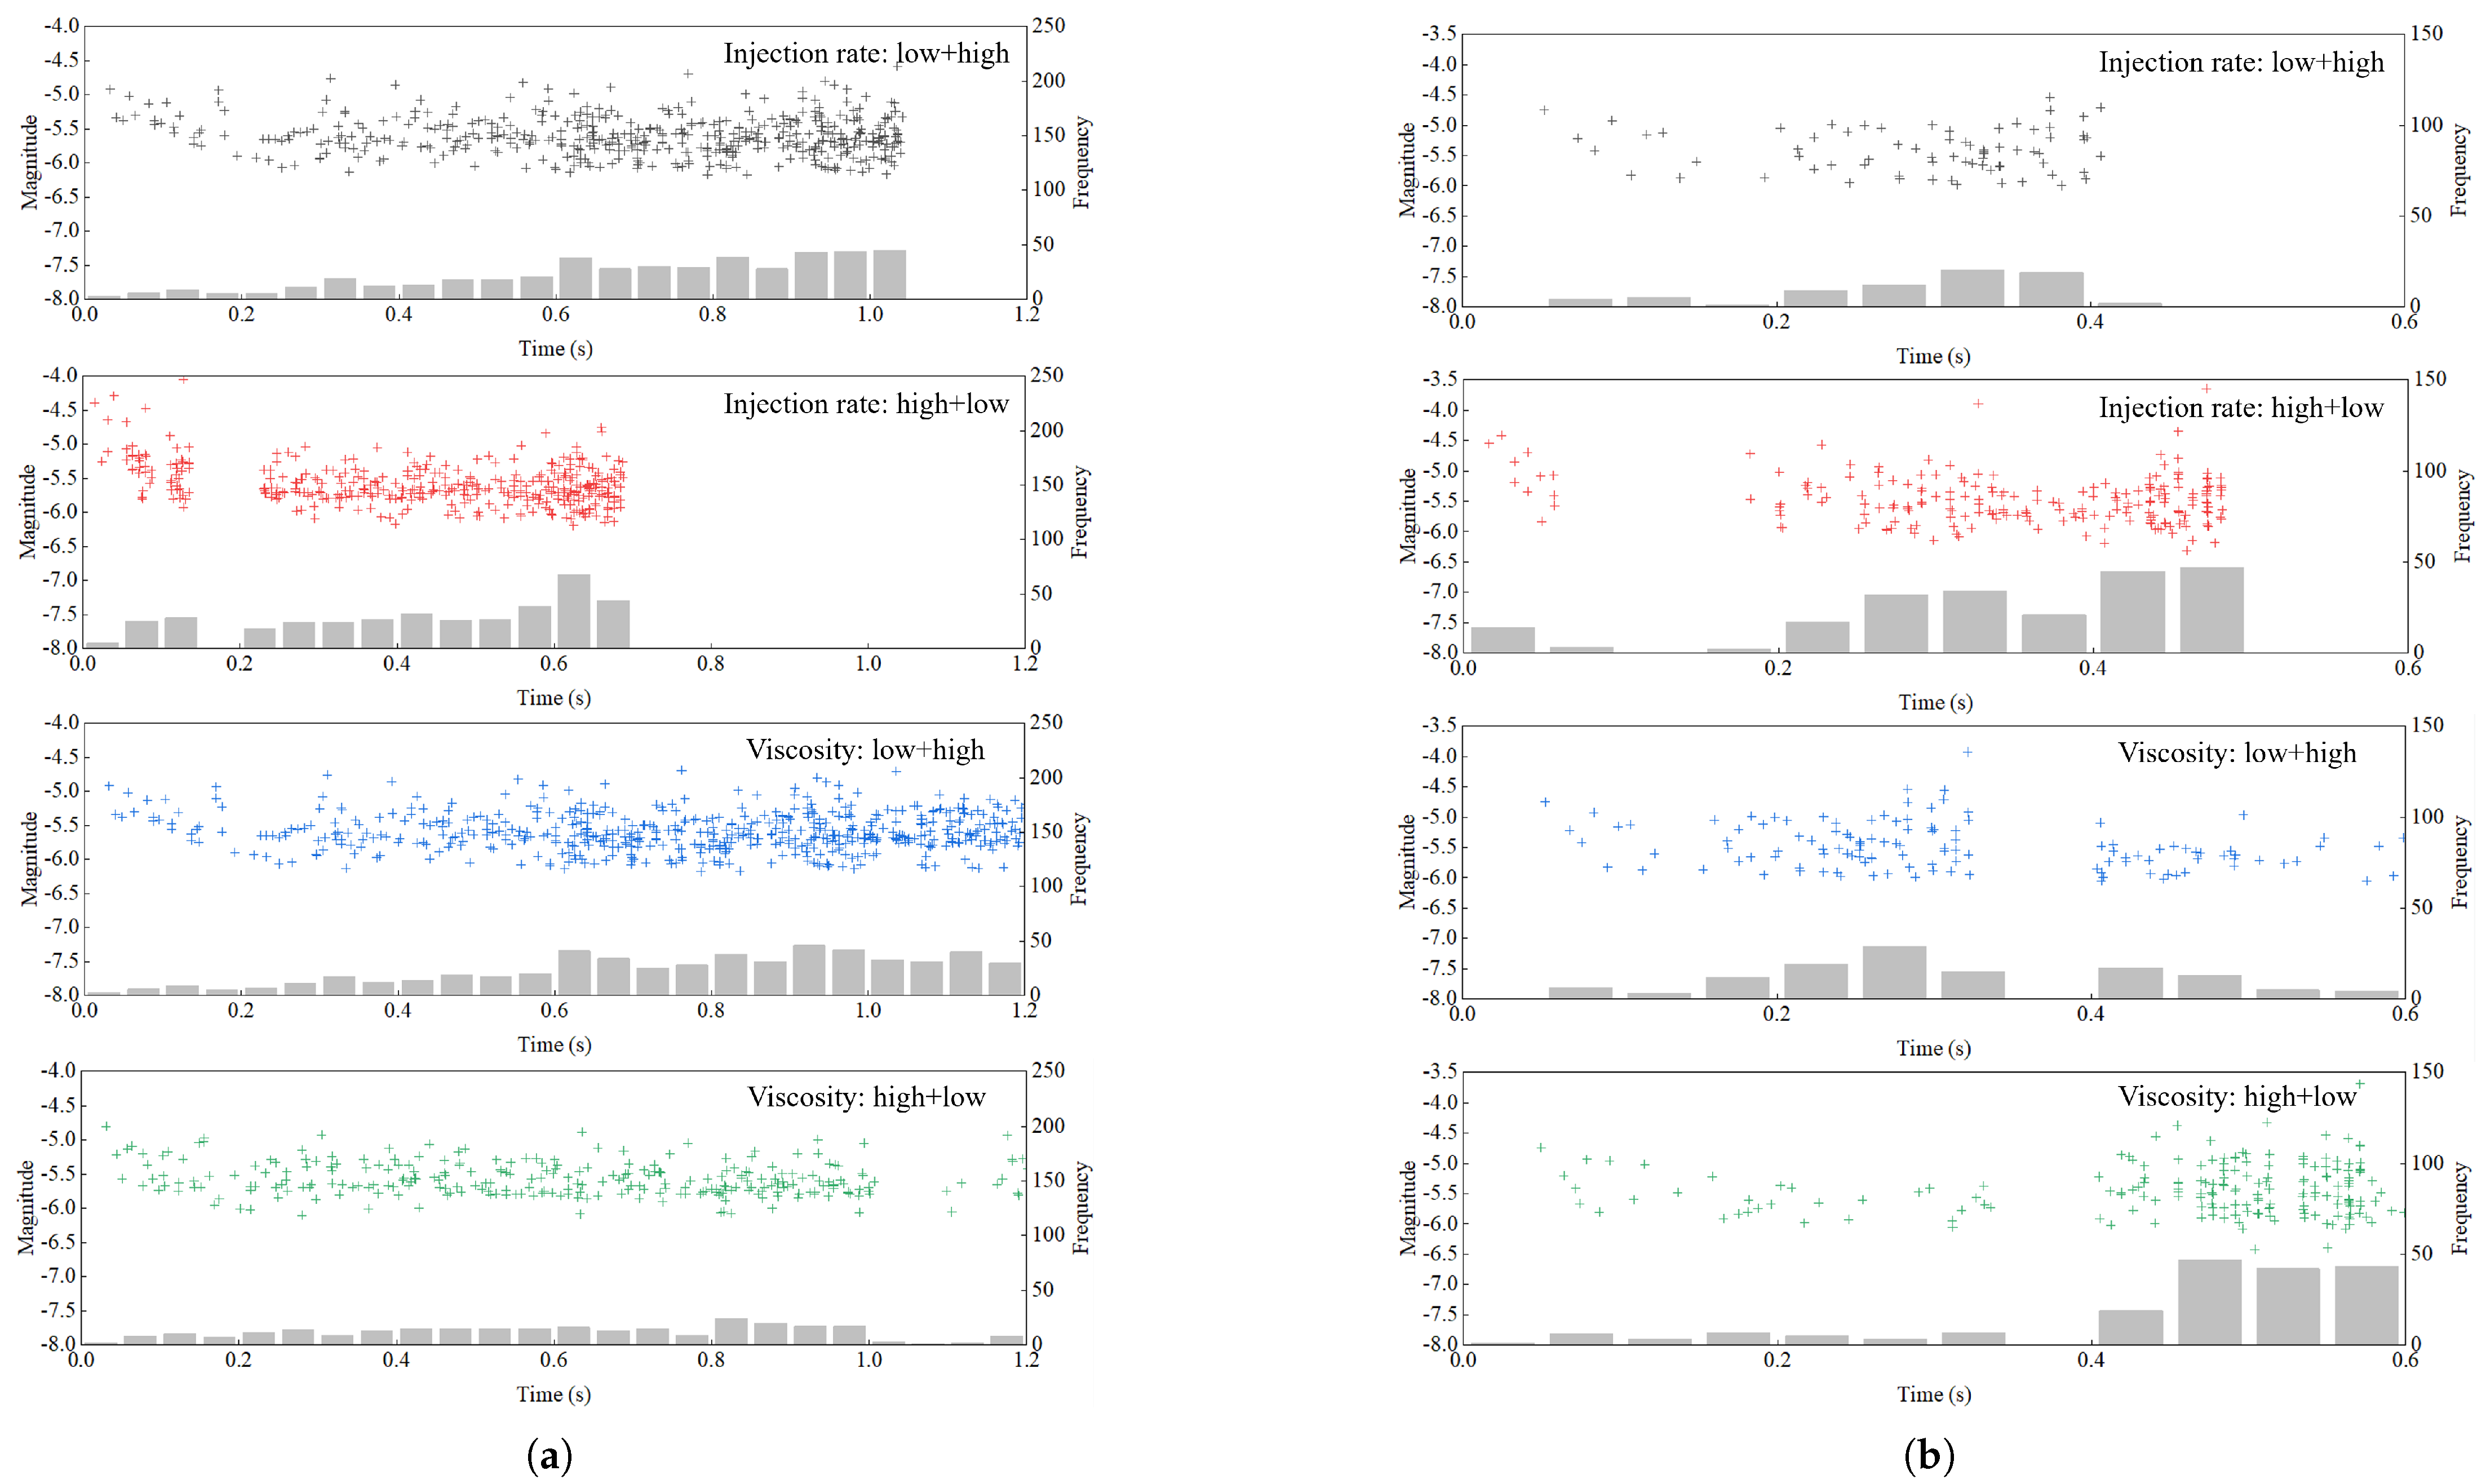
The variation in the bottomhole pressure in each case is presented in Figure 17a. When the high injection rate was applied in the first stage, the breakdown pressure reflected in the curve was higher than that in other cases, since a high injection rate would substantially promote pressure accumulation before breakage. Similarly, when the injection rate increased from low to high, a significant rise could be observed. The distribution of the corresponding seismic events is illustrated in Figure 18a. The event magnitude under a high injection rate was higher than that under a low injection rate. Furthermore, a high fluid viscosity had a minor effect on the breakdown pressure, but it could increase the extending pressure during fracture propagation. Additionally, in both cases when the injection rate/viscosity decreased from high to low, an interval without a seismic event could be observed, indicating that there was no appearance of new cracks. It is hypothesized that such an interval is induced by the imbalance between fluid injection and loss. Specifically, the injected fluid in a lower rate/viscosity failed to compensate for the fluid loss at the first moment; thus, an interval was required to rebalance the fluid injection and fluid loss.
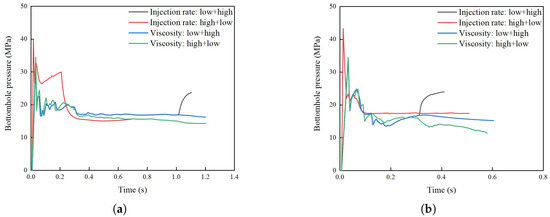
Figure 17.
Bottomhole pressure curves in the shale models with (a) continuous bedding planes; (b) transitional bedding planes under complex injection schemes.
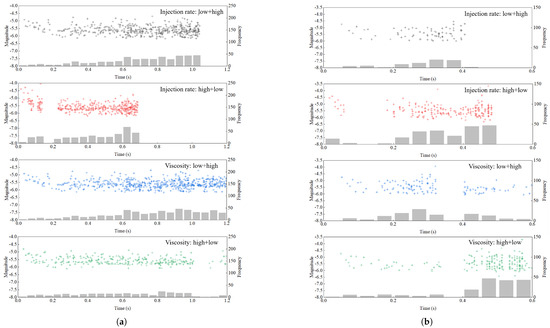
Figure 18.
Magnitude distribution and frequency of seismic events in the shale models with (a) continuous bedding planes; (b) transitional bedding planes under complex injection schemes.
Additionally, the effects of the injection scheme on the transitional bedding planes are presented in Figure 16c,d. When a low injection rate was applied in the first stage, the fracture was captured by the bedding planes and did not penetrate them under a higher injection rate in the second stage. In contrast, when a high injection rate was applied in the first stage, the fracture was captured by the bedding planes but locally penetrated the lower bedding planes. This led to fracture propagation beyond the lower bedding plane in the second stage under a low injection rate, resulting in more complex fracture networks, as illustrated in Figure 16c. Moreover, when the fluid viscosity increased from low to high in the second stage, the fracture propagated in the rock matrix between the two bedding planes without further activating them. This was favorable for extending the hydraulic fracture within a single layer. Conversely, a high fluid viscosity in the first stage promoted the fracture to penetrate the bedding planes. When the viscosity decreased to a low value, the fracture tended to activate and be constrained by the bedding planes, as shown in Figure 16d.
The bottomhole pressure curves in each case are shown in Figure 17b, and the corresponding distribution of the seismic events is depicted in Figure 18b. Similar to the observation in Figure 17a and Figure 18a, a high injection rate induced a higher breakdown pressure on the curve, and a high fluid viscosity could maintain a higher extending pressure than a low fluid viscosity. Moreover, it was found that the fracture propagation under a high fluid viscosity was faster than that under a low fluid viscosity. In particular, the interval without crack appearance happened in each case when the fluid injection rate/viscosity varied. This is because the transitional bedding planes can induce a more significant energy loss on the fracture front compared to the continuous bedding planes.
In summary, complex injection schemes offer better control over fracture morphology compared to monotonic injection schemes. For continuous bedding planes, applying a “low-high” injection scheme for injection rate or fluid viscosity forms complex fracture networks in the near-wellbore region and a simple fracture in the far-end region, which optimizes the SRV. For transitional bedding planes, adopting a “high-low” injection scheme for the injection rate or fluid viscosity favors the generation of complex fracture networks. Additionally, a “low-high” injection scheme for fluid viscosity promotes fracture propagation within a single layer between two bedding planes, which is suitable when the target region is a single layer.
4.6. Impacts of Small-Scale Bedding Planes
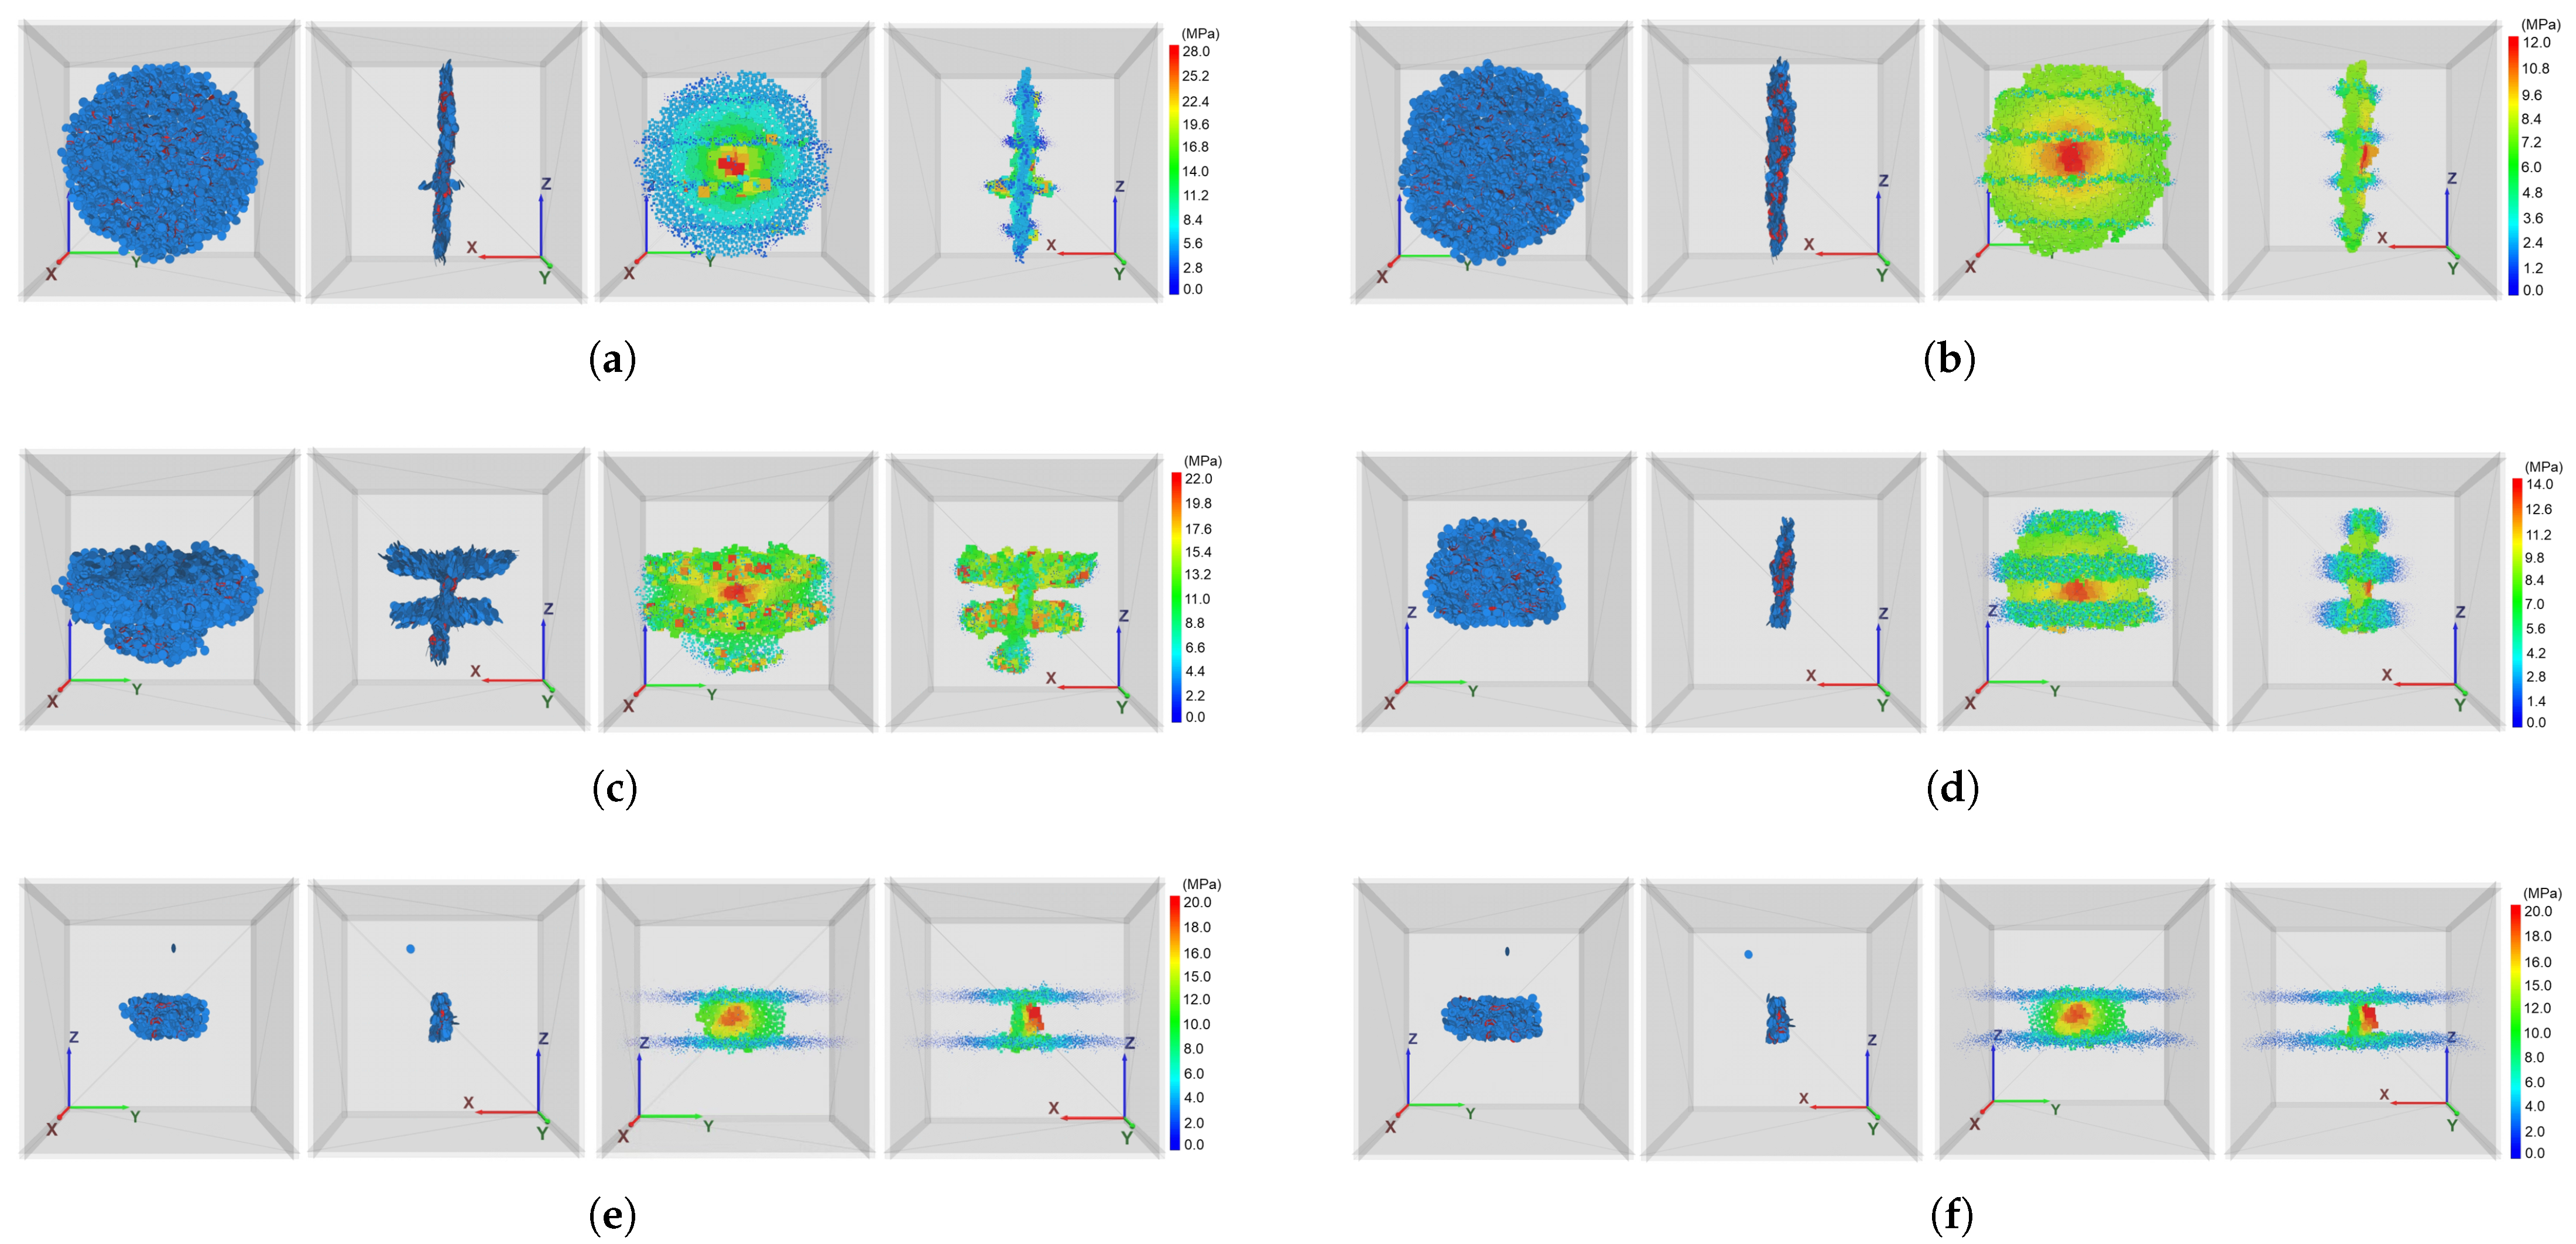
In the previous sections, all bedding planes were modeled as large-scale planes covering the entire cross-section of the shale model. This setting cannot reveal the fracture behavior at the edges of the bedding planes. Campbell [63] reported that small-scale discrete bedding planes are commonly developed in shale formations. To this end, the fracture behavior with bedding planes on a small scale was investigated. In each case, the diameters of the near-end bedding planes were 100 mm, and those of the far-end bedding planes were 200 mm.
The fracture propagation in shale models with small-scale bedding planes is shown in Figure 19a–c. As shown in Figure 19a, the hydraulic fracture activated and penetrated the continuous bedding planes at the near end. In the Y–Z plane, the fracture propagated beyond the bedding planes and reached the rock matrix. At the far end, the fracture also activates the bedding planes. Note that the lower far-end bedding plane was not activated by the fracture at s, as the fracture front had not reached it. In the model with transitional bedding planes, the fracture was initially captured and propagated within the bedding planes but failed to extend to the rock matrix or penetrate the bedding planes at the intersection point. Instead, the hydraulic fracture reinitialized at the edge of the near-end bedding planes, as shown in Figure 19b. The secondary fracture continued to propagate along the direction of the primary fracture, and it was captured by the far-end bedding planes. A similar phenomenon was observed in samples with discontinuous bedding planes, except the hydraulic fractures did not propagate along the bedding planes, since they were already activated. With the fluid pressure accumulating at the edge of the bedding planes, fracture reinitialization was observed in Figure 19c.
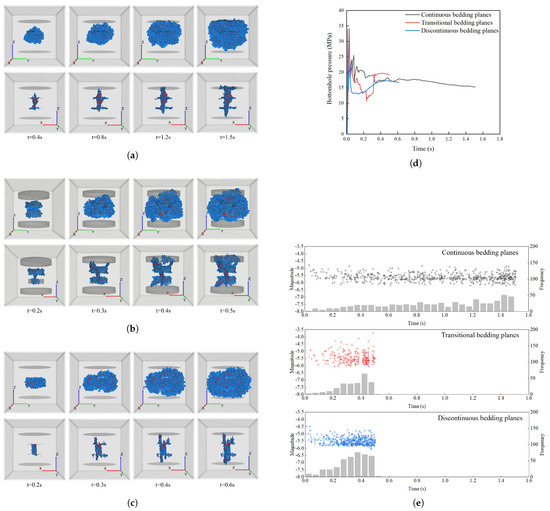
Figure 19.
Fracture propagation in shale models containing the small-scale (a) continuous bedding planes; (b) transitional bedding planes; (c) discontinuous bedding planes; (d) bottomhole pressure curves; (e) magnitude distribution and frequency of seismic events in each scenario.
The variation in bottomhole pressure and the distribution of the seismic events in each case are presented in Figure 19d and Figure 19e, respectively. The pressure variation curve in the shale model with continuous bedding planes tended to be steady following an interval of fluctuation after breakdown, indicating stable and consistent fracture propagation, which can be supported by the fracture morphology in Figure 19a, as well as the seismic event distribution in Figure 19e. For shale models with transitional and discontinuous bedding planes, it can be found that their pressure variation curves both presented a sharp drop followed by a rise. It is observed that the period of dropping happened when the hydraulic fracture was captured by the bedding planes at the near end. Furthermore, the following pressure rise can be interpreted as a reflection of fracture reinitialization at the edge of the near-end bedding planes, which results in a pressure calculation at the fracture front. In addition, the maximum magnitude of seismic events was found in the shale model with transitional bedding planes.
5. Conclusions
This study investigated the impact of different types of bedding planes, i.e., continuous, transitional, and discontinuous bedding planes, in laminated shale formations using a hydromechanically coupled 3D DEM model. The simulation results revealed that all three types of bedding planes exerted restrictions on the fracture propagation. The continuous bedding planes presented the weakest influence, as fractures penetrated through them. On the other hand, the transitional planes diverted fractures, occasionally causing “offset crossing,” while discontinuous planes imposed the strongest restriction by consistently arresting fractures and halting their propagation. The variation in the bottomhole pressure and distribution of seismic events were also presented to offer a comprehensive view of fracture propagation.
Furthermore, the influences of multiple influential factors were revealed. The bedding plane thickness affected propagation at low permeability but had little impact at high permeability. Moreover, the fractures more easily penetrated continuous planes at high orientation angles but were diverted at low angles. The transitional and discontinuous bedding planes consistently captured the hydraulic fracture. Higher injection rates and fluid viscosities promoted fracture penetration in continuous and transitional planes but had limited influence on discontinuous planes. Complex injection schemes with varying rates or viscosities offered better fracture control than monotonic schemes. Additionally, small-scale bedding planes could trigger fracture reinitiation at their edges.
The results promote a comprehensive understanding of the fracture formation in the shale reservoirs and assist in the optimization of the fracturing plan. Last but not least, several improvements can be investigated in future work to mitigate some limitations presented by this study. For example, the DEM-based model still struggled to fully represent the real heterogeneities in shale, such as tiny geological variations and natural fractures, which could have a potential influence on fracture propagation. Moreover, the three types of bedding planes might not cover all the natural bedding planes, and a more refined taxonomy can further complement the conclusions of this study. Also, further studies are encouraged to investigate the impact of bottomhole pressure variation and seismic events on fracture behavior and reservoir performance, as well as the long-term effect caused by reservoir depletion and fracture closure.
Author Contributions
Conceptualization, C.S., J.S. and S.W.; methodology, C.S. and J.S.; software, C.S., J.S. and J.S.Y.; validation, C.S. and J.S.; formal analysis, C.S. and J.S.; investigation, C.S. and J.S.; resources, B.L.; writing—original draft preparation, C.S.; writing—review and editing, J.S. and S.W.; supervision, B.L.; project administration, Y.J.; funding acquisition, B.L. All authors have read and agreed to the published version of the manuscript.
Funding
This research was funded by the National Natural Science Foundation of China, grant number 42277122.
Data Availability Statement
The raw data supporting the conclusions of this article will be made available by the authors upon request.
Conflicts of Interest
Author Jeoung Seok Yoon was employed by the DynaFrax UG. The remaining authors declare that the research was conducted in the absence of any commercial or financial relationships that could be construed as a potential conflict of interest.
References
- Jia, C. Breakthrough and significance of unconventional oil and gas to classical petroleum geology theory. Pet. Explor. Dev. 2017, 44, 1–10. [Google Scholar] [CrossRef]
- Zou, C.; Zhang, G.; Yang, Z.; Tao, S.; Hou, L.; Zhu, R.; Yuan, X.; Ran, Q.; Li, D.; Wang, Z. Geological concepts, characteristics, resource potential and key techniques of unconventional hydrocarbon: On unconventional petroleum geology. Pet. Explor. Dev. 2013, 40, 385–399. [Google Scholar] [CrossRef]
- Li, G.; Luo, K.; Shi, D. Key technologies, engineering management and important suggestions of shale oil/gas development: Case study of a Duvernay shale project in western Canada sedimentary basin. Pet. Explor. Dev. 2020, 47, 791–802. [Google Scholar] [CrossRef]
- Cheng, W.; Jin, Y.; Chen, M. Reactivation mechanism of natural fractures by hydraulic fracturing in naturally fractured shale reservoirs. J. Nat. Gas Sci. Eng. 2015, 23, 431–439. [Google Scholar] [CrossRef]
- Cooke, M.L.; Underwood, C.A. Fracture termination and step-over at bedding interfaces due to frictional slip and interface opening. J. Struct. Geol. 2001, 23, 223–238. [Google Scholar] [CrossRef]
- Delale, F.; Erdogan, F. On the mechanical modeling of the interfacial region in bonded half-planes. J. Appl. Mech. 1988, 55, 317–324. [Google Scholar] [CrossRef]
- Teufel, L.W. An Experimental Study of Hydraulic Fracture Propagation in Layered Rock; Texas A&M University: College Station, TX, USA, 1979. [Google Scholar]
- Thiercelin, M.; Roegiers, J.; Boone, T.; Ingraffea, A. An investigation of the material parameters that govern the behavior of fractures approaching rock interfaces. In Proceedings of the 6th ISRM Congress, OnePetro, Montreal, QC, Canada, 30 August–3 September 1987. [Google Scholar]
- Lazar, O.R.; Bohacs, K.M.; Macquaker, J.H.; Schieber, J.; Demko, T.M. Capturing key attributes of fine-grained sedimentary rocks in outcrops, cores, and thin sections: Nomenclature and description guidelines. J. Sediment. Res. 2015, 85, 230–246. [Google Scholar] [CrossRef]
- Shi, Z.; Qiu, Z.; Dong, D.; Lu, B.; Liang, P.; Zhang, M. Lamina characteristics of gas-bearing shale fine-grained sediment of the Silurian Longmaxi Formation of Well Wuxi 2 in Sichuan Basin, SW China. Pet. Explor. Dev. 2018, 45, 358–368. [Google Scholar] [CrossRef]
- Yawar, Z.; Schieber, J. On the origin of silt laminae in laminated shales. Sediment. Geol. 2017, 360, 22–34. [Google Scholar] [CrossRef]
- Jin, Z.; Zhang, Q.; Zhu, R.; Dong, L.; Fu, J.; Liu, H.; Lu, Y.; Liu, G.; Li, M.; Zhao, X.; et al. Classification of lacustrine shale oil reservoirs in China and its significance. Oil Gas Geol. 2023, 44, 801–810. [Google Scholar]
- Shi, Z.; Dong, D.; Wang, H.; Sun, S.; Wu, J. Reservoir characteristics and genetic mechanisms of gas-bearing shales with different laminae and laminae combinations: A case study of Member 1 of the Lower Silurian Longmaxi shale in Sichuan Basin, SW China. Pet. Explor. Dev. 2020, 47, 888–900. [Google Scholar]
- Gale, J.F.; Laubach, S.E.; Olson, J.E.; Eichhubl, P.; Fall, A. Natural fractures in shale: A review and new observations. AAPG Bull. 2014, 98, 2165–2216. [Google Scholar]
- Zeng, L.; Lü, W.; Xu, X.; Tian, H.; Lu, S.; Zhang, M. Development characteristics, formation mechanism and hydrocarbon significance of bedding fractures in typical tight sandstone and shale. Acta Pet. Sin. 2022, 43, 180. [Google Scholar]
- Ingram, R.L. Terminology for the thickness of stratification and parting units in sedimentary rocks. Geol. Soc. Am. Bull. 1954, 65, 937–938. [Google Scholar]
- Gale, J.F.; Reed, R.M.; Holder, J. Natural fractures in the Barnett Shale and their importance for hydraulic fracture treatments. AAPG Bull. 2007, 91, 603–622. [Google Scholar] [CrossRef]
- Tan, P.; Jin, Y.; Han, K.; Hou, B.; Chen, M.; Guo, X.; Gao, J. Analysis of hydraulic fracture initiation and vertical propagation behavior in laminated shale formation. Fuel 2017, 206, 482–493. [Google Scholar]
- Zhang, F.; Wu, J.; Huang, H.; Wang, X.; Luo, H.; Yue, W.; Hou, B. Technological parameter optimization for improving the complexity of hydraulic fractures in deep shale reservoirs. Nat. Gas Ind. 2021, 41, 125–135. [Google Scholar]
- Suarez-Rivera, R.; Burghardt, J.; Stanchits, S.; Edelman, E.; Surdi, A. Understanding the effect of rock fabric on fracture complexity for improving completion design and well performance. In Proceedings of the IPTC 2013: International Petroleum Technology Conference. European Association of Geoscientists & Engineers, Beijing, China, 26–28 March 2013; p. cp–350. [Google Scholar]
- Guo, T.; Zhang, S.; Qu, Z.; Zhou, T.; Xiao, Y.; Gao, J. Experimental study of hydraulic fracturing for shale by stimulated reservoir volume. Fuel 2014, 128, 373–380. [Google Scholar] [CrossRef]
- Huang, B.; Liu, J. Experimental investigation of the effect of bedding planes on hydraulic fracturing under true triaxial stress. Rock Mech. Rock Eng. 2017, 50, 2627–2643. [Google Scholar]
- Hou, B.; Zhang, R.; Zeng, Y.; Fu, W.; Muhadasi, Y.; Chen, M. Analysis of hydraulic fracture initiation and propagation in deep shale formation with high horizontal stress difference. J. Pet. Sci. Eng. 2018, 170, 231–243. [Google Scholar] [CrossRef]
- Zhang, R.; Hou, B.; Han, H.; Fan, M.; Chen, M. Experimental investigation on fracture morphology in laminated shale formation by hydraulic fracturing. J. Pet. Sci. Eng. 2019, 177, 442–451. [Google Scholar]
- Zhang, Y.; Long, A.; Zhao, Y.; Zang, A.; Wang, C. Mutual impact of true triaxial stress, borehole orientation and bedding inclination on laboratory hydraulic fracturing of Lushan shale. J. Rock Mech. Geotech. Eng. 2023, 15, 3131–3147. [Google Scholar]
- Sun, K.; Zhang, S.; Xin, L. Impacts of bedding directions of shale gas reservoirs on hydraulically induced crack propagation. Nat. Gas Ind. B 2016, 3, 139–145. [Google Scholar]
- He, Z.; Duan, B. Dynamic modeling of bedding-plane slip during hydraulic fracturing. Geophysics 2019, 84, KS95–KS104. [Google Scholar]
- Sun, C.; Zheng, H.; Liu, W.D.; Lu, W. Numerical simulation analysis of vertical propagation of hydraulic fracture in bedding plane. Eng. Fract. Mech. 2020, 232, 107056. [Google Scholar]
- Figueiredo, B.; Tsang, C.F.; Rutqvist, J.; Niemi, A. Study of hydraulic fracturing processes in shale formations with complex geological settings. J. Pet. Sci. Eng. 2017, 152, 361–374. [Google Scholar] [CrossRef]
- Liu, J.; Liang, X.; Xue, Y.; Fu, Y.; Yao, K.; Dou, F. Investigation on crack initiation and propagation in hydraulic fracturing of bedded shale by hybrid phase-field modeling. Theor. Appl. Fract. Mech. 2020, 108, 102651. [Google Scholar]
- Nagel, N.; Sanchez-Nagel, M.; Zhang, F.; Garcia, X.; Lee, B. Coupled numerical evaluations of the geomechanical interactions between a hydraulic fracture stimulation and a natural fracture system in shale formations. Rock Mech. Rock Eng. 2013, 46, 581–609. [Google Scholar]
- Zhang, Y.; Liu, Z.; Han, B.; Zhu, S.; Zhang, X. Numerical study of hydraulic fracture propagation in inherently laminated rocks accounting for bedding plane properties. J. Pet. Sci. Eng. 2022, 210, 109798. [Google Scholar] [CrossRef]
- Lisjak, A.; Grasselli, G. A review of discrete modeling techniques for fracturing processes in discontinuous rock masses. J. Rock Mech. Geotech. Eng. 2014, 6, 301–314. [Google Scholar]
- Zhou, T.; Wang, H.; Li, F.; Li, Y.; Zou, Y.; Zhang, C. Numerical simulation of hydraulic fracture propagation in laminated shale reservoirs. Pet. Explor. Dev. 2020, 47, 1117–1130. [Google Scholar] [CrossRef]
- Cundall, P.A.; Strack, O.D. A discrete numerical model for granular assemblies. Geotechnique 1979, 29, 47–65. [Google Scholar] [CrossRef]
- Liu, Z.; Xu, H.; Zhao, Z.; Chen, Z. DEM modeling of interaction between the propagating fracture and multiple pre-existing cemented discontinuities in shale. Rock Mech. Rock Eng. 2019, 52, 1993–2001. [Google Scholar] [CrossRef]
- Lei, B.; Zuo, J.; Liu, H.; Wang, J.; Xu, F.; Li, H. Experimental and numerical investigation on shale fracture behavior with different bedding properties. Eng. Fract. Mech. 2021, 247, 107639. [Google Scholar] [CrossRef]
- Yoon, J.S.; Zang, A.; Stephansson, O. Numerical investigation on optimized stimulation of intact and naturally fractured deep geothermal reservoirs using hydro-mechanical coupled discrete particles joints model. Geothermics 2014, 52, 165–184. [Google Scholar] [CrossRef]
- Yoon, J.S.; Zimmermann, G.; Zang, A. Discrete element modeling of cyclic rate fluid injection at multiple locations in naturally fractured reservoirs. Int. J. Rock Mech. Min. Sci. 2015, 74, 15–23. [Google Scholar] [CrossRef]
- Yoon, J.S.; Zang, A.; Stephansson, O.; Hofmann, H.; Zimmermann, G. Discrete element modelling of hydraulic fracture propagation and dynamic interaction with natural fractures in hard rock. Procedia Eng. 2017, 191, 1023–1031. [Google Scholar] [CrossRef]
- Zhang, F.; Dontsov, E.; Mack, M. Fully coupled simulation of a hydraulic fracture interacting with natural fractures with a hybrid discrete-continuum method. Int. J. Numer. Anal. Methods Geomech. 2017, 41, 1430–1452. [Google Scholar] [CrossRef]
- Zhang, F.; Damjanac, B.; Maxwell, S. Investigating hydraulic fracturing complexity in naturally fractured rock masses using fully coupled multiscale numerical modeling. Rock Mech. Rock Eng. 2019, 52, 5137–5160. [Google Scholar] [CrossRef]
- Kwok, C.Y.; Duan, K.; Pierce, M. Modeling hydraulic fracturing in jointed shale formation with the use of fully coupled discrete element method. Acta Geotech. 2020, 15, 245–264. [Google Scholar] [CrossRef]
- Liu, M.; Luo, X.; Bi, R.; Zhou, J.; Du, K. Impacts of bedding angle and cementation type of bedding planes on mechanical behavior of thin-layer structured bedded rocks under uniaxial compression. Geomech. Energy Environ. 2023, 35, 100473. [Google Scholar] [CrossRef]
- Wang, J.; Wang, Y.; Yang, L.; Chang, T.; Jiang, Q. Effects of bedding geometry and cementation strength on shale tensile strength based on discrete element method. Shock Vib. 2021, 2021, 7805617. [Google Scholar] [CrossRef]
- Itasca, C. PFC (particle flow code in 2 and 3 dimensions), version 5.0 [User’s manual]. Numer. Anal. Methods Geomech. 2014, 32, 189–213. [Google Scholar]
- Potyondy, D.O.; Cundall, P. A bonded-particle model for rock. Int. J. Rock Mech. Min. Sci. 2004, 41, 1329–1364. [Google Scholar] [CrossRef]
- Mas Ivars, D.; Potyondy, D.; Pierce, M.; Cundall, P. The smooth-joint contact model. In Proceedings of the WCCM8-ECCOMAS, Lido Island, Italy, 30 June–5 July 2008; Volume 2008. 8th. [Google Scholar]
- Deisman, N.; Mas Ivars, D.; Pierce, M. PFC2D Smooth joint contact model numerical experiments. In Proceedings of the GeoEdmonton, Edmonton, AB, Canada, 21–24 September 2008; Volume 8. [Google Scholar]
- Lambert, C.; Coll, C. Discrete modeling of rock joints with a smooth-joint contact model. J. Rock Mech. Geotech. Eng. 2014, 6, 1–12. [Google Scholar] [CrossRef]
- Shimizu, H.; Murata, S.; Ishida, T. The distinct element analysis for hydraulic fracturing in hard rock considering fluid viscosity and particle size distribution. Int. J. Rock Mech. Min. Sci. 2011, 48, 712–727. [Google Scholar] [CrossRef]
- Hazzard, J.F.; Young, R.P. Moment tensors and micromechanical models. Tectonophysics 2002, 356, 181–197. [Google Scholar] [CrossRef]
- Hazzard, J.; Young, R.P. Dynamic modelling of induced seismicity. Int. J. Rock Mech. Min. Sci. 2004, 41, 1365–1376. [Google Scholar] [CrossRef]
- Heng, S.; Li, X.; Liu, X.; Chen, Y. Experimental study on the mechanical properties of bedding planes in shale. J. Nat. Gas Sci. Eng. 2020, 76, 103161. [Google Scholar] [CrossRef]
- Liu, L.; Li, H.; Chen, S.; Shao, Z.; Zhou, C.; Fu, S. Effects of bedding planes on mechanical characteristics and crack evolution of rocks containing a single pre-existing flaw. Eng. Geol. 2021, 293, 106325. [Google Scholar] [CrossRef]
- Niandou, H.; Shao, J.; Henry, J.; Fourmaintraux, D. Laboratory investigation of the mechanical behaviour of Tournemire shale. Int. J. Rock Mech. Min. Sci. 1997, 34, 3–16. [Google Scholar] [CrossRef]
- Mclamore, W. The mechanical behavior of anisotropic sedimentary rocks. Trans. Am. Soc. Mech. Engrs. 1967, 89, 62–76. [Google Scholar]
- Yoon, J.S.; Zimmermann, G.; Zang, A.; Stephansson, O. Discrete element modeling of fluid injection–induced seismicity and activation of nearby fault. Can. Geotech. J. 2015, 52, 1457–1465. [Google Scholar]
- Ghanizadeh, A.; Gasparik, M.; Amann-Hildenbrand, A.; Gensterblum, Y.; Krooss, B.M. Experimental study of fluid transport processes in the matrix system of the European organic-rich shales: I. Scandinavian Alum Shale. Mar. Pet. Geol. 2014, 51, 79–99. [Google Scholar]
- Savitski, A.; Detournay, E. Propagation of a penny-shaped fluid-driven fracture in an impermeable rock: Asymptotic solutions. Int. J. Solids Struct. 2002, 39, 6311–6337. [Google Scholar] [CrossRef]
- Zou, Y.; Ma, X.; Zhang, S.; Zhou, T.; Li, H. Numerical investigation into the influence of bedding plane on hydraulic fracture network propagation in shale formations. Rock Mech. Rock Eng. 2016, 49, 3597–3614. [Google Scholar]
- Zhang, Q.; Zhang, X.P.; Ji, P.Q. Numerical study of interaction between a hydraulic fracture and a weak plane using the bonded-particle model based on moment tensors. Comput. Geotech. 2019, 105, 79–93. [Google Scholar]
- Campbell, C.V. Lamina, laminaset, bed and bedset. Sedimentology 1967, 8, 7–26. [Google Scholar]


Disclaimer/Publisher’s Note: The statements, opinions and data contained in all publications are solely those of the individual author(s) and contributor(s) and not of MDPI and/or the editor(s). MDPI and/or the editor(s) disclaim responsibility for any injury to people or property resulting from any ideas, methods, instructions or products referred to in the content. |
© 2025 by the authors. Licensee MDPI, Basel, Switzerland. This article is an open access article distributed under the terms and conditions of the Creative Commons Attribution (CC BY) license (https://creativecommons.org/licenses/by/4.0/).