Article

A Review of CO2 Capture Utilization and Storage in China: Development Status, Cost Limits, and Strategic Planning

PetroChina Research Institute of Petroleum Exploration and Development, Beijing 100083, China
*
Author to whom correspondence should be addressed.
Processes 2025, 13(3), 905; https://doi.org/10.3390/pr13030905
Submission received: 19 November 2024 / Revised: 11 March 2025 / Accepted: 13 March 2025 / Published: 19 March 2025

Abstract

:
The CCUS industry is developing rapidly worldwide, and its projects are gradually transitioning from single-section initiatives to whole-industry applications. Capture targets have expanded from power plants and natural gas processing to include steel, cement, kerosene, fertilizer, and hydrogen production. This paper analyzes CO2 emissions in eight major industries around oil regions in China, including emission factors, emission scale, and the composition and distribution of emission sources. The cost of CO2 sources and CO2-EOR affordable cost limits under different scenarios are calculated for different oil regions. The main influencing factors of the cost are analyzed, and possible ways to fill the cost gap are proposed. This paper also constructs a CO2-EOR strategic planning framework and a mathematical programming model, formulating short-term, mid-term, and long-term strategic plans for CO2-EOR and storage in 10 oil regions.

1. Introduction

CCUS technology is an evolution of CCS (carbon capture and storage) designed to purify CO2 emissions from industrial processes and integrate them into new production systems [1,2,3,4,5,6,7,8,9,10]. Research by the International Energy Agency (IEA) [11] indicates that CCUS must contribute 20% of emission reduction efforts to limit greenhouse gas concentrations to 450 ppm by 2050. CCUS provides an opportunity for the clean utilization of coal and will play an important role in emissions reduction in coal power, the coal chemical industry, and other fields. This is one of the key reasons why coal-rich countries such as China, the United States, and Australia prioritize CCUS [12,13,14].
CCUS is a new industry, and its industrial chain is still in the research and demonstration stage. However, from a technical point of view, the three major segments involved in CCUS, namely, capture, transportation, and storage, are relatively mature in terms of technological development [15,16,17].
In the capture segment, post-combustion treatment technologies in the power sector are relatively mature and are available for all power generation types. Pre-combustion treatment is an emerging technology with low capture costs, although generators are expensive. Capture technologies in the industrial sector vary widely in maturity and development, with capture from high-purity CO2 sources facing fewer technical challenges and being relatively mature, while CO2 capture from low concentrations such as cement, steel, and oil refining is yet to be developed [18,19,20].
In the transportation segment, there are a variety of flexible transportation modes. Pipeline transportation of CO2 is being commercially applied as a mature technology [21]. When entering the large-scale diffusion phase, the key is to develop a rational transportation plan.
In the storage segment, oil companies already have a systematic and specialized team in the process of long-term exploration and development of reservoirs. A series of field applications of CO2-EOR have been carried out and have become a model practice for CO2 storage in reservoirs and other geological bodies [22].
Currently, there are five main ways to drive the development of the CCUS industry: government and public funds, national incentive policies, taxation (carbon tax), mandatory emissions reduction policies, and carbon trading. Among them, incentive policies include investment subsidies from the government or organizations, tax reductions and exemptions, concessions on mine royalties, CO2 price guarantees, and government guarantees on investment loans [23]. It should be noted that CCUS projects are mostly in the research and demonstration stage, and their main driving force comes from the financial support of government and national incentives, as well as taxation and other factors [24,25,26]. With the development of the industry, when moving from the demonstration stage to the large-scale industrialization and commercial operation stage, mandatory emission reduction and the carbon trading market may become its main driving factors.
In this paper, we briefly compare the CCUS projects in China and abroad, introduce the characteristics of scale-concentrated CO2 emission sources in China, analyze the limits of CO2 source cost and CO2-EOR cost, propose several major ways to fill in the cost gap, optimize the resource allocation of the CCUS industry, and put forward strategic planning under different circumstances.

2. CCUS Projects: A Comparison Between China and Abroad

2.1. CCUS Industrial Model

According to the combination of capture, transportation, utilization, and storage in the CCUS industry, the current domestic and international CCUS industry model can be divided into three categories: ① CU type (capture–utilization): CO2 emissions are captured and directly utilized in chemicals, refrigeration, beverages, etc.; ② CTUS type (capture–transport–utilization–storage), such as the Enid fertilizer project running in Oklahoma in the U.S., with a capture volume of about 68 × 106 t/a, which adopts the mode of pipeline transportation and is used for CO2-EOR; ③ CTS type (capture–transport–storage), such as Norway’s Sleipner CO2 injection into brine aquifer project, which has been operating in the North Sea. At present, among the large-scale comprehensive projects in the world, CTUS-EOR is the main mode in the United States, Canada, and the Middle East, while the CTS–brine aquifer and abandoned field mode is the main mode in Europe, Australia, and New Zealand. Most of the projects that are running and under construction in China are based on CO2 utilization, so the industrial model is mostly of the CU type, partly of the CUS type, and the CTUS type, involving the complete industrial chain, is relatively less utilized. The number of large-scale projects with a complete industrial chain and permanent storage industrial model (CTUS or CTS) whose implementation is being planned is starting to increase [27,28,29,30].

2.2. Characteristics of CCUS Projects

The large-scale comprehensive CCUS projects in operation in the world mainly capture CO2 from high-concentration natural gas treatment, fertilizer production, and syngas. The CCUS projects under construction mainly capture CO2 from power plants and hydrogen production enterprises. The planned projects extend the capture targets to iron and steel, cement, kerosene, the chemical industry, etc. The CO2 capture scale of the projects ranges from 0.4 to 8.5 × 10⁶ t/a, and most of them are larger than 1 × 10⁶ t/a. The transportation distance is 0–315 km, and most of them are more than 100 km. In terms of the type of storage, 62.5% of the operating and executing projects are EOR projects. For projects under planning, the proportion of CO2-EOR projects decreases, accounting for about 46%, and the number of brine aquifer storage projects increases [31].
Comparing China’s CCUS projects with international ones, China is characterized by relatively few projects with a complete industrial chain in operation and execution, a smaller scale, a relatively single type of capture target, fewer long-distance pipeline transportation, and fewer saline aquifer storage projects. In the past decade, the relevant departments have increased support for the development of CCUS technology and have set up several major special projects to carry out theoretical, technological, and demonstration project research. CNPC, Sinopec, and other oil companies have also set up scientific and technological projects. China has made significant progress in theory, technology, and field tests and has successfully built demonstration bases for CO2-EOR and storage in Jilin, Shengli, and other oilfields.

3. Major CO2 Emission Sources and Distribution in China

3.1. CO2 Emission Calculation

The calculation of CO2 emissions in this paper is based on the internationally accepted IPCC method:
E C O 2 = E F × P
E C O 2 = E F × P C × a × T
where ECO2 means carbon dioxide emission (ton CO2 year−1), EF means carbon dioxide emission factor (ton CO2/ton product), P means product output (ton product year−1), PC means product annual production capacity (ton product year−1), a is capacity utilization factor, and T represents the average utilization time of equipment (hours).
Based on the output and production capacity of the enterprise, a comprehensive emission factor that considers both fuel combustion and process factors is used to calculate the emissions from point sources and summarize the total emissions. The determination of the emission factor is key, and it is a function of many factors, such as fuel type, combustion efficiency, process engineering, technical level, emission reduction degree, and technological progress [32]. As a preliminary study, average values of emission factors are used for each industrial sector. Table 1 shows the emission factors of the eight types of emission sources investigated in this study.

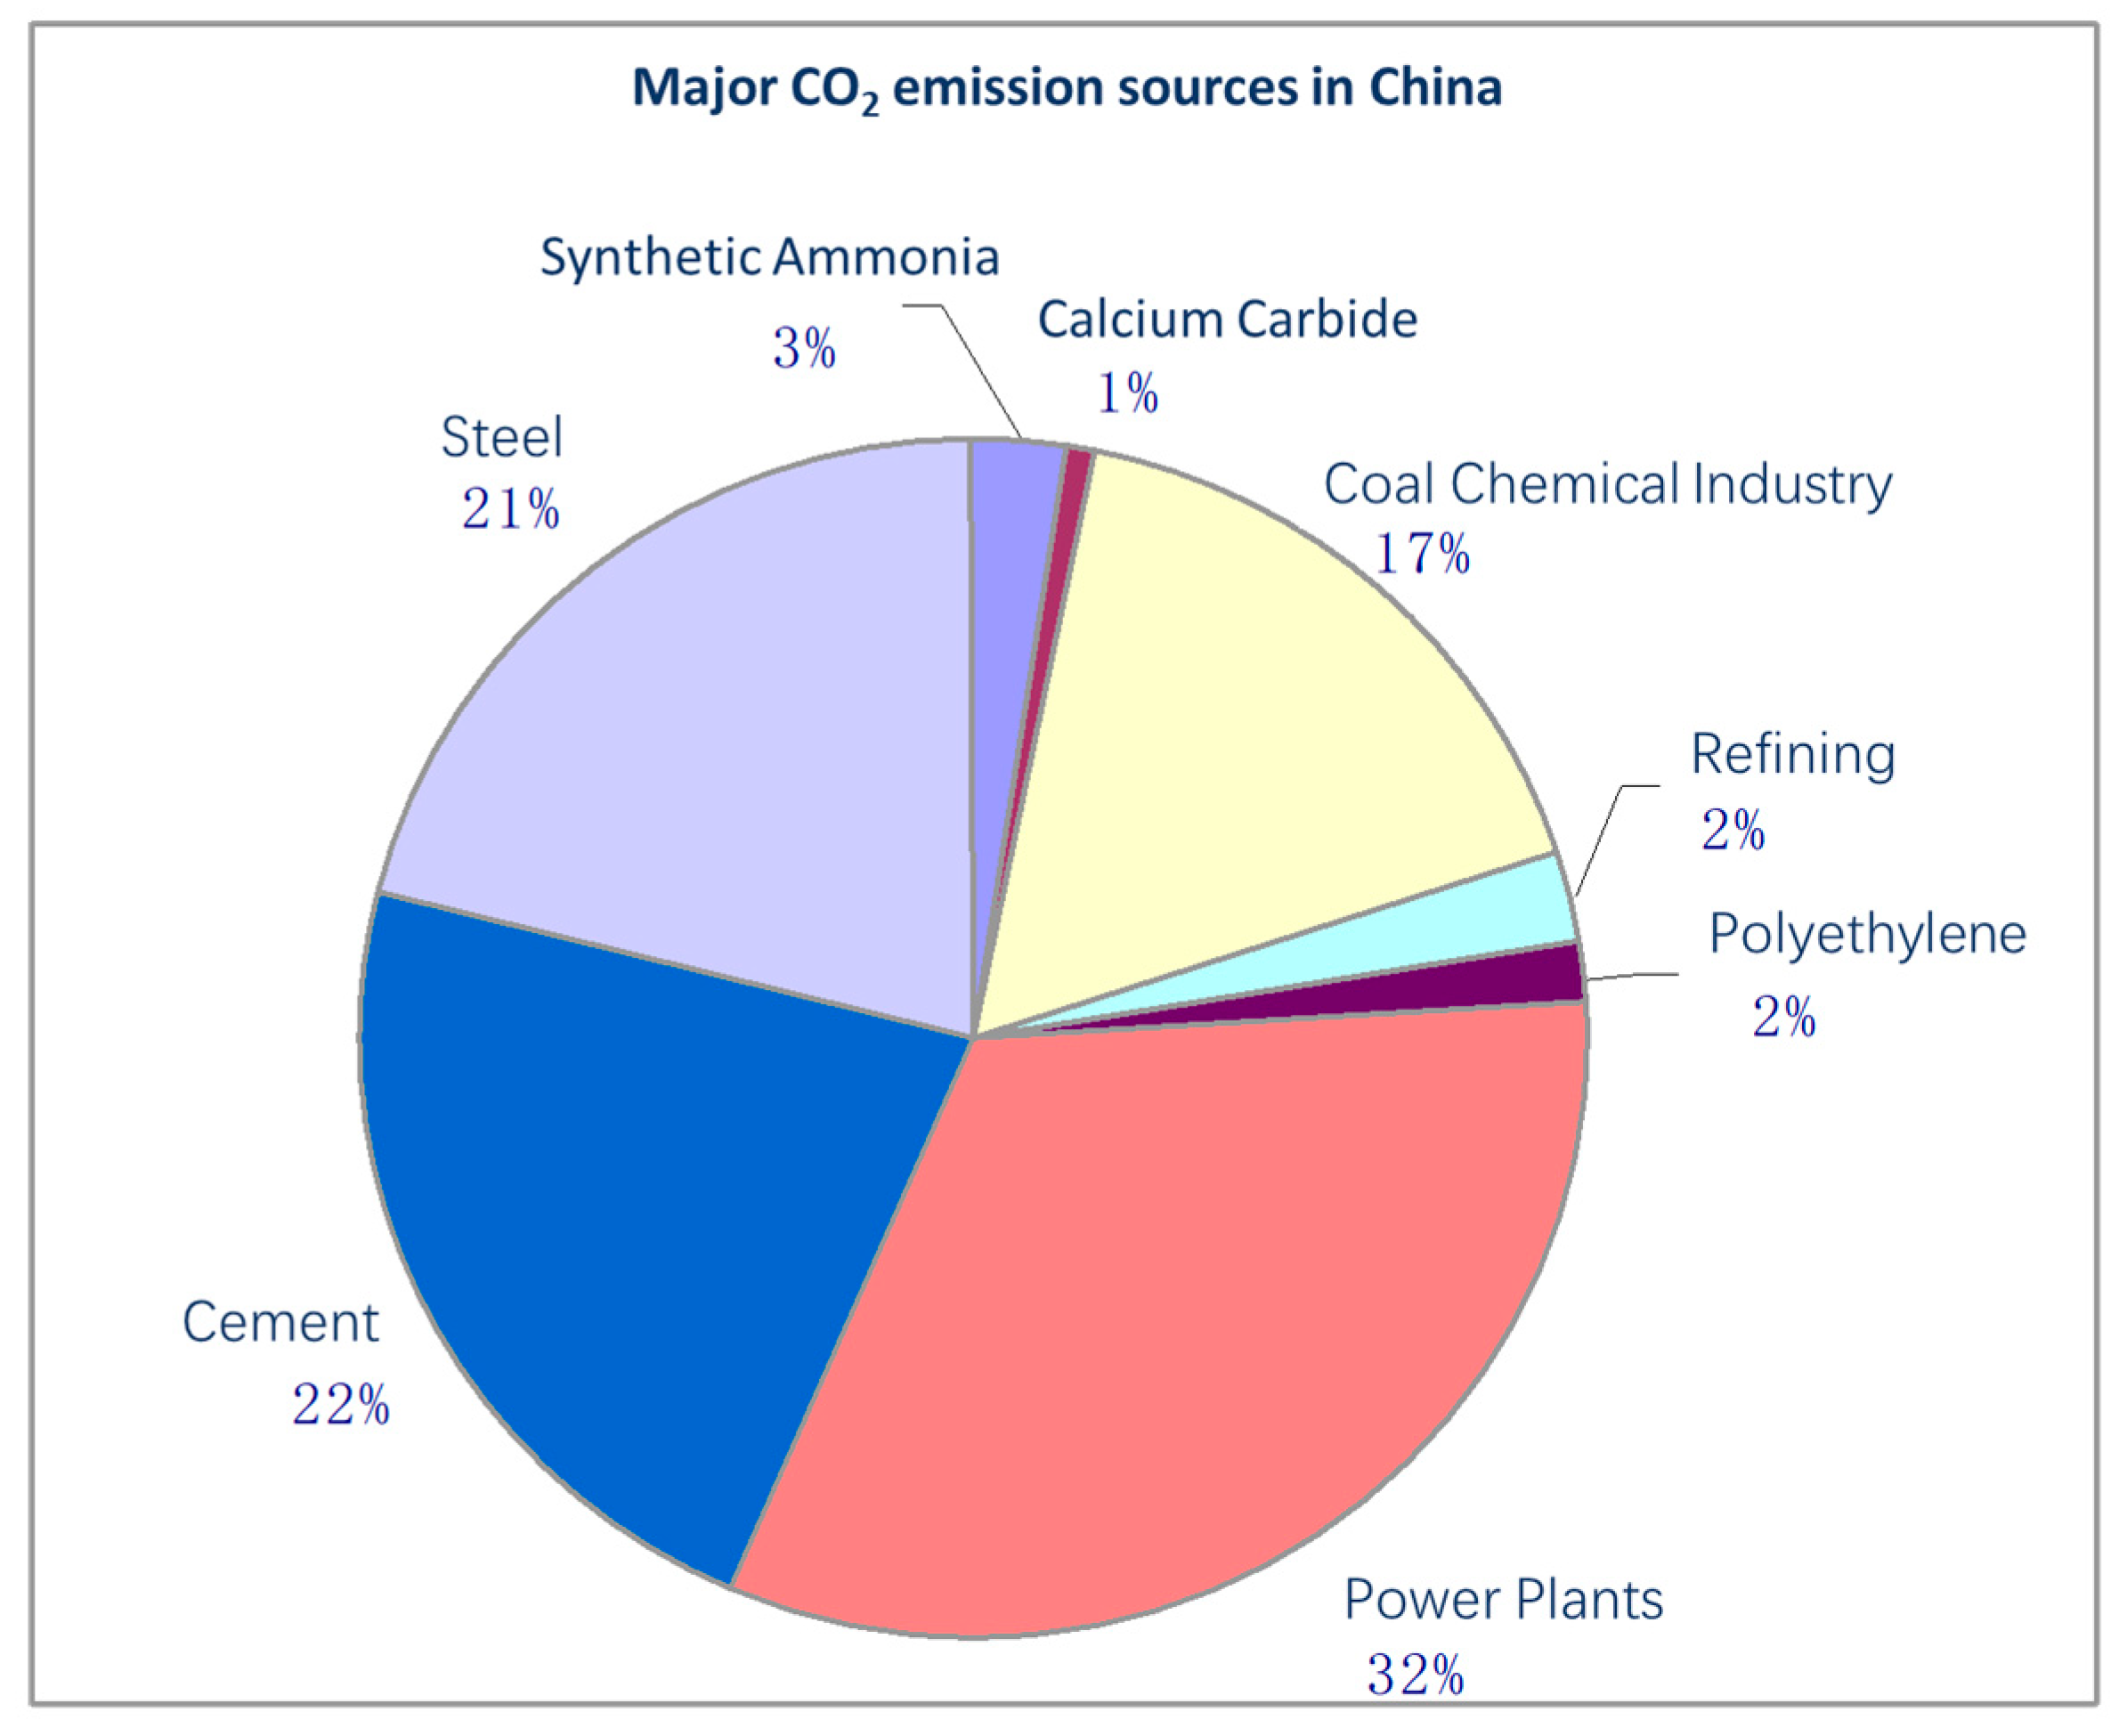
3.2. Scale and Composition of Major CO2 Emission Sources

Eight major industries were involved in this survey, namely, power plants (enterprises with large installed capacity), cement, steel, coal chemical industry, refining, polyethylene, synthetic ammonia (SA), and calcium carbide (CC).
Through the comparison of emissions, it can be seen that the main types of emission sources in China are power plants, cement, steel, and the coal chemical industry, and their emissions account for 92% of the total. The other four categories account for only 8% (Figure 1).
Comparing the scale of CO2 emissions of individual enterprises, the CO2 emissions of power enterprises are about 10 million tons year−1. The CO2 emissions of calcium carbide, oil refining, synthetic ammonia, and polystyrene enterprises are relatively small, ranging from tens to several million tons, mostly within 5 million tons year−1. The CO2 emissions of enterprises in the coal chemical industry, steel, and cement industries range widely, between 1 million and 30 million tons year−1 (Figure 2). The average CO2 emissions of each enterprise are listed in Table 2.

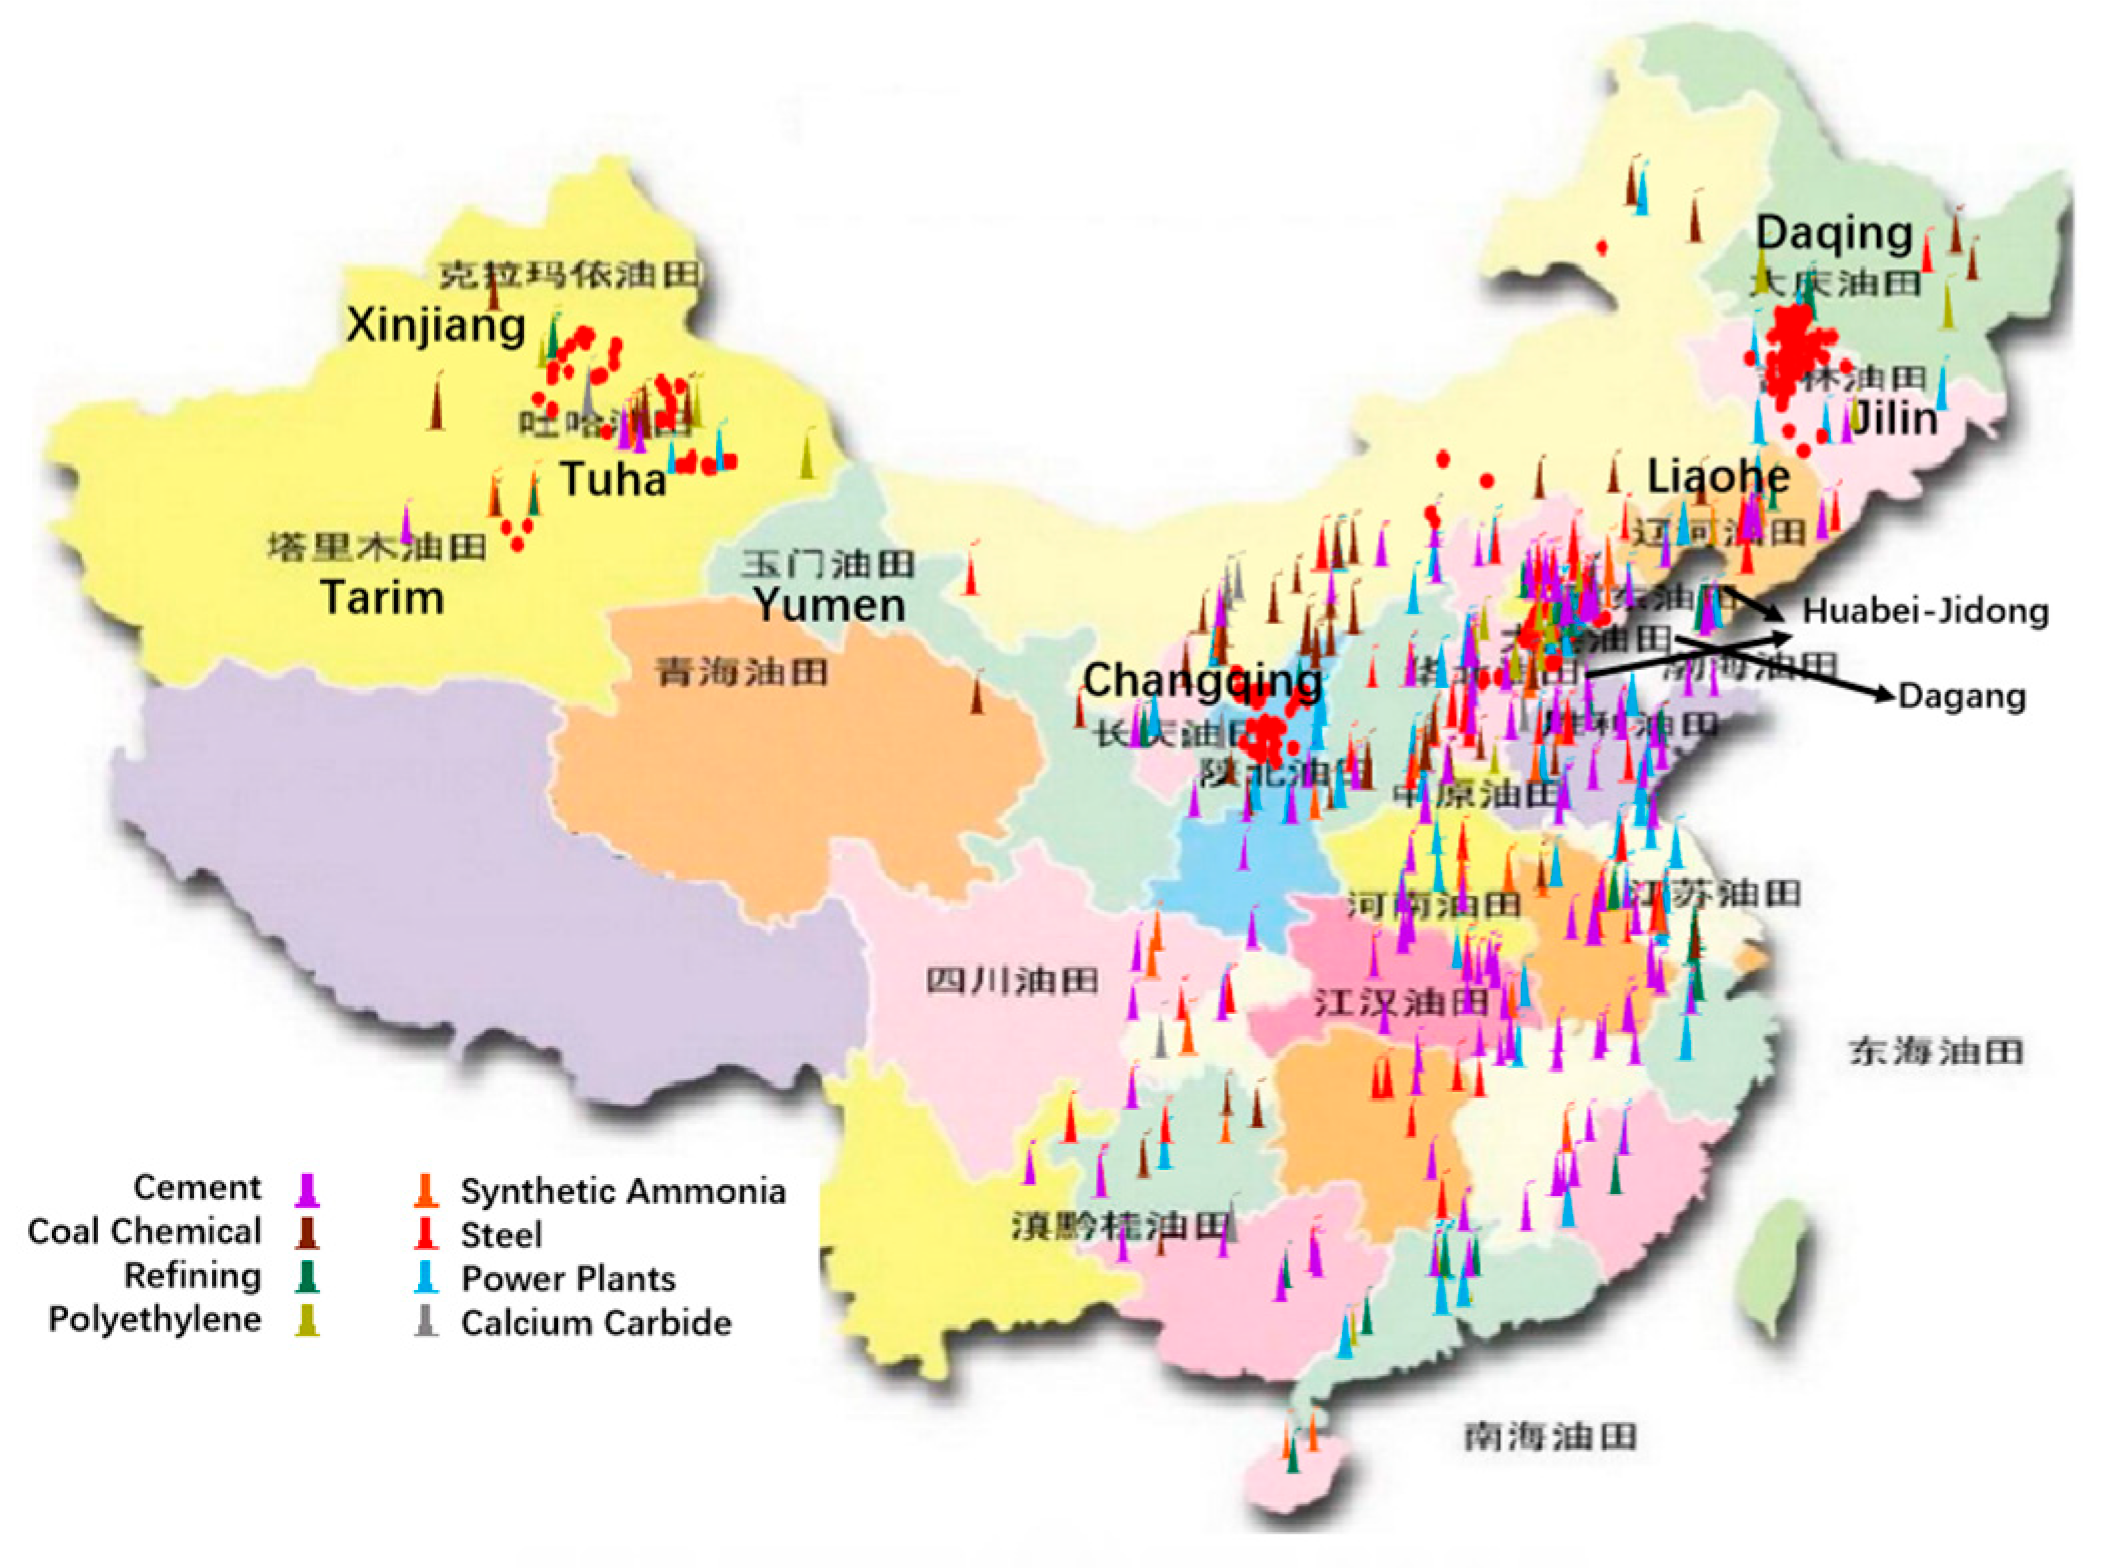
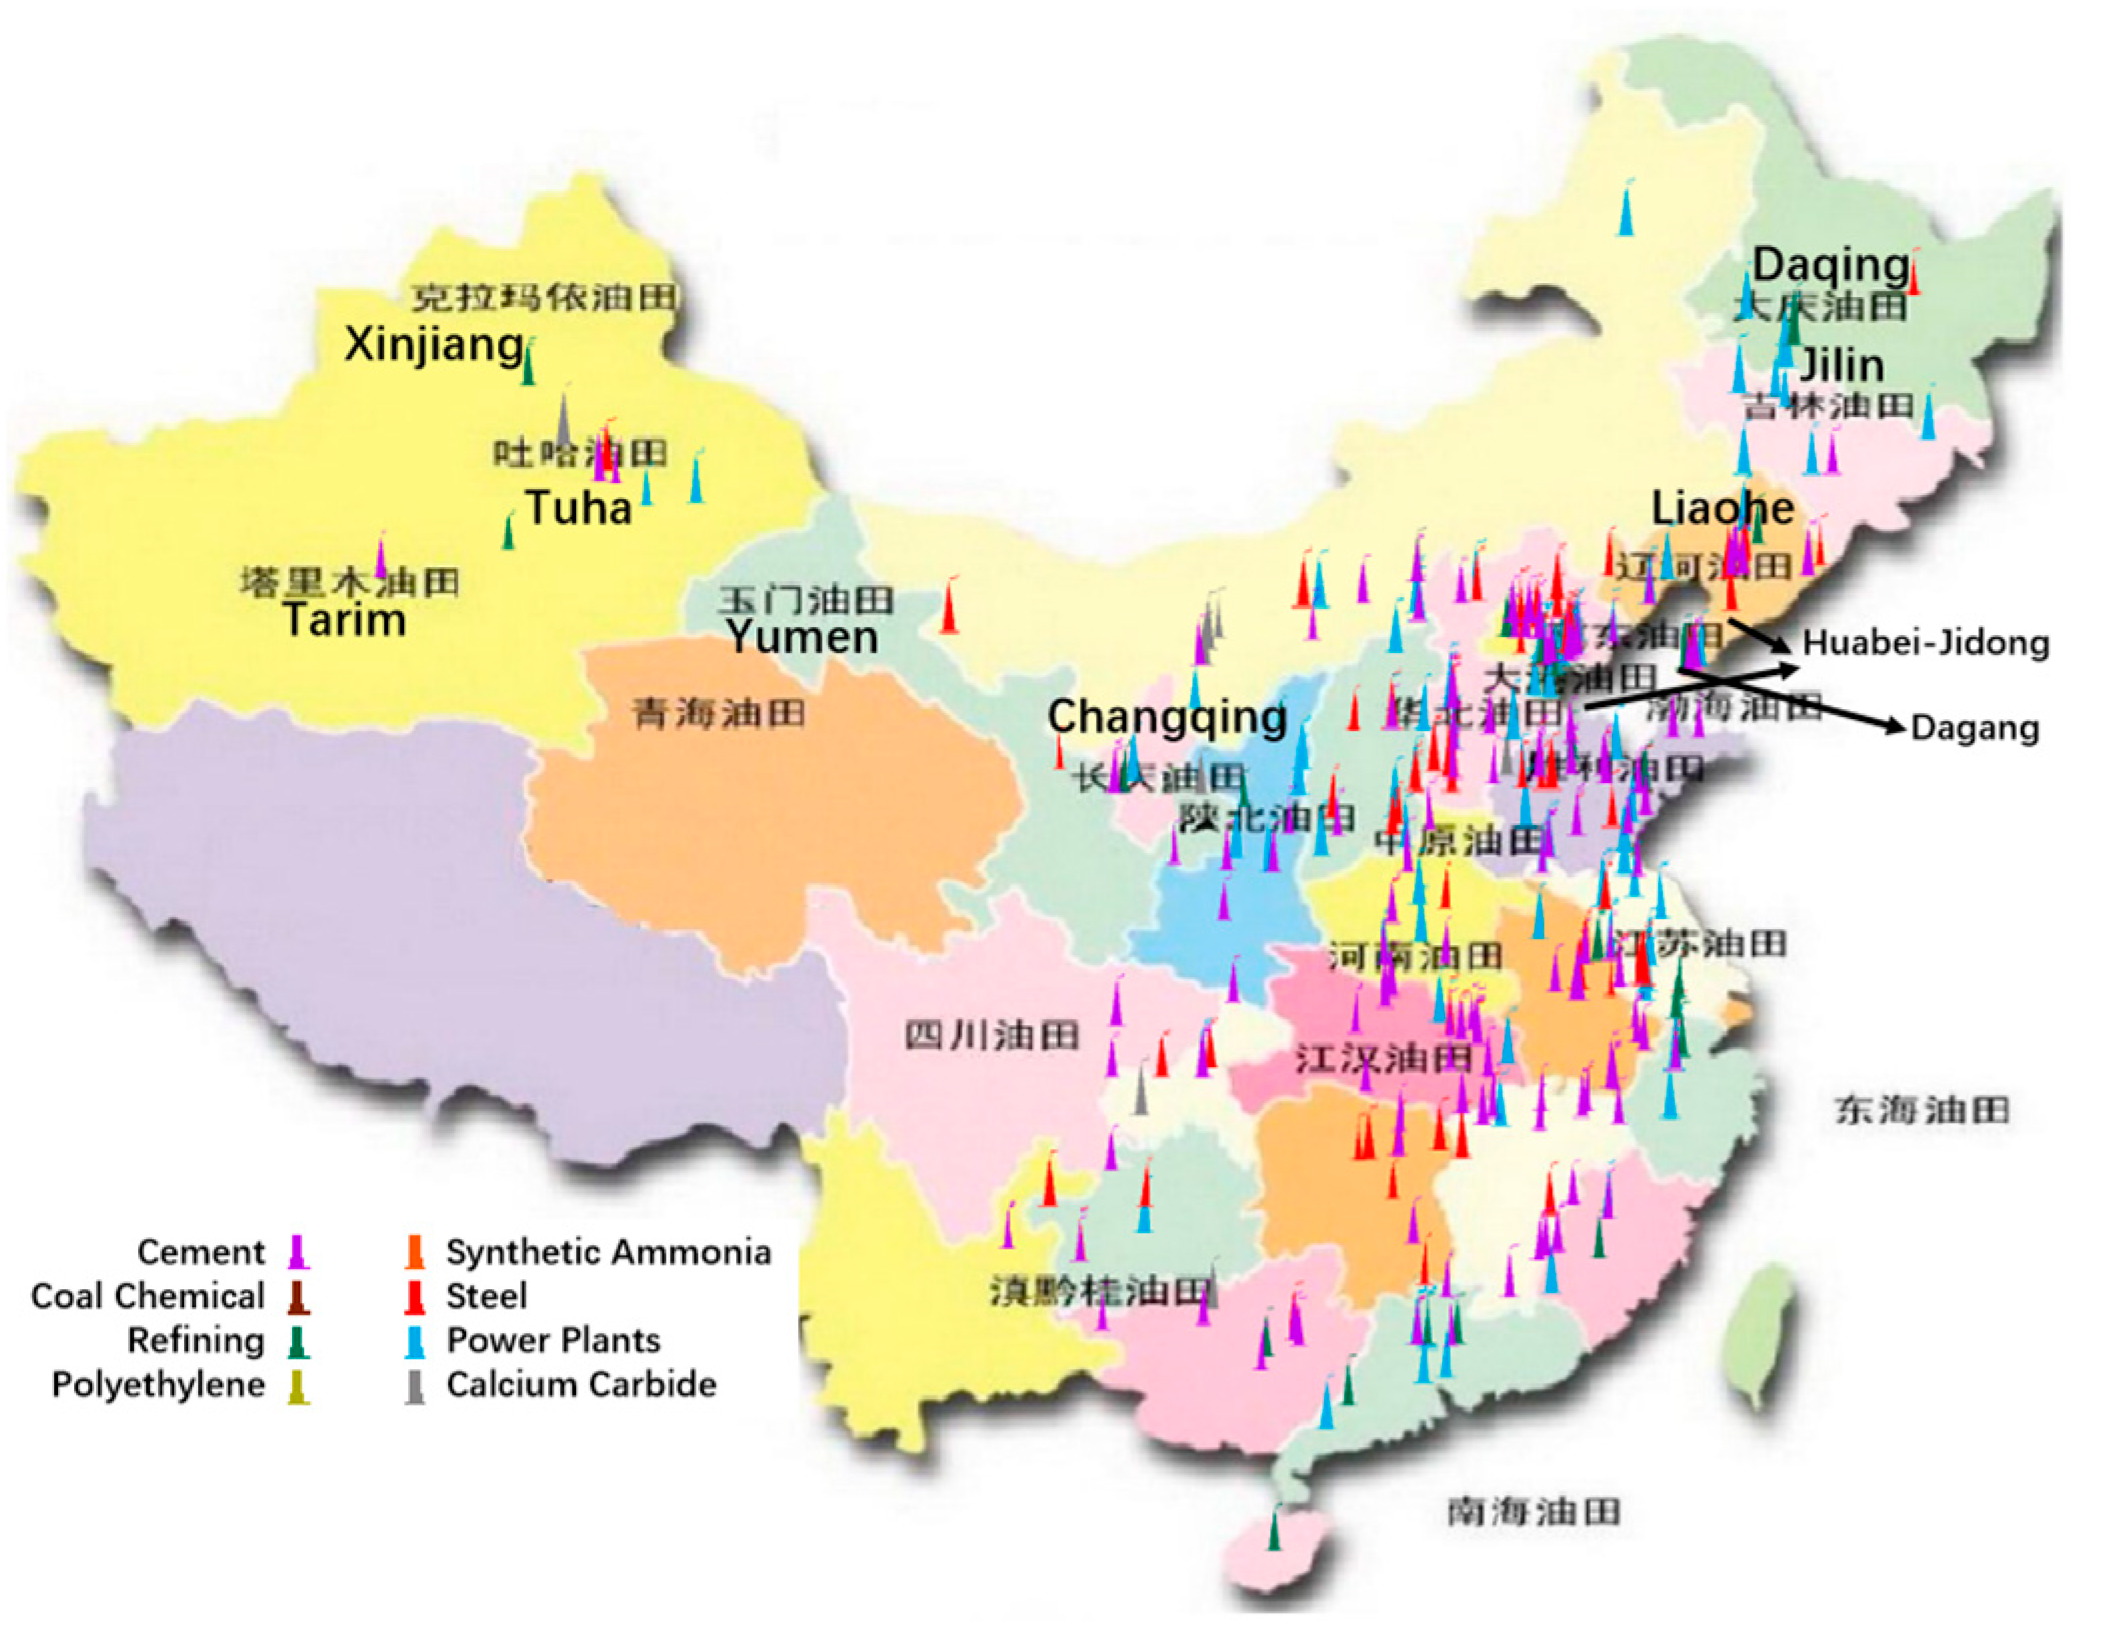
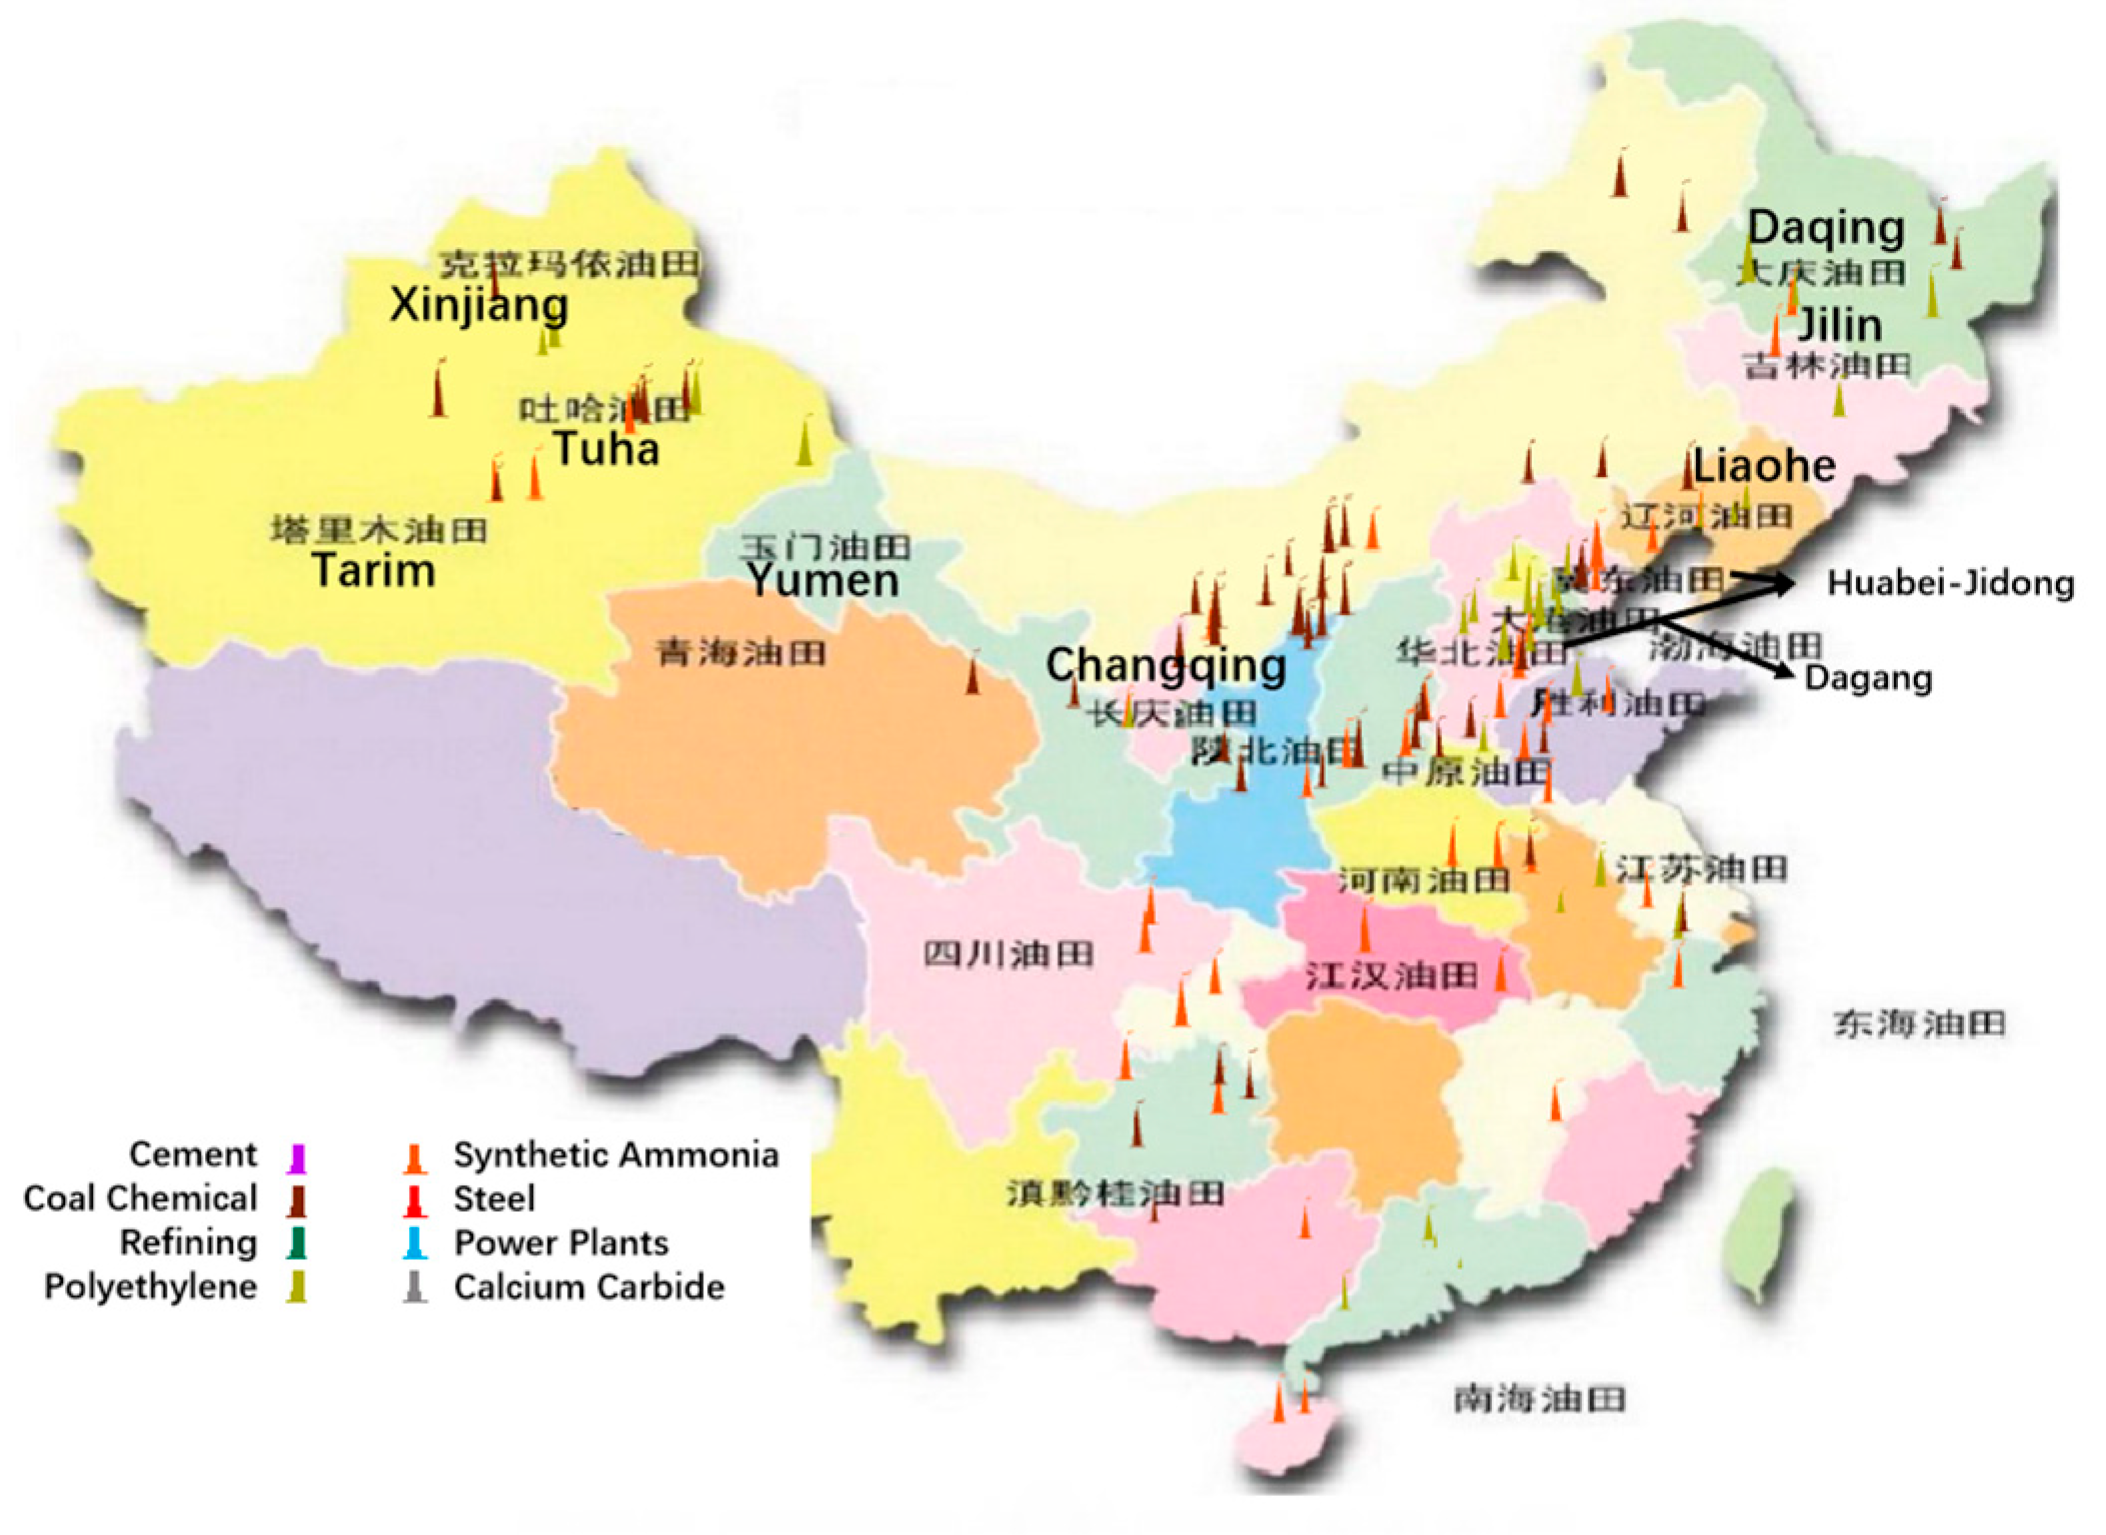
3.3. Distribution of CO2 Emission Sources

The distribution of the above-mentioned eight major CO2 emission industries is consistent with China’s population and economic development. They are mainly distributed in the east of China, and relatively few are in the west (Figure 3).
Among the eight types of CO2-emitting industries investigated in this study, the low-concentration CO2-emitting industries (power plants, cement, steel and refining, and chemical industries) have the most emission sources (Figure 4), and the high-concentration (coal chemical industry, synthetic ammonia, calcium carbide) and medium-concentration (polyethylene) CO2-emitting industries have relatively few emission sources (Figure 5).
In general, there are abundant CO2 emission sources near several major oil regions of China. The Xinjiang oil region and the Changqing oil region have many high-concentration CO2 emission sources (coal chemical, synthetic ammonia, and calcium carbide enterprises). The Huabei oil region, Jidong oil region, and Dagang oil region are mainly surrounded by medium-concentration (polyethylene) and low-concentration (cement and power plants) CO2 emission sources. The Daqing oil region and the Jilin oil region in Northeast China are mainly surrounded by low-concentration (power plants, refining, and steel) CO2 emission sources.

4. CO2 Source Cost and CO2-EOR Affordable Cost Limits

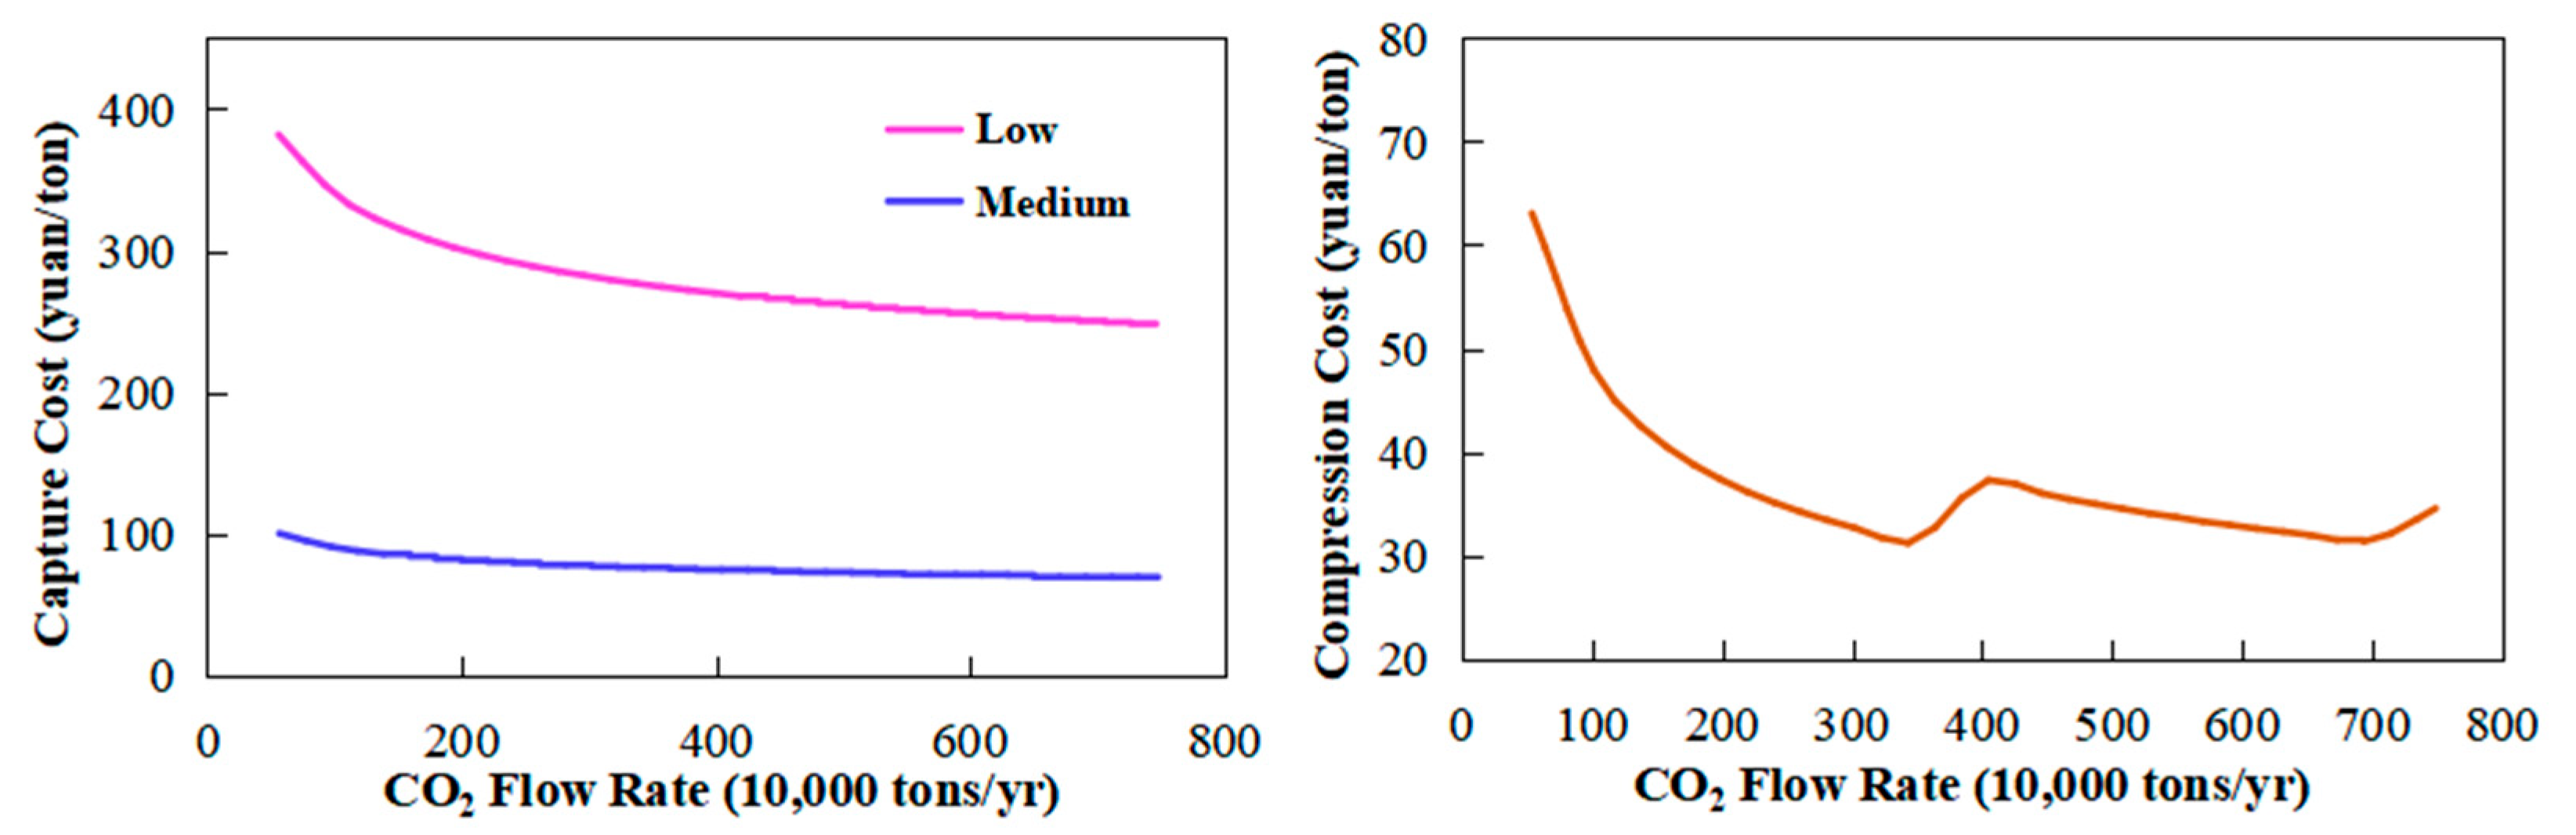
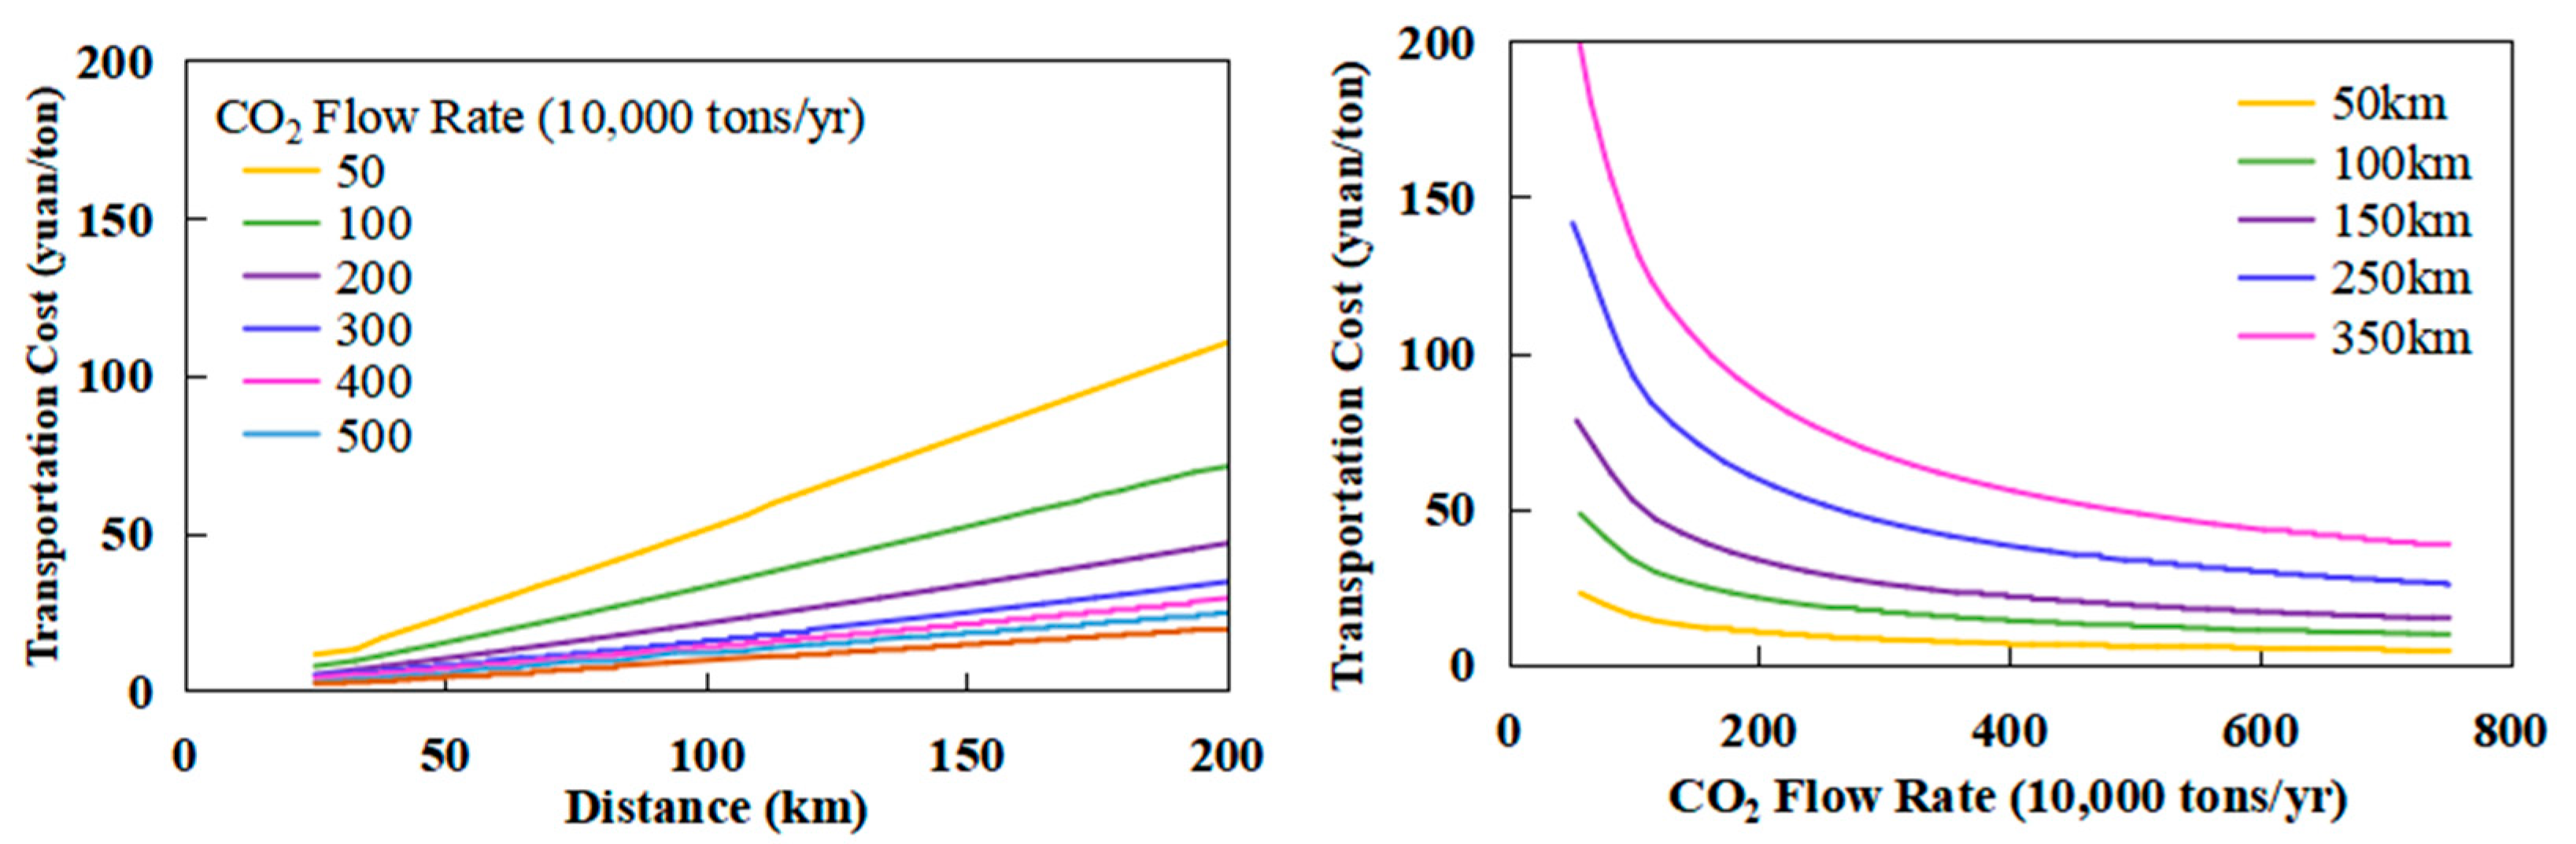
4.1. CO2 Source Cost and Influencing Factors

The source cost of CO2 mainly includes capture cost, compression cost, and transportation cost. The calculation of capture cost adopts the scale index method (scale factor method). The calculation of compression and transportation costs adopts the method of David L. McCollum and Joan M. Ogden of the University of California, Davis [33,34,35,36,37].
The influencing factors of CO2 source cost mainly include CO2 flow rate, emission concentration, and transportation distance.
For the capture cost, the main influencing factors are emission concentration and flow rate. A high emission concentration leads to a low capture cost, while a low emission concentration leads to a high capture cost. At the same emission concentration, the capture cost decreases with an increase in the CO2 flow rate, but the degree of influence varies with concentration. The effect of flow rate is more pronounced at low CO2 emission concentrations.
For compression cost, the main influencing factors are the CO2 flow rate and transportation distance. The influence of the flow rate on the cost is as follows: in a certain flow range, the compression cost decreases with an increase in the flow rate. When the flow rate reaches a certain scale, the investment and operation costs increase due to the need of increasing the compression power. Therefore, there is a jump in the compression cost curve (Figure 6).
For the transportation cost, the main influencing factors are transportation distance and CO2 flow rate. The transportation cost increases in a power function with the increase in transportation distance and decreases in a power function with the increase in the CO2 flow rate. The longer the transportation distance, the faster the decrease rate with the flow rate (Figure 7).
The CO2 source costs for high-concentration sources are dominated by compression costs, which account for about 90%. For medium-concentration sources, they are dominated by capture costs, which account for about 60%, and compression costs, which account for about 35%. For low-concentration sources, they are dominated by capture costs, which account for about 80%.

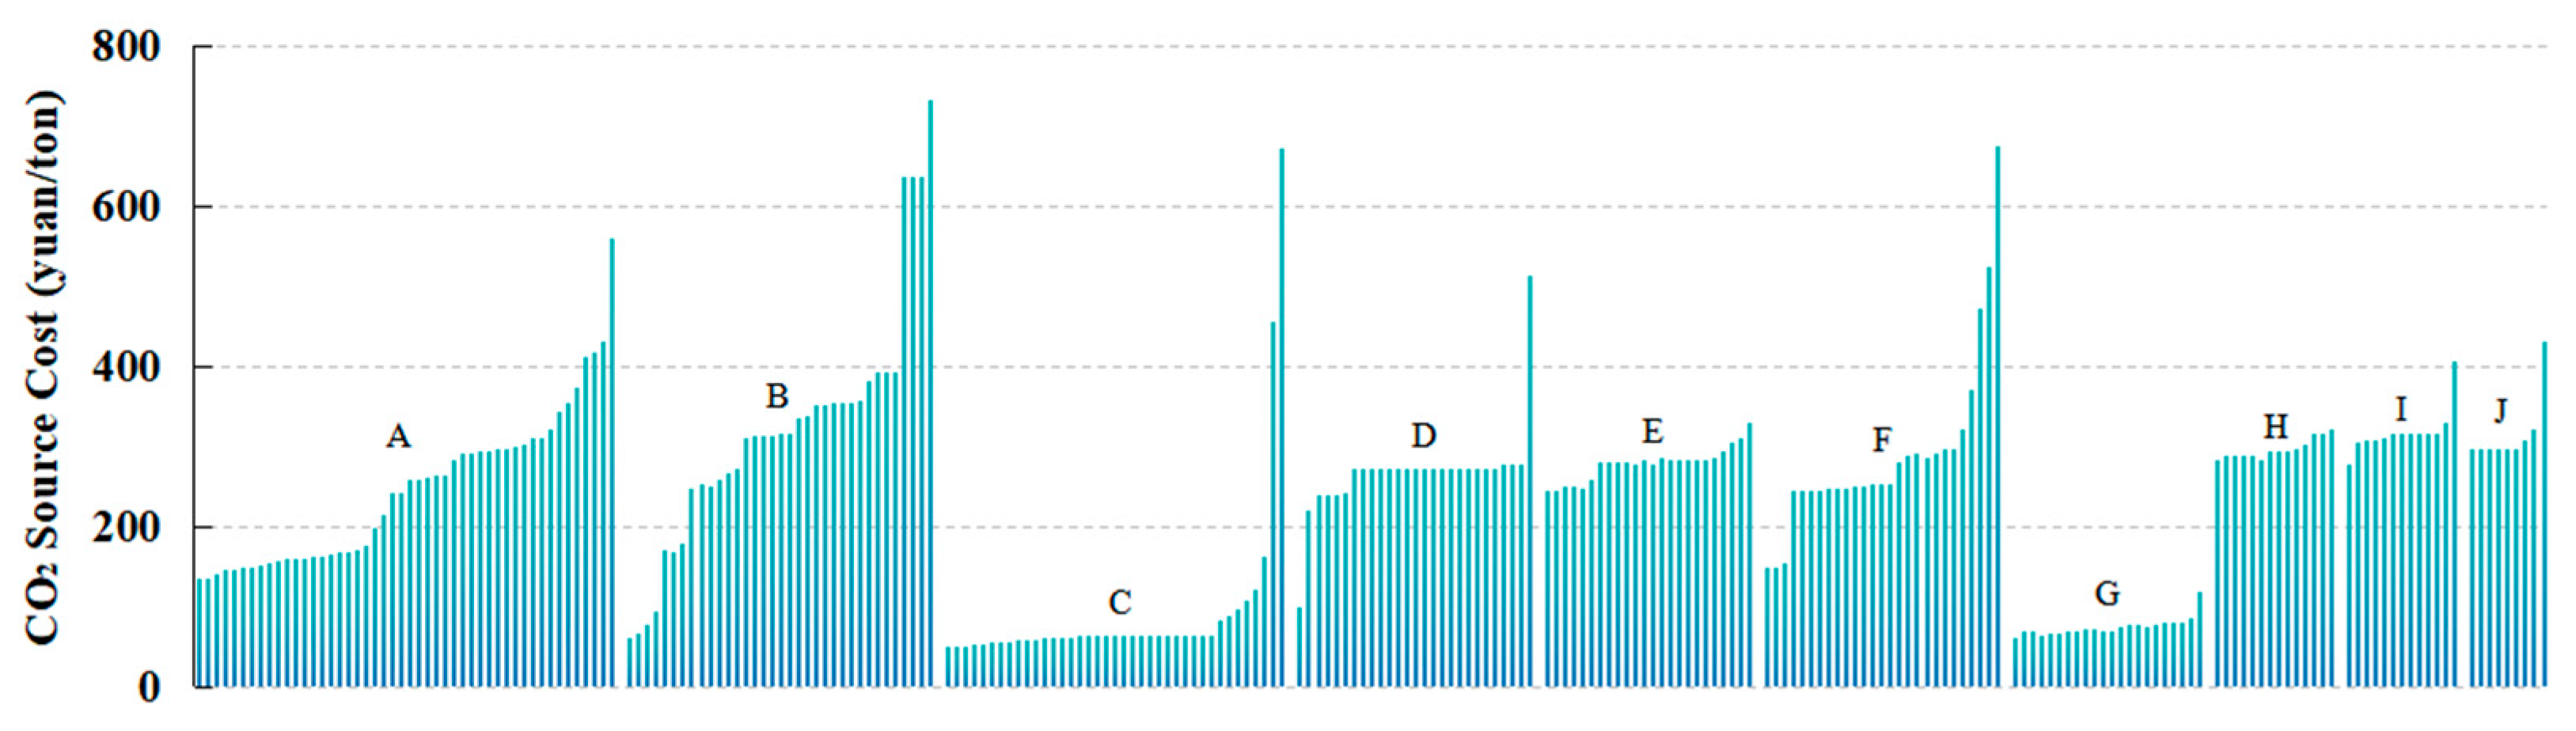
4.2. CO2 Source Cost of Each Oil Region

According to the estimation method of the CO2 source cost mentioned above, the source cost of 230 projects in 10 oil regions were calculated and listed in Table 3. The cost at the discharge point plus the transportation cost to the oil region is the source cost to the wellhead, which is called the CO2 source cost. Based on the principle of the lowest source cost, there are 92 CO2 emission sources required to meet the CO2-EOR requirements of the 230 projects, including 54 high-concentration, 11 medium-concentration, and 27 low-concentration resources. The capture and compression costs of high-concentration emission sources are mostly less than 150 CNY/ton, but the cost of emission sources with small emissions can reach 250 CNY/ton. The cost of medium-concentration emission points is 108–190 CNY/ton, while the cost of low-concentration emission sources is around 270–420 CNY/ton.
Calculation results show that if there are high concentration emission sources close to the projects and their emissions can meet the required CO2 consumption of the projects, the source cost is relatively low; this is the case for projects in the C and G oil regions. If medium- and low-concentration emission sources dominate near the projects, the cost of the source is relatively high, generally more than 200–300 CNY/ton (Figure 8).

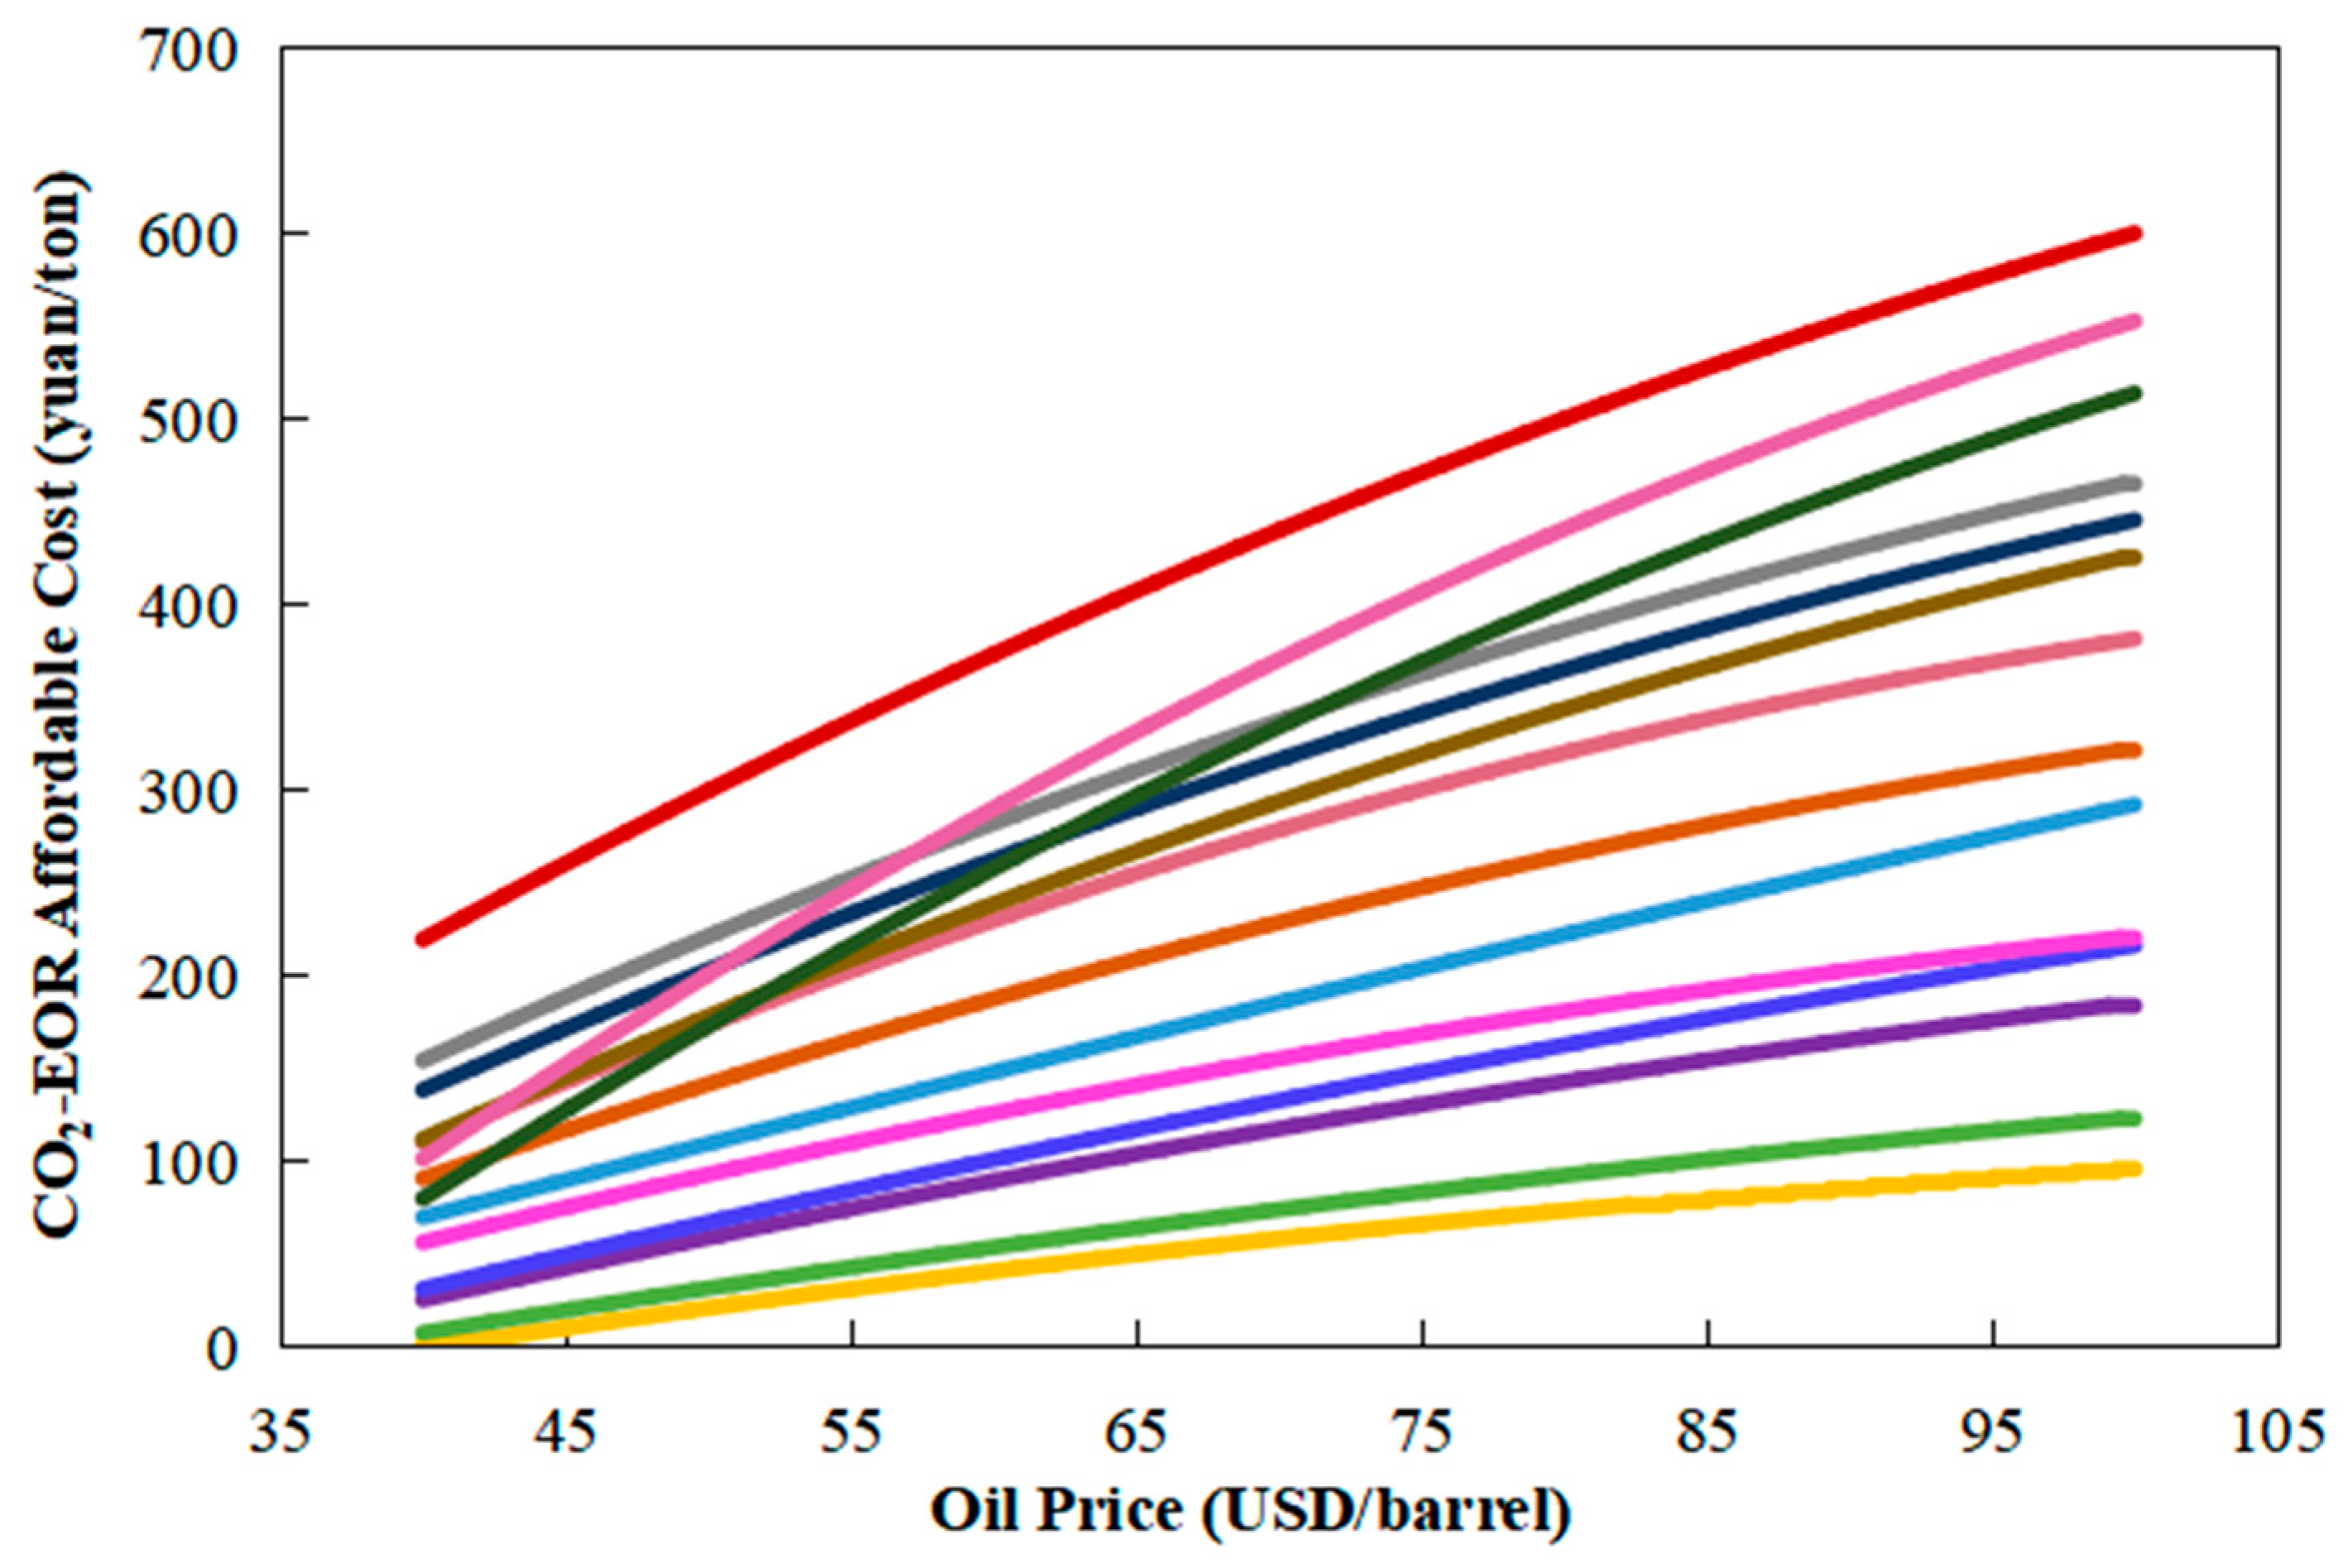
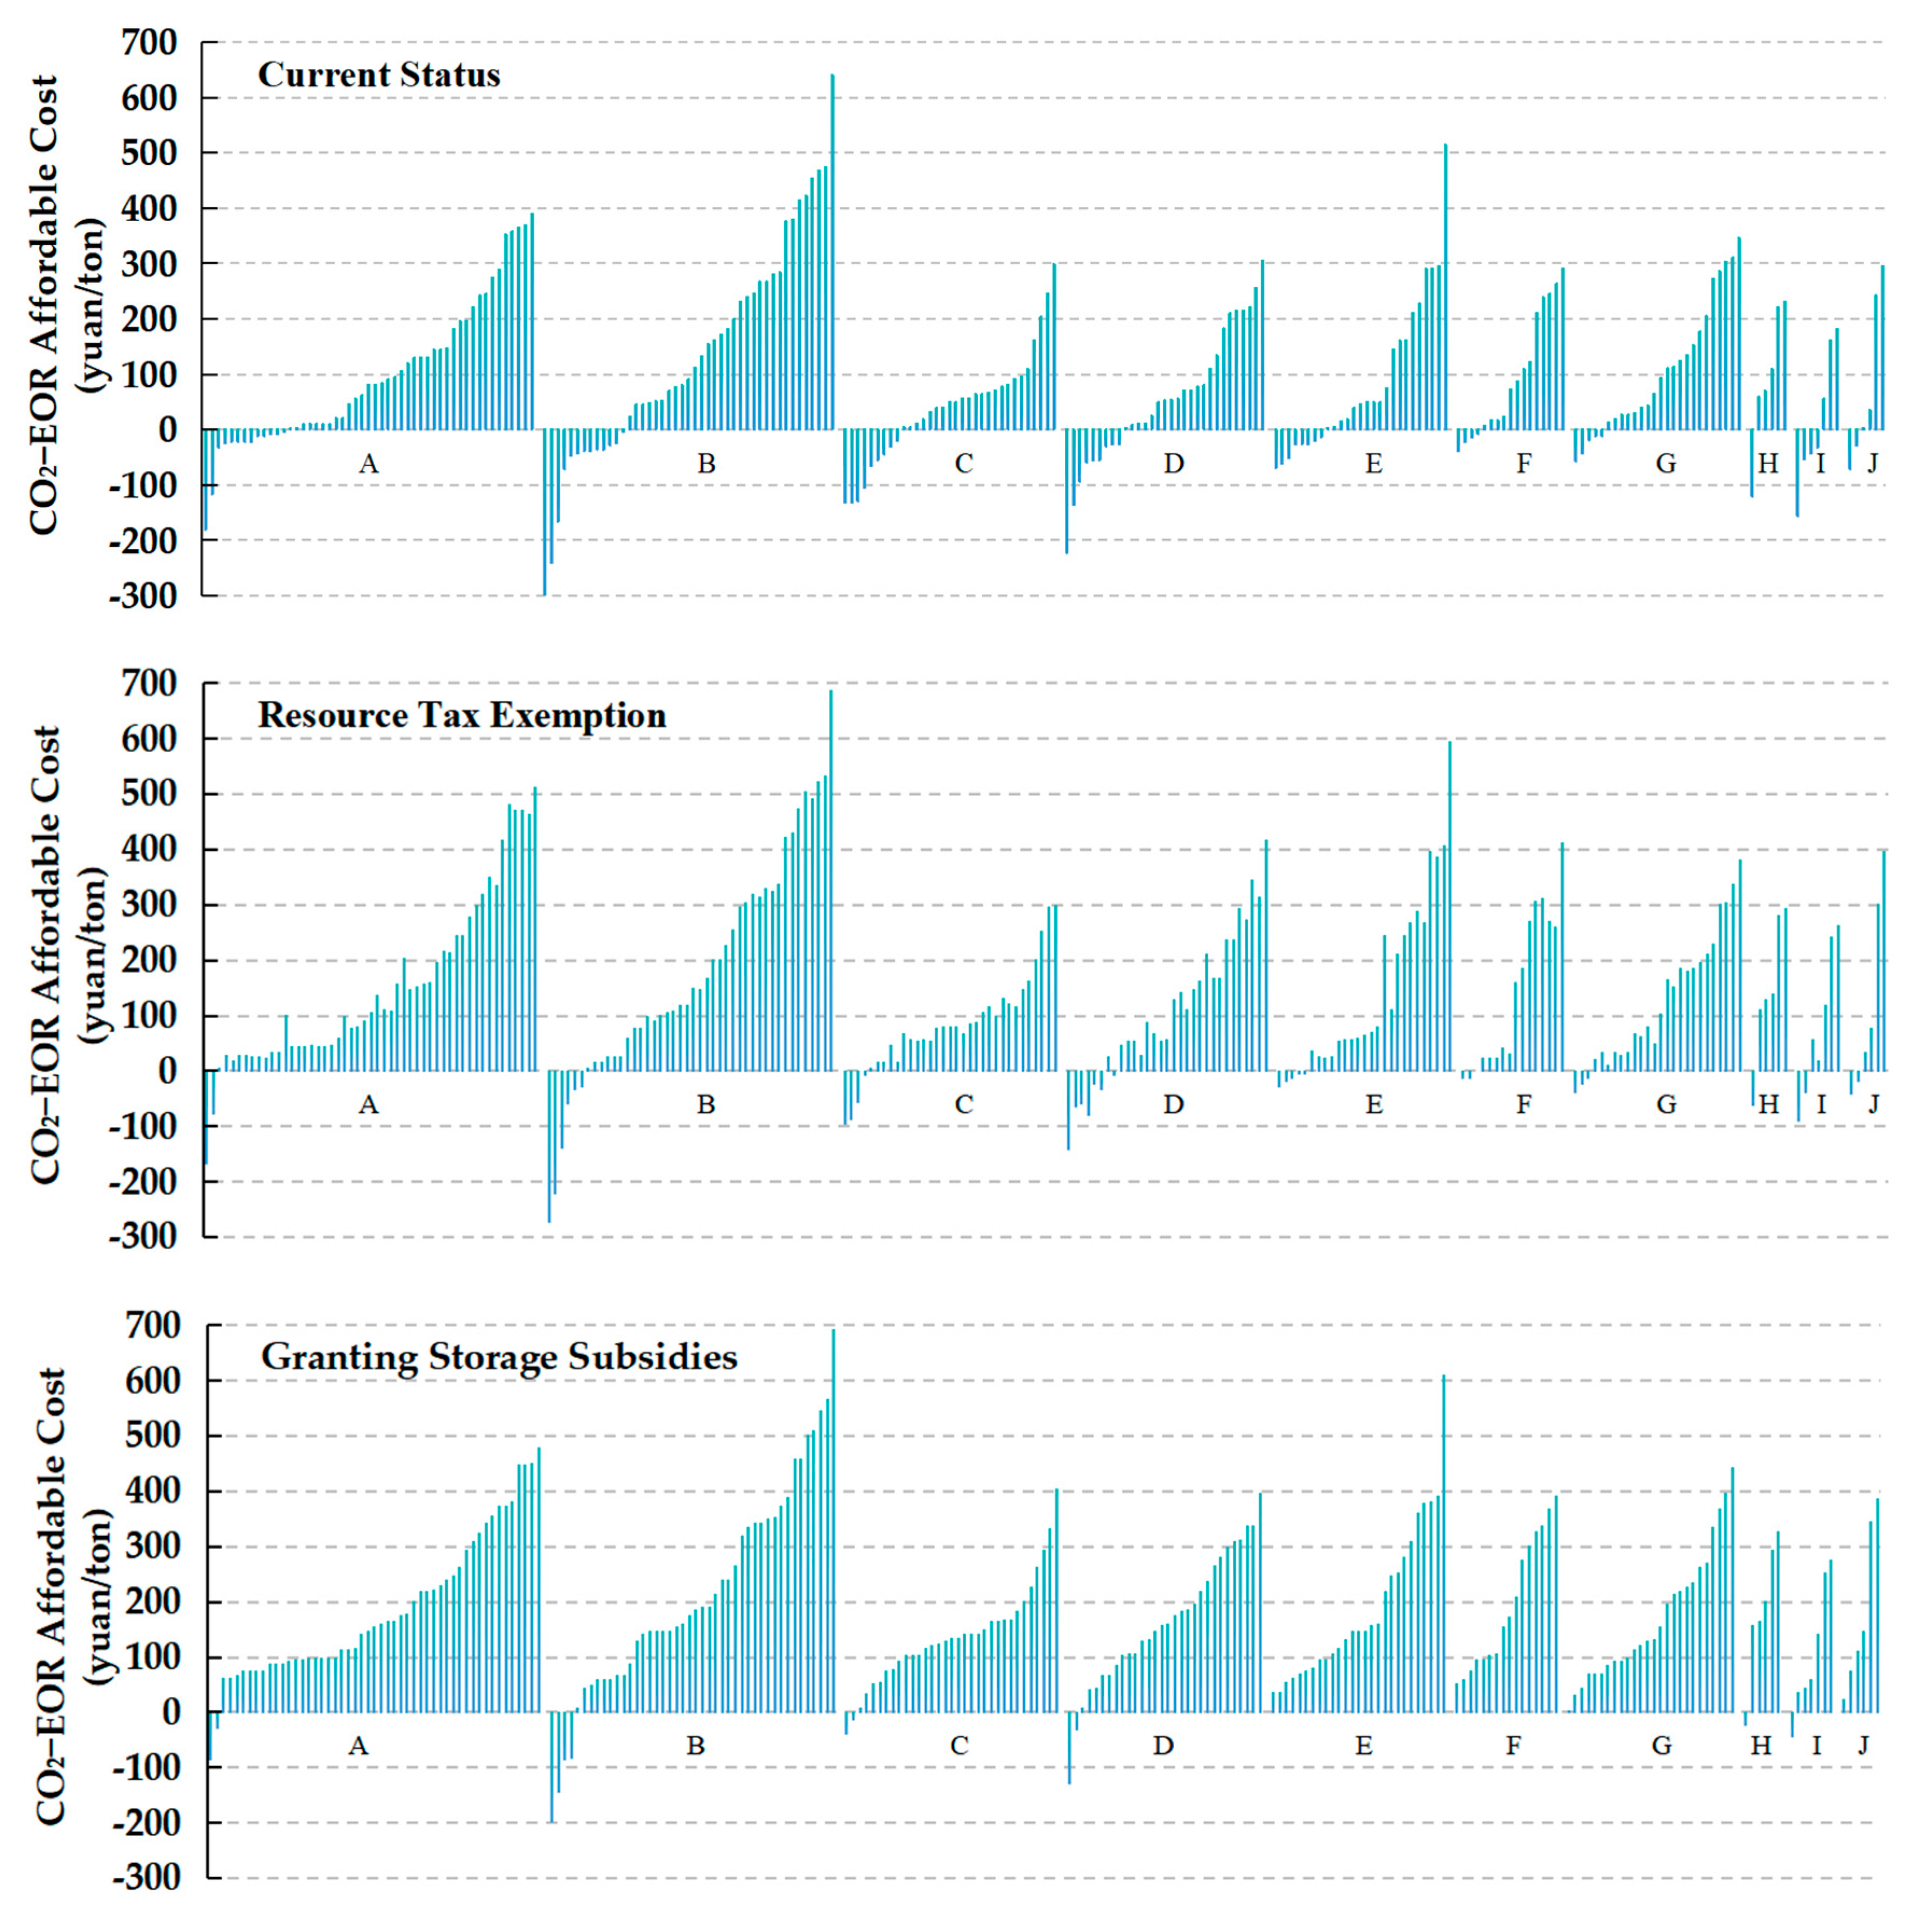
4.3. CO2-EOR Affordable Cost Limit

For the 10 oil regions mentioned above, the CO2-EOR affordable cost limits were calculated. The conditions used for the calculation are as follows: the oil price is USD 60/barrel, the value-added tax is 17%, the urban construction tax is 7%, the education surcharge is 3%, the resource preferential tax is 0.035%, the income tax is 25%, the discount rate is 12%, the special profit fee threshold is priced at USD 65/barrel of oil, and the tax rate is 20–40%. A five-level progressive ad valorem rate was implemented, and the depreciation period is 10 years.
The CO2 price affordability of CO2-EOR projects in various oil regions varies greatly due to different development factors, such as oilfield production, production decline rate, and burial depth. Around 28% of the projects have no affordable capacity. Around 50% of the projects have a certain affordable capacity (less than 200 CNY/ton). Only around 19% of the projects can bear the source cost of more than 200 CNY/ton (Table 4).
In order to study the influencing factors of the CO2-EOR affordable cost, this study calculated the CO2-EOR affordable cost according to different oil prices, storage subsidies and other factors and compared their influence. The oil prices were assumed to be USD 40/barrel, USD 50/barrel, USD 60/barrel, USD 70/barrel, USD 80/barrel, USD 90/barrel, and USD 100/barrel. The preferential policies were assumed to be 0 or USD 15/ton storage subsidy, equal to either nothing or a resource tax exemption.
Figure 9 shows the variation curves of the cost of CO2 sources that can be afforded by different projects in Oil Region B at different oil prices. It can be seen from the results that rising oil prices can increase income, thereby increasing CO2-EOR affordable costs. For projects with a certain tolerance of CO2 source costs (that is, the CO2-EOR affordable cost is greater than zero), when the oil price increases by USD 10/barrel, the affordable cost will increase by 12–92 CNY/ton. Projects with higher tolerances of CO2 source costs have greater growth rates. For the same project, the growth rate is relatively large if the oil price is below USD 65/barrel. If the oil price is above USD 65/barrel, the growth rate reduces due to the need to pay the special profit fee.
Figure 10 is a comparison chart of the CO2-EOR affordable cost of each project in the 10 oil regions under the current conditions, including the conditions of exempting resource tax and granting storage subsidies. It can be seen that resource taxes and storage subsidies have a significant impact on the CO2-EOR affordable costs, and the number of projects without affordable capacity is reduced. When the oil price is USD 60/barrel, the average affordable costs of the 10 oil regions under the three conditions are 69 CNY/ton, 121 CNY/ton, and 167 CNY/ton, respectively.

4.4. Possible Ways to Fill the Gap

From the above analysis, it can be seen that the cost tolerance of most projects for CO2- EOR is lower than the CO2 source cost, and the gap between them needs to be filled via technology, policy, and market solutions in order to promote and achieve the sustainable development of CCUS. As Table 5 shows, this situation can be gradually improved through two ways, as described below [38,39,40].
The first way is reducing CO2 source costs. This mainly refers to the capture cost at the emission point. If the CO2 capture cost is reduced by 20–30%, the number of economically feasible projects increases from 19% to 25–29%. Especially for projects with low concentration and high capture cost, its effect on the increase in economically feasible projects in oilfields is obvious.
The second way is striving for preferential policies in the storage sector. By reducing or exempting resource tax or granting certain subsidies for storage, the development scale of national CCUS can be greatly increased. Especially when the oil price is low, the impact is more significant. Moreover, for some oil regions, it is necessary to rely on policy support. For example, when resource tax exemption and storage subsidies are granted, the number of economically viable fields with cost differentials greater than zero can be increased from 19% to 32% and 43%, respectively.
If the reduction in CO2 source cost and the preferential policy of exempting resource tax or granting subsidies for burial storage can be achieved at the same time, the dual effect of the two will be able to substantially reduce the cost gap and make the number of economically viable projects increase relatively significantly, which is expected to increase the number of economically viable oilfields from the original 20% or so to 38% and more than half of the number of projects, respectively.

5. CCUS Resource Optimization Allocation and Strategic Planning

5.1. Resource Allocation Optimization Model

CCUS is a multi-disciplinary industry, involving technology, the economy, the environment, society, etc. The development of CCUS projects requires overall planning. It is necessary to carry out effective resource optimization and allocation. In this study, a mathematical programming method is used to establish an optimization model to solve problems.
The resource allocation optimization model includes objective functions and constraint equations. The basic mathematical model is
min max     f x , y The   lowest   cost   CO 2   source The   most   CO 2 EOR   benefits The   largest   amount   of   CO 2   storage The   largest   CO 2 EOR   oil   increase
s . t .     g x , y N o d e   m a t e r i a l   b a l a n c e P i p e   o n e w a y   f l o w   r e s t r i c t i o n T h e   a m o u n t   o f   c a p t u r e   l i m i t T h e   a m o u n t   o f   s t o r a g e   l i m i t E c o n o m i c   c o n s t r a i n t s
where f is the objective function, g is the constraint condition, x is the continuous variable, and y is the 0, 1 binary variable.
One of the above objective functions can be selected according to the needs of the problem and combined with the constraint equations to form an optimization model.

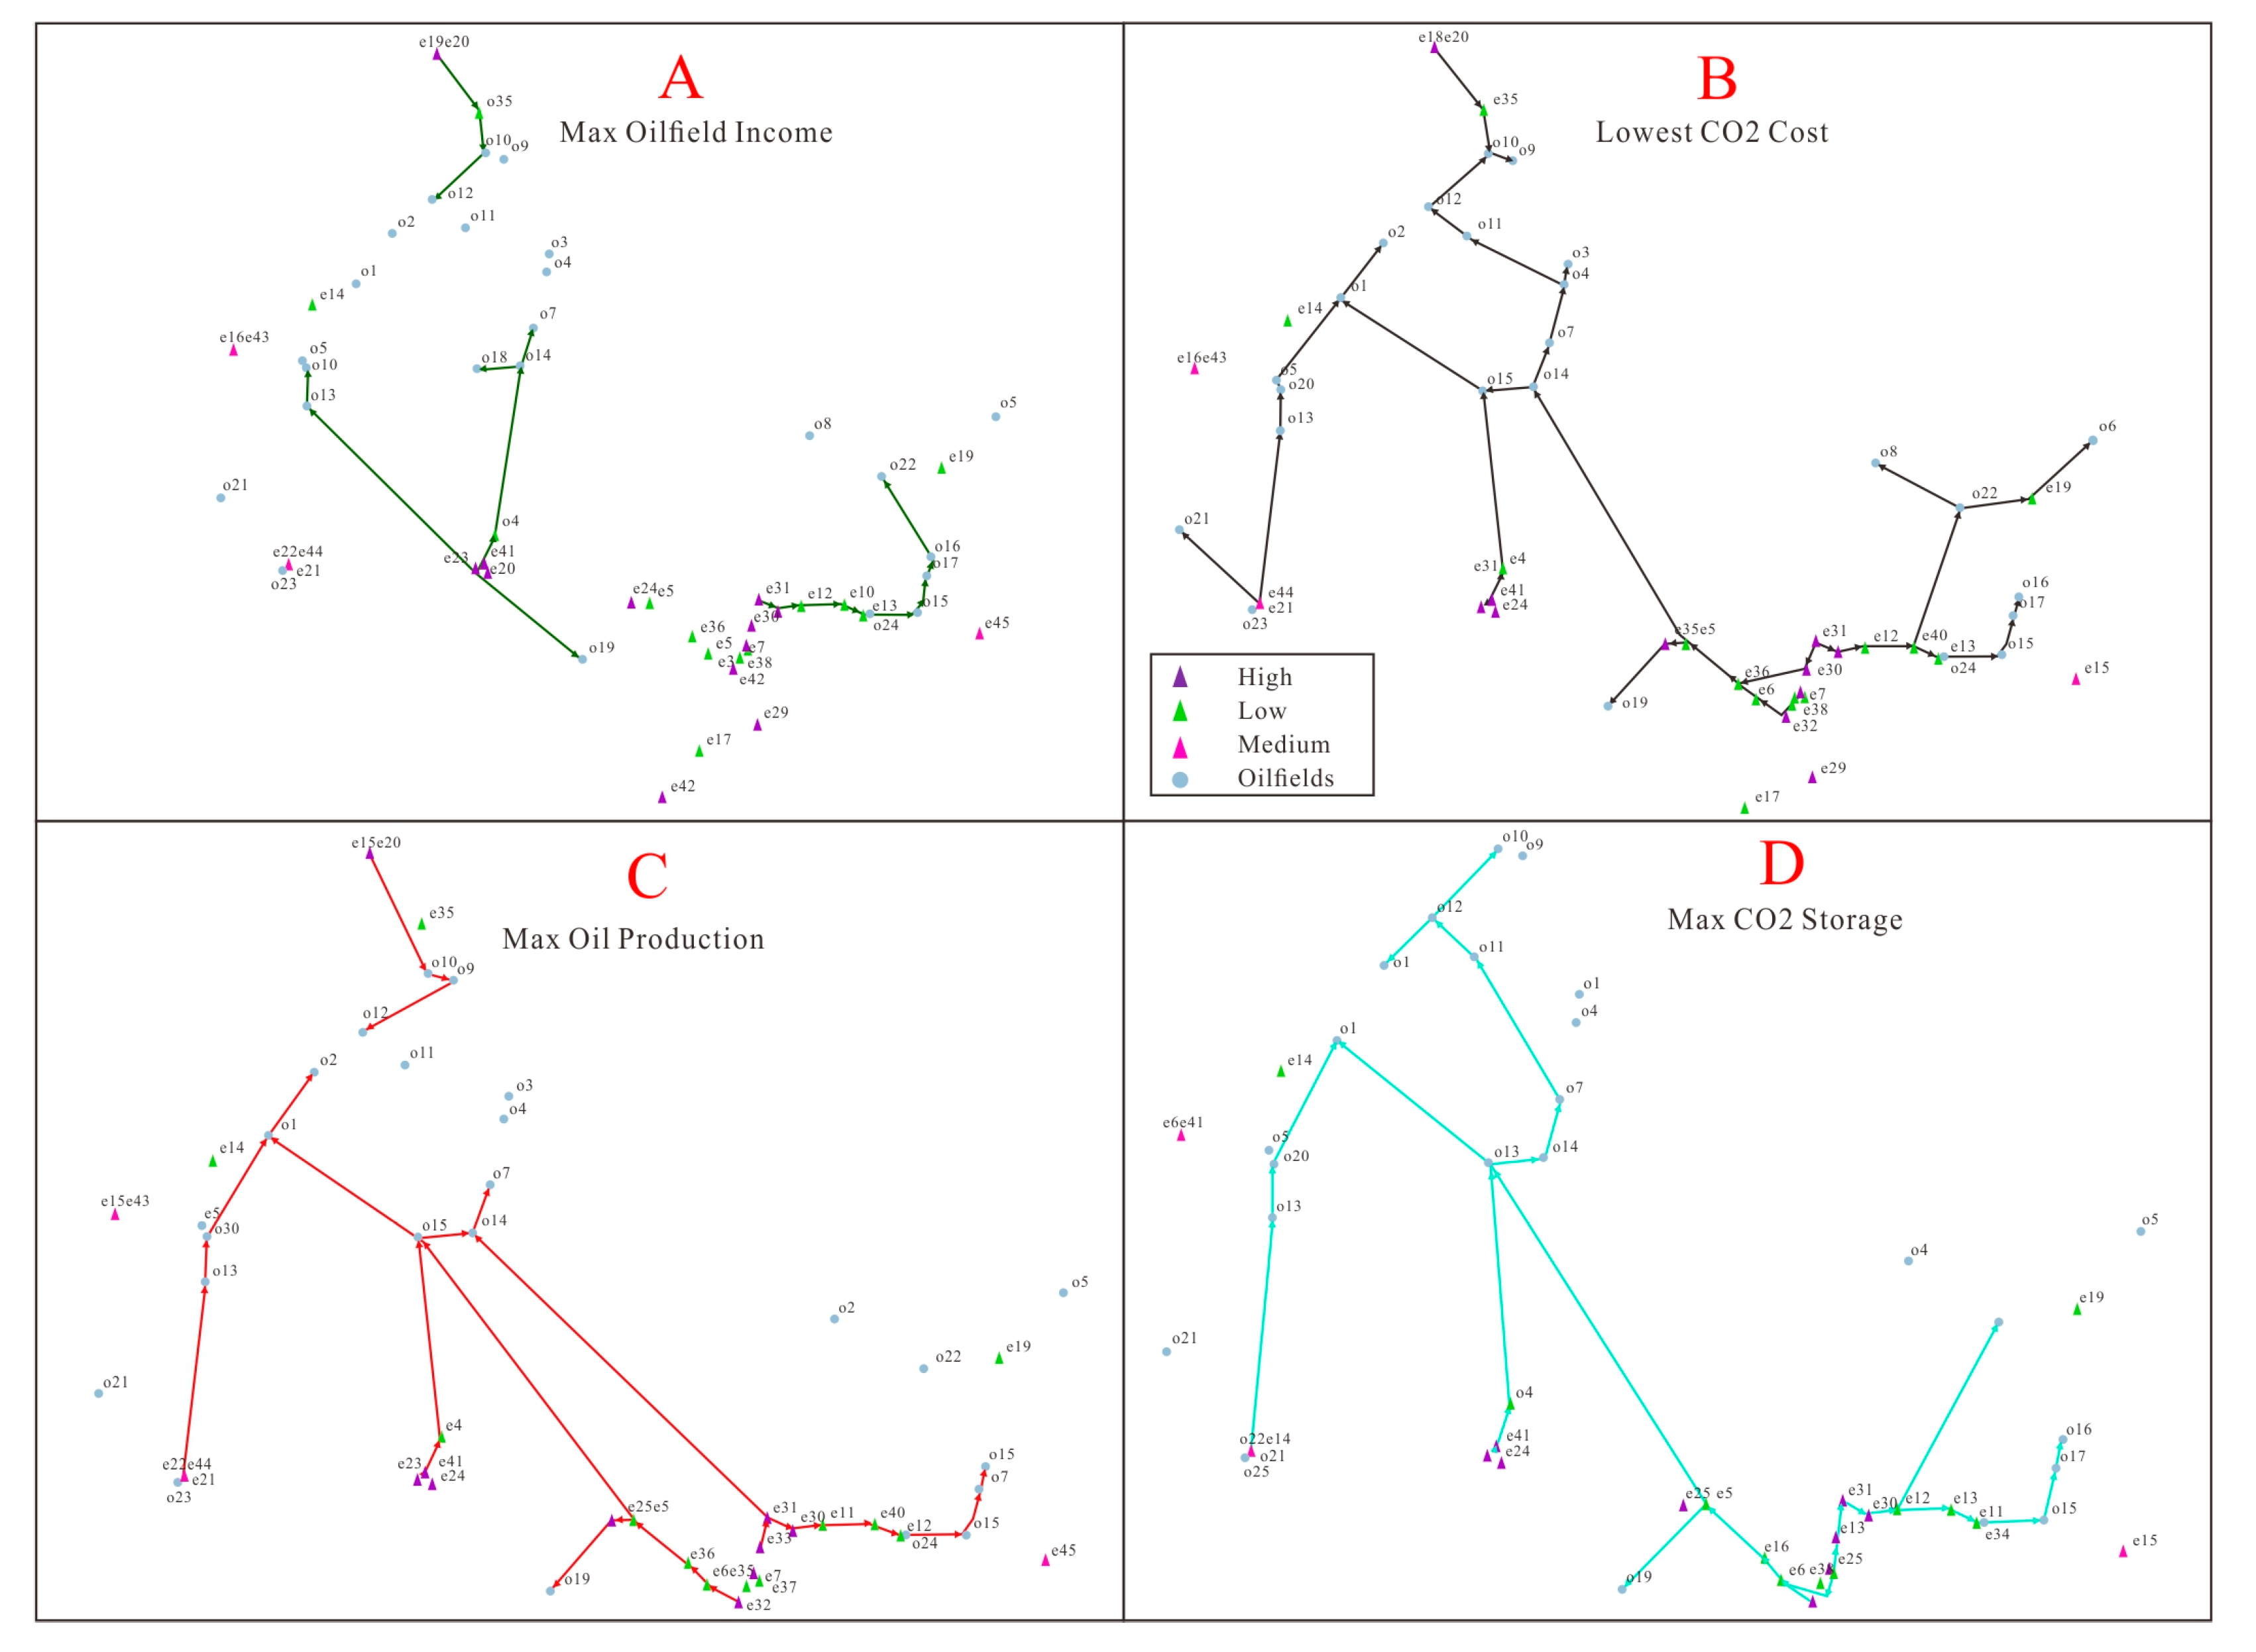
5.2. Result of Optimal Allocation of Resources

Figure 11 shows the results of the optimized allocation for pursuing the lowest cost of CO2 sources in different oil regions. For the allocation of demand–supply resources involving spatial distribution, it is necessary to consider the transportation path between the supply source and the demand point, establish an optimization model, and solve the problem of which supply path can minimize the source cost under the premise of meeting the demand. Table 6 shows the number of preferred emission sources, annual capture, and cumulative storage in different oil regions.
The CCUS industrial chain is composed of three components: the capture, transportation, and storage of emission sources. In addition to the technical and economic problems of the three components, the industry must consider the economic, social, and environmental benefits brought about by the whole industrial chain. Figure 12 shows the source–sink allocation paths established with different planning scenarios in Oil Region G. Among them, 12-A is the result of source–sink allocation with the objective of maximizing oilfield income; 12-B is the result of source–sink allocation with the objective of minimizing CO2 source cost; 12-C is the result of source–sink allocation with the objective of maximizing oil production; and 12-D is the result of source–sink allocation with the objective of maximizing CO2 storage.

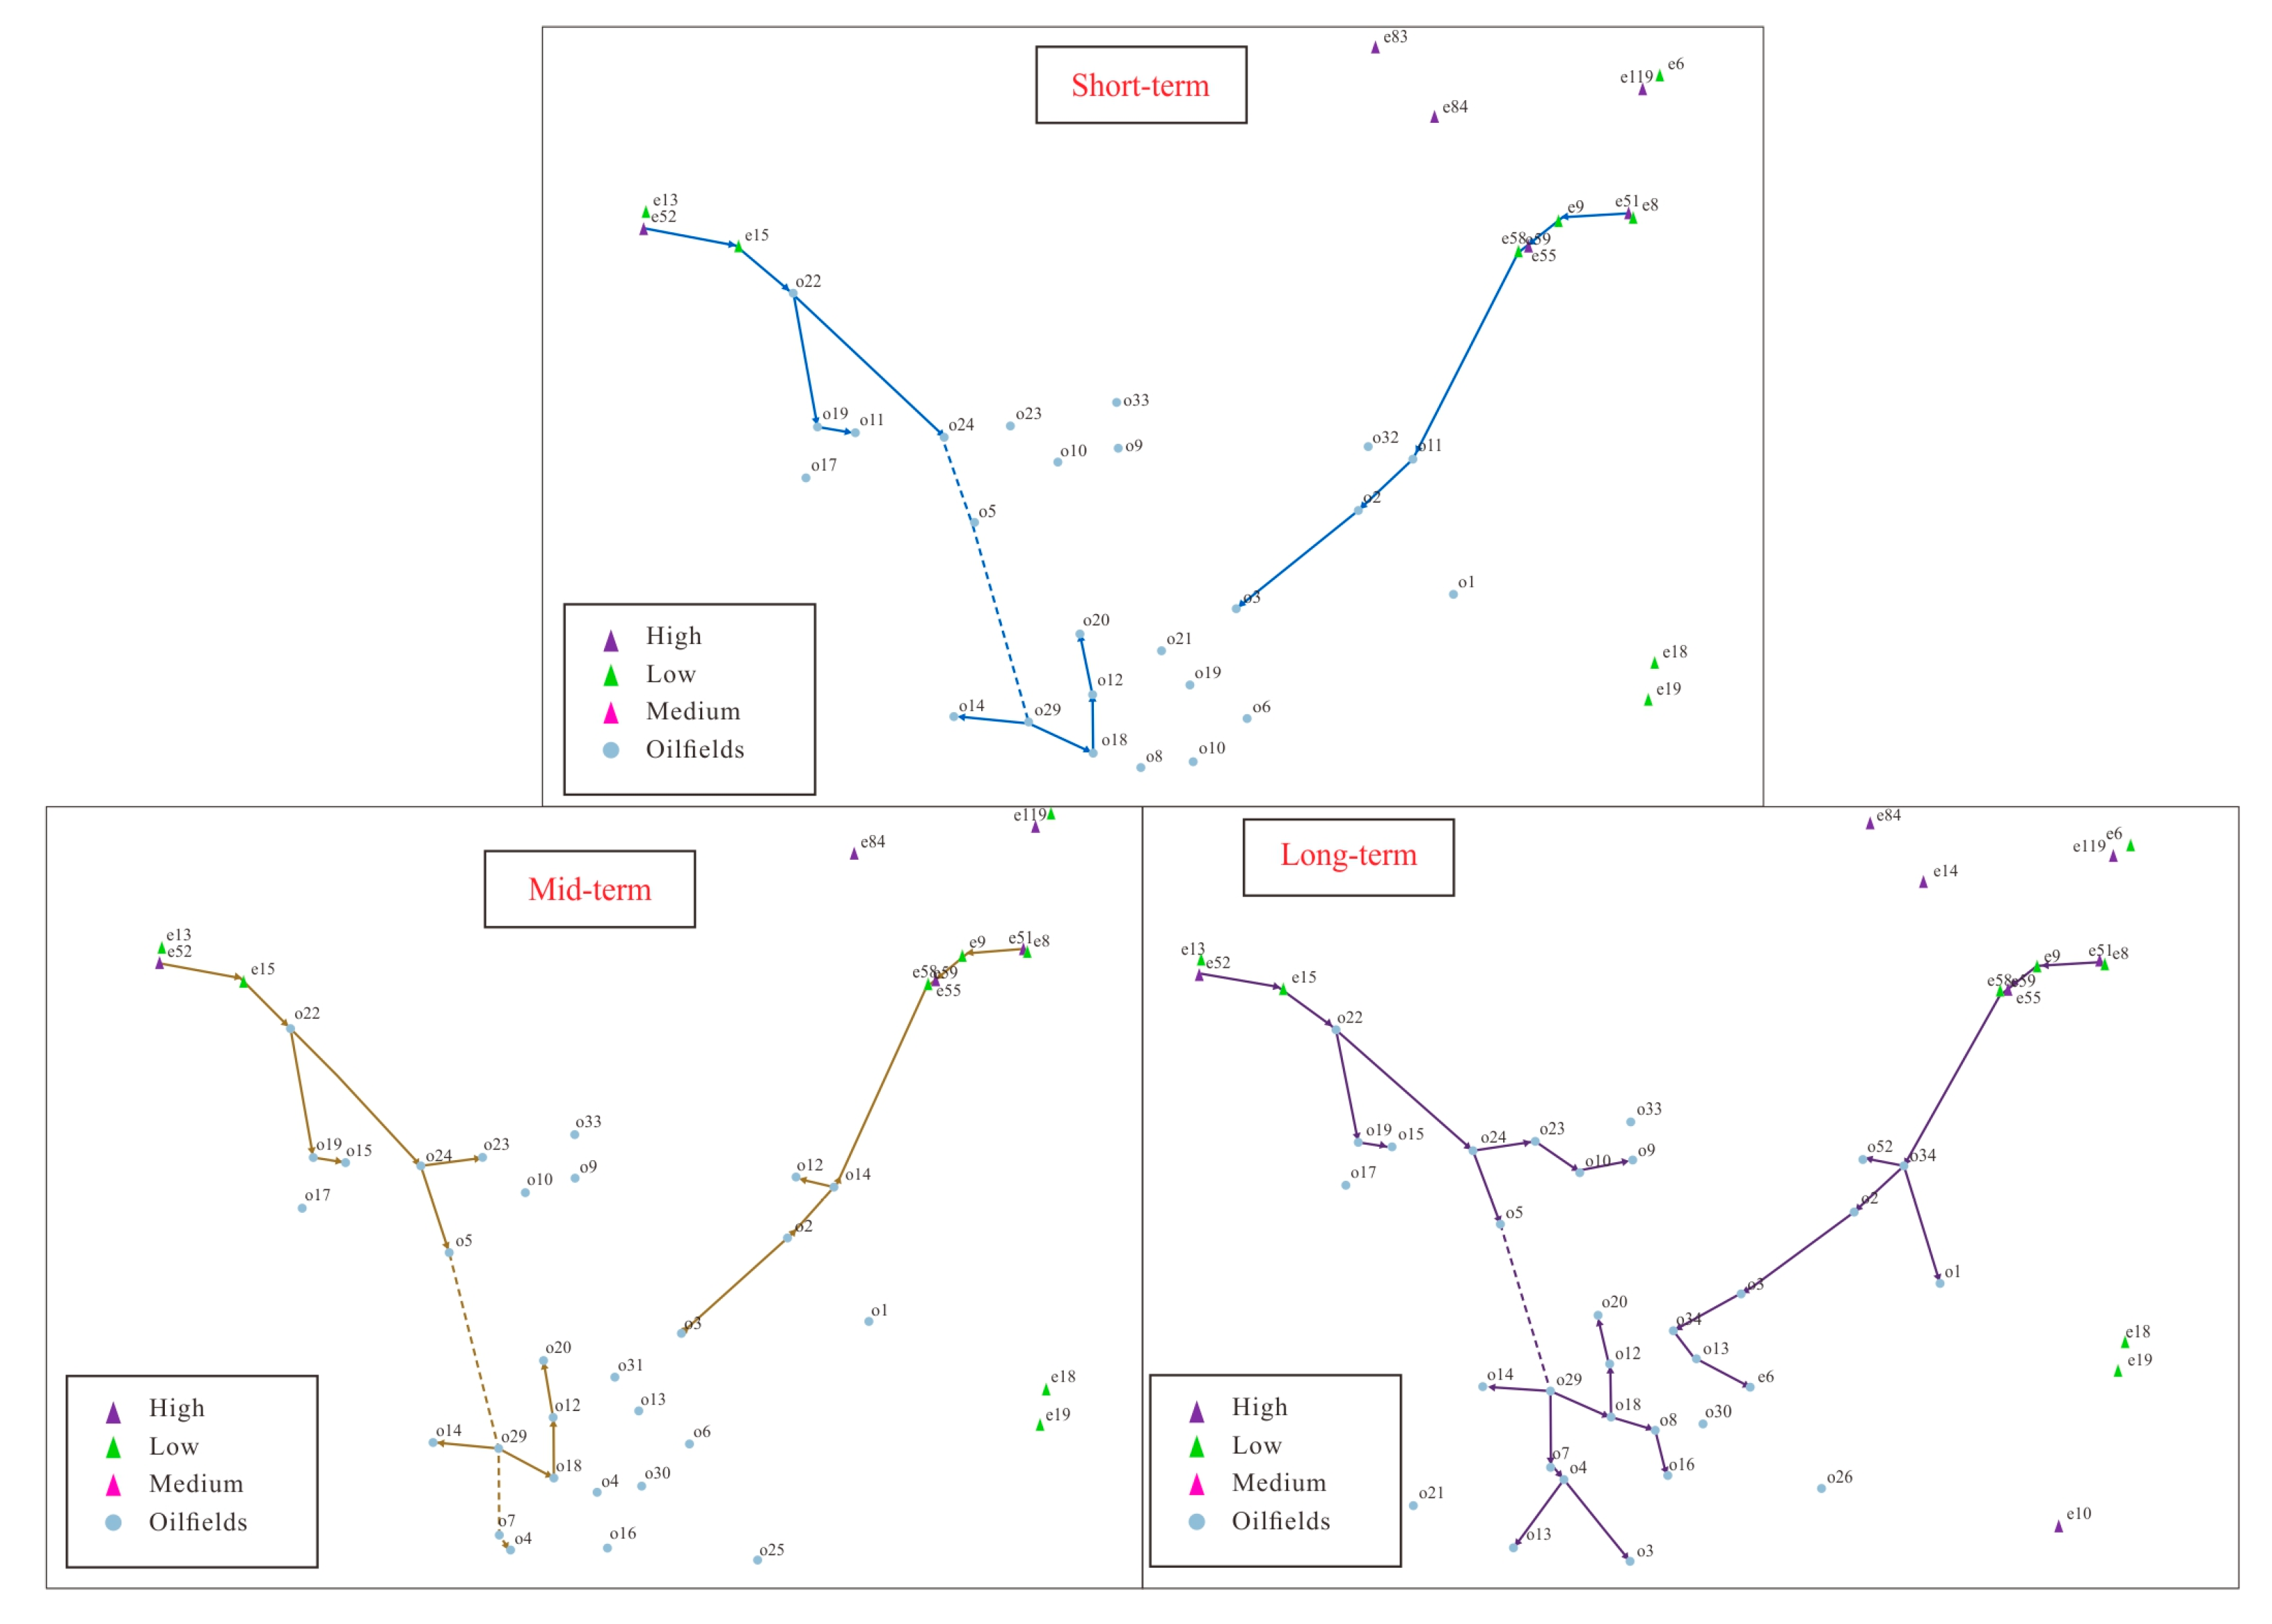
5.3. CCUS Strategic Planning Design

Strategic planning is often developed in a highly uncertain environment, since no base case can be assumed to necessarily occur. Therefore, planning needs to be based on assumptions and requires intense attention to the various potential drivers of uncertainty.
As shown in Figure 13, according to research on technology development, policy, carbon pricing, and the way to break the bottleneck of CCUS cost, a strategic planning design was carried out based on the three phases of industrial development: a short-term, medium-term, and long-term scenario.
Assuming the oil price is USD 60/barrel and taking Oil Region C as an example, the short-term plan was devised under the conditions of the current source cost level and fiscal and taxation policies. Considering the allocation of sources and sinks in the mid- and long-term, we established an optimization model with the goal of maximizing oilfield benefits and with the constraint that the oilfield affordable cost is greater than or equal to the existing source cost. The path of optimal allocation is shown in Figure 14. Short-term, eight projects are enabled, and 16 million tons of CO2 can be stored cumulatively during the development period, with an increase of 12.65 million tons of oil (Figure 15).
The mid-term source–sink allocation was devised under the conditions of resource tax exemption and a 20% reduction in source cost due to improvements in CO2 capture technology. With the goal of maximizing oilfield revenue, the optimization model was established under the constraint that the oilfield affordable cost is greater than or equal to the existing source cost. The path of optimal allocation is shown in Figure 14. Mid-term, 19 projects are enabled, and 249 million tons of CO2 can be stored cumulatively during the development period, with an increase of 142 million tons of oil (Figure 15).
For long-term source–sink allocation, a USD 15/ton storage subsidy will be given to the CO2- EOR and storage project. As the industry enters a mature commercialization stage and CO2 capture technology improves, the source cost reduces by 30% compared to the demonstration phase. With the goal of maximizing oilfield revenue, the optimization model was established under the constraint that the oilfield affordable cost is greater than or equal to the existing source cost. The path of optimal long-term allocation is shown in Figure 14. In the long term, 25 projects are enabled, and 361 million tons of CO2 can be stored cumulatively during the development period, with an increase of 210 million tons of oil (Figure 15).

6. Conclusions

The development of carbon capture, utilization, and storage (CCUS) technology is crucial for addressing global climate change and achieving carbon neutrality. This paper has provided a comprehensive analysis of the current status, cost limits, and strategic planning for CCUS in China, focusing on the integration of CO2 capture, transportation, and storage, particularly in the context of EOR. The findings highlight several key insights and recommendations for the future development of CCUS in China.
China’s CCUS industry is still in the early stages of development, with most projects focusing on CO2 utilization rather than full chain integration. The scale of CCUS projects in China is relatively small compared to international standards, and the industry faces significant cost challenges, particularly in capturing CO2 from low-concentration sources such as power plants, cement, and steel industries. The cost of CO2 capture, compression, and transportation remains a major barrier to the widespread adoption of CCUS technologies.
The affordability of CO2-EOR varies significantly across different oil regions in China. While some regions, such as those with high-concentration CO2 sources, can achieve relatively low capture costs, others, particularly those with low-concentration sources, face higher costs that exceed the economic feasibility of CO2-EOR. The analysis shows that only a small percentage of projects can currently bear the source costs, with many requiring significant cost reductions or policy support to become economically viable.
To bridge the cost gap, reducing CO2 capture costs through technological advancements and implementing preferential policies such as resource tax exemptions and storage subsidies are needed. These measures could significantly increase the number of economically feasible projects, particularly in regions where CO2 capture costs are high. Additionally, rising oil prices could improve the affordability of CO2-EOR, but the impact is limited by the need to pay special profit fees when oil prices exceed certain thresholds.
A strategic planning framework for CCUS development in China, divided into short-term, mid-term, and long-term phases, is presented. In the short term, the focus should be on optimizing resource allocation and enabling projects with the lowest source costs. In the medium term, improvements in capture technology and policy support, such as resource tax exemptions, could enable more projects. In the long term, with further technological advancements and storage subsidies, CCUS could achieve large-scale commercialization, significantly increasing CO2 storage and oil production.
While the CCUS industry in China faces significant challenges, particularly in terms of cost and technological maturity, the potential benefits in terms of carbon reduction and enhanced oil recovery are substantial. With the right combination of technological innovation, policy support, and strategic planning, CCUS can play a critical role in China’s transition to a low-carbon economy and contribute to global efforts to mitigate climate change.

Author Contributions

Conceptualization, R.B. and M.H.; methodology, Y.L. and R.B.; validation, Y.L.; writing—original draft preparation, M.H.; writing—review and editing, R.B. All authors have read and agreed to the published version of the manuscript.

Funding

This research received no external funding.

Data Availability Statement

Dataset available on request from the authors.

Conflicts of Interest

Authors Mingqiang Hao, Ran Bi and Yang Liu were employed by the company PetroChina Research Institute of Petroleum Exploration and Development.

Nomenclature

CCUSCarbon capture, utilization, and storage
CCSCarbon capture and storage
EOREnhanced oil recovery
CO2Carbon dioxide
CO2-EOREnhanced oil recovery by carbon dioxide flooding
CUCapture and utilization
CTUSCapture, transport, utilization, and storage
CTSCapture, transport, and storage
ECO2Carbon dioxide emission (ton CO2 year−1)
EFCarbon dioxide emission factor (ton CO2/ton product)
PProduct output (ton product year−1)
PCProduct annual production capacity (ton product year−1)
aCapacity utilization factor
TAverage utilization time of equipment (hours)
fObjective function
gConstraint condition
xContinuous variable
y0, 1 binary variable

References

  1. Calvillo, C.; Race, J.; Chang, E.; Turner, K.; Katris, A. Characterisation of UK Industrial Clusters and Techno-Economic Cost Assessment for Carbon Dioxide Transport and Storage Implementation. Int. J. Greenh. Gas Control 2022, 119 (Suppl. C), 103695. [Google Scholar] [CrossRef]
  2. Hanson, E.; Nwakile, C.; Hammed, V.O. Carbon capture, utilization, and storage (CCUS) technologies: Evaluating the effectiveness of advanced CCUS solutions for reducing CO2 emissions. Results Surf. Interfaces 2025, 18, 100381. [Google Scholar] [CrossRef]
  3. HU, Y.; HAO, M.; CHEN, G.; SUN, R.; LI, S. Technologies and practice of CO2 flooding and sequestration in China. Pet. Explor. Dev. 2019, 46, 753–766. [Google Scholar] [CrossRef]
  4. Liu, Y.; Hao, M.; Bi, R.; Bian, C.; Wang, X. Research on Gas Channeling Identification Using the Fuzzy Comprehensive Evaluation Method. Energies 2024, 17, 3908. [Google Scholar] [CrossRef]
  5. Zhao, X.; Liao, X.; Wang, W.; Chen, C.; Rui, Z.; Wang, H. The CO2 storage capacity evaluation: Methodology and determination of key factors. J. Energy Inst. 2014, 87, 297–305. [Google Scholar] [CrossRef]
  6. Kovscek, A.R. Screening criteria for CO2 storage in oil reservoirs. Pet. Sci. Technol. 2002, 20, 841–866. [Google Scholar] [CrossRef]
  7. Malik, Q.M.; Islam, M.R. CO2 Injection in the Weyburn Field of Canada: Optimization of Enhanced Oil Recovery and Greenhouse Gas Storage with Horizontal Wells. Soc. Pet. Eng. J. 2000, SPE-59327-MS. [Google Scholar] [CrossRef]
  8. Zhao, X.; Liao, X. Evaluation Method of CO2 Sequestration and Enhanced Oil Recovery in an Oil Reservoir, as Applied to the Changqing Oilfields, China. Energy Fuels 2012, 26, 5350–5354. [Google Scholar] [CrossRef]
  9. Edwards, K. CO in Alberta-A Vision of the Future. J. Can. Pet. Technol. 2000, 39, 9. [Google Scholar] [CrossRef]
  10. Bachu, S.; Shaw, J. Evaluation of the CO2 Sequestration Capacity in Alberta’s Oil and Gas Reservoirs at Depletion and the Effect of Underlying Aquifers. J. Can. Pet. Technol. 2003, 42, 51–61. [Google Scholar] [CrossRef]
  11. Agency, I.E. CCUS in Clean Energy Transitions. 2020. Available online: https://www.iea.org/reports/ccus-in-clean-energy-transitions (accessed on 19 November 2024).
  12. Holtz, M.H.; Nance, P.K.; Finley, R.J. Reduction of Greenhouse Gas Emissions through CO2 EOR in Texas. Environ. Geosci. 2001, 8, 187–199. [Google Scholar] [CrossRef]
  13. Miao, L.; Feng, L.; Ma, Y. Comprehensive evaluation of CCUS technology: A case study of China’s first million-tonne CCUS-EOR project. Environ. Impact Assess. Rev. 2025, 110, 107684. [Google Scholar] [CrossRef]
  14. Zhang, Z.; Wang, T.; Blunt, M.J.; Anthony, E.J.; Park, A.-H.A.; Hughes, R.W.; Webley, P.A.; Yan, J. Advances in carbon capture, utilization and storage. Appl. Energy 2020, 278, 115627. [Google Scholar] [CrossRef]
  15. Cao, C.; Hou, M.Z.; Zhang, L.; Zhao, Y.; Liu, H. Advances in Carbon Capture, Utilization and Storage (CCUS). Energies 2024, 17, 4784. [Google Scholar] [CrossRef]
  16. Phillips, C.; Haghighi, H. Industry Guidelines for Setting the CO2 Specification in CCUS Chains. In Proceedings of the ADIPEC, Abu Dhabi, United Arab Emirates, 3–6 November 2024; p. 222455. [Google Scholar]
  17. Sahak, M.Z.M.; Zain, M.M.; Alias, A.; Zulkifli, M.Y.; Rohani, S.N.; Rostani, K. Establishing Key Process Design Considerations for Carbon Capture, Utilization and Storage (CCUS) Towards Decarbonization of Existing Assets Operations. In Proceedings of the ADIPEC, Abu Dhabi, United Arab Emirates, 4–7 November 2024; p. 221884. [Google Scholar]
  18. Mon, M.T.; Tansuchat, R.; Yamaka, W. CCUS Technology and Carbon Emissions: Evidence from the United States. Energies 2024, 17, 1748. [Google Scholar] [CrossRef]
  19. Aydin, G.; Karakurt, I.; Aydiner, K. Evaluation of geologic storage options of CO2: Applicability, cost, storage capacity and safety-ScienceDirect. Energy Policy 2010, 38, 5072–5080. [Google Scholar] [CrossRef]
  20. Carpenter, C. Study Examines Economics of CCUS Projects in Conjunction with Large offshore Gas Projects. J. Pet. Technol. 2024, 76, 66–69. [Google Scholar] [CrossRef]
  21. Benz, E.; Trück, S. Modeling the price dynamics of CO2 emission allowances. Energy Econ. 2009, 31, 4–15. [Google Scholar] [CrossRef]
  22. Zou, C.; Wu, S.; Yang, Z.; Pan, S.; Wang, G.; Jiang, X.; Guan, M.; Yu, C.; Yu, Z.; Shen, Y. Progress, challenge and significance of building a carbon industry system in the context of carbon neutrality strategy. Petroleum Explor. Dev. 2023, 50, 210–228. [Google Scholar] [CrossRef]
  23. Mccoy, S.T.; Rubin, E.S. An engineering-economic model of pipeline transport of CO2 with application to carbon capture and storage. Int. J. Greenh. Gas Control 2008, 2, 219–229. [Google Scholar] [CrossRef]
  24. Rui, Z.; Zeng, L.; Dindoruk, B. Challenges in the Large-Scale Deployment of CCUS. Engineering 2024, 44, 17–20. [Google Scholar] [CrossRef]
  25. Shiyi, Y.; Desheng, M.; Junshi, L.; Tiyao, Z.; Zemin, J.; Haishui, H. Progress and prospects of carbon dioxide capture, EOR-utilization and storage industrialization. Pet. Explor. Dev. 2022, 49, 955–962. [Google Scholar]
  26. Middleton, R.S.; Bielicki, J.M. A scalable infrastructure model for carbon capture and storage: SimCCS. Energy Policy 2009, 37, 1052–1060. [Google Scholar] [CrossRef]
  27. Song, X.; Wang, F.; Ma, D.; Gao, M.; Zhang, Y. Progress and prospect of carbon dioxide capture, utilization and storage in CNPC oilfields. Pet. Explor. Dev. 2023, 50, 229–244. [Google Scholar] [CrossRef]
  28. Han, J.-H.; Lee, I.-B. Development of a Scalable and Comprehensive Infrastructure Model for Carbon Dioxide Utilization and Disposal. Ind. Eng. Chem. Res. 2011, 50, 6297–6315. [Google Scholar] [CrossRef]
  29. Kemp, A.G.; Kasim, S. A Futuristic Least-cost Optimisation Model of CO2 Transportation and Storage in the UK/UK Continental Shelf. Energy Policy 2009, 38, 3652–3667. [Google Scholar] [CrossRef]
  30. Klokk; Schreiner, P.F.; Pages-Bemaus, A.; Tomasgard, A. Optimizing a CO2 value chain for the Norwegian Continental Shelf. Energy Policy 2010, 38, 6604–6614. [Google Scholar] [CrossRef]
  31. Davison, J. Performance and costs of power plants with capture and storage of CO2. Energy 2007, 32, 1163–1176. [Google Scholar] [CrossRef]
  32. Rubin, E.S.; Chen, C.; Rao, A.B. Cost and performance of fossil fuel power plants with CO2 capture and storage. Energy Policy 2007, 35, 4444–4454. [Google Scholar] [CrossRef]
  33. Vulin, D.; Močilac, I.K.; Jukić, L.; Arnaut, M.; Vodopić, F.; Saftić, B.; Sedlar, D.K.; Cvetković, M. Development of CCUS clusters in Croatia. Int. J. Greenh. Gas Control 2023, 124 (Suppl. C), 103857. [Google Scholar] [CrossRef]
  34. Wang, F.; Liao, G.; Su, C.; Wang, F.; Ma, J.; Yang, Y. Carbon emission reduction accounting method for a CCUS-EOR project. Pet. Explor. Dev. 2023, 50, 989–1000. [Google Scholar] [CrossRef]
  35. Gaspar, A.T.F.S.; Lima, G.A.C.; Suslick, S.B. CO2 Capture and Storage in Mature Oil Reservoir: Physical Description, EOR and Economic Valuation of a Case of a Brazilian Mature Field. In Proceedings of the SPE Europec/EAGE Annual Conference, Madrid, Spain, 13–16 June 2005. [Google Scholar]
  36. Mccollum, D.L.; Ogden, J.M. Techno-Economic Models for Carbon Dioxide Compression, Transport, and Storage & Correlations for Estimating Carbon Dioxide Density and Viscosit; Working Paper Series; Institute of Transportation Studies: Davis, CA, USA, 2006. [Google Scholar]
  37. Rubin, E.S.; Yeh, S.; Antes, M.; Berkenpas, M.; Davison, J. Use of experience curves to estimate the future cost of power plants with CO2 capture. Int. J. Green House Gas Control 2007, 1, 188–197. [Google Scholar] [CrossRef]
  38. Stalkup, F.I. Carbon Dioxide Miscible Flooding: Past, Present, and Outlook for the Future. J. Pet. Technol. 1978, 30, 1102–1112. [Google Scholar] [CrossRef]
  39. Zhao, X.; Xiao, J.; Hou, J.; Wu, J.; Lyu, X.; Zhang, J.; Liu, Y. Economic and scale prediction of CO2 capture, utilization and storage technologies in China. Pet. Explor. Dev. 2023, 50, 751–764. [Google Scholar] [CrossRef]
  40. Zhou, J.; Chen, Z.; Wu, S.; Yang, C.; Wang, Y.; Wu, Y. Potential assessment and development obstacle analysis of CCUS layout in China: A combined interpretive model based on GIS-DEMATEL-ISM. Energy 2024, 310, 133225. [Google Scholar] [CrossRef]
Figure 1. Emissions from major CO2 emission sources (in this investigation) in China.
Processes 13 00905 g001
Figure 2. Statistical distribution of CO2 emissions of enterprises in the eight mentioned industries in China.
Processes 13 00905 g002
Figure 3. Distribution map of CO2 emission sources in China.
Processes 13 00905 g003
Figure 4. Distribution map of low-concentration emission sources in China.
Processes 13 00905 g004
Figure 5. Distribution map of high-concentration emission sources in China.
Processes 13 00905 g005
Figure 6. CO2 capture cost (low and medium concentration) and compression cost curve change with flow rate.
Processes 13 00905 g006
Figure 7. Curves of CO2 transportation cost with flow and distance.
Processes 13 00905 g007
Figure 8. Distribution map of CO2 source cost (capture + compression + transportation) in different oil regions (each pillar represents a project). A–J are names of oil regions.
Processes 13 00905 g008
Figure 9. Curves of CO2-EOR affordable costs with oil price in various projects in Oil region B. Each color represents a project in the oil region.
Processes 13 00905 g009
Figure 10. Comparison chart of CO2−EOR affordable costs with and without resource tax and storage subsidy for projects in each oil region.
Processes 13 00905 g010
Figure 11. Source–sink allocation roadmap of each oil region (target: the lowest source cost). Purple, green, and pink triangles indicate high-, low-, and medium-concentration CO2 sources, respectively. Blue circles indicate oilfields (sinks).
Processes 13 00905 g011
Figure 12. Comparison of source–sink configuration paths under different optimization objectives in Oil Region G.
Processes 13 00905 g012
Figure 13. Schematic diagram of CCUS planning scenarios.
Processes 13 00905 g013
Figure 14. Path map of source–sink configurations in Oil Region C in each period. Purple, green, and pink triangles indicate high-, low-, and medium-concentration CO2 sources, respectively. Blue circles indicate oilfields (sinks). The dash line means the two parts linked can be planned as one.
Processes 13 00905 g014
Figure 15. Statistical chart of CO2 storage, oil increment, and the number of projects enabled in each planning period of Oil Region C.
Processes 13 00905 g015
Table 1. Emission factors for eight emission sources (unit: ton CO2/ton product).
IndustriesCoal Chemical
Methanol SynthesisOlefin SynthesisCoal Liquefaction (Direct)Coal Liquefaction (Direct)
Emission Factors262.13.3
IndustriesPower PlantsCementSteelSynthetic AmmoniaRefiningPolyethyleneCalcium Carbide
Emission Factors10.8821.273.80.2192.5415.2
Table 2. Average CO2 emissions of enterprises (10,000 tons year−1).
IndustriesPower PlantsCoal ChemicalCementCalcium CarbideRefiningSynthetic AmmoniaSteelPolyethylene
Average CO2
emissions
1085.36931.68473.01281.65297.16218.09731.82164.11
Table 3. Statistical table of CO2 source cost for 10 oil regions (to the wellhead, unit: CNY/ton).
Oil RegionsABCDEFGHIJ
Highest Cost557731669511327672117406320430
Lowest Cost13360489824314760276282294
Average Cost2443286125827327674314296298
Variance95.72155.72115.3460.1420.92111.2611.3212.7429.2844.09
Table 4. Statistical table of CO2-EOR affordable costs in each oil region.
Oil RegionsTechnology Feasible ProjectsEconomically Feasible Projects
CO2
<0 CNY/ton
CO2
0–200 CNY/ton
CO2
200–400 CNY/ton
CO2
>400 CNY/ton
AProjects50122810
Percentage100%24%56%20%
BProjects39111495
Percentage100%28.2%35.9%23.08%12.82%
CProjects348233
Percentage100%23.53%67.65%8.82%
DProjects278145
Percentage100%29.63%51.85%18.52%
EProjects2581151
Percentage100%32%44%20%4%
FProjects12444
Percentage100%33.33%33.33%33.33%
GProjects246144
Percentage100%25%58.33%16.67%
HProjects743
Percentage100%57.14%42.86%
IProjects6132
Percentage100%16.67%50%33.33%
JProjects6222
Percentage100%33.33%33.33%33.33%
SumProjects23064116446
Percentage100%27.83%50.43%19.13%2.61%
Table 5. Statistical table of CO2 source cost reduction and preferential policy impact on project economics in each oil region (oil price: USD 60/barrel).
Oil
Regions
Tech. Feasible OilfieldsCurrent SituationSource Cost Reduction 20%Source Cost Reduction 30%
Cost Diff. <= 0 (CNY/ton)Cost Diff. > 0 (CNY/ton)Eco. Feasible PercentCost Diff. <= 0 (CNY/ton)Cost Diff.
> 0 (CNY/ton)
Eco. Feasible PercentCost Diff. <= 0 (CNY/ton)Cost Diff. > 0 (CNY/ton)Eco. Feasible Percent
A5045510%401020%361428%
B39281128%271231%261333%
C3426824%241029%231132%
D272614%23415%22519%
E2521416%20520%19624%
F1210217%9325%8433%
G24131146%131146%131146%
H77 7 7
I66 6 5117%
J65117%4233%4233%
Sum2301874319%1735725%1636729%
Oil
Regions
Tech. Feasible OilfieldsCurrent SituationResource Tax ExemptionStorage Subsidies
Cost Diff. <= 0 (CNY/ton)Cost Diff. > 0 (CNY/ton)Eco. Feasible PercentCost Diff. <= 0 (CNY/ton)Cost Diff. > 0 (CNY/ton)Eco. Feasible PercentCost Diff. <= 0 (CNY/ton)Cost Diff. > 0 (CNY/ton)Eco. Feasible Percent
A5045510%351530%311938%
B39281128%251436%241538%
C3426824%181647%102471%
D272614%22519%20726%
E2521416%20520%19624%
F1210217%9325%8433%
G24131146%111354%42083%
H77 7 0%7 0%
I66 5117%4233%
J65117%5117%4233%
Sum2301874319%1577332%1319943%
Oil
Regions
Tech. Feasible OilfieldsCurrent SituationCost Red. 20% and Tax Exemp.Cost Red. 30% and Subsidies
Cost Diff. <= 0 (CNY/ton)Cost Diff. > 0 (CNY/ton)Eco. Feasible PercentCost Diff. <= 0 (CNY/ton)Cost Diff. > 0 (CNY/ton)Eco. Feasible PercentCost Diff. <= 0 (CNY/ton)Cost Diff. > 0 (CNY/ton)Eco. Feasible Percent
A5045510%341632%242652%
B39281128%251436%192051%
C3426824%151956%92574%
D272614%18933%18933%
E2521416%18728%17832%
F1210217%8433%7542%
G24131146%101458%22292%
H77 6114%5229%
I66 4233%3350%
J65117%4233%4233%
Sum2301874319%1428838%10812253%
Table 6. Statistical table of optimized configuration of sources and capture.
Oil RegionsABCDEFGHIJ
No. of Preferred
Emission Sources
3623353411421
Annual Capture
(10,000 tons)
219912,6572414289994118733321591682304
No. of Oilfields
for Storage
503934272524247146
Cumulative storage
(million tons)
33018993624351412814988910246
Disclaimer/Publisher’s Note: The statements, opinions and data contained in all publications are solely those of the individual author(s) and contributor(s) and not of MDPI and/or the editor(s). MDPI and/or the editor(s) disclaim responsibility for any injury to people or property resulting from any ideas, methods, instructions or products referred to in the content.

