Abstract
The growth and viability of yeast cells used for fermentation of lager beer (anaerobic process) were optimized under high-gravity brewing conditions (15.5 °P) in an industrial plant. The influence of different levels of pitching rates (6–10 million cells/mL), aeration (8–12 mgO2/L), times (4.5–13.5 h) of filling cylindroconical tanks (CCTs) (3850 hL), and different fermentation temperatures (8.5–11.5 °C) on the multiplication of yeast biomass and the percentage of dead yeast cells was investigated using a response surface methodology (RSM, Box–Behnken design). The obtained results of the influence of the tested parameters on the increase in yeast biomass and their viability were characterized by statistical significance (p < 0.05). Except for the fermentation temperature, which had no effect on the viability of fermenting yeast cells, all independent variables affected both the yeast growth and yeast cell viability.
1. Introduction
The sensory characteristics and the flavour stability of beer depend on the quality of the yeast used to ferment wort. Proper management of yeast throughout the technological process of beer production helps to maintain the optimal physiological and morphological state of the cells [1,2]. There are a few reports showing that proper fermentation parameters are key factors contributing to appropriate yeast growth and sufficient yeast biomass for subsequent fermentations. These papers conclude that a well-executed fermentation process and effective yeast management are key determinants of the quality of the produced beer [3,4,5,6].
Yeast physiology is usually determined by assessing yeast viability and vitality using metabolic dyes, but there are other known morphological characteristics that have been shown to determine yeast condition.
Yeast viability refers to the ability of cells to grow, reproduce and interact with their environment. Thus, viability is essentially a measure of living cells. In many instances, accurately assessing how many cells within a population are alive is sufficient in determining yeast viability [7].
This is essential for understanding how the yeast dosage can be adjusted during pitching to achieve the correct wort fermentation rate at the right time. In industrial conditions, breweries use yeast several times—often the number of generations reaches a maximum five generations (passages). The number of generations in a brewery depends on the amount of available yeast biomass and its microbiological purity.
In turn, Bogacka and Diowksz [8] informed us that there is a big variation in a number of yeast repitchings among the breweries. In some breweries, a lager brewing yeast culture is used two to three times while in others even seven to nine times for fermentation of wort at a similar original gravity. It has also been reported that lager yeast can be reused even up to 20 times.
Lorizzo et al. [9] emphasised that wort is transformed into beer during alcoholic fermentation and maturation, which are the longest processes in brewing. Primary fermentation lasts from 72 to 150 h. Maturation (hot and cold—called lagering, it was carried out in +14.0 and −1.0 °C, respectively) can take at least 10 days, depending on the type of fermentation and process technology. Yeasts transport and ferment carbohydrates from wort in a specific order: monosaccharides (glucose and fructose), disaccharides (sucrose and maltose), and the trisaccharide maltotriose. A small amount of maltotriose is used to ensure adequate amounts of reserve polysaccharides (glycogen and trehalose). Amino acids are then assimilated by yeast to produce proteins and enzymes, ultimately leading to the formation of new yeast cells. Secondary by-products of fermentation, such as volatile compounds—including higher alcohols, esters, organic acids, and sulphur-containing compounds—influence the flavour, aroma, and taste, thereby affecting beer quality. The multiple uses of germ yeast have been discussed in the literature for a long time. In most breweries, they are used no more than three or four times to start wort fermentation. In brewing practice, yeast is often replaced when its vitality and fermentation efficiency decline significantly.
In their “Short history of beer brewing”, Raihofer et al. [10] acknowledged the primary role of alcohol-synthesising yeasts in the production of beer with desirable, pleasant characteristics. Such yeasts were a product of human domestication and selection, since the breeding of yeasts with desirable characteristics and the beginnings of optimisation in yeast management were known in the middle of the 19th century. Wang et al. [11] and Chen et al. [12] showed that the prolonged fermentation time is one of the major and significant problems associated with fermentation at low initial yeast doses. The authors observed that the lowest inoculum density (0.1% v/v) was associated with a long initial adaptation phase before exponential growth. It may be explained by the fact that certain growth factors and signalling molecules released by the yeast cells did not reach appropriate concentrations given the low initial cell numbers diluted in a new fresh culture. This is also related to the overall lower volume of the yeast biomass while the proportion of newly proliferated cells is high. On the other hand, the reduced viability and vitality of yeast cells and the associated autolysis phenomena may lead to the destruction of the flavour, head and colloidal stability of beer [11]. In breweries, yeast cells are exposed to many stress factors, such as hyperosmosis, especially in the first stage of fermentation. Stable physiological and morphological characteristics of yeast are necessary for the production of high-quality beer, and the subsequent re-use of previous generations of yeast in a currant brew may cause a decrease in their physiological characteristics and, consequently, affect the fermentation processes.
In turn, a study carried out by Chen et al. [13] highlighted the strain-specific performance, with some yeast strains suitable for high-throughput fermentation and others performing well under difficult technological conditions. The results of their work provide key insights into the selection and optimization of yeast strains tailored to specific industrial fermentation processes, contributing to improved productivity and product quality in food and beverage production.
Fermentation temperature is one of the most important factors influencing the fermentation rate. An appropriate range of process temperatures, particularly the set fermentation temperature, is essential for rapid yeast propagation.
Raising the fermentation temperature (from 8.5 to 11.5 °C), increasing the initial aeration level (from 8 to 12 mgO2/L) only during the transfer of wort from the brewhouse to the fermentation department directly to CCT and extending the CCT (cylindroconical tank) filling time (from 4.5 to 13.5 h), together with a higher yeast dosage (from 6 to 10 mln cells/mL), will increase the fermentation rate by stimulating yeast growth. However, this approach has several drawbacks, including a different beer flavour and a detrimental effect on yeast viability (leading to poorer performance in the next fermentation). The increased inhibitory effect on the fermentation process is attributed to the increased accumulation of intracellular ethanol. Therefore, a shortened fermentation time may lead to obtaining cells with a poor viability of the cropped yeast. A higher fermentation temperature significantly increases the number of budding cells, especially in the early stages of the fermentation process, depending on the intensity of the process and the metabolic changes in the cells.
The optimum fermentation temperature range for bottom fermentation is between 5 and 16 °C. A temperature increase may increase yeast activity but lead to disadvantages such as lower head stability, poor beer colour, lower pH, and increased loss of bitter compounds.
Guan et al. [14] showed a practical strategy, by increasing the fermentation wort temperature. During experiments, they compared the fermentation performance of three lager yeasts under different temperatures (11 °C, 15 °C, 18 °C). Yeast cell growth and fermentation rate analysis show that a higher temperature can indeed increase the fermentation rates. However, the taste value and volatile compounds analysis indicated that different temperatures also changed the flavour fingerprint dramatically. Additionally, a higher temperature had a negative impact on lower cell viability and flocculation ability.
Solgajova et al. [15] stressed that ensuring a proper temperature measurement and control in fermenters is one of the most important requirements in brewing. This is because variations in fermentation have a significant effect on the sensory properties of beer. Guadalupe-Daqui et al. [16]) highlighted the influence of temperature on yeast biomass growth. The authors showed that a decrease in the CSA (colorimetric sensor arrays) coefficient, defined as the ratio between the vacuole and the yeast CSA, was already observed at 30 °C and not at 35 °C as previously thought. In another study by Guadalupe-Daqui et al. [17], fermentation at higher temperatures resulted in lower yeast viability.
The fermentation temperature must therefore be set within controlled limits to avoid excessive reduction of yeast viability and cell autolysis, especially above 30 °C, as well as the production of undesirable by-products and retarded bacterial growth, which all adversely affect the final product quality [18]. The temperature inside the fermenter must be strictly controlled to ensure proper product quality and to eliminate differences between production batches.
Verbelen et al. [19] provided evidence that optimization of the initial level of wort aeration may effectively increase the efficiency and stability of the production process. Proper wort oxygenation ensures a high net growth of yeast cells.
From a yeast physiology perspective, optimal oxygen dosage increases the storage sugar content in yeast cells, enhancing their physiological state and, in turn, improving beer quality. Similar conclusions were drawn in the review by Kalayu [20], who also suggested that serial re-pitching of yeast cells negatively affects fermentation efficiency and beer quality. Therefore, proper yeast oxygenation appears to be critical for producing yeast suitable for re-pitching and ensuring correct fermentation efficiency, ultimately leading to high beer quality. Similarly, Kucharczyk and Tuszyński [21] reported that, under industrial conditions, higher wort aeration increased production efficiency, primarily by accelerating fermentation. A higher initial oxygen dose boosted the yeast biomass productivity and positively influenced its viability.
The effect of filling procedures in multi-fill fermentation systems on fermentation efficiency has been described by Yokoyama and Ingledew [22]. The best effects on the fermentation process were obtained by applying the method of filling the fermenters after an appropriate break. The break, especially after 10–14 h, resulted in nearly optimal conditions for proper yeast performance.
The purpose of this paper was to investigate how variations in key fermentation parameters affect yeast growth and viability under large industrial plant conditions. This study was based on the extensive use of statistically designed experiments and a response surface methodology (RSM). A similar approach has been applied by other authors to optimise processes in breweries [23,24,25], particularly to examine the effects of variations in the fermentation temperature, original gravity and pitching rate. In our previous experiment [26], we successfully applied the RSM methodology to optimise fermentation process parameters ensuring that acetaldehyde and DMS concentrations, along with other volatile components, resulted in significantly better quality in fermented beer.
2. Materials and Methods
2.1. Experimental Set-Up
The process of beer fermentation and maturation was studied in industrial cylindroconical fermentation tanks (CCTs). Each fermenter was filled with three brews. The final wort volume in each CCT was 3090 hL, while the gross capacity of the CCT was 3850 hL. An HGB (High Gravity Brew 15.5 °P) wort was produced using a pilsner malt. Infusion mashing was carried out at a standard scale temperature of 60–76 °C, and pH 5.5. The mash was then transferred to a lauter tun. After boiling, the wort was cooled and then aerated with compressed sterile air at a pressure of 4 bar, injected through the wort line at a back pressure of 2.5 bar, during the wort transfer to each of the CCTs, with varying intensities to achieve 8–12 mg O2 per litre of wort, about the value of pH 5.1. Dissolved oxygen concentrations were measured in the pitching wort and after filling the CCTs using an optical oxygen meter (Mettler-Toledo International, Inc., Greifensee, Switzerland). The primary fermentation was carried out at 8.5, 10 and 11.5 °C, while the temperature of the final fermentation phase was 13 °C. The reduction in an apparent extract content to 3.4 °P marked the end of fermentation and the beginning of maturation. Both fermentation and maturation were carried out in the same tank. The pitching rate was calculated on the basis of the total viable cell count. Sampling started after filling the CCTs and continued for 18 consecutive days of the production cycle. The third generation (yeast used twice before) of Saccharomyces pastorianus ssp. carlsbergensis brewer’s yeast was used for pitching. The yeast was added to the first of three brews at each CCT. Yeasts were pitched using ABER system (ABER Instruments Ltd., Aberystwyth, UK) for the rate control, which determined the total viable cell count.
2.2. Analytical Procedures
One of the most important analytical determinations in the work was the measurement of yeast viability. The analysis of the viability parameter is also very important for industrial processes where microorganisms are used.
Generally, cell viability is defined as a percentage of live cells in a whole population. This parameter can be determined by different methods. One of this category of viability measurement methods included is the stain-based method. In this case, fluorescent dyes are used. The mechanism of action of these dyes depends on the properties of the cell membrane. The presence of the dyes within the cells indicates damage of the cell membrane and cell death. Commonly used dyes from this group include DNA-binding fluorescent dyes such as propidium iodide [27].
During experiments, the total number of yeast cells and their viability during beer fermentation and maturation were determined using a NucleoCounter® NC-200™ (ChemoMetec A/S, Lilleroød, Denmark). This system identifies and counts single cells with DNA stained with propidium iodide. The NucleoCounter® NC-200™ automated cell counter is a high-precision instrument utilizing state-of-the-art image cytometry. The NucleoCounter® NC-200™ automated cell counter comes with optimized analysis settings for cell count and viability measurements [28].
The yeast biomass multiplication factor (M) was defined as the ratio of the amount of yeast biomass growth obtained in a hectolitre of yeast slurry based on cell concentration (×109/mL) to the amount of biomass used for fermentation in a hectolitre of yeast slurry based on cell concentration (×109/mL).
M = yeast biomass growth obtained in a hectolitre (×109/mL)/amount of biomass used for fermentation in a hectolitre (×109/mL).
Yeast viability was assessed using the equation = (total yeast − dead cells)/total yeast × 100%.
2.3. Statistical Analyses
The processing factors that influenced yeast growth and viability were tested using the experimental design module of the Statgraphics Centurion XVII ver. 17.1.12 (Professional Edition statistical software, Statpoint Technologies, Inc., Warrenton, VA, USA).
Optimization of Growth and Viability of Yeast Cells
We applied a fully randomised Box−Behnken design with four factors at three levels each: pitching rate at 6, 8 and 10 million yeast cells per ml, cold wort aeration at 8, 10 and 12 mg/L, CCT filling time at 4.5, 9 and 13.5 h, and fermentation temperature at 8.5, 10 and 11 °C (where the final wort volume in each CCT was, on average, 3090 hL), and two blocks including 5, 9 and 13.5 h, and a fermentation temperature at 8.5, 10 and 11.5 °C (where the final wort volume in each CCT was, on average, 3090 hL), and two blocks, with three centres per block, giving 38 error degrees of freedom in 54 runs. The independent variables, their codes and actual values are shown in Table 1. To assess the statistical significance of the second-order polynomial model, the coefficient of determination (R2) and the probability of out-of-fit values were calculated.

Table 1.
Coded and actual values of the variables in the Box–Behnken design.
The fitted models were subjected to ANOVA and Pareto chart analyses, and non-significant (p > 0.05) components were removed from the models. To assess the statistical significance of the second-order polynomial model, the coefficient of determination (R2) and the probability of the values not fitting were calculated.
3. Results and Discussion
3.1. Yeast Growth (Multiplication) in the Fermentation Process
There were significant effects of the pitching rate, aeration level, CCT filling time, and fermentation temperature on the growth of yeast cells in the cylindro-conical fermentation vessels. After removing insignificant components from the model, the analysis of variance for yeast growth for mature beer is shown in Table 2.
Table 2.
Analysis of variance: The empirical model for predicting yeast growth.
The relationship between the four independent factors and yeast growth responses was calculated to obtain the following polynomial equation:
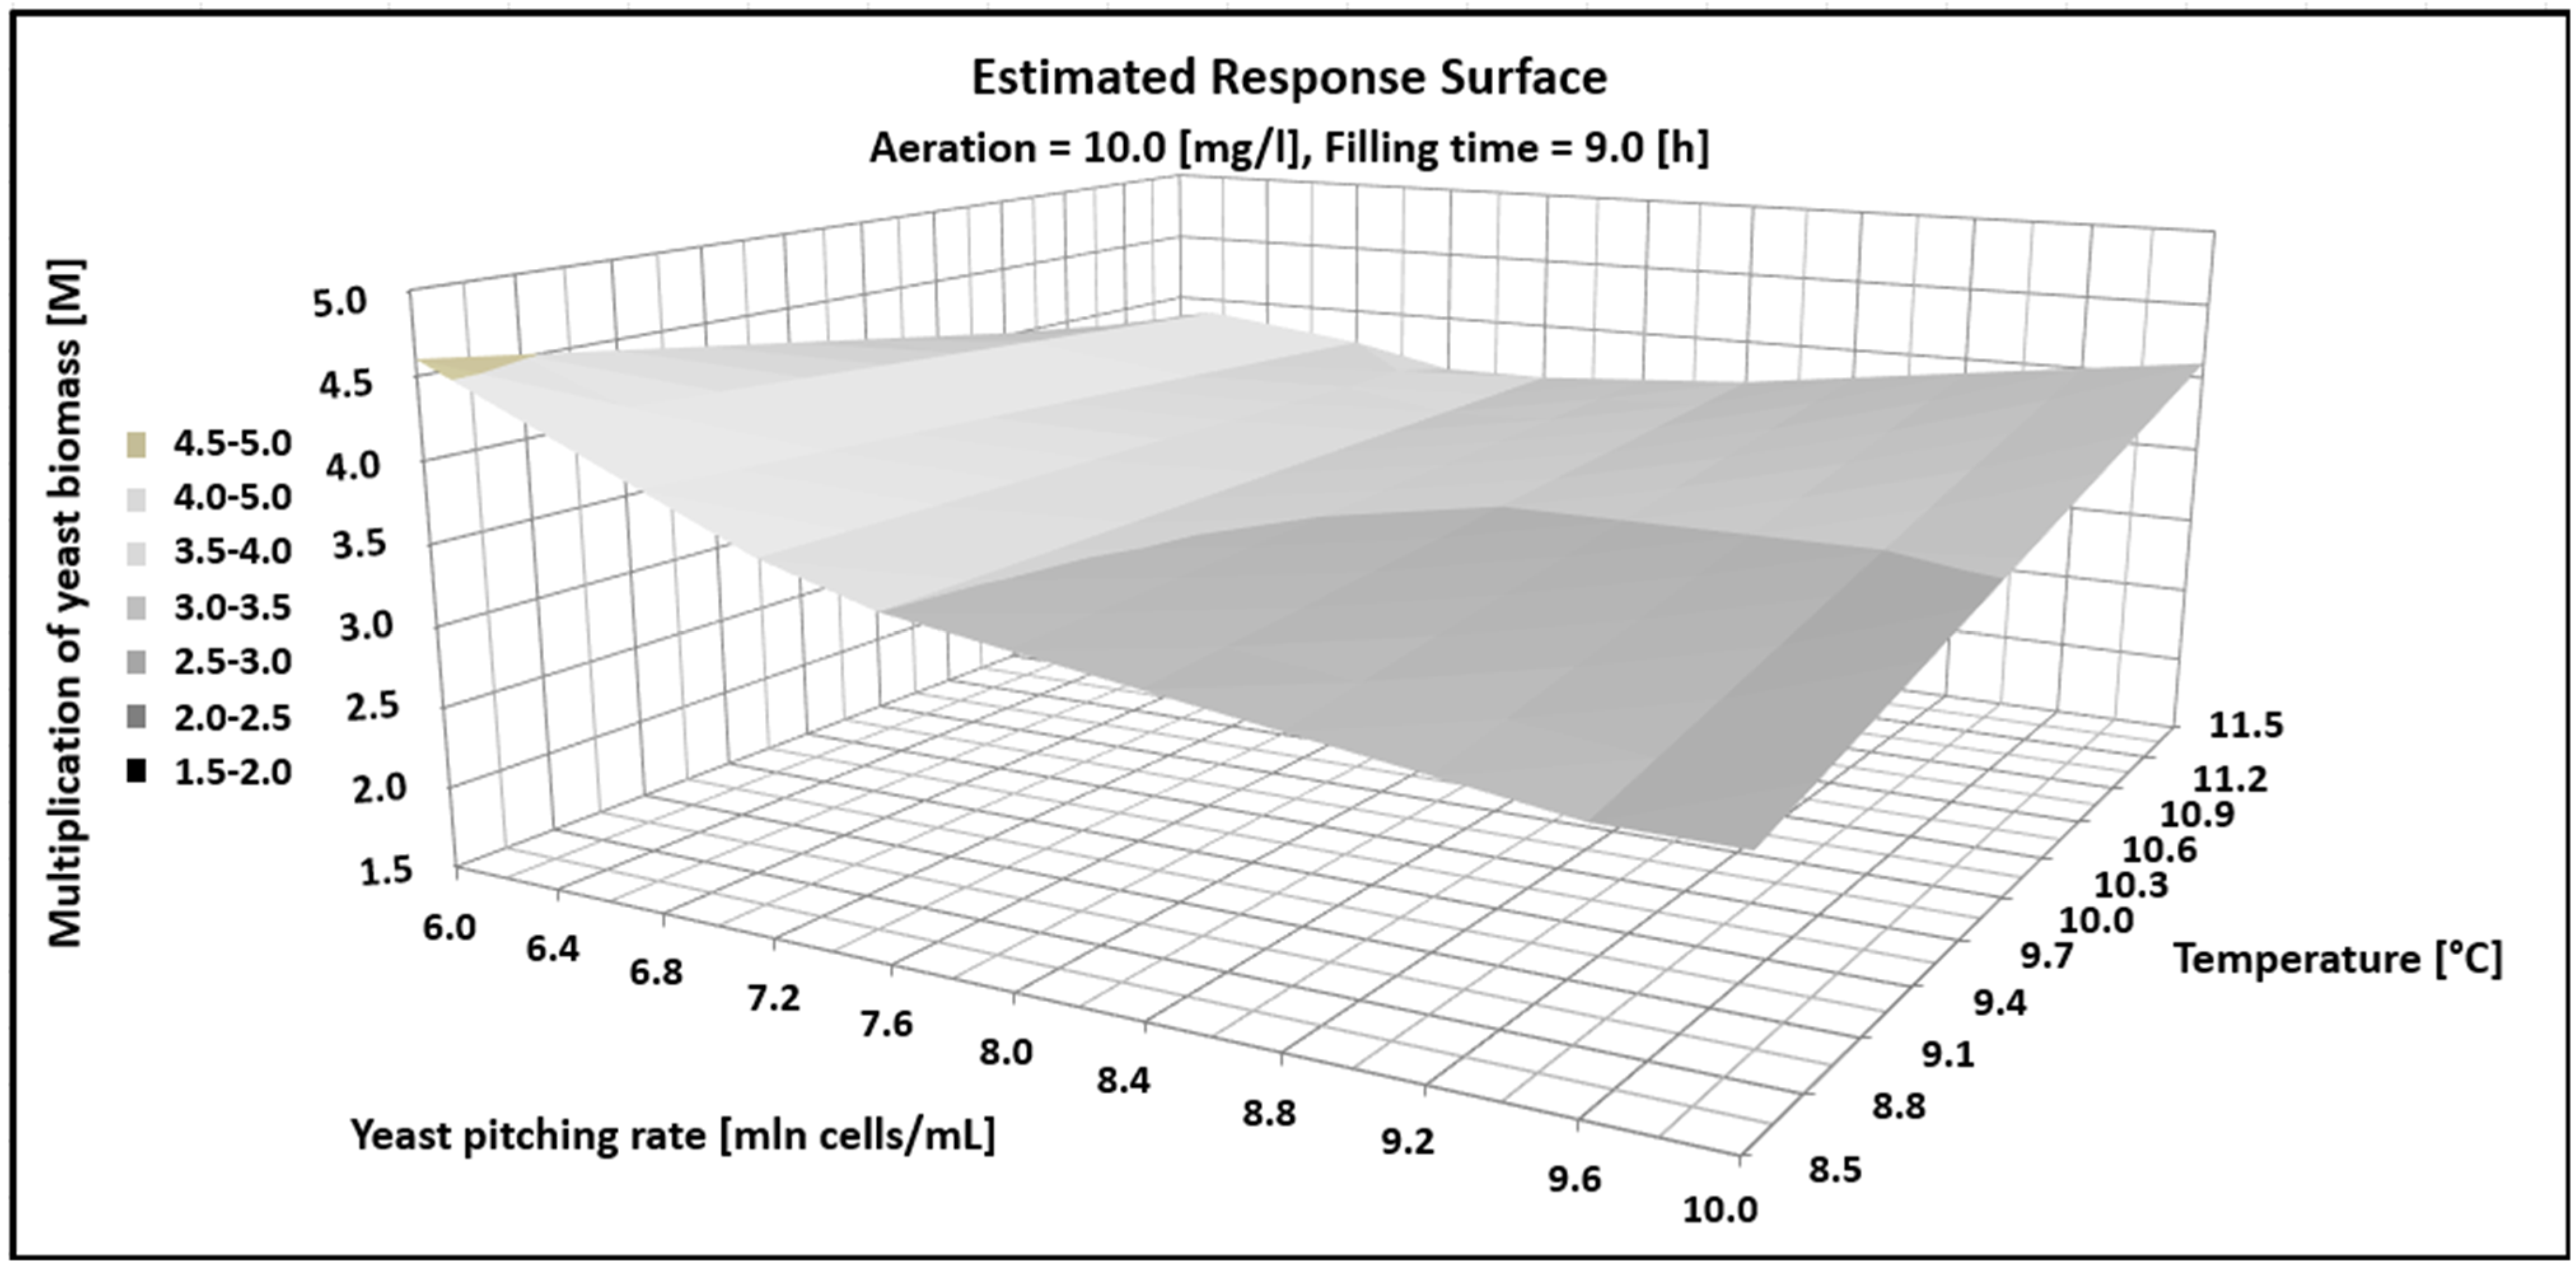
where y1 represents yeast growth, x1 denotes pitching rate (million cells/mL), x2 indicates fermentation temperature (°C), x3 represents aeration level (mg/L), and x4 corresponds to total CCT filling time (hours). Statistical analysis showed that all of the tested fermentation parameters and their interactions had a statistically significant effect on yeast biomass growth, but the quadratic components of the model were insignificant. The graphical analysis of the model is shown in Figure 1. In the figure, aeration and the CCT filling time were kept constant, while the yeast biomass decreased from 4.5 to 3 times with an increasing pitching rate from 6 to 10 million cells per mL. Additionally, increasing the fermentation temperature from 8.5 to 11.5 °C resulted in a three- to four-fold increase in yeast biomass.
y1 = 26.45 − 4.017 x1 − 0.913 x2 − 0.427 x3 − 0.164 x4 + 0.174 x1 x2 + 0.084 x1 x3 + 0.015 x1 x4 − 0.068 x2 x3 − 0.065 x2 x4 + 0.096 x3 x4
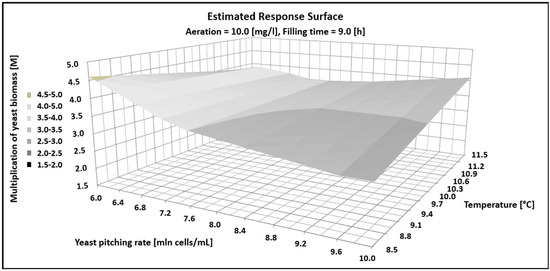
Figure 1.
Estimated response surface showing the impact fermentations parameter on multiplication (M) of yeast biomass.
The main effects plot for yeast growth is shown in Figure 2. A linear relationship was observed between the yeast biomass multiplication factor (M) and the aeration level over the tested range. In contrast, the yeast biomass growth exhibited a second-order relationship with the CCT filling time, reaching a maximum at 9 h. Both lower and higher CCT filling times resulted in reduced yeast multiplication. A clear inverse relationship between the yeast multiplication factor and the pitching rate was observed up to 9.0 million cells/mL, whereas a fermentation temperature above 9.5 °C increased the yeast multiplication linearly.
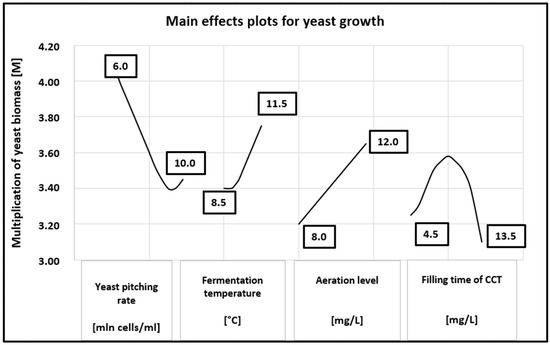
Figure 2.
Main effects plots for yeast growth.
Regarding the effect of the pitching rate, results similar to ours were reported by Nguyen and Viet Man [29], who found that although the number of yeast cells in the culture increased with a higher pitching rate, net yeast growth decreased when the pitching rate exceeded 4.5 × 10⁷ cells/mL. The net growth in the control sample and the culture pitched at 4.5 × 10⁷ cells/mL were nearly identical. However, when pitching rates of 7.5 × 10⁷ cells/mL and 10.5 × 10⁷ cells/mL were used, net growth was reduced by 1.2-fold and 1.4-fold, respectively, compared to the control sample. Therefore, a higher pitching rate resulted in fewer newly generated cells in the culture. Similar observations were made by Verbelen et al. [30], who reported that the maximum yeast cell count increased with a higher pitching rate. Interestingly, net growth (the maximum yeast cell count minus the initial inoculum size) ranged from 33–40 × 10⁶ cells/mL but decreased significantly at the higher pitching rate of 120 × 10⁶ cells/mL. In contrast, Wang et al. [11] found that the maximum yeast biomass was observed in samples with lower inoculum sizes. Importantly, the net growth of yeast cells, calculated by subtracting the initial cell count from the maximum cell count per unit volume, showed no significant difference across different inoculum sizes (10% v/v: 5.18 g/L, 1% v/v: 5.102 g/L, 0.1% v/v: 5.120 g/L). These data suggest that in samples with the lowest pitching rates, the stationary growth phase was delayed by 24 h, leading to longer fermentation times as pitching rates decreased.
Since the initial oxygen content was consistent across all cultures, the authors assumed that as the pitching rate increased, the oxygen available per yeast cell decreased. Consequently, high cell density fermentations produced fewer young cells, which could have significant implications for future yeast population generations.
Regarding the effect of the fermentation temperature, Yu Guan et al. [14] confirmed on a laboratory scale the same trend observed in our industrial-scale experiments: biomass increase was strongly correlated with a temperature rise, particularly between 11 and 15 °C. In the study, the authors used the same yeast strain as we did within the tested range of 8.5 to 11.5 °C. Under varying temperatures (11, 15, and 18 °C) and original wort concentrations, the R2 values for the total biomass and ethanol content across the three strains were all greater than 0.8, indicating a strong correlation. This suggests that different brewing environments influence the growth of brewer’s yeast cells, and yeast cell growth remains one of the most critical factors affecting the fermentation rate.
The effect of different fermentation temperatures on the spent yeast density and viable yeast population was also investigated by Olaniran et al. [31]. They found that the spent yeast density decreased as the fermentation temperature increased. Fermentation at room temperature produced the highest spent yeast density, with a yield of 2.47 mg/mL. These results contrast with our findings, likely because the authors used a higher fermentation temperature than in our study.
3.2. Yeast Viability in the Fermentation Process
Yeast viability is the percentage of live cells in the yeast population. It is generally accepted that the live cell content of the yeast slurry used for subsequent fermentation should contain >95% of live cells. High yeast viability allows for the production of high-quality beer and yeast that can be used for subsequent fermentation.
Table 3 shows the analysis of variance for yeast viability in mature beer after removing insignificant components from the model.
Table 3.
Analysis of variance: The empirical model for predicting yeast viability.
The relationship between the four factors and the predicted responses of yeast viability was calculated to be:
where y2 represents the yeast viability, x1 denotes the pitching rate (million cells/mL), x2 indicates the fermentation temperature (°C), x3 represents the aeration level (mg/L), and x4 corresponds to the total CCT filling time (hours). Statistical analysis shows that the pitching rate, aeration level and CCT filling time, as well as the interaction between the yeast pitching rate and aeration, had a statistically significant effect on yeast biomass viability.
y2 = 15.0169 − 2.71875 x1 + 1.98981 x2 − 2.79792 x3 − 0.037037 x4 + 0.0458333 x1 x2 + 0.2 x1 x3 − 0.0138889 x1 x3 − 0.0166667 x2 x3 + 0.02 x2 x4 + 0.0361111 x3 x4
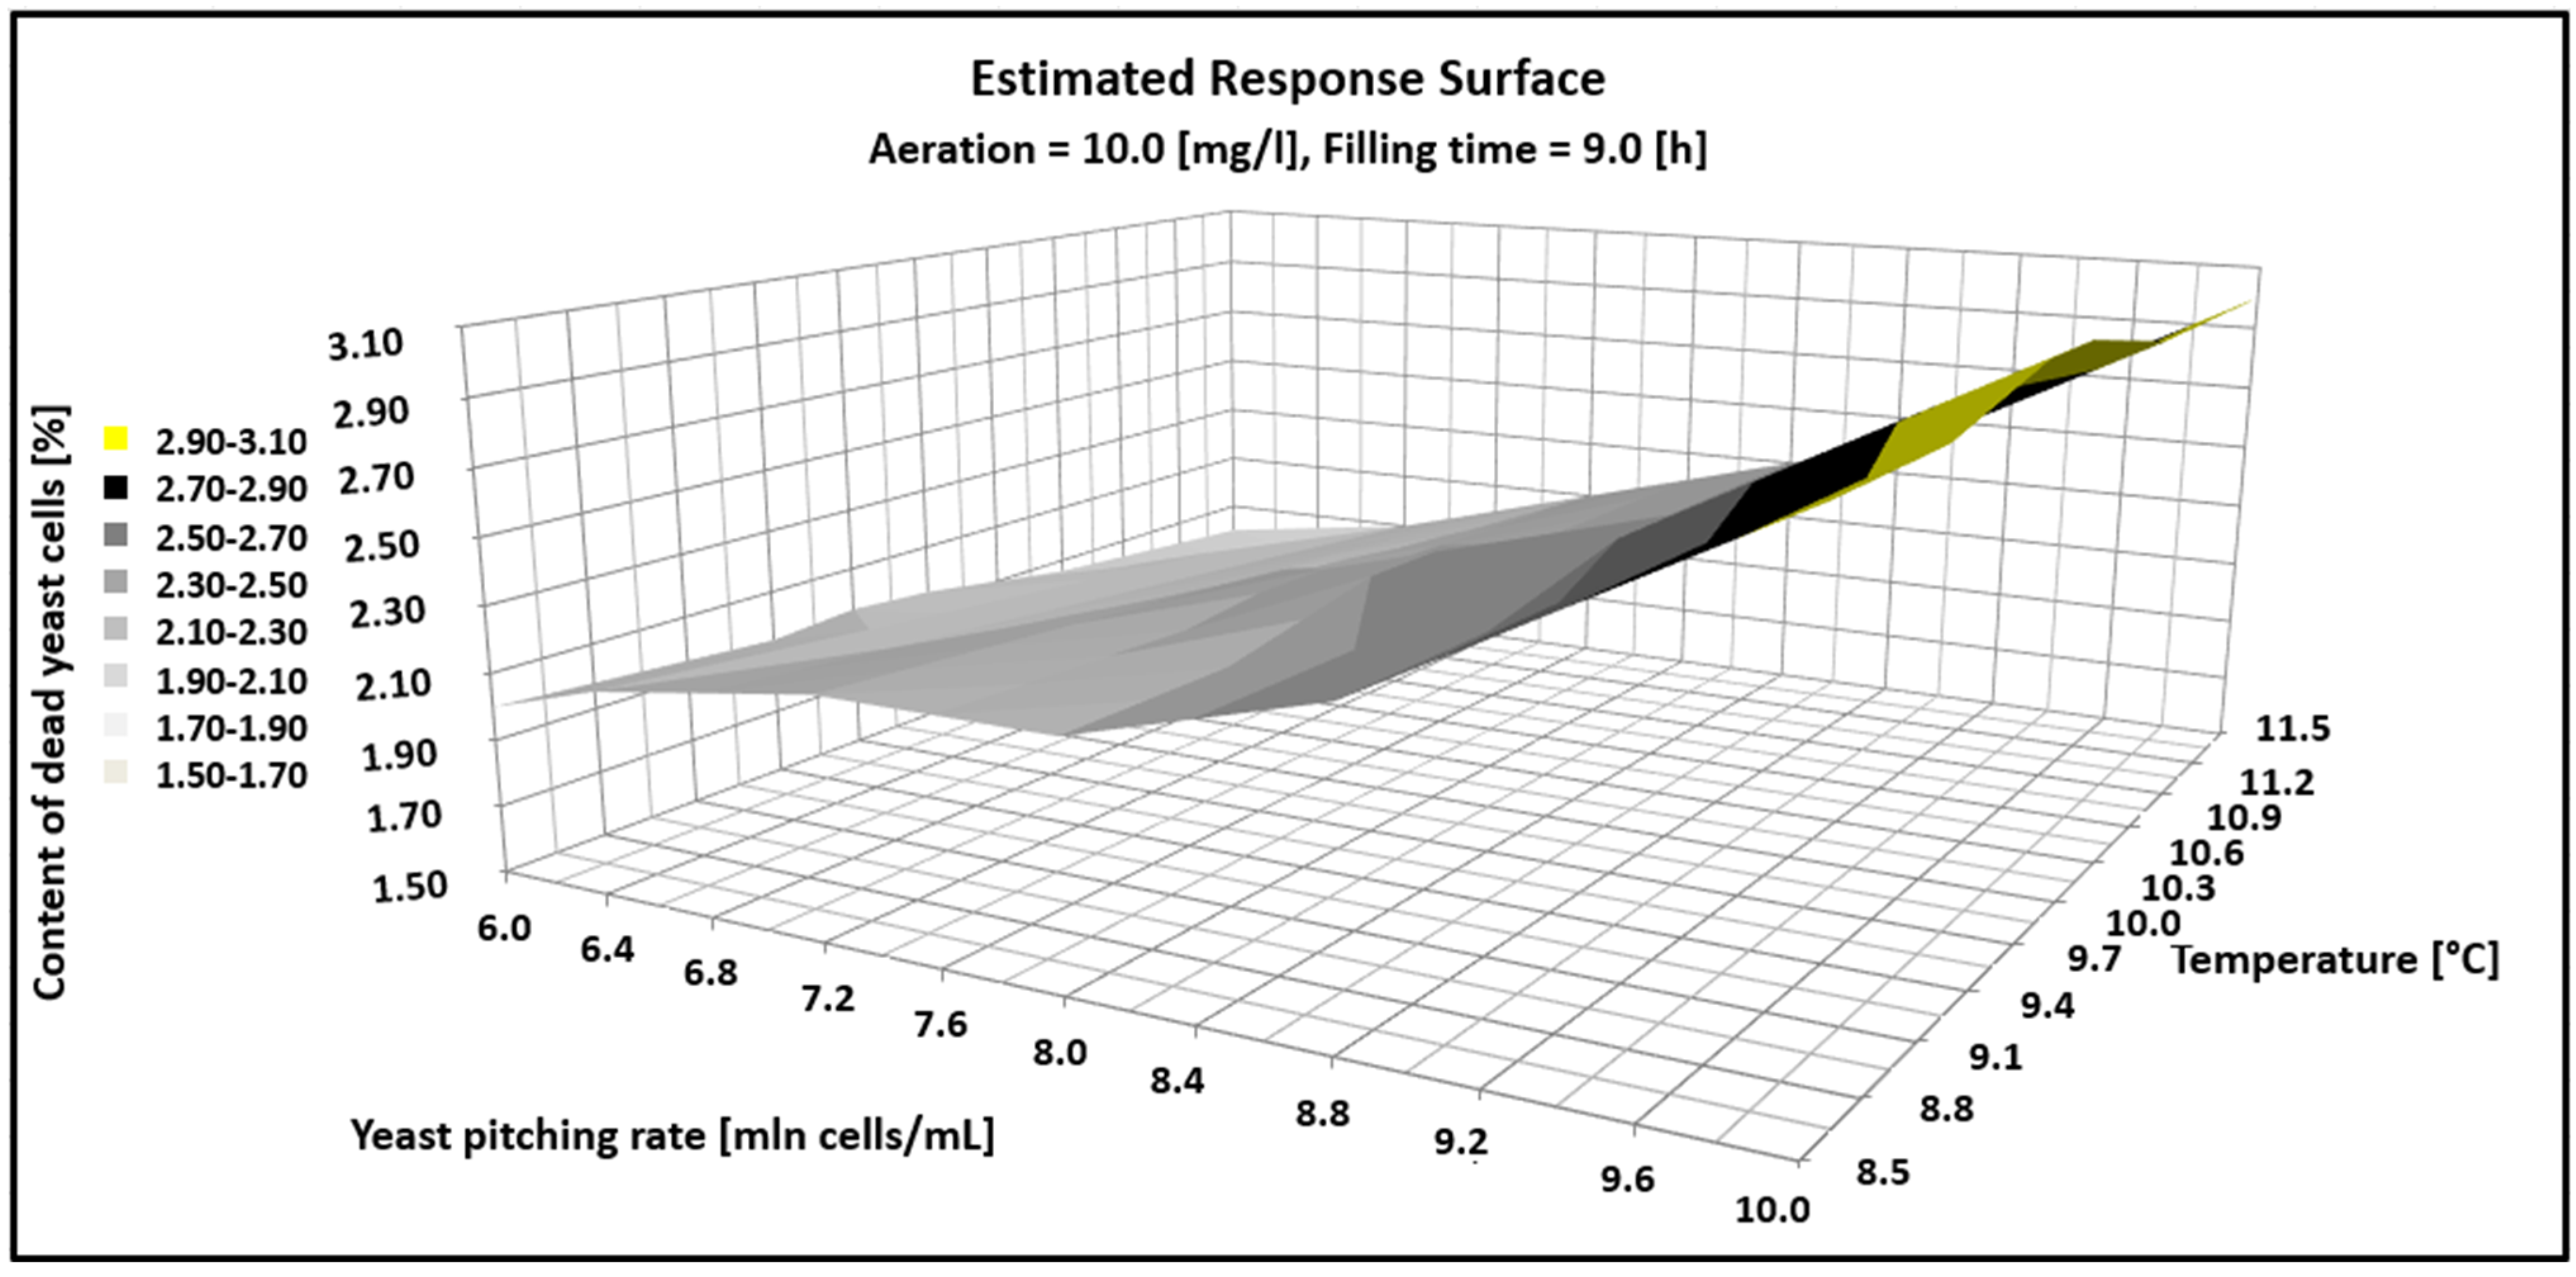
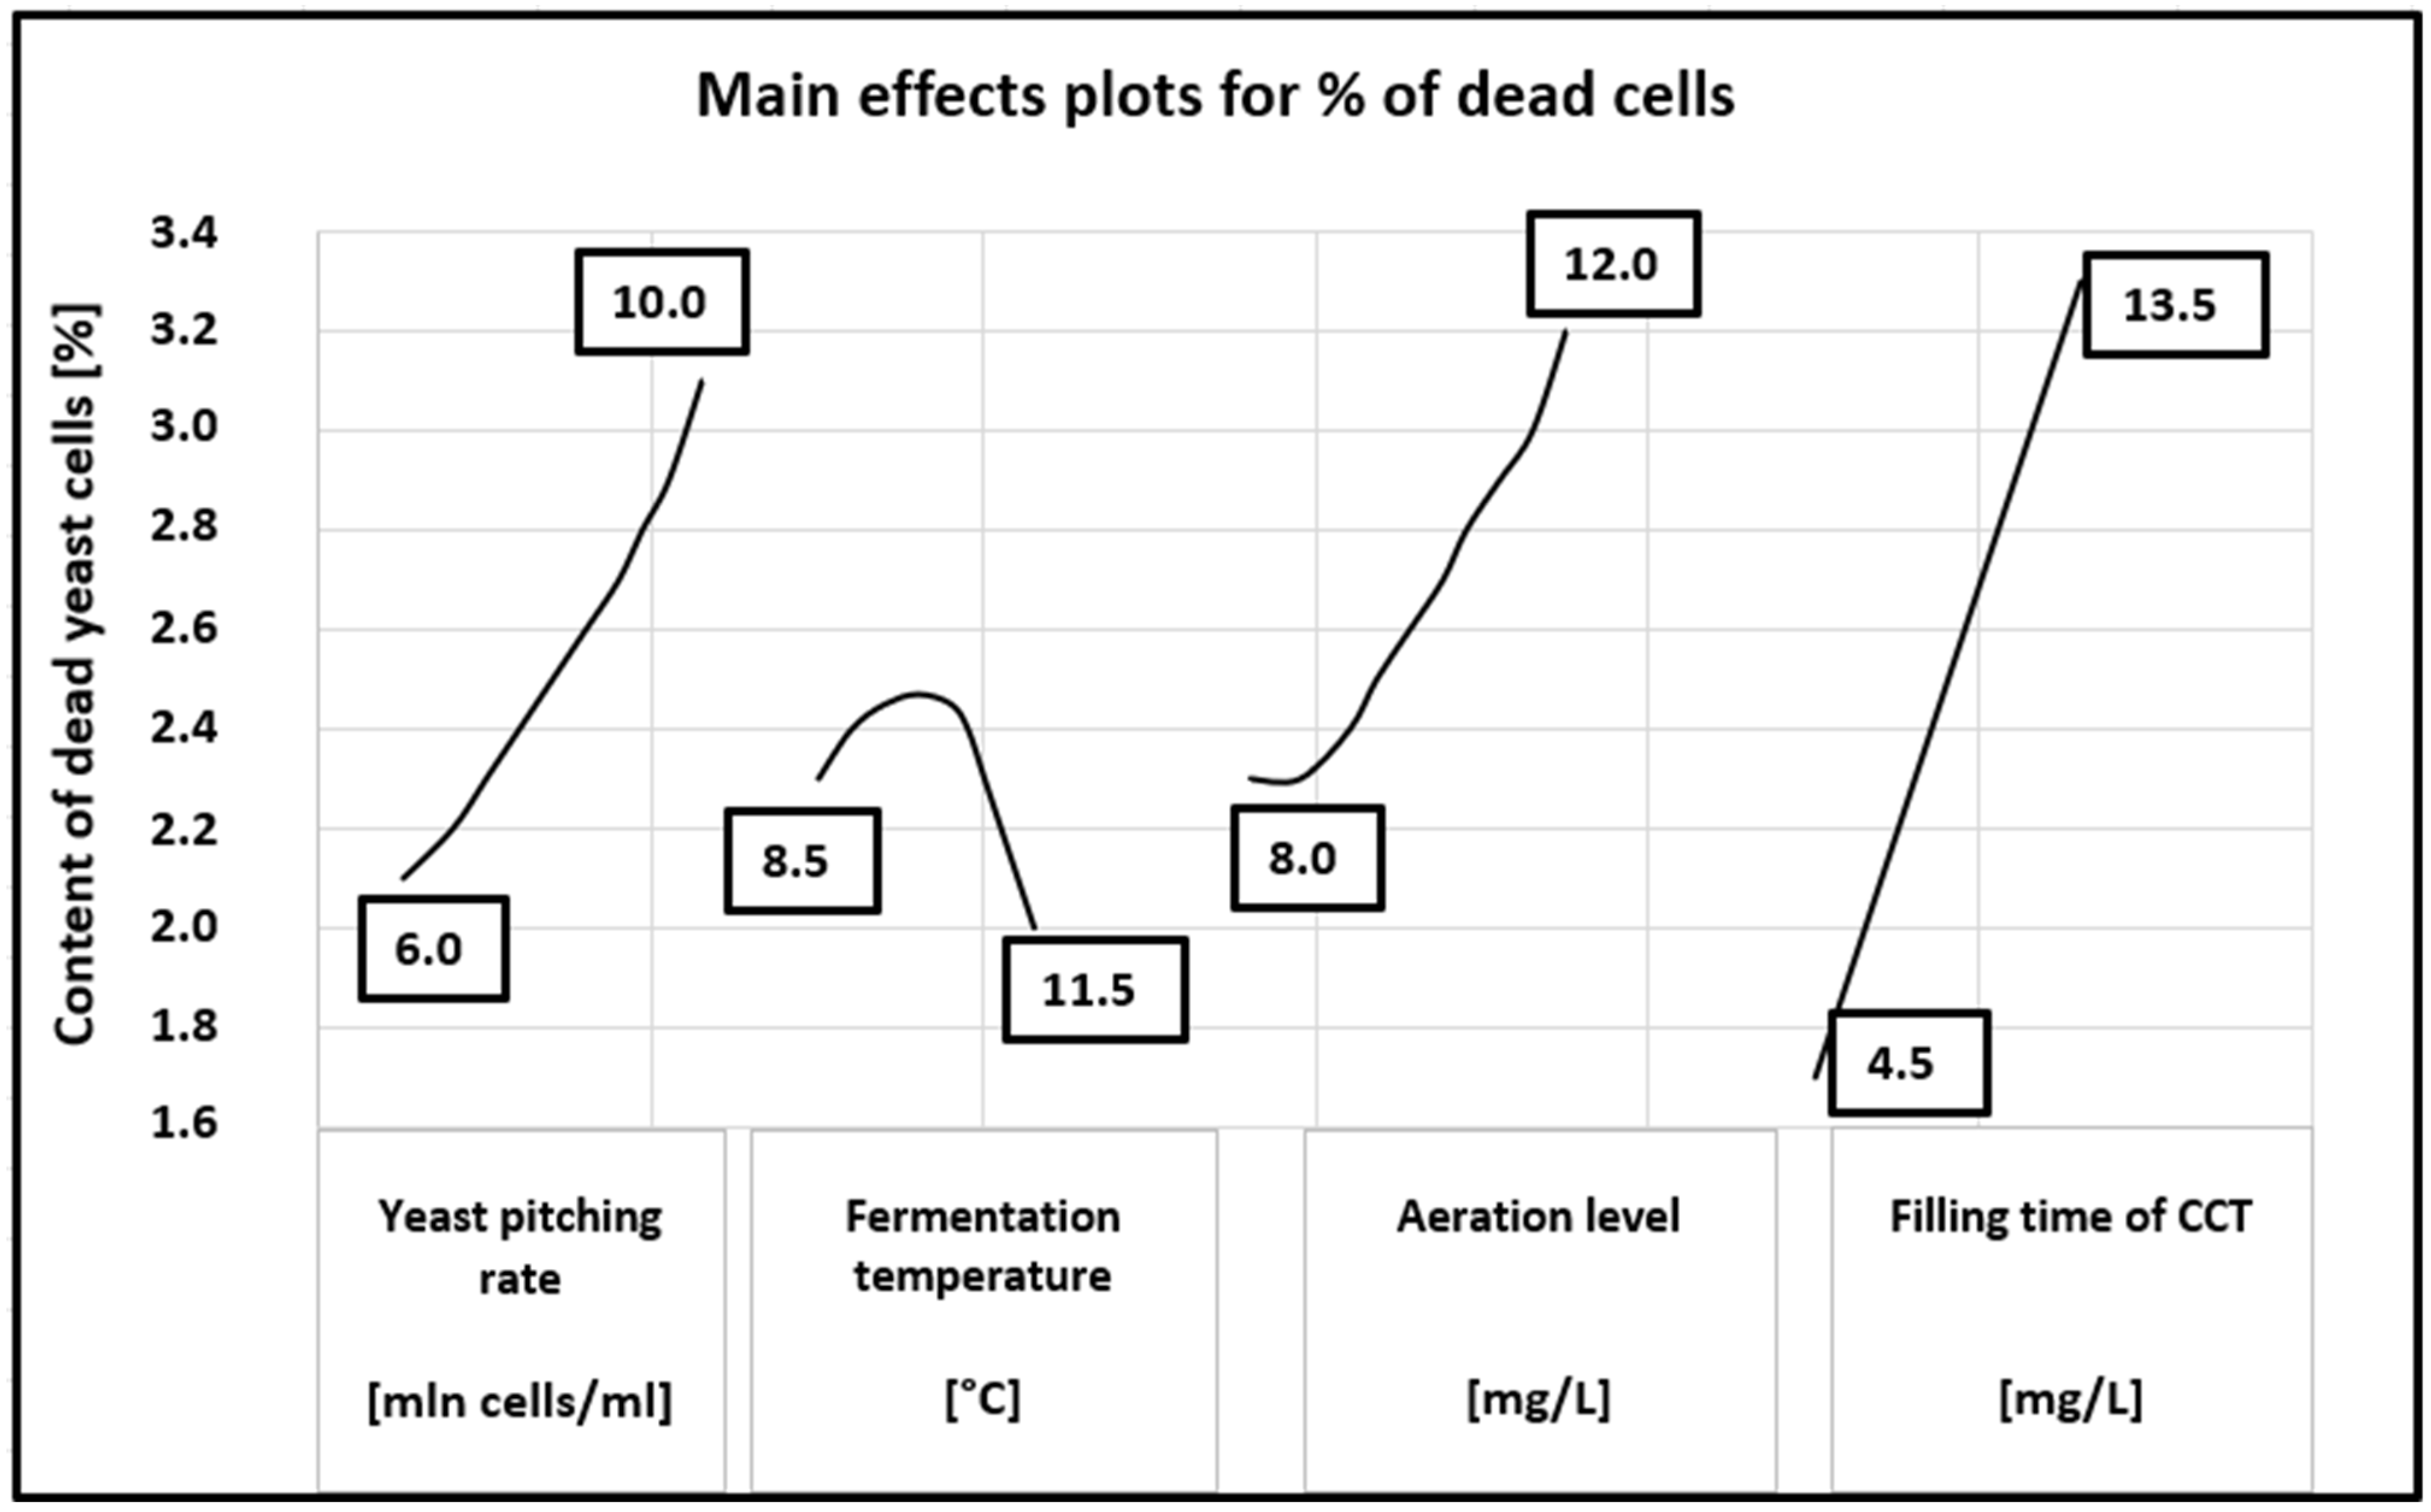
Figure 3 and Figure 4 show the estimated response surfaces and main effects plots for yeast viability.
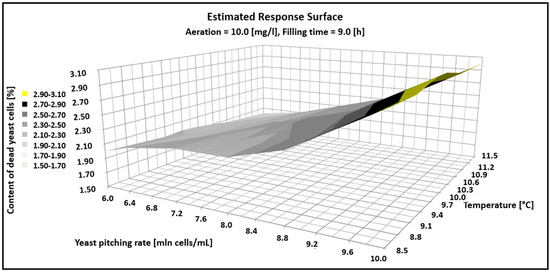
Figure 3.
Estimated response surface showing the impact of fermentations parameter on the content of dead yeast cells.
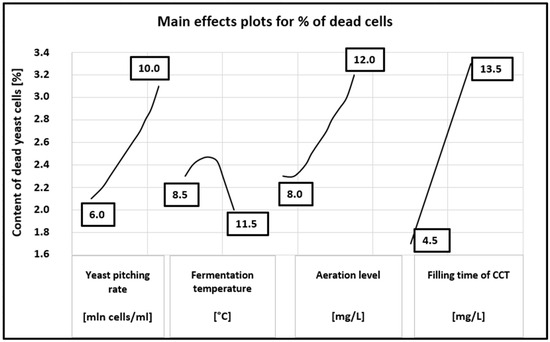
Figure 4.
Main effects plots for content of dead yeast cells.
Figure 3 shows that as the dose of yeast increases over the experimental range, so does the number of dead cells. In turn, the increase in temperature in the range of 8.5–11.5 °C had no statistical significance and the percentage of dead cells was in the range of 3–3.5% for the yeast pitching rate from 6 to 10 million cells/mL.
A more detailed distribution of the influence of the tested parameters on yeast mortality can be seen in Figure 4. The figure clearly shows that an increase in dead cells is observed throughout the tested range of the yeast dose, aeration level and filling time. It ranges from 2.15 to 3.1% for the yeast dose, from 2.3 to 3.2% for the aeration and from 1.6 to 3.3% for the filling time. There is no correlation in the whole tested range only for different fermentation temperatures.
In the experiments carried out by Verbelen et al. [30] with different pitching rates, the authors started with the same viable yeast population and obtained different profiles: the three fermentations with the lowest pitching rate all maintained a high level of cell viability until about half of the sugar was consumed, and then decreased. In the fermentations with the highest cell density, the viability decreased gradually during fermentation, but also more rapidly towards the end. For these two conditions, the viability at the end was not significantly different. When the total biomass was harvested at the end of fermentation, the cell viabilities for all fermentations were close to each other, except for the fermentation with the lowest pitching rate, where the viability was significantly lower. This indicates that the long duration of this fermentation had a detrimental effect on the viability of the total yeast population. Similar results of the effect of the pitching rate on yeast viability were reported by Jones et al. [32]. The authors showed that a 40% yeast pitching rate increase relative to the standard dose caused a decrease in the amount of viable yeast. In other studies, Nguyen and Viet Man [29] used four different pitching rates from 15 to 105 × 106 cells/mL. Experiments showed that the percentage of viable cells at the end of all fermentations remained above 82% in the four samples.
The effect of temperature on yeast viability was investigated by Olaniran et al. [31]. The authors indicated that an increase in fermentation temperature led to a steady decrease in the viability of yeast cells. The lowest viable population of both strains was observed at the highest fermentation temperature of 30 °C. The decrease in cell viability over time was also attributed to nutrient depletion and the early entry of the organisms into the death phase.
Yu Guan et al. [14] demonstrated the relationship between increasing fermentation temperature and decreasing yeast viability (strain WS34, lager yeast, Saccharomyces pastorianus). Their study, conducted within a temperature range of 11–18 °C, showed an increase in cell mortality from 8% to approximately 10% for 12 °P wort. For 24 °P wort, mortality was significantly higher, ranging from 11% to 15%.
3.3. Yeast Growth and Viability in the Industrial Fermentation Process—Validating Experiment
To validate the results of the regression models calculated throughout the experiments, the multiple response optimisation module of the Statgraphics statistical software was used to simultaneously minimise the percentage of dead yeast cells and maximise the yeast cell growth yield. The results of the multiple response optimisation are shown in Table 4. The calculated optimal values of the independent factors were applied in the brewery to validate the significance of the optimisation studies conducted for managing the industrial fermentation plant. A comparison of the calculated and actual values of the yeast multiplication factor and the percentage of dead yeast cells is shown in Table 5. The actual experimental values were slightly higher than the calculated ones, but the differences can be considered minor, given that the variability in the yeast growth multiplication factor ranged from 1.15 to 5.28 and the percentage of dead cells ranged from 0.7% to 7.0%.
Table 4.
Combination of levels of independent factors calculated by the multiple response optimisation module to simultaneously maximise yeast cell growth and minimise the percentage of dead cells.
Table 5.
Comparison of the calculated yeast growth multiplication factor (M) and percentage of dead cells with values obtained from the validation experiment under industrial conditions.
4. Conclusions
Response surface methodology (RSM) using the Box−Behnken design was applied to study yeast growth and viability. The experiments were conducted on a large industrial scale with four variables: yeast pitching rate, fermentation temperature, wort aeration level, and total CCT filling time. Second-order polynomial equations were used to identify technological parameters that optimise yeast management.
The yeast biomass increased proportionally with the wort aeration and fermentation temperature but decreased as the yeast pitching rate increased. In contrast, the filling method had no clear impact on the biomass growth. The relationship with the yeast viability differed: the proportion of dead cells increased with a higher yeast dose, greater aeration rate, and longer filling time. However, fermentation temperature variations within the range of 8.5–11.5 °C showed no clear effect on yeast viability at an industrial scale.
The potential technological benefits that support the observed phenomena can be linked to an improvement in the production process through a more stable fermentation process.
These results suggest that RSM modelling can effectively predict and control key fermentation parameters under industrial conditions, ensuring optimal yeast growth and maximum viability. This was further confirmed by validation tests conducted after the main experiments.
Research can contribute to improving the efficiency of the process. By optimizing the growth of the yeast biomass, it is possible to minimize the loss of extract resulting from the reduced consumption of wort carbohydrates for yeast multiplication. Additionally, reducing the content of dead cells, through the optimization of process parameters, contributes to improving the course of the fermentation process.
It seems possible to optimize the fermentation process further by using AI. However, this would require collecting results from the production system and equipping industrial devices with in-line probes that would provide ongoing data analysis, for example by AI modules.
Author Contributions
Conceptualization, K.K., K.Ż. and T.T.; methodology, K.K. and K.Ż.; software, K.Ż.; formal analysis, K.K.; investigation, K.K.; resources, K.K.; data curation, K.K.; writing—original draft preparation, K.K., K.Ż. and T.T.; writing—review and editing, K.K.; visualization, K.K.; supervision, K.K.; project administration, K.K. All authors have read and agreed to the published version of the manuscript.
Funding
This research received no external funding.
Data Availability Statement
The original contributions presented in this study are included in the article. Further inquiries can be directed to the corresponding author.
Conflicts of Interest
The authors declare no conflicts of interest.
References
- Albergaria, H.; Arneborg, N. Dominance of Saccharomyces Cerevisiae in Alcoholic Fermentation Processes: Role of Physiological Fitness and Microbial Interactions. Appl. Microbiol. Biotechnol. 2016, 100, 2035–2046. [Google Scholar] [CrossRef] [PubMed]
- Lodolo, E.; Kocks, J.; Axcell, B.; Brooks, M. The yeast Saccharomyces cerevisiae the main character in beer brewing. FEMS Yeast Res. 2008, 8, 1018–1036. [Google Scholar] [CrossRef]
- Kucharczyk, K.; Tuszyński, T. The effect of wort aeration on fermentation, maturation and volatile components of beer produced on an industrial scale. J. Inst. Brew. 2017, 123, 31–38. [Google Scholar] [CrossRef]
- Alves, V.; Gonçalves, J.; Figueira, J.A.; Ornelas, L.P.; Branco, R.N.; Câmara, J.S.; Pereira, J.A.M. Beer volatile fingerprinting at different brewing steps. Food Chem. 2020, 326, 126856. [Google Scholar] [CrossRef]
- Hebbly, M.; Brickwedde, A.; Bolat, I.; Driessen, M.R.M.; de Hulster, E.A.F.; van den Broek, M.; Daran-Lapujade, P. S. cerevisiae × S. eubayanus interspecific hybrid, the best of both worlds and beyond. FEMS Yeast Res. 2015, 15, fov005. [Google Scholar] [CrossRef] [PubMed]
- Urbina, K.; Villarreal, P.; Nespolo, R.F.; Salazar, R.; Santander, R.; Cubillos, F.A. Volatile compound screening using HS-SPME-GC/MS on Saccharomyces eubayanus strains under low-temperature pilsner wort fermentation. Microorganisms 2020, 8, 755. [Google Scholar] [CrossRef]
- Goldammer, T. The Brewer’s Handbook, 3rd ed.; Apex Publishers: Haymarket, VA, USA, 2022; Chapter 4. [Google Scholar]
- Bogacka, E.; Diowksz, A. Physiological state of reused brewing yeast. Czech J. Food Sci. 2013, 3, 264–269. [Google Scholar] [CrossRef]
- Lorizzo, M.; Coppola, F.; Letizia, F.; Testa, B.; Sorrentiono, E. Role of yeasts in the brewing process: Tradition and innovation. Processes 2021, 9, 839. [Google Scholar] [CrossRef]
- Raihofer, L.; Zarnow, M.; Gastl, M.; Hutzler, M. A short history of beer brewing: Alcoholic fermentation and yeast technology over time. Embo Rep. 2022, 23, e56355. [Google Scholar] [CrossRef]
- Wang, J.; Diny, H.; Zheng, F.; Li, Y.; Liu, C.; Niu, C.; Li, Q. Physiological changes of beer brewer’s yeast during serial beer fermentation. J. Am. Soc. Brew. Chem. 2019, 1, 10–20. [Google Scholar] [CrossRef]
- Chen, H.; Fujita, M.; Feng, Q.; Clardy, J.; Fink, G.R. Tyrosol is a quorum-sensing molecule in Candida albicans. Proc. Natl. Acad. Sci. USA 2004, 101, 5048–5052. [Google Scholar] [CrossRef] [PubMed]
- Chen, A.; Si, Q.; Xu, Q.; Pan, C.; Qu, T.; Chen, J. Evaluation of stress tolerance and fermentation performance in commercial yeast strains for industrial applications. Foods 2025, 14, 142. [Google Scholar] [CrossRef] [PubMed]
- Guan, Y.; Xu, X.; Liu, C.; Wang, J.; Niu, C.; Zheng, F. Evaluating the physiology and fermentation performance of the lager yeast during very increased temperature. LWT 2023, 173, 114312. [Google Scholar] [CrossRef]
- Solgajová, M.; Francáková, H.; Dráb, S.; Tóth, Ž. Effect of temperature on the process of primary fermentation. J. Microb. Biotech. Food. Sci. 2013, 2, 1791–1799. [Google Scholar]
- Guadalupe-Daqui, M.; Chen, M.; Thompson-Witrick, K.; MacIntosh, A. Yeast morphology assessment through automated image analysis during fermentation. Fermentation 2021, 7, 44. [Google Scholar] [CrossRef]
- Guadalupe-Daqui, M.; Chen, M.; Sarnoski, P.; Goodrich-Schneider, R.; MacIntosh, A. Impact of reduced (vacuum) pressure on yeast fermentation as assessed using standard methods and automated image analysis. Fermentation 2023, 9, 155. [Google Scholar] [CrossRef]
- Lara, J.; Dewasme, L.; Escoto, H.; Wouwer, A. Parameter estimation of dynamic beer fermentation models. Foods 2022, 11, 3602. [Google Scholar] [CrossRef]
- Verbelen, P.; Saerens, S.; Mulders, S.; Delvaux, F.; Delvaux, R. The role of oxygen in yeast metabolism during high cell density brewery fermentations. Appl. Microbiol. Cell Physiol. 2009, 82, 1143–1156. [Google Scholar] [CrossRef]
- Kalayu, G. Serial re-pitching: Its effect on yeast physiology, fermentation performance, and product quality. Ann. Microbiol. 2019, 69, 787–796. [Google Scholar] [CrossRef]
- Kucharczyk, K.; Tuszyński, T. Effect of wort filling time on fermentation, maturation and acetaldehyde content in beer. Czech J. Food Sci. 2016, 34, 265–270. [Google Scholar] [CrossRef]
- Yokoyama, A.; Ingledew, W. The effect of filling procedures on multi-fill fermentations. Tech. Q. Master Brew. Assoc. Am. 1997, 34, 320–327. [Google Scholar]
- Bellut, K.; Michel, M.; Zarnkow, M.; Hutzler, M.; Jacob, F.; Atzler, J.J.; Hoehnel, A.; Lynch, K.M.; Arendt, E.K. Screening and Application of Cyberlindnera Yeasts to Produce a Fruity, Non-Alcoholic Beer. Fermentation 2019, 5, 103. [Google Scholar] [CrossRef]
- Michel, M.; Meier-Dörnberg, T.; Jacob, F.; Schneiderbanger, H.; Haselbeck, K.; Zarnkow, M.; Hutzler, M. Optimization of Beer Fermentation with a Novel Brewing Strain Torulaspora delbrueckii Using Response Surface Methodology. Master Brew. Assoc. Am. Tech. Q. 2017, 54, 23–33. [Google Scholar]
- Puerari, C.; Strejc, J.; Souza, A.C.; Karabín, M.; Schwan, R.F.; Brányik, T. Optimization of alcohol-free beer production by lager and cachaça yeast strains using response surface methodology. J. Instig. Brew. 2016, 122, 69–75. [Google Scholar] [CrossRef]
- Kucharczyk, K.; Żyła, K.; Tuszyński, T. Simultaneous optimization of acetaldehyde and DMS concentration for better quality of beer fermented on an industrial scale. Foods 2020, 9, 1043. [Google Scholar] [CrossRef] [PubMed]
- Kwolek-Mirek, M.; Zadrag-Tęcza, R. Comparison of methods used for assessing the viability and vitality of yeast cells. FEMS Yeast Res. 2014, 14, 1068–1079. [Google Scholar] [CrossRef]
- Available online: https://chemometec.com/nucleocounters/nc-200/ (accessed on 6 January 2025).
- Nguyen, T.; Viet Man, L.V. Using high pitching rate for improvement of yeast fermentation performance in high gravity brewing. Food Res. Int. 2009, 16, 547–554. [Google Scholar]
- Verbelen, P.; Dekoninck, T.; Saerens, S.; Van Mulders, S.; Thevelein, M.; Delvaux, F. Impact of pitching rate on yeast fermentation performance and beer flavour. Appl. Microbiol. Biotechnol. 2009, 82, 155–167. [Google Scholar] [CrossRef]
- Olaniran, A.O.; Hiralal, L.; Mokoena, M.P.; Pillay, B. Flavour-active volatile compounds in beer: Production, regulation and control. J. Inst. Brew. 2017, 123, 13–23. [Google Scholar] [CrossRef]
- Jones, H.; Margaritis, A.; Stewart, R. The combined effect of oxygen supply strategy, inoculum size and temperature profile on Very-High-Gravity beer fermentations by Saccharomyces cerevisiae. J. Inst. Brew. 2007, 113, 168–184. [Google Scholar] [CrossRef]

Disclaimer/Publisher’s Note: The statements, opinions and data contained in all publications are solely those of the individual author(s) and contributor(s) and not of MDPI and/or the editor(s). MDPI and/or the editor(s) disclaim responsibility for any injury to people or property resulting from any ideas, methods, instructions or products referred to in the content. |
© 2025 by the authors. Licensee MDPI, Basel, Switzerland. This article is an open access article distributed under the terms and conditions of the Creative Commons Attribution (CC BY) license (https://creativecommons.org/licenses/by/4.0/).