Abstract
China is developing renewable energy bases (REBs) in the desert and Gobi regions. However, the intermittency of renewable energy and the temporal mismatch between peak renewable generation and peak load demand severely disrupt the power supply reliability of these REBs. Hydrogen storage technology, characterized by high energy density and long-term storage capability, is an effective method for enhancing the power supply reliability. Therefore, this paper proposes a REB planning model in the desert and Gobi regions considering seasonal hydrogen storage introduction as well as electricity-carbon-hydrogen markets trading. Furthermore, a combination scenario generation method considering extreme scenario optimization is proposed. Among which, the extreme scenarios selected through an iterative selection method based on maximizing scenario divergence contain more incremental information, providing data support for the proposed model. Finally, the simulation was conducted in the desert and Gobi regions of Yinchuan, Ningxia Province, China, primarily verifying that (1) the REB incorporating hydrogen storage can fully leverage hydrogen storage to achieve seasonal and long-term electricity transfer and utilization. The project has a payback period of 10 years, with an internal rate of return of 13.30% and a return on investment of 16.34%, thus showing significant development potential. (2) Compared to the typical battery-involved REB, the hydrogen-involved energy storage facility achieved a 59.39% annual profit, a 10.98% internal rate of return, a 14.93% return on investment, and a 1.51% improvement in power supply reliability by sacrificing a 52.49% increase in construction cost. (3) Compared to REB planning based only on typical scenarios, the power supply reliability of REBs based on the proposed combination scenario generation method improved by 8.58%.
1. Introduction
China’s deserts and Gobi regions cover a vast area, accounting for approximately 27% of the country’s total land area. These regions are rich in wind and solar energy resources, with their technically feasible development potential exceeding 60% of the national total []. Consequently, the construction of a large-scale renewable energy base (REB) containing wind turbines and photovoltaic in these areas to effectively utilize renewable resources has received significant national attention [,].
The International Energy Agency forecasts that by 2027, global renewable energy installed capacity will increase by 2400 GW compared to 2022, primarily driven by growth in photovoltaic (PV) and wind turbine (WT) installations []. Given that PV output relies primarily on solar radiation and WT output depends mainly on wind speed, desert and Gobi regions—which possess abundant solar and wind energy resources—are considered ideal geographical locations for expanding photovoltaic and wind power generation [,]. In October 2021, China first proposed the objective of planning large-scale wind and solar power base projects in the desert and Gobi regions []. By the end of 2024, China’s first batch of renewable energy bases in the desert and Gobi areas had achieved an installed capacity of 90.79 million kilowatts []. Over the past three years, the initial 50 projects have been completed and put into operation, with a total installed capacity of 90 million kilowatts. By 2030, the total planned installed capacity of national-level bases is projected to reach 455 million kilowatts []. Additionally, the Saudi Electricity Company plans to increase renewable energy installed capacity to 19 GW in the desert and Gobi regions by 2025 and install approximately 200 GW of PV by 2030 []. While the base construction is underway, relevant theoretical research is also being conducted. Ali et al. [] assessed the potential feasibility of establishing PV and WT in Kuwait’s desert region. The conclusion indicated that PV is not suitable for Kuwait, instead the development and utilization of WT projects are more feasible. Liang T et al. [] focused on new energy bases in the desert and Gobi regions and constructed an optimization model for base operations considering electricity market transactions. Qin J et al. [] combined advanced adiabatic compressed air energy storage with lithium-ion batteries and designed an optimal configuration strategy for renewable energy bases. While base construction progresses, related theoretical research is also advancing. Rui C [] designed a photovoltaic (PV) project scenario in the desert and further assessed the economic viability of the PV power station and its environmental impact. However, the output of renewable energy in REBs peaks during midday, while the load demand at the receiving end concentrates in the evening. This mismatch creates challenges for the consumption and utilization of renewable energy. Additionally, the seasonally uneven characteristics of renewable energy impose higher demands on the stable transmission capacity of REBs.
As a flexible resource, energy storage provides an effective means to counteract fluctuations of the new energy and enhance its integration level. With the advancement of various energy storage technologies, hydrogen energy storage (HES) technology containing electrolyzer (EL), hydrogen storage tank (HST), and hydrogen fuel cell (HFC) has garnered widespread attention [,]. Hydrogen energy possesses high energy density, extended storage duration, and environmental friendliness, which enables HES be able to achieve efficient storage and release of electrical energy through bidirectional electricity-hydrogen conversion []. Leveraging these advantages, HES has been introduced into renewable energy systems to enhance the consumption of renewable energy [,,]. Zhuo L et al. [] introduced HES into an integrated energy system and further designed a capacity configuration optimization model, aiming to minimize total system costs and maximize the utilization rate of HES. Wang Y et al. [] deployed HES to replace fossil fuels in the energy system and constructed a dual-layer optimization allocation model for system capacity. This approach increased the system’s energy storage benefits while reducing operational carbon emissions. Habibifar R et al. [] integrated HES with batteries to form a hybrid energy storage system and then designed a stochastic optimization model to determine the system’s optimal capacity. The research showed that the introduction of HES played a crucial role in enhancing grid flexibility and economic viability. Wu D et al. [] proposed integrating HES into multi-regional integrated energy systems in urban areas and then designed an optimized configuration strategy with profit maximization. The existing approach of integrating HES into a renewable energy system has some reference value for this paper. However, a large number of studies have not focused on its advantages in transferring electricity over seasonal and long-term time scales.
If introducing HES into REBs in desert and gobi regions (which are called DG-REBs), leveraging its seasonal storage advantage, the fluctuating and seasonally uneven characteristics of renewable energy within DG-REBs can be mitigated. Obviously, this offers an emerging approach to addressing existing challenges of REBs. Therefore, this paper proposes introducing HES into DG-REBs and further studies on the capacity configuration of the DG-REB. Capacity configuration studies often require modeling a large number of scenarios, which can lead to an exponential increase in decision variables and constraints within the model, resulting in difficulty or slow speed in model solution []. Selecting a small number of representative scenarios to replace a vast number of operational scenarios is an effective method to address the above issues []. Geng N et al. [] applied the k-means method to conduct clustering analysis of typical scenarios of an island power supply system. Zhe T et al. [] solved the operating optimization model of building a renewable energy system on the basis of generating load scenarios using the K-medoids method. Meanwhile, due to the frequent occurrence of extreme weather events in recent years, researchers have also started to recognize the importance of extreme scenarios []. Planning schemes that only consider typical scenarios cannot guarantee the safe and stable operation of the power system under extreme conditions []. Geng N et al. [] investigated a configuration optimization strategy for an energy system under extreme weather scenarios to prevent operational disruptions caused by extreme weather events. Alireza K et al. [] studied the operating strategy of a renewable energy system under generated extreme weather scenarios, aiming to enhance the system’s adaptability to varying climatic conditions. Existing studies primarily rely on empirical methods or select the most distant outlier as the extreme scenario [,]. However, empirical approaches cannot identify all extreme cases through their own rules. If the point farthest from the cluster center is chosen as the extreme scenario, it fails to account for situations where different types of extreme scenarios within the same category are dispersed along the category’s periphery. In the aforementioned refs. [,,,], the selected extreme scenarios merely serve as supplements to typical scenarios. As the penetration rate of renewable energy increases, the types of extreme scenarios will become more complex and diverse, which requires a systematic approach to generate extreme scenarios. Synthesizing the aforementioned scenario generation methods, typical scenarios usually represent average or most common conditions, overlooking the impact of extreme events. This failure to capture the true fluctuations in system stress leads to overly optimistic energy system planning outcomes. Extreme scenarios generally depict the most severe conditions observed in historical events, yet the probability of such severe scenarios occurring is extremely low. Planning energy systems based only on extreme scenarios results in overly conservative and wasteful investments, yielding extremely poor economic outcomes.
Building upon existing research, this paper proposes integrating HES into DG-REB, then establishes a capacity configuration optimization model for the DG-REB considering seasonal hydrogen storage and electricity-carbon-hydrogen market participation. The introduction of hydrogen energy storage expands the hydrogen application scenario. On this basis, utilizing the advantages of seasonal hydrogen storage to realize long-term and seasonal electricity storage, thereby the fluctuations and seasonal inconsistencies inherent in the base’s renewable energy sources can be counteracted. Furthermore, a combination scenario generation method considering extreme scenario optimization is proposed for model solution. Among which, the extreme scenarios selected through an iterative selection method based on maximizing scenario divergence contain more incremental information, thereby providing data support for the proposed model. Lastly, a simulation study of the proposed capacity configuration optimization model is conducted on a typical renewable energy base containing wind turbines and PV in desert and gobi regions, and main validated the economic sustainability of the optimal capacity configuration result, as well as the assurance of renewable energy transmission from the renewable energy base and the support for seasonal and long-term transfer via hydrogen storage under the optimal capacity configuration.
The rest of this paper is organized as follows: The structure of the DG-REB is analyzed, and a model for participating in electricity-carbon-hydrogen market transactions is constructed in Section 2. In Section 3, the capacity configuration optimization model for the DG-REB is constructed. In Section 4, the combination scenario generation method considering extreme scenario optimization is proposed. The model is simulated from several angles in Section 5, and the main conclusions are presented in Section 6.
2. The Structure of REB and Its Electricity-Carbon-Hydrogen Markets Transaction Model
2.1. The Structure of DG-REB Involving HES Introduction
The REB involving seasonal hydrogen storage primarily comprises four pieces of equipment: thermal power generation unit (TP), wind turbines (WTs), PV, and HES. HES contains three types of equipment: EL, HFC, and HST. The overall structure of REBs is illustrated in Figure 1.
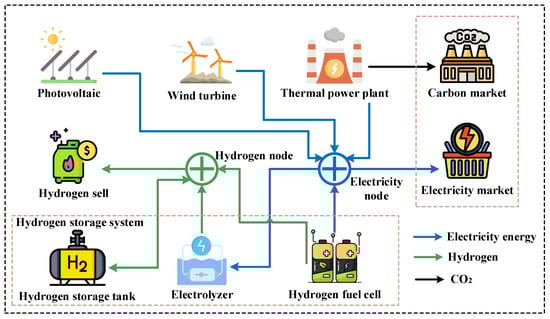
Figure 1.
Basic framework of the DG-REB in the desert and Gobi regions.
The introduction of HES in the DG-REB enables bidirectional electricity-to-hydrogen conversion and long-term, cross-seasonal energy storage in liquid hydrogen form. During seasons with high wind speed and solar irradiation, WT and PV output often exceed the transmission load demand of the electricity market. At such times, EL can convert surplus electricity into liquid hydrogen and store it in HST. Conversely, during seasons with lower wind speed and solar irradiation, WT and PV output may fail to meet transmission load demand. HFC can then convert hydrogen stored from previous seasons back into electricity to satisfy transmission requirements. This model effectively compensates for the seasonal uneven characteristics of WT and PV output. Furthermore, if hydrogen reserves remain surplus after supplementing insufficient WT and PV output, it can be sold while maintaining adequate reserves to generate additional revenue.
2.2. Electricity-Carbon-Hydrogen Markets Transaction Model of DG-REB
On the one hand, the DG-REB maintains connections with the utility grid, ensuring it can participate in electricity market transactions and enabling the cross-provincial transmission of traded electricity via the grid. On the other hand, the DG-REB can participate in carbon market transactions and generate revenue by controlling carbon emissions from TP. Furthermore, while ensuring a reliable electricity supply, DG-REBs can sell surplus hydrogen generated by EL in the hydrogen market to increase its own revenue.
(1) Electricity Market Transaction Model of DG-REB
DG-REBs can participate in electricity market transactions. According to solar radiation, wind speed, as well as the power generation characteristics of different entities within the DG-REB, it predicts the power that can be generated during each time period and then applies and sells it in the electricity market, so as to achieve its own benefit. The specific model is as follows:
where is the power delivered from the DG-REB at time . represents the maximum electrical power transmission capacity of the utility grid line. denotes the annual revenue from participating in the electricity market. indicates the price per unit of electricity transmitted.
(2) Carbon Market Transaction Model of DG-REB
DG-REBs can participate in carbon market trading to achieve carbon emission reduction through cost mechanisms. Carbon emissions from DG-REBs originate from the TP unit. When actual emissions fall below allocated carbon quotas, surplus quotas could be sold for revenue; conversely, additional quotas must be purchased to meet assessment requirements. Additionally, the WT and PV in the DG-REB can obtain Chinese certified emission reduction (CCER) to partially offset carbon emissions. This paper adopts the industry benchmark method for carbon quota allocation and CCER acquisition, while employing the emission factor method to calculate carbon emissions from the TP unit. The specific model is as follows:
where and represent the annual total carbon allocation and total carbon emissions of the DG-REB, respectively. denotes the annual CCER acquisition. represents the carbon quota benchmark for TP. and denote the CCER benchmarks for PV and WT, respectively. is the carbon emission coefficient. indicates the electricity generation of TP at time . and represent the available PV and WT output at time , respectively. and denote the PV and WT curtailment at time . and signify the annual revenue and unit carbon quota price through participation in the carbon market.
(3) Hydrogen Market Transaction Model of DG-REB
where represents the maximum hydrogen sale capacity at time , which is determined by the hydrogen transportation capability. is the hydrogen sales quality. is the unit hydrogen price. represents annual hydrogen sales revenue.
3. Capacity Configuration Optimization Model for DG-REB
3.1. Model Construction
3.1.1. Objective Function
The capacity configuration of the DG-REB should aim to minimize the total cost as the objective function.
where , , represent annual construction cost, annual operation and maintenance cost, and annual penalty cost, respectively. , , , , , represent the unit capacity construction cost of TP, WT, PV, EL, HFC, and HST, respectively. is the planned capacity. is the annual interest rate. is the lifecycle of the DG-REB. is the operation and maintenance coefficient. is the unit penalty cost of load shedding. is the contracted electricity of the DG-REB.
3.1.2. Constraints
(1) Sizing Constraints
where and represent the lower and upper limits of the equipment’s planned capacity, respectively.
(2) Operating Constraints
(a) WT
where , , and represent the cut-in, cut-out, and rated wind speed, respectively. denotes the rated power of a single WT, the value is 5 MW. indicates the output of single WT at time . represents the WT output coefficient, which is dependent on wind speed.
(b) PV
where represents the total area of PV panels in the DG-REB, which is equal to the planned capacity multiplied by the unit output PV panel area . denotes the PV efficiency coefficient. represents solar irradiance.
(c) EL
where represents the quality of hydrogen generation. denotes electricity and hydrogen conversion coefficient. represents the electric power consumed for hydrogen production.
(d) HFC
where represents consumed hydrogen. denotes the generating power of HFC. is the hydrogen and electricity conversion coefficient.
(e) HST
where represents the hydrogen storage quality in the HST at time . and denote hydrogen charging and discharging efficiency, respectively. and are charging and discharging hydrogen power. and indicate the hydrogen charging and discharging states at time , respectively, which are 0–1 variables.
(f) TP
where represents the generating power of TP. denotes the climbing coefficient.
(g) Power transmission and node balancing
Ultimately, a comprehensive capacity configuration optimization model for DG-REB is established, namely {Equations (1)–(31)}.
3.2. Model Transformation and Solution
3.2.1. Nonlinear Model Transformation
Obviously, the constraints Equations (23) and (24) in the model contain nonlinear forms where 0–1 variables are multiplied by continuous variables. This paper references ref. [] and employs the Big-M method to linearize the above nonlinear forms. For details on the conversion process and precision specifications, refer to Appendix A.
3.2.2. Model Solution
After converting the model into a standard mixed-integer linear programming model, it is solved using the MATLAB R2023a platform in conjunction with the YALMIP R2023 toolbox and the CPLEX 20.1.0 solver.
4. Combination Scenario Generation Method Design Considering Extreme Scenario Optimization
This paper proposes a combination scenario generation method to generate wind speed and solar irradiance scenarios for model solving. Specifically, typical scenarios are selected based on the K-medoids algorithm. Extreme scenarios are chosen iteratively according to the principle of maximizing scenario divergence. The key feature of this extreme scenario selection method is that each representative extreme scenario is chosen by considering not only its divergence from typical scenarios but also its divergence from existing extreme scenarios. This ensures newly selected extreme scenarios provide the maximum incremental information to the model. The steps for combination scenario generation are as follows:
Step 1: Select wind speed and solar radiation data for the whole year (8760 h) at the DG-REB to construct the basic dataset. Then, employ principal component analysis (PCA) to reduce the dimensionality of the data, thereby eliminating redundant features.
Step 2: Select typical wind speed and solar irradiance scenarios from the reduced-dimensionality dataset using the K-medoids algorithm. The procedure for the K-medoids algorithm is referenced in ref. [] and will not be elaborated upon further in this paper.
Step 3: Define relevant concepts.
Definition 1.
Compact points and dispersed points. For all points in a cluster obtained through clustering, select a threshold ε, and define all points whose Euclidean distance from the cluster centeris not bigger than as compact points. The remaining points within that cluster are dispersed points.
Definition 2.
Scenario divergence. The scenario divergence of scenario relative to scenario set Θ is defined as the average Euclidean distance from scenarioin the dataset to all scenarios in scenario set.
Step 4: Calculate the Euclidean distance between each point in cluster and the cluster center , then sort them in ascending order: .
Step 5: Select threshold . Combining the sorting and Definition 1, divide all points in the -th cluster into compact points and dispersed points to form the compact point set and the dispersed point set , respectively. Then, establish the scenario set , whose initial element is the cluster center .
Step 6: For all points in the discrete point set , calculate the scenario divergence between each point and the scenario set according to Definition 2. Define the point with the largest scenario divergence as the extreme scenario .
Step 7: Add extreme scenario to scenario set , and calculate the Euclidean distance from the remaining points in dispersed point set to extreme scenario using the method from Step 4. Then, move points with distances not bigger than to the compact point set .
Step 8: Determine whether the set of dispersed point set is the empty set. If yes, terminate, if not, return to Step 6.
Remark 1.
This paper sets the threshold , where is a parameter in the range [0, 1] and is the point in the -th cluster with the biggest Euclidean distance from the cluster center. Clearly, the closer is to 0, the smaller the threshold becomes, resulting in more extreme scenarios generation (which may include noise). The closer is to 1, the larger the threshold becomes, resulting in fewer extreme scenarios being generated (which may omit important scenarios). Firstly, in order to avoid ordinary scenarios being misjudged as extreme scenarios due to a too small value of , the lower limit of is set to 0.7. To avoid all scenarios being judged as compact points due to a too large value of , the lower limit of is set to 0.95. Furthermore, with a step size of 0.01, traverse within the range of [0.7, 0.95] to obtain the number of extreme scenarios corresponding to different . Finally, select the value corresponding to the most drastic change in the number of extreme scenarios as the specific parameter. The basis for making this choice is that the sharp decrease in the number of extreme scenarios represents the boundary point between dense areas and sparse tails, which can achieve a balance between noise avoidance and scene omission avoidance.
Ultimately, typical and extreme scenarios for wind speed and solar irradiance are generated, and the algorithmic outline of the iterative extreme scenario selection process is shown in Figure 2. Next, the capacity configuration model for the DG-REB will be solved using these generated typical and extreme scenarios.
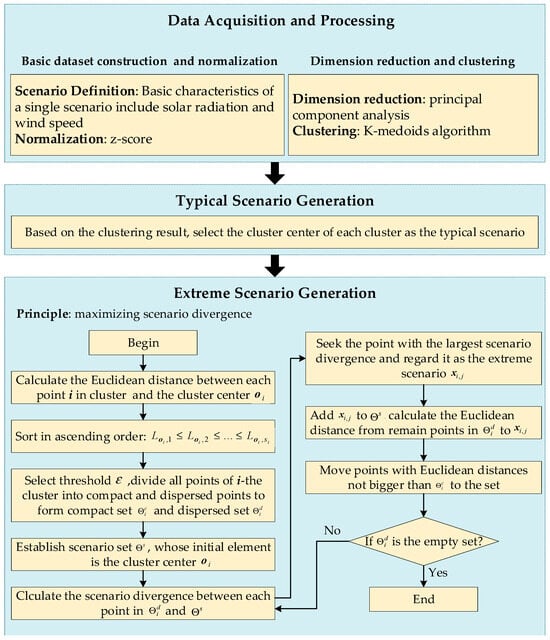
Figure 2.
Algorithmic outline of the iterative extreme scenario selection.
5. Simulation
5.1. Parameter Setting
This paper adopts the northwest region of Yinchuan, Ningxia, China, as the simulation area, where solar and wind energy resources are abundant, and some DG-REBs have been built. On this basis, a DG-REB containing HES, WT, PV, and TP is configured. All data for the planning model mentioned in this paper originate from the DG-REB in the northwest region of Yinchuan city. Meteorological data such as solar radiation and wind speed are based on DG-REB observations, with a temporal resolution of 1 h, a spatial grid size of 31 km × 31 km, and a spatial resolution of 1 km × 1 km. The technical parameters of the required equipment are listed in Table 1. Contracted electricity, hydrogen, and carbon quota prices of the DG-REB are shown in Table 2. The contracted power transmission loads for each time period are illustrated in Figure 3.

Table 1.
Technical parameters of the DG-REB.
Table 2.
Contract electricity price, hydrogen price, and carbon quota price.
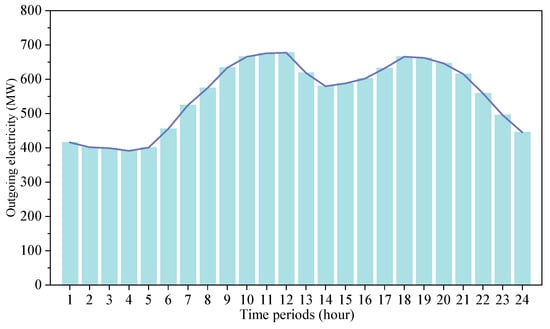
Figure 3.
External power transmission loads.
Simulation first verifies the generation effects of typical and extreme scenarios, then analyzes the capacity configuration results of the DG-REB. Finally, one typical scenario is selected for each of the four seasons (spring, summer, autumn, and winter) to examine the assurance of renewable energy transmission from the DG-REB as well as the support for seasonal, long-duration transfer via hydrogen storage under the optimal capacity configuration.
This study employs MATLAB R2023a software to solve optimization problem, and the system environment is Intel Core i7-12700H processor, 1.80 GHz CPU, and 16 GB memory.
5.2. Analysis of Typical and Extreme Scenarios Generating
As described in Section 4, this paper selects typical scenarios based on the K-medoids algorithm. The mean profiles under different clustering numbers are shown in Figure 4.
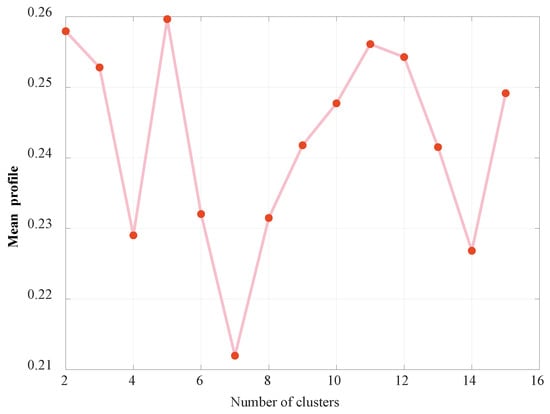
Figure 4.
Mean profile under different clustering numbers.
As shown in Figure 4, when the number of clusters increases from 2 to 15, the mean profile value fluctuates between 0.260 and 0.213. The highest mean profile value of 0.260 occurs at 5 clusters, while the lowest value of 0.213 is observed at 7 clusters. For individual scenarios, a higher profile value indicates stronger tightness within its cluster and greater separation from other clusters, thus the clustering performance is better. Accordingly, a clustering number of 5 is chosen in this study, which means dividing all historical scenarios into 5 clusters has optimal clustering performance. Figure 5 shows the generated typical and extreme scenarios of wind speed and solar radiation when the clustering number is set to 5.
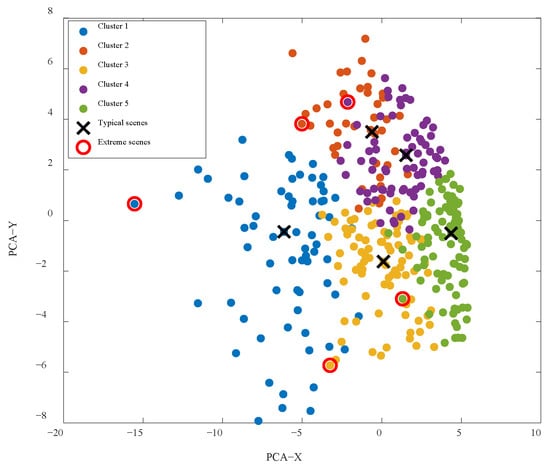
Figure 5.
Generated typical and extreme scenarios.
As shown in Figure 5, scenarios within each cluster exhibit strong tightness, indicating effective clustering. Clear separation between clusters demonstrates high dissimilarity, reflecting superior clustering performance. For typical scenarios, five clusters collectively selected five representative scenario points. Each representative point corresponds to an actual scenario and is positioned near the cluster center. For extreme scenarios, this paper selected five extreme scenario points, one from each cluster. Compared to all corresponding points within each cluster, the extreme scenario points in each cluster are the farthest from the typical scenario points, thus exhibiting the greatest intra-cluster divergence. Furthermore, the extreme scenario points within each cluster are significantly distant from one another, indicating pronounced divergence. This demonstrates that the selected extreme scenarios possess the maximum incremental information.
5.3. Analysis of Optimal Configuration Results
Based on the set parameters and generated scenarios, the model is solved to obtain the optimal configuration results for each piece of equipment in the DG-REB, as shown in Table 3. The technical and economic indicators under this result are presented in Table 4.
Table 3.
The optimal configuration results of the equipment in DG-REB.
Table 4.
Technical and economic indicators under the optimal configuration results.
As shown in Table 3 and Table 4, the total construction cost for the DG-REB is 2.61 × 10¹⁰ CNY. Among these, WT, PV, HST, and EL have larger planned capacities and higher investment proportions. The reason for this result is that, on the one hand, WT and PV have lower unit capacity construction cost compared to TP, and both generate green electricity. Planning for larger capacities of WT and PV can reduce REB construction costs while increasing carbon market revenue by lowering the overall carbon emissions of the REB. On the other hand, the large capacity construction of EL is limited by the electricity-to-hydrogen conversion efficiency. Planning for larger EL ensures the consumption of excess WT and PV output, while producing more hydrogen for sale to increase additional revenue. Furthermore, the large capacity construction of HST enables long-term hydrogen storage, thus guaranteeing sufficient hydrogen supply for HFC during periods of low WT and PV output or high external power transmission demand. The construction of WT and PV aims to generate green electricity, while EL and HST are built for green electricity conversion and storage. HFC, serving as auxiliary power generation equipment during PV and WT output shortages, has relatively smaller planned capacities and a lower investment proportion. This is because HFC has high conversion efficiency, enabling it to meet backup power generation requirements in spite of the small planned capacity. Conversely, excessively large capacities would lead to resource wastage and increased costs. Assuming a 3-year construction period with initial investments of 40%, 30%, and 30% of the total capital at the start of each year, followed by 25 years of operation, and applying an annual interest rate of 4.9%, the payback period is calculated at 10 years. The internal rate of return (IRR) is 13.30%, and the return on investment (ROI) is 16.34%. The payback period aligns with industry norms. The IRR exceeds the 4.9% annual interest rate and falls within the reasonable range for the power sector, while the 13.30% ROI also remains within the industry’s acceptable scope. The above analysis demonstrates that the DG-REB possesses inherent profitability, can recover all investments within the expected period, and exhibits sustainable operational development capacity.
Currently, on the one hand, the carbon market is gradually building up, and as it continues to mature, the profit potential for DG-REBs participating in the carbon market can be further expanded. On the other hand, the construction costs of HES equipment remain relatively high, but with the continuous advancement and widespread adoption of HES technology, there is room for further reductions in project investment costs. The synergy between these two factors endows the renewable energy base with greater development potential.
5.4. Operating Analysis of DG-REB Under Optimal Configuration Result
In order to evaluate the effectiveness of the capability assurance of renewable energy transmission, as well as the seasonal and long-term transfer effect of HES, under the optimal configuration result, one day from each of the four seasons of wind speed and solar irradiation scenarios is selected for DG-REB scheduling. The operating results are shown in Figure 6 and Figure 7.
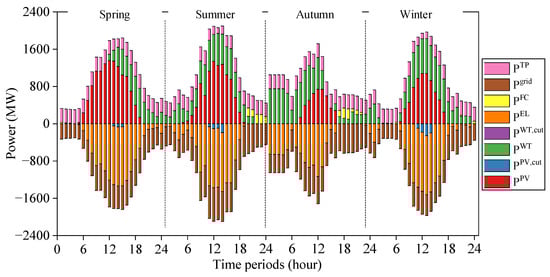
Figure 6.
Operating result of the electric node under optimal configuration.
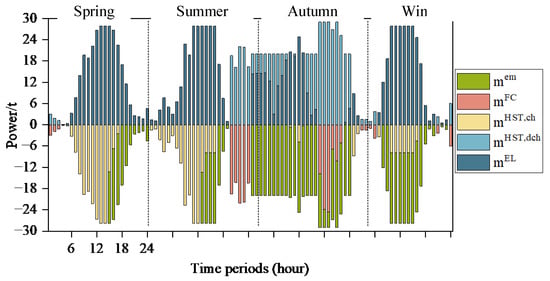
Figure 7.
Operating result of the hydrogen node under optimal configuration.
5.4.1. Capability Assurance Analysis of Renewable Energy Transmission
As shown in Figure 6, WT, PV, and TP are the primary power generation equipment, while HFC serves as auxiliary generation equipment. These four categories of power generation equipment jointly ensure the supply of contracted power transmission from the DG-REB. Under the four seasonal scenarios, load shedding is all zero, which means the DG-REB achieves fulfillment of the electricity transmission contract, thus avoiding expensive penalties for non-compliance. When the sum of PV and WT output exceeds outgoing load demand, the surplus electricity is primarily utilized by EL. Namely, through water electrolysis, this electricity is converted into hydrogen for storage (EL’s primary utilization period is concentrated between 7:00 AM and 7:00 PM), achieving high-ratio consumption of WT and PV output. When the sum of WT, PV, and TP output falls below external load demand, HFC utilizes converted hydrogen for power generation to compensate for the shortage in renewable energy output, which guarantees a reliable power supply for the DG-REB (HFC utilization primarily occurs between 1:00 AM and 2:00 AM and 9:00 PM and midnight). Therefore, the introduction of HES enhances the consumption level of PV and WT output, ensures the DG-REB possesses reliable power transmission capabilities, thereby avoiding load shedding, and achieves maximum economic returns.
The equipment operation behaviors exhibited at the electric node remain largely consistent across the four seasonal scenarios. The primary distinction lies in the varying wind speeds and solar irradiance levels across different seasons, which result in differing WT and PV outputs at the energy base. Thus, it impacts the hydrogen production period and quantity for EL, as well as the hydrogen usage period and quantity for HFC. Spring features higher solar radiation, resulting in greater surplus electricity available for EL utilization. Conversely, autumn’s lower solar radiation means only a small portion of surplus electricity is utilized by EL after the DG-REB meets external power transmission demands.
5.4.2. Effectiveness Analysis of Seasonal and Long-Term Transfer of HES
As shown in Figure 6, WT and PV output exhibit seasonal unevenness. During spring, summer, and winter, available WT and PV output is large, and thus the electricity supply capacity is strong. Conversely, autumn has a weaker electricity supply capacity. Consequently, as shown in Figure 7, during the spring, summer, and winter, the EL generates more hydrogen and stores it in the HST. It then releases more for HFC utilization in autumn to ensure that the DG-REB maintains a reliable electricity supply during this season.
Additionally, the DG-REB generates surplus hydrogen across all four seasons, selling it on the hydrogen market for profit. Among these, autumn has the highest hydrogen sales. This is because more hydrogen is stored cross-seasonally during spring, summer, and winter to enhance autumn’s power supply reliability, and when the DG-REB identifies that stored hydrogen can meet load demands and a surplus exists, it sells the surplus hydrogen to maximize revenue. Thus, the introduction of HES enables the seasonal and long-term transfer and utilization of electricity, which complements the seasonal unevenness of WT and PV output. Meanwhile, hydrogen sales broaden the revenue path of the DG-REB and improve operating economics.
5.4.3. Short-Term Operation Analysis of DG-REB
During daytime hours (7:00 to 18:00), PV output follows an initial rise followed by a decline. Specifically, PV output steadily increases from 7:00 to 12:00, reaching its peak, then decreases after 12:00. WT output fluctuates. If the combined PV and WT output exceeds the external power demand, EL needs to be activated to produce hydrogen using the surplus electricity, which is then supplied to HST. Some hydrogen can be sold during daytime hours to generate profit. When PV and WT output are sufficient during daytime hours, TP maintains low-load base operation, only briefly increasing power when PV and WT output drop sharply to ensure that the DG-REB meets the contracted daily electricity.
During nighttime hours (1:00 to 6:00 and 19:00 to 24:00), wind speeds are unstable, causing frequent fluctuations in WT output. When WT output is absent or minimal, the TP can maintain base power output due to low grid demand at night. However, between 19:00 and 24:00, when contracted electricity volumes are substantial and TP cannot fully meet contracted electricity due to capacity constraints, HFC consumes hydrogen to generate electricity, bridging this gap to ensure a reliable power supply. If WT output surges, EL will absorb excess WT output and produce hydrogen, while HST continuously replenishes hydrogen reserves for HFC power generation. Some hydrogen can also be sold during nighttime hours to generate revenue.
5.5. Comparison Analysis
5.5.1. Comparison of Scenario Generation Method
To validate the advantages of the scenario generation method proposed in this paper for generating solar irradiance and wind speed data for model solving, the following comparison case and relevant indicator are established:
Comparison case 1: Typical wind speed and solar irradiance scenarios are generated based on the K-medoids algorithm for model solving.
Set the reliability rate indicator :
where represents the index for annual solar irradiation and wind speed scenarios. denotes the actual power export value under the -th scenario obtained by scheduling DG-REB operation under the optimal planning result.
The results of equipment sizing and techno-economic indicators corresponding to the combination scenario generation model and K-medoids algorithm generation model are shown in Table 5 and Table 6, respectively. The comparative result of is presented in Table 7.
Table 5.
Comparison of equipment optimal configuration results under different scenario generation methods.
Table 6.
Comparison of technical and economic indicators under the optimal configuration results under different scenario generation methods.
Table 7.
Comparison of results under different scenario generation methods.
(1) Economic Comparison Analysis
As shown in Table 6, regarding the economy, compared with the combination scenario generation model, the total construction cost of the traditional typical scenario generation model decreased by 19.72%. The reason is that the decision-making based on typical and extreme combination scenarios is more conservative, leading to larger-capacity planning of EL, HFC, and HST (as shown in Table 5). Simultaneously, differing levels of model conservatism also impact the annual profit of the DG-REB. Utilizing the traditional typical scenario generation model for DG-REB planning shortens the payback period by one year, increases the internal rate of return by 2.86%, and boosts the return on investment by 12.48%.
(2) Reliability Comparison Analysis
As shown in Table 7, regarding the reliability of power transmission, the indicator value for the traditional typical scenario generation model is 91.42%, which is 8.58% lower than that of the combined scenario generation model. This indicates that planned DG-REB capacity based on typical and extreme combined scenarios can ensure reliable power transmission under all conditions. Conversely, the reliability based only on typical scenarios is poor. The root cause lies in the larger EL, HFC, and HST equipment capacities planned under the combination scenario generation model. The reason lies in that the larger capacity of EL, HFC, and HST equipment derived from combined scenario planning results in greater power generation potential in actual scenarios. Consequently, the threshold for meeting external load demands becomes higher, leading to enhanced reliability.
5.5.2. Comparison of the REB
To validate the advantages of the proposed REB incorporating HES, the following comparison case is established:
Comparison case 2: A typical DG-REB planning model is constructed, and the combination scenario generation method is employed for model solving. The distinction between the typical DG-REB and the HES-involved DG-REB lies in the energy storage facilities: battery (BT) is used in the typical DG-REB, so it does not participate in the hydrogen market.
The results of equipment sizing and techno-economic indicators corresponding to HES-involved and BT-involved DG-REB are shown in Table 8 and Table 9, respectively. The comparative result of is presented in Table 10.
Table 8.
Comparison of the equipment optimal configuration results under different DG-REB.
Table 9.
Comparison of technical and economic indicators under the optimal configuration results.
Table 10.
Comparison of results.
(1) Economic Comparison Analysis
As shown in Table 9, regarding the economy, compared with the HES-involved DG-REB, the total construction cost of the typical BT-involved DG-REB decreased by 52.49%. This is because the construction costs of EL, HFC, and HST are significantly higher than BT. However, the annual profit of the BT-involved DG-REB decreased by 59.39%. This primarily stems from its not participating in the hydrogen market, resulting in zero hydrogen sales revenue, as well as the emergence of penalty costs due to incomplete fulfillment of contracted electricity transmission and reduced electricity sales revenue. Further analysis reveals that compared to the HES-involved DG-REB, a typical BT-involved DG-REB exhibits a 2-year longer investment payoff period, along with a 10.98% decrease in internal rate of return and a 14.93% reduction in return on investment. This indicates that despite higher construction costs, the HES-involved DG-REB achieves greater profitability and superior overall economic performance compared to the typical BT-involved DG-REB.
(2) Reliability Comparison Analysis
As shown in Table 10, regarding the electricity transmission reliability, the typical BT-involved DG-REB achieves a reliability index of 98.49%, which is 1.51% lower than that of the HES-involved DG-REB. This indicates that the reliability of the typical BT-involved DG-REB is inferior to that of the HES-involved DG-REB. The reason lies in that although the BT-involved DG-REB plans larger PV and WT capacities, it is limited by capacity and power of BT as well as electricity losses during charging and discharging processes, the stored electricity in the BT cannot compensate for the external power supply gap when external power demand is high or PV and WT output is low.
5.6. Sensitivity Analysis
5.6.1. Fluctuations in Electricity and Hydrogen Conversion Efficiency
The electricity-to-hydrogen conversion efficiency () of the EL and the hydrogen-to-electricity conversion efficiency () of the HFC jointly determine the energy loss across the entire electricity-hydrogen-electricity closed loop, directly impacting the quality of hydrogen sold and associated revenue. Under the optimal condition, the electricity-to-hydrogen conversion efficiency and hydrogen-to-electricity conversion efficiency are = 0.022 and = 0.909, respectively. During DG-REB operation, these parameters cannot reach their optimal values in all scenarios. Therefore, under the premise of optimal planning capacity, this subsection explores the annual operating revenue and reliability of renewable energy transmission for DG-REBs under different values of and . The results are shown in Figure 8. It is assumed that both and decrease or increase by a certain percentage, with fluctuation ratios within ±20%. Values decreasing indicates that the optimal efficiency was not achieved under actual scenarios, while an increase represents efficiency gains resulting from future technology improvements for HES.
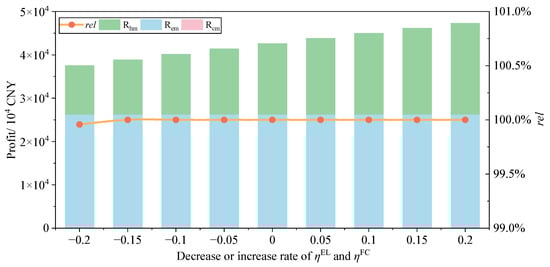
Figure 8.
DG-REB revenue and reliability with different hydrogen conversion efficiencies and .
As shown in Figure 8, under current hydrogen storage technology conditions, the electro-hydrogen conversion efficiency often fails to reach its optimal value. As the values of and deviate further from their optimal values, the annual profit of the DG-REB gradually decreases, primarily due to the gradual reduction in hydrogen sales revenue. The reliability of renewable energy transmission currently remains at 100%. However, when and decrease by 15%, reliability begins to decline. The reason for this phenomenon is that the decrease of signifies a gradual reduction of hydrogen produced per unit electrical power of the EL. Consequently, available hydrogen for HFC utilization and market selling decreases, leading to a decline in hydrogen sales revenue. Furthermore, as decreases, the reduced hydrogen is utilized by HFC for electricity generation, resulting in lower power output. This portion of electricity generation can partially ensure that the DG-REB fully meets contracted external power transmission loads. However, if both and are excessively low, the weak electricity-hydrogen-electricity conversion capacity of HES may prevent DG-REBs from achieving a reliable power supply under some scenarios. Therefore, operators of DG-REBs should monitor changes of and , strive to avoid excessively low values, so as to maximize the reliability and profitability.
With the gradual advancement of HES technology in the future, and will progressively increase, leading to a steady rise in the overall annual revenue of DG-REBs. Meanwhile, the reliability remains at 100%. This occurs because as and increase, EL generates more hydrogen using the same quality of electricity, while HFC requires less hydrogen to generate electricity. These two ensure that the DG-REB fully meets contracted external power transmission loads while retaining more hydrogen for sale to acquire profit.
5.6.2. Changes in Carbon Quota and Hydrogen Prices
Both carbon quota and hydrogen prices influence the investment payoff period and internal rate of return of DG-REBs. Hence, under the premise of optimal planning capacity, the sensitivity of the investment payoff period and internal rate of return to variations in carbon quota and hydrogen prices is analyzed. The growth rates of the investment payoff period and internal rate of return for DG-REBs under different unit carbon quota prices and hydrogen prices (compared to = 60, = 2.5 × 10⁴ in Table 2) are shown in Figure 9 and Figure 10, respectively.
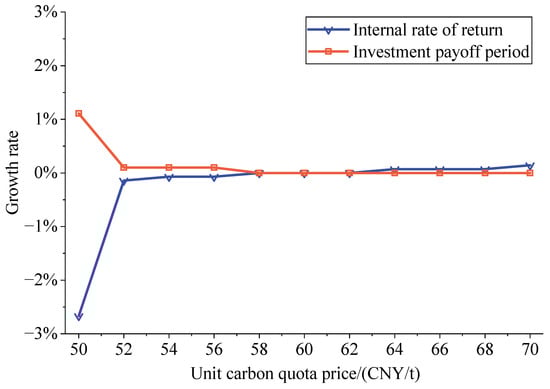
Figure 9.
DG-REB investment payoff period and internal rate of return with different unit carbon quota price.
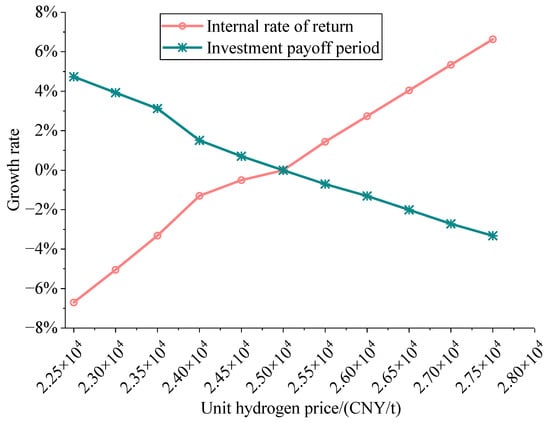
Figure 10.
DG-REB investment payoff period and internal rate of return with different hydrogen prices.
As shown in Figure 9, when the unit carbon quota price varies between 50 and 70 CNY/t, the payback period growth rate of DG-REBs ranges between 0.11% and 0%. As the unit carbon quota price increases, the payback period growth rate gradually decreases and stabilizes once the price exceeds 52. Additionally, the internal rate of return for DG-REBs ranges between −2.67% and 0.14%. As the unit carbon quota price increases, the internal rate of return growth rate gradually expands. Beyond a price of 52 CNY/t, the growth rate stabilizes and approaches 0%. Beyond a price of 62, the growth rate remains positive. This indicates that as the unit carbon quota price gradually increases within the 50–70 range, the DG-REB’s carbon revenue grows, the payback period slightly decreases, and the internal rate of return slightly increases. This occurs because the revenue generated by the DG-REB’s participation in the carbon market constitutes a very small proportion of its total revenue. Consequently, changes in the unit carbon quota price have a relatively low impact on the overall economic sensitivity of DG-REBs.
As shown in Figure 10, when the unit hydrogen price varies between 2.25 × 10⁴ and 2.75 × 10⁴ CNY/t, the payback period growth rate of DG-REB ranges from −3.32% to 4.73%. As the unit hydrogen price increases, the payback period growth rate gradually decreases, and the fluctuation rate stabilizes. Additionally, the DG-REB’s internal rate of return fluctuates between −6.71% and 6.63%. As the unit hydrogen price increases, the internal rate of return growth rate gradually expands, with the fluctuation rate stabilizing. This indicates that as the unit hydrogen price gradually increases within the range of 2.25 × 10⁴–2.75 × 10⁴ CNY/t, DG-REB’s hydrogen sales revenue progressively grows, the payback period significantly decreases, and the internal rate of return markedly increases. This is because the proportion of revenue generated by the DG-REB’s participation in the hydrogen market is relatively high within its overall revenue stream, making the DG-REB system highly sensitive to fluctuations in the unit price of hydrogen.
6. Conclusions
This paper focuses on a renewable energy base in the deserts and Gobi regions and proposes the idea of introducing hydrogen energy storage to enhance the transmission capacity. On this basis, a planning model for a renewable energy base is constructed. The main conclusions drawn from the simulation are summarized as follows.
- (1)
- The construction economics of the DG-REB stand within the industry’s reasonable range, and the DG-REB has sustainable operational capacity and development potential. Specifically, the total construction cost of the renewable energy base is CNY 2.61 × 10¹⁰, with a payback period of 10 years, an internal rate of return of 13.30% exceeding the annual interest rate of 4.9%, and a return on investment of 16.34%.
- (2)
- The introduction of hydrogen energy storage, on one hand, ensures that the DG-REB possess better economy and power supply reliability. Specifically, compared to traditional battery-involved DG-REBs, the HES-involved DG-REB achieves a 59.39% annual profit, a 10.98% internal rate of return, a 14.93% return on investment, and a 1.51% improvement in power supply reliability, despite incurring a 52.49% increase in construction cost.
- (3)
- The selected typical and extreme scenarios effectively support capacity configuration for DG-REBs. Compared to REB planning based only on typical scenarios, the power supply reliability of REBs based on the proposed combination scenario generation method improved by 8.58%.
Current limitations include the lack of detailed consideration for spatial constraints such as inter-provincial grid congestion between grid connection points and distant load centers. Future research directions are the real-time dispatch of DG-REBs under complex constraints and life cycle assessment, aiming to deeply explore the potential of DG-REBs.
Author Contributions
G.F. guided the research, established the model, and implemented the simulation; J.H. wrote this article; X.J. and H.W. are responsible for project management and investigation; M.S. checked the language and provided relevant research data. All authors have read and agreed to the published version of the manuscript.
Funding
This research was funded by Guangdong Carbon Emission Management Service Platform Project under grant number ZCNTO0570.
Data Availability Statement
The original contributions presented in the study are included in the article, further inquiries can be directed to the corresponding author.
Conflicts of Interest
Authors Jiankun Hu, Xiaoheng Ji, Haiji Wang, Guoping Feng were employed by China Energy Engineering Group Guangdong Electric Power Design Institute Co., Ltd. The remaining authors declare that the research was conducted in the absence of any commercial or financial relationships that could be construed as a potential conflict of interest.
Appendix A
The nonlinear constraints in this paper are Equations (23) and (24), where and are 0–1 variables, and are integer variables with up and down bounds. We can write this nonlinear form uniformly as follows:
where is a continuous variable, is a 0–1 variable, is an integer variable, and are the upper and lower bounds of , respectively. Let . Then Equations (A1) and (A2) can be transformed into the following linearized constraints:
The linearized constraints Equations (A3)–(A5) are fully equivalent substitutions for the nonlinear constraints Equations (A1) and (A2), rather than approximations of the nonlinear terms. Therefore, the model accuracy remains the same, and the solution process does not become unstable. The conversion from nonlinear to linear form merely introduces auxiliary variables, which does not significantly impact computational efficiency, and the solution time remains relatively short.
References
- Tan, Q.; Siru, A.; Lang, W. Assessing local people’s perceptions of ecosystem services to support land management plans in arid desert regions, northwest China. Heliyon 2024, 10, e25302. [Google Scholar] [CrossRef]
- Tang, Y.; Liu, H.; Shu, H.; He, K.; Dai, Y.; Sun, W.; Wang, J.; Han, Y. Lightning induced electromagnetic crosstalk in wind–PV hybrid systems of the Gobi desert. Results Eng. 2025, 28, 107259. [Google Scholar] [CrossRef]
- Luo, N.; Zou, J.; Piao, X.; Khoo, H.L.; Jia, K.; Fan, J.; Wei, H.; Wang, Q.; Yan, X. Distinct Spatiotemporal Patterns and Meteorological Impacts of Gobi Desert and Taklimakan Desert Dust Storms over China. Environ. Technol. Innov. 2025, 40, 104393. [Google Scholar] [CrossRef]
- Renewable Power’s Growth is Being Turbocharged as Countries Seek to Strengthen Energy Security–News, IEA. Available online: https://www.iea.org/news/renewable-power-s-growth-is-being-turbocharged-as-countries-seek-to-strengthen-energy-security (accessed on 25 October 2023).
- Renewables-Energy System, IEA. Available online: https://www.iea.org/energy-system/renewables (accessed on 25 October 2023).
- Mehdi, M.; Ammari, N.; Merrouni, A.A.; el Galllassi, H.; Dahmani, M.; Ghennioui, A. An experimental comparative analysis of different PV technologies performance, including the influence of hot-arid climatic parameters: Toward a realistic yield assessment for desert locations. Renew. Energy 2023, 205, 695–716. [Google Scholar] [CrossRef]
- Available online: https://www.gov.cn/xinwen/2021-03/13/content_5592681.htm (accessed on 11 July 2025).
- Available online: https://www.ndrc.gov.cn/fggz/fzzlgh/gjfzgh/202112/t20211225_1309715.html (accessed on 11 July 2025).
- Si, L.; Wang, P.; Cao, D. Towards sustainable development goals: Assessment of wind and solar potential in northwest China. Environ. Res. 2024, 252, 118660. [Google Scholar] [CrossRef] [PubMed]
- Al Dawsari, S.; Anayi, F.; Packianather, M. Techno-economic analysis of hybrid renewable energy systems for cost reduction and reliability improvement using dwarf mongoose optimization algorithm. Energy 2024, 313, 133653. [Google Scholar] [CrossRef]
- Al-Dousari, A.; Al-Nassar, W.; Al-Hemoud, A.; Alsaleh, A.; Ramadan, A.; Al-Dousari, N.; Ahmed, M. Solar and wind energy: Challenges and solutions in desert regions. Energy 2019, 176, 184–194. [Google Scholar] [CrossRef]
- Liang, T.; Yang, J.; Chen, M.; Cao, X.; Tan, J.; Jing, Y.; Lv, L. Energy optimization scheduling of grid-connected renewable energy hydrogen production system based on RGHS-PPO algorithm. Renew. Energy 2025, 256, 124262. [Google Scholar] [CrossRef]
- Qin, J.; Fang, F.; Tian, X. Optimization configuration of hybrid energy storage capacities for large-scale renewable energy bases indesert: A case study of Tennger, China. Energy 2025, 332, 136791. [Google Scholar] [CrossRef]
- Chang, R.; Yan, Y.; Wu, J.; Wang, Y.; Gao, X. Projected PV plants in China’s Gobi Deserts would result in lower evaporation and wind. Sol. Energy 2023, 256, 140–150. [Google Scholar] [CrossRef]
- Liu, J.; Liu, Y. Capacity optimization configuration strategy for electrochemical-hydrogen hybrid energy storage based on state-of-charge self-recovery for wind power fluctuation smoothing. J. Power Sources 2025, 657, 238228. [Google Scholar] [CrossRef]
- Wang, Y.; Song, M.; Jia, M.; Shi, L.; Li, B. TimeGAN based distributionally robust optimization for biomass-photovoltaic-hydrogen scheduling under source-load-market uncertainties. Energy 2023, 284, 128589. [Google Scholar] [CrossRef]
- Wang, H.; Yuan, L.; Wang, W.; Song, M. Distributionally robust optimization for pumped storage power station capacity expanding based on underwater hydrogen storage introduction. Energy 2024, 310, 133254. [Google Scholar] [CrossRef]
- Papathanasiou, A.F.; Pasaniotis, G.; Baltas, E. Comparison of hydro-pumped and green hydrogen as energy storage processes: A case study on Kefalonia Island, Greece. Sustain. Chem. Pharm. 2025, 48, 102216. [Google Scholar] [CrossRef]
- Wang, C.; Deng, J.; Dibble, R.W.; Li, L. A novel hydrogen energy storage system: Power regeneration employing a 70% NITE Argon Power Cycle hydrogen-fueled engine. Int. J. Hydrogen Energy 2025, 178, 151531. [Google Scholar] [CrossRef]
- Sezer, N.; Bayhan, S. Solar-powered hybrid station with integrated liquid air and gaseous hydrogen energy storage for electric vehicle charging and hydrogen refueling. Int. J. Hydrogen Energy 2025, 173, 151338. [Google Scholar] [CrossRef]
- Liu, Z.; Ma, R.; Yu, X.; Yang, B. A capacity planning method for energy storage equipment of an integrated energy system including hydrogen storage, based on an oxygen sales mechanism. Int. J. Hydrogen Energy 2025, 177, 151535. [Google Scholar] [CrossRef]
- Wang, Y.; Song, M.; Jia, M.; Yang, B. Multi-objective distributionally robust optimization for hydrogen-involved total renewable energy CCHP planning under source-load uncertainties. Appl. Energy 2023, 342, 121212. [Google Scholar] [CrossRef]
- Habibifar, R.; Awad, A.S.A.; Azzouz, M.A. Planning energy hubs with hydrogen and battery storage for flexible ramping market participation. J. Energy Storage 2025, 140, 119012. [Google Scholar] [CrossRef]
- Wu, D.; Cai, G.; Ren, S.; Huang, Y. Optimal capacity planning for hydrogen-based urban multi-region energy systems: A comprehensive approach for long-term planning considering hourly demand balance. Int. J. Hydrogen Energy 2025, 177, 151429. [Google Scholar] [CrossRef]
- Wang, Y.; Tang, L.; Yang, Y.; Sun, W.; Zhao, H. A stochastic-robust coordinated optimization model for CCHP micro-grid considering multi-energy operation and power trading with electricity markets under uncertainties. Energy 2020, 198, 117273. [Google Scholar] [CrossRef]
- Sun, G.; Chen, G.; Liu, R.; Lin, S.; Wang, X. Dynamic reconfiguration of distribution network considering typical wind−Solar-Load joint scenarios. Int. J. Electr. Power Energy Syst. 2025, 172, 111121. [Google Scholar] [CrossRef]
- Niu, G.; Ji, Y.; Zhang, Z.; Wang, W.; Chen, J.; Yu, P. Clustering analysis of typical scenarios of island power supply system by using cohesive hierarchical clustering based K-Means clustering method. Energy Rep. 2021, 7, 250–256. [Google Scholar] [CrossRef]
- Tian, Z.; Wang, Y.; Li, X.; Wen, L.; Niu, J.; Lu, Y. Typical daily scenario extraction method based on key features to promote Building renewable energy system optimization efficiency. Renew. Energy 2024, 236, 121420. [Google Scholar] [CrossRef]
- Niño, M.; Amick, B.; Williams, M.; Norton-Smith, K.; Bingham, S. Extreme weather events, climate change attitudes, and preparedness on self-rated health and depressive symptoms. J. Clim. Change Health 2025, 26, 100582. [Google Scholar] [CrossRef]
- Shi, T.; Chen, H.; Liu, Y. Extreme temperatures and residential electricity reliability in China. Util. Policy 2025, 96, 102004. [Google Scholar] [CrossRef]
- Zhou, Y. Low-carbon urban–rural modern energy systems with energy resilience under climate change and extreme events in China—A state-of-the-art review. Energy Build. 2024, 321, 114661. [Google Scholar] [CrossRef]
- Karimi, A.; Norouzi, M.; Javanroodi, K. Solar chimney combined with active cooling systems for enhanced indoor comfort and energy efficiency under extreme climates: A data-driven optimization approach. Sol. Energy 2025, 300, 113809. [Google Scholar] [CrossRef]
- AbdelMeguid, H. Adaptive thermal buffering in solar desalination: Seasonally optimized PCM selection for extreme diurnal climates. Sol. Energy Mater. Sol. Cells 2025, 289, 113687. [Google Scholar] [CrossRef]
- Ju, H.; Li, X. Multi-objective optimization of phase change material radiant floor coupled ground source heat pump under future climate scenarios. Energy 2025, 333, 137338. [Google Scholar] [CrossRef]
Disclaimer/Publisher’s Note: The statements, opinions and data contained in all publications are solely those of the individual author(s) and contributor(s) and not of MDPI and/or the editor(s). MDPI and/or the editor(s) disclaim responsibility for any injury to people or property resulting from any ideas, methods, instructions or products referred to in the content. |
© 2025 by the authors. Licensee MDPI, Basel, Switzerland. This article is an open access article distributed under the terms and conditions of the Creative Commons Attribution (CC BY) license (https://creativecommons.org/licenses/by/4.0/).