Abstract
Plastic pollution, particularly from polyethylene terephthalate (PET), poses significant environmental concerns due to ecosystem persistence and extensive packaging use. Conventional recycling methods face inefficiencies, high costs, and limited scalability, necessitating sustainable alternatives. Biodegradation via PET hydrolases offers promising eco-friendly solutions, although most natural PET-degrading enzymes are thermophilic and require energy-intensive high temperatures. In contrast, psychrophilic enzymes function efficiently at extremely low temperatures but often lack stability under moderate conditions. Therefore, this study aimed to enhance the ability of the Mors1 enzyme from Moraxella TA144 to operate effectively under mesophilic conditions, which is closer to the optimal conditions for environmental application. Three strategic hydrophobic substitutions (K93I, E221I, and R235F) were introduced in loop regions, generating the mutant variant Mors1MUT. Comparative characterization revealed that Mors1MUT retained 98% of its activity at pH 9 and displayed greater resilience across both acidic and alkaline conditions than did the wild-type enzyme. Thermal stability assays revealed that Mors1MUT preserved 61% of its activity at 40 °C and 14% at 50 °C, whereas the wild-type enzyme was fully inactivated at these temperatures. The enzymatic hydrolysis of PET films significantly improved with Mors1MUT. Gravimetric analysis revealed weight losses of 0.83% for Mors1WT and 3.46% for Mors1MUT after a 12-day incubation period. This corresponds to a 4.16-fold increase in hydrolysis efficiency, confirming the enhanced catalytic performance of the mutant variant. The improvement was further validated by scanning electron microscopy (SEM), atomic force microscopy (AFM), and attenuated total reflectance–Fourier transform infrared (ATR-FTIR) analysis. Optimization of the reaction parameters through response surface methodology (enzyme load, time, pH, temperature, and agitation) confirmed increased PET hydrolysis under mild mesophilic conditions. These findings establish Mors1MUT as a robust mesophilic PETase with enhanced catalytic efficiency and thermal stability, representing a promising candidate for sustainable PET degradation under environmentally relevant conditions.
1. Introduction
Plastic pollution has become one of the most pressing environmental issues of our time, with its pervasive presence extending even to the most remote corners of the planet. Aquatic ecosystems, from the depths of the oceans to the freshwater streams that flow through our landscapes, are particularly vulnerable to the escalating accumulation of plastic waste [1]. Plastics, which are primarily composed of long-chain synthetic polymers synthesized from petroleum-based monomers, are widely used in modern applications such as clothing fibers and containers for food and liquids. The popularity of these materials is due to their affordability, versatility, durability, resistance to leaching, and noncorrosive properties, making them indispensable in industries such as packaging, pharmaceuticals, and textiles [2]. However, this persistent material, which is designed for longevity, often fragments into microplastics and nanoplastics, which infiltrate the food chain and pose significant risks to aquatic organisms and human health. The improper disposal of polyethylene terephthalate (PET) waste, combined with its resistance to natural degradation, exacerbates these challenges, threatening the balance of ecosystems and raising critical environmental and health concerns [3]. Managing the growing accumulation of plastic waste has relied primarily on physical and chemical recycling methods, each with distinct limitations, particularly for PET. Thermomechanical recycling, a commonly used physical approach, involves melting and remolding PET but often results in the production of lower-quality materials due to polymer degradation during processing [4]. Chemical recycling, which breaks down PET into its monomers, such as terephthalic acid (TPA) and mono-/bis-hydroxyethyl terephthalate (MHET/BHET), via hydrolysis, glycolysis, or methanolysis, allows for the recovery of high-purity components that can be repolymerized into virgin-grade PET. However, this process is energy intensive, requires expensive reagents, and has yet to achieve widespread economic feasibility [5].
In contrast, biological recycling has emerged as a promising alternative, leveraging PET hydrolases (PETases) to degrade PET into ethylene glycol (EG) and TPA enzymatically under ambient temperature conditions, offering a more sustainable and environmentally friendly solution [6]. Most known PETases are thermophilic and exhibit optimal activity near the glass transition temperature of PET (~65 °C), where the polymer chains gain flexibility and become more susceptible to hydrolysis. Despite the compatibility of these enzymes with the physical properties of PET, their high temperature requirements necessitate significant energy inputs, limiting their practicality [7]. Recent advancements, however, have revealed several PETases capable of functioning at moderate temperatures, significantly improving the feasibility of enzymatic recycling. For example, Mors1 from Moraxella sp. TA144 can degrade PET at 25 °C, whereas Ple628 and Ple629 from a marine microbial consortium and PE-H from Pseudomonas aestusnigri exhibit activity at 30 °C [8]. IsPETase, derived from Ideonella sakaiensis 201-F6, operates efficiently at 40 °C, representing a significant step forward in enzymatic PET recycling. These moderate-temperature enzymes reduce energy demands and broaden the applicability of biological recycling methods [9].
Protein engineering has significantly enhanced the activity of these enzymes at ambient temperatures. For example, rational design improved the thermal stability of IsPETase, resulting in a triple mutant (IsPETaseTS) with 14-fold increased activity and an increased melting temperature compared with those of the wild-type enzyme [10]. A computational design strategy known as greedy accumulation for protein engineering (GRAPE) identified single-point mutations to increase thermal stability, producing DuraPETase with ten substitutions and a comparatively higher melting temperature than IsPETase [11]. Advancements in PET enzyme engineering have leveraged both directed evolution and machine learning to improve the efficiency and stability of IsPETase for PET degradation. Directed evolution, a method involving iterative rounds of mutation and selection, enabled the screening of over 13,000 IsPETaseTS variants, leading to the development of HotPETase. This engineered enzyme exhibited a 36 °C higher melting temperature and a 43-fold increase in activity at 65 °C, significantly enhancing its thermal stability and catalytic efficiency [12]. In addition, machine learning has emerged as a powerful tool for enzyme optimization by predicting beneficial mutations. Using computational algorithms, researchers identified three key substitutions in IsPETaseTS, resulting in the creation of FAST-PETase, which demonstrated a 38-fold improvement in activity at 50 °C. These approaches highlight the transformative potential of combining experimental and computational strategies to develop robust PET-degrading enzymes [13].
In contrast to the predominant IsPETase-lineage designs (e.g., DuraPETase, HotPETase, FAST-PETase) that target performance near or above Tg (glass transition temperature), this work positions a mesophilic, sub-Tg route on a non-IsPETase scaffold to emphasize energy-efficient PET depolymerization. This strategy complements high-temperature variants by broadening the operational window for PET recycling under mild process conditions while reducing the thermal input and integration complexity. This study conducted a comprehensive comparative analysis between the native Mors1 mesophilic enzyme and its engineered variant, which was mutated to increase its performance. The mutations targeted three specific turn regions, where hydrophobic amino acids were strategically introduced. These modifications were meticulously chosen via the DDMut server, ensuring that the substitutions were structurally constructive without compromising the three-dimensional conformation of the enzyme. This study evaluated several critical parameters, including enzyme kinetics, secondary structure integrity, thermal and pH stability, PET film degradation efficiency, and the composition of degradation byproducts. This systematic analysis aimed to assess the impact of engineered mutations on the functional properties of the enzyme, providing valuable insights into the optimization of PET-degrading enzymes.
2. Materials and Methods
2.1. Materials
The plasmid isolation and PCR Cleanup/Gel extraction kits were procured from Macherey-Nagel GmbH & Co. KG, Düren, Germany. The antibiotics Zeocine and SYPRO™ Orange were purchased from Invitrogen, Carlsbad, CA, USA, and all other restriction enzymes, protein marker (P7706), 1 kb DNA ladder (N3232) and Gibson assembly master mixes were procured from New England Biolabs, Hitchin, Hertfordshire, United Kingdom. A GeneRuler (SM1191) low-range DNA ladder was procured from Thermo Fisher Scientific, Waltham, MA, USA. A size exclusion chromatography column (17119501, HiPrep Sephacryl S-200 HR, bed dimensions 16 × 600 mm, bed height 600 mm, bed volume 120 mL, operating flow rate, max. 1.0 mL/min, pressure max. 0.15 MPa) was purchased from Cytiva, Uppsala, Sweden. The protein concentrator Amicon 10,000 molecular weight cutoff (MWCO) and polycaprolactone (PCL) were obtained from MilliporeSigma, Burlington, MA, USA. The primary anti-His-tag antibody (A-His-Ab) and secondary goat anti-rabbit IgG-HRP antibody (GAR-IgG-HRP) were obtained from Bio Bharati Life Science Pvt. Ltd., Kolkata, West Bengal, India. Amorphous PET film was procured from Kuber Metpack Pvt. Ltd., New Delhi, India.
All reagents for sodium dodecyl sulfate–polyacrylamide gel electrophoresis (SDS-PAGE) were procured from Sigma-Aldrich (St. Louis, MO, USA). The detailed SDS-PAGE methodology employed in this study is presented in the Supplementary Document. All other chemicals used in this study were of the finest quality and analytical grade. The chemicals were employed without further purification.
2.2. Strains and Media
Escherichia coli DH5α (E. coli; MTCC 1652; GenBank CP026085.1) was procured from MTCC Chandigarh, India. The vectors pPICZαA and Pichia pastoris (P. pastoris) were procured from Invitrogen Life Technologies (C18000), Carlsbad, CA, USA. For the growth and maintenance of the E. coli (1652) and P. pastoris strains, low salt Luria–Bertani (LSLB) and yeast extract peptone dextrose (YPD) media were used, respectively. For expression studies, minimal glycerol yeast extract (BMGY) and buffered minimal methanol yeast extract (BMMY) were used. All the media compositions used in this study are presented in (Table S1).
2.3. Construction of the pPICZαA-Mors1WT/MUT Plasmid and Its Transformation into E. coli DH5α
The Mors1WT gene (GenBank: X53053.1) was codon optimized per the codon usage of P. pastoris by accessing the genome annotation by NCBI (Table S2). The gene construct was synthesized by GenScript, Inc., and delivered in a pEX-A128-PET vector. The Mors1WT gene from pEX-A128-PET was amplified via PCR with primers with EcoRI and SalI sites. The sequences of the primers used to amplify the Mors1WT gene are listed in (Table 1). For the Mors1MUT construct, four distinct fragments were amplified via primers (detailed in Table 1) designed with EcoRI and SalI restriction sites. These primers incorporated specific codon mutations (indicated in Figure 1) and utilized pEX-A128-PET as a template.

Table 1.
The primers used for amplification of the Mors1WT/Mut gene with restriction sites (black, bold) and mutated codons (red, bold).
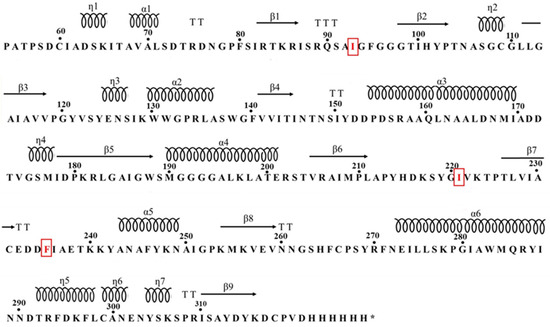
Figure 1.
Secondary structure map of the Mors1 enzyme highlighting the three site-directed mutation sites. (*) indicate stop codon. Red markers indicate loop regions where hydrophobic amino acids were substituted (K93I, E221I, R235F).
The highlighted mutations (Figure 1) were strategically chosen by introducing hydrophobic amino acids into the turn region, a critical area for maintaining protein functionality. The full protein sequences of wild-type and mutant Mors1 are presented in (Supplementary Materials). The ability of hydrophobic amino acids to increase the structural integrity of proteins is well documented, particularly under thermal and osmolar stress conditions [14]. To identify the most suitable substitutions, the Gibbs free energy changes (ΔΔG) associated with the mutations were analyzed via the advanced DDMut server. DDMut utilizes advanced deep learning techniques, combining 3D graph-based representations with convolutional layers and transformer encoders, to accurately predict Gibbs free energy changes (ΔΔG) for stabilizing and destabilizing mutations [15]. By applying DDMut, the unfolding Gibbs free energy changes (ΔΔGU) were calculated, enabling a precise distinction between stabilizing (positive ΔΔGU) and destabilizing (negative ΔΔGU) mutations [16]. The three most stabilizing mutations (K93I, E221I and R235F), which significantly contribute to protein stability, were selected to develop enhanced Mors1MUT enzymes with ΔΔGU values of 0.09, 0.29 and 0.63, respectively.
For this study, pPICZαA was selected as a shuttle vector for creating the final vector construct in E. coli DH5α, which expressed heterologous Mors1WT/Mut in P. pastoris. Restriction digestion of pPICZαA with EcoRI and SalI followed by gel extraction yielded a backbone for synthesizing the yeast expression vector.
2.4. Expression of Recombinant Mors1WT/MUT in P. pastoris
The Mors1WT/MUT plasmid was extracted from an E. coli DH5α clone and digested with PmeI. The linearized pPICZαA-Mors1WT/MUT vector was transformed into P. pastoris by electroporation according to the Invitrogen EasySelect™ Pichia expression kit user manual [17]. To select transformants, electroporated P. pastoris was inoculated on YPD agar plates supplemented with 100–300 μg/mL Zeocin. After three days of incubation at 30 °C, the colonies were thermally lysed, and colony PCR was performed via the primers listed in (Table 2). The genomic DNA of the transformed P. pastoris was isolated via a method adopted from [18,19] and sent for Sanger sequencing (GeneSpec Pvt. Ltd., Kerala, India). The presence of the pPICZαA-Mors1WT/MUT vector was sequence verified. The positive Mors1WT/MUT clones were inoculated in 50 mL of BMGY media and incubated at 30 °C and 200 RPM. After 36 h of incubation, the cells were centrifuged at 8000× g for 6 min. The supernatant was discarded, and the pellet was resuspended in 800 mL of BMMY media. The media was carefully transferred to a sterile 2 L baffled flask and incubated at 30 °C and 200 RPM for 96 h. Then, 1% (vol/vol) methanol was added to the medium every 24 h. After 96 h of incubation, the cells were centrifuged at 8000× g for 6 min, and the pellet was stored at −20 °C until use. A 3.2 g cell pellet of both x-33 and transformed Mors1WT/MUT Pichia pastoris was resuspended in 50 mL of lysis buffer (Tris-50 mM pH 7, imidazole-10 mM, NaCl-500 mM, PMSF-1 mM, and lyticase-40 U/mL) and incubated separately at 37 °C for 15 min. The lysis solution was sonicated at 33% amplitude (pulse 10 sec ON and 30 sec OFF) for 15 min at 4 °C. The lysed cells were centrifuged at 8000× g (4 °C) for 10 min, and the supernatant was stored at 4 °C for further purification. For comparative protein profile analysis, 25 µL of supernatant from X-33 and transformed Mors1WT/MUT P. pastoris strains were analyzed via 12% SDS-PAGE.
Table 2.
Independent variables and their corresponding levels for enhanced PET degradation via Mors1MUT.
2.5. Purification and Western Blotting
The nickel-nitrilotriacetic acid (Ni-NTA) columns were equilibrated with 4 column volumes of equilibration buffer (50 mM Tris pH 7, 10 mM imidazole, and 500 mM NaCl). 50 mL of the supernatant from Mors1WT/MUT P. pastoris was loaded into the respective columns. The Ni-NTA columns were washed with 3 column volumes of wash buffer (50 mM Tris pH 7, 20 mM imidazole, and 500 mM NaCl). Recombinant Mors1WT/MUT was eluted with 2.5 mL of elution buffer (50 mM Tris pH 7, 250 mM imidazole, and 500 mM NaCl). The proteins were concentrated using a 10,000 MWCO concentrator (2000× g, 4 °C, 15 min), followed by buffer exchange and purification through size-exclusion chromatography (SEC) on a Sephacryl™ S-200 high-resolution column, employing degassed baseline buffer composed of 50 mM sodium phosphate (pH 7) and 200 mM NaCl.
The enzymes Mors1WT/MUT separated via SDS-PAGE were transferred onto a nitrocellulose membrane (Bio-Rad Laboratories, Hercules, CA, USA) via precooled transfer buffer (48 mM Tris base, 39 mM glycine, 20% methanol) and a semiwet transfer apparatus. The transfer unit was run at 320 mA for 45 min. After the run, the membranes were removed via forceps, rinsed with deionized water, and incubated for 1 h in membrane-blocking solution (5% nonfat milk in 1x phosphate-buffered saline with 0.1% Tween) at 4 °C under agitation. The membranes were washed with phosphate-buffered saline with Tween 20 (PBST), and primary A-His-Ab was mixed with 10 mL of PBST buffer at a ratio of 1:5000 and incubated overnight at 4 °C under agitation. The membranes were washed with PBST for 10 min and incubated with 1x PBS, 0.1% Tween-20 with 5% nonfat milk, and 5 µL of GAR-IgG-HRP-conjugated secondary antibody. The membranes were agitated at room temperature for 1 h. The washed membranes were treated with 1 mL of Bio-Rad’s Clarity™ Western Enhanced Chemiluminescence (ECL) Substrate. The membranes were visualized with a Bio-Rad ChemiDoc system via Image Lab software (Version 6.0.1 build 34).
2.6. Mors1WT/MUT Secondary Structure, Kinetics and Stability (pH and Temperature)
The secondary structures of Mors1WT and Mors1MUT (0.2 mg/mL protein in 50 mM sodium phosphate buffer, pH 8, 50 mM NaCl) were analyzed via circular dichroism (CD) spectropolarimetry (Jasco J1500–150, Jasco Corp., Tokyo, Japan). Spectral data were collected over the wavelength range of 190–260 nm at 25 °C to evaluate the characteristic secondary structural elements of the proteins. The measurements were performed at a scan speed of 100 nm/min, a response time of 1–3 s, and a bandwidth of 1 nm to ensure high-resolution spectral acquisition. The recorded CD signals were converted to molar residue ellipticity and expressed in units of millidegrees (mdeg; deg·cm2·dmol−1) for quantitative analysis. To improve accuracy, the spectral data from multiple scans were averaged before further interpretation. This approach allowed for the reliable assessment of structural differences between the wild-type and mutant enzyme forms. The data were analyzed via the CD data analysis tool BeStSel, which estimates the fraction of secondary structure in Mors1WT/MUT [20].
The kinetic parameters, including the maximal reaction rate (Vmax) and the Michaelis–Menten constant (KM), were determined by measuring the initial reaction rates at 25 °C under optimized reaction conditions (Tris buffer, pH 9, containing 200 mM NaCl). In all the catalytic experiments, one unit (U) of enzyme activity was defined as the amount of enzyme required to hydrolyze 1 µg of PCL substrate per minute under standard assay conditions (25 °C, Tris buffer pH 9, 200 mM NaCl). The protein concentration was measured via the Bradford assay, with bovine serum albumin as the standard [21]. PCL nanoparticles, which were used as the substrate, were prepared at various concentrations (3–30 µg/mL). PCL nanoparticles were used in place of PET to obtain rapid, spectrophotometric readouts of ester hydrolysis, whereas PET typically requires multi-day incubations. The catalytic activity was assessed spectrophotometrically by monitoring the optical density at 600 nm over a ten-minute period following the initiation of the reaction with 8 μg/mL of either Mors1WT or Mors1MUT. The kinetic data were analyzed by directly fitting the Michaelis–Menten equation, , to the experimental measurements via a nonlinear least-squares fitting approach. The analysis was performed via OriginPro 2021 (version 9.8.0.200).
The pH stability of the enzyme was assessed using a range of buffers prepared at different pH values. Buffers from pH 3–8 were prepared with 50 mM McIlvaine’s buffer, while those at pH 9 were prepared with 50 mM Tris. The stability test was performed in a clear-bottom 96-well plate (Corning, USA). For each pH, the wells were preloaded with buffer containing the enzyme (8 μg/mL Mors1WT or Mors1MUT, 200 mM NaCl), and the plate was equilibrated at 25 °C for 5 min. Reactions were initiated by adding the substrate (PCL nanoparticle) suspension simultaneously to all designated wells via a multichannel pipette to reach a final PCL concentration of 0.12 mg/mL. The hydrolysis rate was monitored by measuring the decrease in the OD600 over time via a microplate reader (Varioskan™ LUX, Thermo Scientific). To determine the optimal reaction temperature for PCL hydrolysis catalyzed by Mors1WT and Mors1MUT, initial hydrolysis rates were measured at temperatures ranging from 5 °C to 50 °C. The reactions were conducted in buffer containing 50 mM Tris (pH 9), 200 mM NaCl, and 0.12 mg/mL PCL, with 8 µg/mL of either the Mors1WT/MUT enzyme. The reaction progress was monitored every 5 s via a microplate reader. Thermal inactivation (residual activity) studies were conducted by incubating purified enzymes at temperatures ranging from 20 to 80 °C for up to 6 h. Aliquots were withdrawn at predetermined time intervals, and the residual enzymatic activity was measured under standardized assay conditions. For both the pH and thermal stability assays, a reference reaction conducted at 25 °C in 50 mM Tris (pH 9) containing 200 mM NaCl, 0.12 mg/mL PCL, and 8 µg/mL Mors1WT or Mors1MUT was used as a standard to define 100% activity. The reagent composition and experimental setup were selected on the basis of previously reported findings on Mors1 activity [22].
2.7. Design and Optimization of the Mors1MUT Reaction for Enhanced PET Degradation
To optimize the degradation process, response surface methodology (RSM) was employed to assess the combined effects of five independent factors: amount of enzyme (X1), reaction time (X2), pH (X3), temperature (X4), and agitation speed (X5). A central composite design (CCD) with five levels was applied, incorporating factorial, axial, and central points to capture linear, interaction, and quadratic influences. Preliminary tests, each varying one parameter while keeping the others constant, helped determine the broad ranges for these variables (data not included in this study). PET degradation (%) was considered the response variable (Y1). The CCD matrix, along with the coded and uncoded levels, is presented in Table 2. Experimental runs were conducted in random order to minimize bias, and all assays were performed in triplicate (Table S3).
Amorphous PET films (0.8 cm × 0.8 cm, ~52 mg, 250 μm thickness) were used as substrates to evaluate the hydrolytic performance of Mors1MUT. The films were incubated in 100 mL Erlenmeyer flasks containing reaction buffer composed of 250 mM McIlvaine’s buffer (pH 5–8) or CAPS buffer (pH 9–11) supplemented with 200 mM NaCl. Different concentrations of enzyme (12–30 U) were added to the mixtures, and the reactions were carried out at 20–30 °C for 8–16 days with agitation ranging from 40 to 90 RPM. Following incubation, the PET films were retrieved, thoroughly washed with deionized water containing 20% ethanol to remove residual reactants, dried at 40 °C overnight, and weighed to determine gravimetric weight loss. The percentage weight loss was used as a direct measure of enzymatic PET degradation efficiency.
The data were analyzed via Design Expert software (version 13.0.5.0). Polynomial regression models were generated, and the significance of the linear, quadratic, and interaction terms was assessed through analysis of variance (ANOVA) at significance levels of 0.05, 0.01, and 0.001, respectively. The adequacy of the models was determined by evaluating the coefficients of determination R2, lack-of-fit tests, and coefficients of variation. Response surface plots were generated to visualize the effects of the independent variables on PET degradation efficiency.
2.8. PET Degradation by Mors1WT/MUT: SEM, AFM, and Hydrolysis Product Analysis
Amorphous PET films (five pieces, 0.8 × 0.8 cm, ~52 mg each, 250 μm thickness) were used to assess the hydrolytic efficiency of Mors1MUT under the optimized conditions described in Table 4. The films were incubated in 100 mL Erlenmeyer flasks containing 250 mM Tris buffer (pH 8.75) supplemented with 200 mM NaCl. Reactions were initiated by adding 27 U of Mors1MUT and maintained at 25.6 °C with agitation at 86 RPM for 11 days. After incubation, the films were recovered, thoroughly washed with deionized water containing 20% ethanol to remove residual components, dried at 40 °C overnight, and weighed to quantify gravimetric weight loss as a measure of PET degradation.
The soluble hydrolysis products present in the supernatants of the 12-day reactions were separated from the enzyme using a 10,000 MWCO and concentrated via a vacuum evaporator at 60 RPM at 25 °C. The hydrolysis products were analyzed via attenuated total reflectance Fourier transform infrared (ATR-FTIR) spectroscopy. ATR-FTIR analysis was performed with a Shimadzu IRAffinity-1S spectrometer (Shimadzu Corp., Japan) equipped with a Quest ATR GS10801-B single-bounce diamond accessory (Specac Ltd., England). Spectral data were recorded in the wavenumber range of 400–4000 cm−1 with a resolution of 1 cm−1, and three replicates were collected for each sample. The spectral data were processed via LabSolution IR software (Version 2.2) (Shimadzu) to identify the functional groups associated with the degradation products in both the control and the enzymatically treated samples.
Scanning electron microscopy (SEM) was utilized to evaluate the morphological changes in the PET film surfaces following 12 days of treatment with Mors1WT or Mors1MUT. The treated PET samples were sputter-coated with a thin layer of gold to improve the morphological and structural visualization of surface structures during imaging. SEM analysis was conducted via a Zeiss-Gemini microscope (Zeiss, Germany) under high-vacuum conditions to capture high-resolution images of the treated film surfaces. Images were recorded to assess the extent of surface degradation or alteration induced by enzymatic activity. The surface topography and nanoscale structural modifications of the treated PET films were further analyzed via an atomic force microscope (AFM), Cypher S (Asylum Research, Oxford Instruments, Santa Barbara, CA, USA). The samples were mounted securely onto the AFM sample holder via double-sided carbon adhesive tape. Scanning was performed in noncontact mode under ambient laboratory conditions to minimize sample deformation and ensure high-resolution imaging of the film surface. AFM measurements provided quantitative data on surface roughness and textural changes induced by enzymatic hydrolysis.
2.9. Statistical Analysis
All measurements were performed in triplicate. The data are reported as the means ± standard deviations, and a t test or ANOVA was used to find significant differences among the means. The 5% level (p ≤ 0.05) was used as a significance criterion unless explicitly stated in a particular section.
3. Results
3.1. Cloning, Expression, Purification and Validation of Mors1WT/MUT
The generation of Mors1MUT involved the assembly of four amplified fragments (73 bp, 280 bp, 309 bp, and 403 bp; Figure 2B, L1–L4) via Gibson assembly. The expected sizes of these fragments aligned with the primer design and mutation sites, indicating precise amplification and successful introduction of codon mutations. The Mors1WT gene was amplified as a 990 bp fragment (Figure 2C, L5), which was consistent with its expected size. Restriction digestion of the pPICZαA vector with EcoRI and SalI yielded a linearized backbone of 3481 bp (Figure 2C, L6). The vital features of the pPICZαA shuttle vector are illustrated in (Figure 2A). The assembly of the Mors1WT/MUT constructs into the vector was validated by single digestion, which produced a band corresponding to the size of the recombinant vector at 4450 bp (Figure 2C, L7–L8). Colony PCR further confirmed the presence of the Mors1WT/MUT genes in the transformed E. coli clones (Figure 2C, L9–L10). Sanger sequencing confirmed the homologous recombination-based insertion of the Mors1WT/MUT gene in transformed P. pastoris.
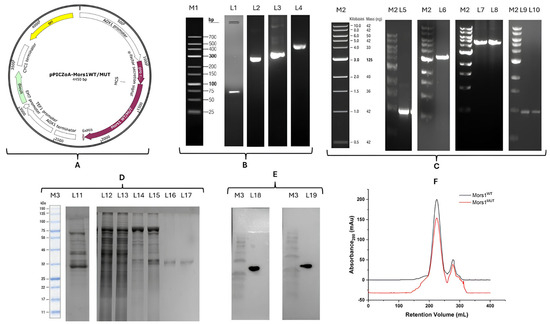
Figure 2.
Construction, expression, purification, and validation of wild-type (WT) and engineered (MUT) Mors1, confirming that the study successfully produced the enzymes used in all experiments. (A) Vector construct showing the Mors1WT/MUT gene with vital components of the pPICZαA vector; (B) PCR amplified fragments for Mors1MUT assembly, M1: Reference LR DNA maker, L1: fragment1 73 bp, L2: fragment2 280 bp, L3: fragment3 309 bp, L4: fragment4 403 bp; (C) Mors1WT gene, vector backbone and validation, M2: Reference 1 kb marker, L5: Mors1WT gene after PCR amplification 990 bp, L6: pPICZαA vector after digestion with EcoRI and SalI 3481 bp, L7–L8: pPICZαA-Mors1WT/MUT plasmid after single digestion 4450 bp, L9–L10: colony PCR showing presence of Mors1WT/MUT gene; (D) Mors1WT/MUT enzyme expression and purification, M3: reference protein marker, L11: intracellular protein fraction of wild-type P. pastoris, L12–L13: intracellular protein fraction of recombinant P. pastoris Mors1WT/MUT, respectively, L14–L15: Ni-affinity chromatography-purified Mors1WT/MUT, respectively, L16–L17: SEC purified Mors1WT/MUT (~35 kDa), respectively; (E) Western blotting, L18: Mors1WT, L19: Mors1MUT; (F) SEC profile of Mors1WT/MUT.
SDS-PAGE analysis revealed distinct protein expression profiles between wild-type P. pastoris and recombinant strains expressing Mors1WT and Mors1MUT (Figure 2D, L11–L13). The recombinant strains contained the target proteins. Ni-affinity chromatography provided partially purified protein (Figure 2D, L14–L15), whereas SEC yielded highly purified fractions (~35 kDa) for both constructs (Figure 2D, L16–L17). Western blotting (Figure 2E, L18–L19) confirmed the expression of the 6x-His-tagged recombinant enzymes, as indicated by clear ~35 kDa bands corresponding to Mors1WT and Mors1MUT. Overlapping SEC elution profiles were observed for Mors1WT and Mors1MUT (Figure 2F), indicating that both enzymes maintained similar structural integrity and folding patterns.
3.2. Comparative Analysis of Mors1WT/MUT: Secondary Structure, Kinetics, and Stability
The secondary structure of Mors1 (PDB: 8SPK; UniProt: P19833) was analyzed via circular dichroism (CD) spectroscopy to evaluate potential structural differences between the Mors1WT and Mors1MUT forms. The spectral data processed via BeStSel provided quantitative insights into the fractions of key secondary structural elements. Mors1WT presented a secondary structure composed of 18.2% α-helices, 16% β-strands, 16.5% turns, and 39.1% other structural elements. In comparison, the mutant variant Mors1MUT displayed 19.7% α-helices, 14% β-strands, 15.8% turns, and 38% other secondary structures. These values suggest that the mutation induced very minute changes in the secondary structure, particularly in the β-strand content, which decreased slightly in the mutant form. The CD spectra of Mors1WT and Mors1MUT (Figure 3A) showed significant overlap, indicating a high degree of structural similarity between the two protein variants. This observation aligns with the quantitative analysis, where only minor deviations were detected in the secondary structure composition. The predominance of the α-helix and β-strand fractions is consistent with the typical secondary structure reported for the native Mors1 protein, which comprises approximately 19.8% α-helix, 23.8% β-strand, 16.3% turns, and 40.1% other elements [23]. The structural integrity of Mors1MUT appears largely conserved despite the mutation, as evidenced by both spectral overlap and BeStSel-derived secondary structure fractions. This finding suggests that the mutation may not significantly impact the global fold of the protein.
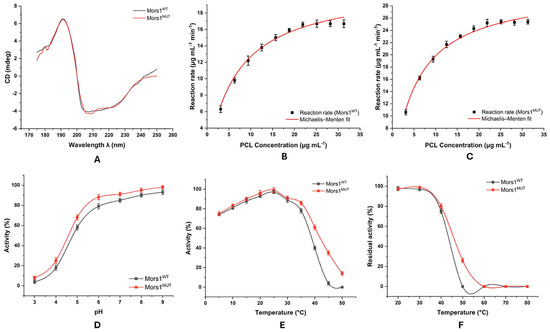
Figure 3.
Head-to-head comparison of WT and MUT Mors1, which have similar overall structures but improved catalytic performance and broader stability for the engineered variant under practical, mild conditions. (A) CD spectra of Mors1WT/MUT in sodium phosphate buffer, pH 8, at 25 °C. (B,C) Kinetic analysis of PCL nanoparticle transformation by Mors1WT/MUT. (•) Symbols represent experimental reaction rates, and continuous lines are fitted via the Michaelis-Menten equation . Optimized parameters: Vmax (Mors1WT: 21.26 ± 0.61 µg mL−1 min−1; Mors1MUT: 30.77 ± 0.56 µg mL−1 min−1) and KM (Mors1WT: 6.74 ± 0.73 µg mL−1; Mors1MUT: 5.52 ± 0.38 µg mL−1). (D) Effect of pH on Mors1WT/MUT activity. (E) Effect of temperature on Mors1WT/MUT activity. (F) Residual thermal stability of Mors1WT/MUT after 6 h of isothermal incubation (20–80 °C).
The kinetic parameters for the enzymatic transformation of PCL nanoparticles by Mors1WT and Mors1MUT were determined via Michaelis–Menten kinetics. The wild-type enzyme exhibited a Vmax of 21.26 ± 0.61 µg mL−1 min−1 and a KM of 6.74 ± 0.73 µg mL−1, with a r2 of 0.9822 and an adjusted r2 of 0.9800 (Figure 3B). In contrast, the mutant enzyme demonstrated a higher Vmax of 30.77 ± 0.56 µg mL−1 min−1 and a lower KM of 5.52 ± 0.38 µg mL−1, with a r2 of 0.9889 and an adjusted r2 of 0.9875 (Figure 3C). The observed differences in kinetic parameters between Mors1WT and Mors1MUT underscore the impact of the mutation on the catalytic properties of the enzyme. The higher Vmax of Mors1MUT indicates an improved capacity to catalyze the substrate under saturated conditions, whereas the lower KM reflects a greater substrate affinity. The enhanced performance of Mors1MUT could be attributed to mutational changes that facilitate substrate binding and product release, leading to increased catalytic efficiency. These findings align with previous studies that reported improved enzymatic activity through targeted mutations, emphasizing the potential of rational enzyme engineering for optimizing biocatalysts [24,25].
The pH stability of the enzyme was evaluated across a range of pH conditions (3–9) using the hydrolysis rate as a measure of activity (Figure 3D). The activity of both Mors1WT and Mors1MUT was observed to increase with pH, achieving peak performance at pH 8 and 9. Specifically, Mors1WT exhibited the highest activity at pH 9, with 93% relative activity (±2.31), whereas Mors1MUT demonstrated even greater stability, reaching 98% relative activity (±1.55) under the same conditions. At lower pH values (pH 3–5), Mors1MUT consistently outperformed Mors1WT. For example, at pH 3, Mors1MUT retained 8% of its activity (±1.5), whereas Mors1WT retained only 4% of its activity (±1.8). Similarly, at pH 5, Mors1MUT exhibited 68% activity (±2.41), which was significantly greater than the 58% activity (±2.51) observed for Mors1WT. This trend suggests that the mutation improved the stability under acidic conditions. At pH values between 6 and 8, both enzymes demonstrated robust activity, with Mors1MUT maintaining consistently high activity levels. At pH 8, Mors1MUT achieved 95% activity (±2.11), whereas Mors1WT exhibited 90% activity (±1.81). These results indicate that while both enzymes exhibit optimal stability under neutral to slightly alkaline conditions, Mors1MUT has superior tolerance across the tested pH range. These findings highlight the potential of Mors1MUT for applications requiring enzyme functionality in diverse pH environments. The improved stability of Mors1MUT under both acidic and alkaline conditions suggested that mutational modifications enhanced resistance to pH-induced denaturation.
The effect of temperature on the catalytic activity of Mors1WT and Mors1MUT for PCL hydrolysis was evaluated across a temperature range of 5–50 °C (Figure 3E). Both enzymes exhibited bell-shaped activity profiles, with optimal performance at 25 °C. The observed optimal activity of the wild-type enzyme was consistent with previously reported findings [26]. At this temperature, Mors1WT achieved 97% relative activity (±1.5), while Mors1MUT showed higher activity, reaching 99% (±0.53). Compared with Mors1WT, Mors1MUT consistently demonstrated marginally greater activity at lower temperatures (5–20 °C). For example, at 5 °C, Mors1MUT retained 75% of the activity (±2.17) compared with 74% (±1.21) for Mors1WT, and at 20 °C, Mors1MUT achieved 96% of the activity (±2.61) versus 93% (±1.43) for Mors1WT. This trend suggests that the mutation conferred a modest increase in catalytic efficiency at suboptimal temperatures. Beyond the optimal temperature of 25 °C, both enzymes displayed a gradual decline in activity. At 30 °C, Mors1WT retained 89% activity (±2.41) compared with 91% (±1.87) for Mors1MUT, whereas at 35 °C, the decline was more pronounced, with Mors1WT showing 78% activity (±2.11) and Mors1MUT retaining 86% activity (±1.92). At higher temperatures, the activity of both enzymes decreased sharply. At 40 °C, Mors1WT retained only 40% of its activity (±1.8) compared with 61% (±2.38) for Mors1MUT, highlighting the superior thermal stability of Mors1MUT. At 45 °C, Mors1WT retained only 4% activity (±1.81), whereas Mors1MUT showed 35% activity (±2.11). At 50 °C, the activity of Mors1WT was negligible (0%), whereas Mors1MUT retained 14% activity (±1.89). These findings highlight the improved thermal stability of Mors1MUT over Mors1WT, particularly at elevated temperatures, which is likely due to structural modifications that increase its resistance to thermal denaturation. Although both enzymes exhibited optimal performance at 25 °C, the enhanced temperature tolerance of Mors1MUT makes it particularly well suited for industrial applications. Enzymes with such versatility are preferred owing to their ability to maintain stability and functionality under varying process conditions [27].
The thermal inactivation profiles of Mors1WT and Mors1MUT were evaluated by measuring residual activity after incubation at various temperatures (20–80 °C) for up to 6 h (Figure 3F). Both enzymes exhibited high thermal stability at lower temperatures (20–30 °C) but showed significant differences in stability as the temperature increased beyond 40 °C. At 20 °C, Mors1WT retained 98% of its residual activity (±1.8), whereas Mors1MUT retained 97% of its residual activity (±1.5). Similarly, at 30 °C, both enzymes demonstrated excellent thermal stability, with Mors1MUT showing slightly greater residual activity (99% ± 0.5) than Mors1WT (97% ± 1.5). However, at 40 °C, Mors1WT retained only 75% residual activity (±2.13), whereas Mors1MUT displayed enhanced stability, maintaining 80% activity (±2.31). The disparity between the enzymes became more pronounced at higher temperatures. At 50 °C, Mors1WT was completely inactivated, resulting in 0% residual activity, whereas Mors1MUT retained 26% residual activity (±2.17). Both enzymes were entirely inactivated at 60 °C and above, with no measurable residual activity at 60 °C, 70 °C, or 80 °C. These findings highlight the superior thermal resilience of Mors1MUT compared with Mors1WT, particularly at moderately elevated temperatures (40–50 °C). The enhanced stability of Mors1MUT suggests potential amino acid replacements that confer resistance to thermal denaturation, making it a more suitable option for industrial applications requiring stability under fluctuating or moderately elevated temperatures.
3.3. Optimization of the Mors1MUT Reaction for Enhanced PET Degradation
The Mors1MUT-catalyzed PET degradation reaction was optimized via response surface methodology (RSM) with a central composite design (CCD). Five independent variables, enzyme amount (X1), reaction time (X2), pH (X3), temperature (X4), and agitation (X5), were assessed for their effects on PET degradation efficiency (%). The experimental design matrix and corresponding responses are presented in the Supplementary Data (Table S3). PET degradation values ranged from 0% to 97%, demonstrating broad variability under different reaction conditions and highlighting the importance of multivariable optimization. Analysis of variance (ANOVA) confirmed that the quadratic model was highly significant (p < 0.0001) with a non-significant lack of fit, validating model adequacy. The regression coefficient (R2 = 0.9922) adjusted R2 (0.9868) and predicted R2 (0.9641) indicated excellent agreement between the experimental and predicted values, ensuring model reliability. Among the tested parameters, the enzyme concentration, reaction time, pH, and temperature strongly positively influenced PET degradation, whereas agitation had a relatively small but statistically significant effect. The quadratic terms for all five variables were significant (p < 0.05), confirming the nonlinear influence of the reaction conditions on enzymatic hydrolysis (Table 3).
Table 3.
Regression coefficient values of different responses for enhanced PET degradation (%) via RSM.
The fitted quadratic polynomial equation describing the relationship between the variables and PET degradation was expressed as:
where A, B, C, D, and E represent the coded values for the enzyme amount, reaction time, pH, temperature, and agitation, respectively.
PET degradation (%) = −346.25 + 6.28A + 7.67B + 39.59C + 10.29D + 0.89E + 0.01AB + 0.05AC − 0.01AD + 0.004AE − 0.02BC + 0.02BD − 0.01BE − 0.12CD − 0.03CE + 0.004DE − 0.11A2 − 0.27B2 − 2.46C2 − 0.19D2 − 0.01E2
An examination of the response surface plots (Figure 4) revealed that the PET degradation efficiency increased with increasing enzyme amounts up to ~27 U, longer incubation times (10–12 days), and neutral to basic pH conditions (7–9). While temperatures in the range of 25–30 °C increased the catalytic efficiency, a further increase above 30 °C reduced the activity, which is consistent with the mesophilic nature of the enzyme. Similarly, moderate agitation (65–90 RPM) improved substrate–enzyme interactions, whereas excessive agitation negatively affected degradation, likely due to structural stress on the enzyme or substrate desorption. The optimized conditions predicted by the model were 27 U of enzyme, 11.6 days of incubation, pH 7.35, a temperature of 25.6 °C, and agitation at 86 RPM. Under these conditions, the model predicted 100% PET degradation, while experimental validation confirmed 98 ± 1.33%, demonstrating strong predictive accuracy (Table 4). These results establish that the engineered Mors1MUT achieves PET hydrolysis under mild mesophilic conditions, thereby overcoming the limitations of thermophilic PETases, which require greater energy input. This optimization study confirmed that Mors1MUT, when combined with statistical modeling, represents a highly efficient, environmentally sustainable biocatalyst for PET recycling.
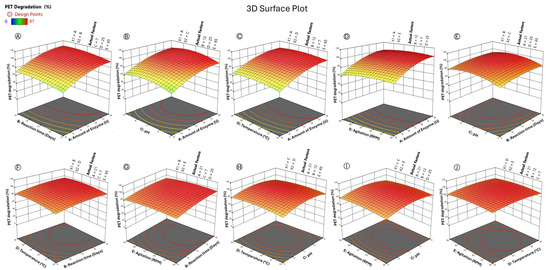
Figure 4.
Optimization of PET depolymerization via RSM revealed the most effective combination of enzyme amount, time, pH, temperature, and agitation to maximize breakdown under gentle, energy-saving conditions. Three-dimensional surface plots for the effects of (A) reaction time and amount of enzyme, (B) pH and amount of enzyme, (C) temperature and amount of enzyme, (D) agitation and amount of enzyme, (E) pH and reaction time, (F) temperature and reaction time, (G) agitation and reaction time, (H) temperature and pH, (I) agitation and pH, (J) agitation and temperature on the percentage of PET degradation.
Table 4.
Optimal conditions, along with the experimental and predicted response values under optimized settings.
3.4. PET Degrazdation by Mors1WT/MUT: SEM, AFM, and Hydrolysis Product Analysis
SEM micrographs (Figure 5A–C) revealed distinct surface morphologies among the untreated (control) and treated PET films. The control PET film (Figure 5A) exhibited a relatively smooth surface with minimal irregularities, indicative of a lack of enzymatic activity. In contrast, the surface of the PET film treated with Mors1WT (Figure 5B) displayed notable grooves and pits, reflecting moderate enzymatic degradation. These features suggest partial hydrolysis of the polymer, resulting in localized surface erosion. Furthermore, the PET film treated with Mors1MUT (Figure 5C) presented even greater surface roughness, characterized by deeper and more widespread grooves and pits than the wild-type enzyme treatment did. These observations indicate that the mutant variant possessed enhanced enzymatic activity, leading to a greater degree of surface degradation.
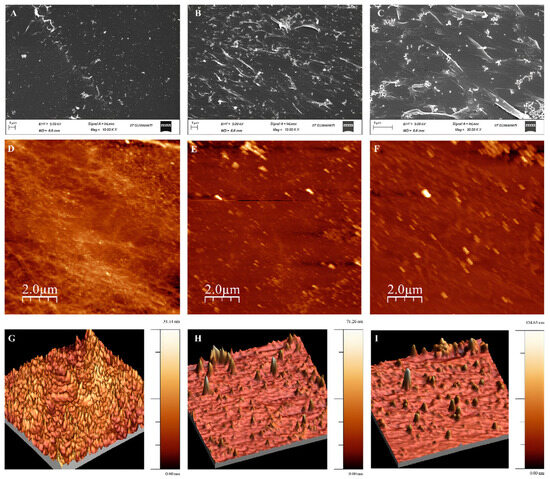
Figure 5.
Surface characterization showing that the engineered enzyme increases PET breakdown under optimized, mild conditions, combining weight loss measurements with surface imaging. Surface modifications of the amorphous PET films after 12 days of treatment with Mors1WT or Mors1MUT. SEM micrographs of (A) the control PET film, (B) the PET film treated with Mors1WT, and (C) the PET film treated with Mors1MUT; 2D and 3D AFM images of (D,G) the control PET film, (E,H) the PET film treated with Mors1WT, and (F,I) the PET film treated with Mors1MUT.
AFM imaging provides quantitative data on surface topography and roughness, supplementing the qualitative insights from SEM. The control PET film (Figure 5D,G) displayed a smooth surface with minimal roughness, as confirmed by its root mean square (RMS) roughness of 2.80 nm and roughness average of 2.16 nm. Other parameters, including peak-to-peak height (31.14 nm) and surface skewness (0.68), further validated the uniform and unaltered surface texture. The surface roughness of the PET film treated with Mors1WT (Figure 5E,H) increased, with an RMS roughness of 4.82 nm and an average roughness of 3.43 nm. The peak-to-peak height increased to 68.34 nm, and surface skewness (1.13) indicated the presence of asymmetrical surface features such as grooves and pits. These changes are consistent with partial hydrolytic degradation induced by the wild-type enzyme. The PET film treated with Mors1MUT (Figure 5F,I) presented the highest surface roughness among the samples, with an RMS roughness of 7.87 nm and an average roughness of 4.50 nm. The peak-to-peak height reached 134.63 nm, whereas the surface skewness value (3.86) and surface kurtosis (33.76) highlighted the presence of deep, sharp features. These data confirmed that Mors1MUT significantly enhanced enzymatic hydrolysis, resulting in substantial surface erosion and nanoscale structural modifications.
The progressive increase in surface roughness and the emergence of grooves and pits across the untreated, Mors1WT-treated, and Mors1MUT-treated PET films strongly support the hypothesis that enzymatic hydrolysis is the underlying mechanism of surface degradation. The superior performance of the mutant variant, as evidenced by both SEM and AFM, suggests that its modifications enhanced substrate binding or catalytic efficiency. The RMS roughness and peak-to-peak height values for the Mors1MUT-treated PET films were approximately 1.6-fold and 2-fold greater, respectively, than those for the Mors1WT-treated films, emphasizing the improved hydrolytic capacity of the mutant enzyme.
The enzymatic hydrolysis of PET films was evaluated using both the wild-type and mutant enzymes. The gravimetric analysis revealed weight losses of 0.83% for Mors1WT and 3.46% for Mors1MUT after a 12-day incubation period. These data suggest that the hydrolysis efficiency of the Mors1MUT enzyme was 4.16-fold greater than that of the wild-type enzyme, demonstrating the enhanced catalytic activity of the mutant variant. The extended hydrolysis reaction over 12 days corroborated the increased efficiency of Mors1MUT, resulting in increased production of soluble degradation products. The ATR-FTIR spectra of the untreated PET films (Figure 6) exhibited characteristic peaks at 2918 cm−1 (C-H stretching in the methylene group), 1713 cm−1 (C=O stretching in ester groups), 1407 cm−1 (C-H bending), 1243 cm−1 (C-O stretching in ester groups), 1095 cm−1 (C-O stretching), 1016 cm−1 (aromatic C-H in-plane bending), 872 cm−1 (C-H out-of-plane bending in benzene rings), 724 cm−1 (C-H deformation), and 493 cm−1 (aromatic ring vibrations). These findings align with previously reported spectral data, confirming the structural integrity of untreated PET [28]. The ATR-FTIR spectra of the hydrolysis products from both the Mors1WT and Mors1MUT enzymes (Figure 6) presented distinct peaks at 3290 cm−1 (O-H stretching in carboxylic acids), 1850 cm−1 (aromatic overtones), 1714 cm−1 (C=O stretching in carboxylic acids), 1638 cm−1 (C=C stretching in aromatic rings), 1408 cm−1 (C-H bending), 1339 cm−1 (O-H bending in phenolic groups), 1239 cm−1 (C-O stretching in esters), 1087 cm−1 (C-O stretching), 1017 cm−1 (aromatic C-H in-plane bending), and 722 cm−1 (C-H deformation in aromatic rings). These peaks confirmed the presence of TPA and MHET/BHET, which are major products of PET depolymerization [22]. Specifically, the peak at 1714 cm−1 corroborated the formation of TPA, whereas the peaks at 1239 cm−1 and 1087 cm−1 corresponded to MHET/BHET. The intense O-H stretching observed at 3290 cm−1 provided additional evidence of the accumulation of carboxylic acids during hydrolysis. The gravimetric weight loss and ATR-FTIR analysis clearly demonstrated that compared with the wild-type enzyme, Mors1MUT had a significantly greater capacity for PET hydrolysis. The ability of Mors1MUT to cleave PET more efficiently likely stemmed from the integration of hydrophobic amino acids, which improved substrate binding or catalytic turnover. The production of TPA and MHET/BHET as hydrolysis products aligned with the enzymatic depolymerization pathways of PET, confirming the specificity and effectiveness of the enzymes.
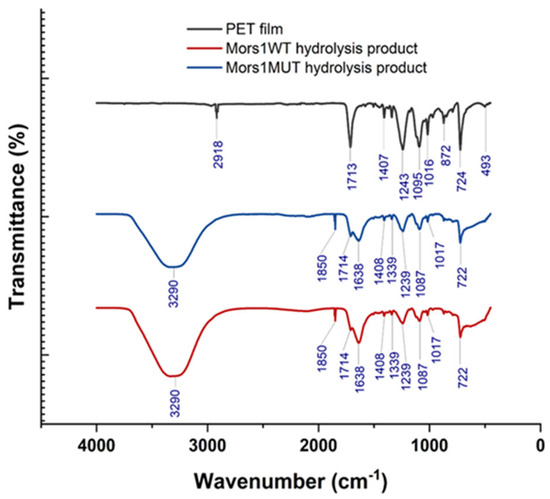
Figure 6.
ATR-FTIR spectra comparing untreated PET film with soluble products after hydrolysis by Mors1WT and Mors1MUT, showing the chemical fingerprints that confirm that PET has been hydrolytically depolymerized into its constituent monomers.
4. Discussion
In this study, the engineered Mors1 variant enables energy-efficient PET depolymerization through a mesophilic, sub-Tg catalytic route. It complements existing IsPETase-based designs that perform best at relatively high temperatures. Unlike FAST-PETase and HotPETase, which achieve their maximal activity near 50–65 °C but face rapid inactivation under extended operations, Mors1MUT retains substantial activity at 40–50 °C and demonstrates long-term stability under mild mesophilic conditions [29]. This stability is particularly relevant for industrial recycling workflows that favor low-temperature integration with sorting and washing lines. Compared with DuraPETase and LCC variants, which rely on extensive thermostabilization to handle semicrystalline substrates, the hydrophobic loop substitution of Mors1MUT enhances both the substrate affinity and kinetic turnover without compromising the overall fold, highlighting the effectiveness of targeted loop region engineering for mesophilic scaffolds [30,31].
A persistent challenge across enzymatic PET recycling systems lies in balancing catalytic efficiency and stability during prolonged operation. Even high-performing enzymes such as FAST-PETase exhibit declining activity over long residence times due to product inhibition by MHET and acidification caused by the accumulation of TPA. Mors1MUT is expected to experience similar inhibitory constraints; therefore, integration with MHETase through coexpression, enzyme fusion, or immobilized tandem systems remains a promising route for sustaining hydrolysis. Process configurations employing continuous or semicontinuous modes with in-line removal of soluble products could further prevent pH drift and sustain monomer yields at higher substrate loadings. These strategies, coupled with mild reaction conditions, provide a feasible framework for scaling mesophilic enzymatic depolymerization [32,33,34,35]. Substrate crystallinity and surface morphology continue to dictate overall process kinetics. Comparisons in the literature indicate that amorphous or pretreated PET substrates are more amenable to enzymatic hydrolysis across both mesophilic and thermophilic regimes. The quantitative correlations between the crystallinity and degradation rate suggest that pretreatments such as controlled particle size reduction, mild chemical swelling, or surface oxidation can increase accessibility and accelerate hydrolysis without increasing the thermal or energy demands [36,37]. In this context, the functionality of Mors1MUT under low-temperature conditions aligns with pretreatment workflows common to industrial washing or flake conditioning units, facilitating direct process coupling without additional thermal input.
From an industrial integration standpoint, the scalability of Mors1MUT depends on achieving high enzyme recyclability, tolerance to impurities from postconsumer feedstocks, and cost-effective biocatalyst production. Heterologous expression in Pichia pastoris offers a viable production route, but further improvements in secretion titers and enzyme recovery are essential for commercial feasibility. Reactor-level demonstrations will also require standardized benchmarking of PET conversion efficiencies under realistic conditions, including mixed plastic streams and nonamorphous substrates. Establishing such metrics will enable fair comparison with high-temperature enzymatic and chemical recycling technologies. Overall, the present study positions Mors1MUT as a robust, mesophilic biocatalyst capable of efficient PET depolymerization at sub-Tg temperatures. This approach reduces energy input, simplifies process integration, and broadens the operational window for enzymatic recycling. However, realizing full industrial potential will require cooptimization of the enzyme formulation and reactor design to overcome inhibition, maintain activity over extended cycles, and validate performance via standardized, process-relevant testing platforms.
5. Conclusions
Plastic pollution has emerged as a critical environmental issue, with PET contributing significantly due to its widespread use and persistence in ecosystems. Despite its utility in industries such as packaging and textiles, the resistance of PET to natural degradation exacerbates environmental harm, particularly in aquatic ecosystems. Current recycling methods, including thermomechanical and chemical approaches, face challenges such as energy inefficiency, high costs, and limited scalability. These limitations underscore the urgent need for alternative strategies to manage PET waste sustainably. Biodegradation, which leverages PET hydrolases for enzymatic degradation, has shown promise as a more sustainable solution. However, many naturally occurring PETases require high temperatures for optimal activity, which increases energy demands. While some PETases have demonstrated moderate-temperature activity, they often lack the thermal stability or catalytic efficiency required for practical applications.
This study focused on engineering Mors1, a PETase derived from the Antarctic bacterium Moraxella TA144, to increase its thermal stability and activity. Using the DDMut server, three strategic hydrophobic amino acid substitutions (K93I, E221I, and R235F) were introduced into turn regions of the enzyme, yielding Mors1MUT. Systematic evaluation revealed broader pH and temperature tolerance, higher substrate affinity, and improved catalytic turnover relative to those of the wild type. Importantly, optimization of the Mors1MUT reaction via statistical modeling (RSM-CCD) established the best-performing conditions (27 U of enzyme, 11.6 days, pH 8.75, 25.6 °C, 86 RPM), achieving up to 98% PET degradation. Gravimetric, spectroscopic, and surface analyses confirmed the 4.16-fold greater hydrolytic efficiency of Mors1MUT than Mors1WT. This work demonstrated that rational protein engineering combined with process optimization can transform mesophilic PETases into highly effective biocatalysts for PET degradation. The development of Mors1MUT provides a sustainable and energy-efficient pathway for enzymatic PET recycling, advancing biological solutions to one of the most pressing environmental challenges. From an application standpoint, operating below the glass transition temperature reduces the thermal energy demand and simplifies integration with existing low-temperature wash and sorting lines, and continuous or semicontinuous reactors with in-line product removal can mitigate acidification and product inhibition to sustain rates at meaningful solids loadings. For heterogeneous postconsumer feedstocks, pretreatments that lower rigidity or increase surface area, such as particle size reduction and mild chemomechanical steps, consistently accelerate initial hydrolysis and are compatible with mesophilic biocatalysts.
At scale, several challenges remain to be addressed, including kinetic slowdowns and partial enzyme deactivation under prolonged residence times and high substrate loadings, underscoring the importance of enhancing robustness under process-relevant stresses. Furthermore, inhibition by MHET and pH drift arising from TPA accumulation can significantly reduce conversion efficiency, emphasizing the need for integrated solutions such as MHETase coupling, fusion or immobilized enzyme formats, or process configurations that enable continuous extraction of soluble products to preserve catalytic activity and sustain monomer yields. Overall, the engineered Mors1 variant, operating efficiently within mesophilic and sub-Tg temperature windows, represents a promising and energy-efficient strategy for the enzymatic depolymerization of amorphous PET. Future efforts should focus on mitigating product inhibition, extending enzyme stability and recyclability, and benchmarking performance on realistic postconsumer PET streams to enable reliable and scalable implementation.
Supplementary Materials
The following supporting information can be downloaded at: https://www.mdpi.com/article/10.3390/pr13103320/s1, Table S1: Composition of different media used in this study; Table S2: Nucleotide and protein sequences for truncated Mors1WT/MUT; Table S3: Experimental design for enhanced PET degradation using Mors1MUT with independent variables and experimental and response values. Table S4: Resolving and stacking gel composition.
Author Contributions
S.S.: Writing—review and editing, Writing—original draft, Visualization, Validation, Software, Methodology, Investigation, Formal analysis, Data curation, Conceptualization. S.P.: Writing—review and editing, Writing—original draft, Validation, Supervision, Resources, Project administration, Funding acquisition, Conceptualization. All authors have read and agreed to the published version of the manuscript.
Funding
This research was funded by Department of Biotechnology, New Delhi grant number (BT/IN/EU-WR/60/SP/2018) as a part of Indo-EU Horizon 2020 project.
Data Availability Statement
The authors confirm that the data supporting the findings of this study are available within the article or its Supplementary Materials.
Acknowledgments
The authors would like to acknowledge the Department of Biosciences and Bioengineering, IIT Guwahati, for providing the infrastructural facility.
Conflicts of Interest
The authors declare that they do not possess any known financial conflicts of interest or personal associations that may have impacted the research presented.
References
- Horton, A.A. Plastic Pollution: When Do We Know Enough? J. Hazard. Mater. 2022, 422, 126885. [Google Scholar] [CrossRef]
- Bharadwaaj, S.K.; Jaudan, M.; Kushwaha, P.; Saxena, A.; Saha, B. Exploring Cutting-Edge Approaches in Plastic Recycling for a Greener Future. Results Eng. 2024, 23, 102704. [Google Scholar] [CrossRef]
- Al Mamun, A.; Prasetya, T.A.E.; Dewi, I.R.; Ahmad, M. Microplastics in Human Food Chains: Food Becoming a Threat to Health Safety. Sci. Total Environ. 2023, 858, 159834. [Google Scholar] [CrossRef]
- Lamtai, A.; Elkoun, S.; Robert, M.; Mighri, F.; Diez, C. Mechanical Recycling of Thermoplastics: A Review of Key Issues. Waste 2023, 1, 860–883. [Google Scholar] [CrossRef]
- Shojaei, B.; Abtahi, M.; Najafi, M. Chemical Recycling of PET: A Stepping-Stone toward Sustainability. Polym. Adv. Technol. 2020, 31, 2912–2938. [Google Scholar] [CrossRef]
- Hong, H.; Ki, D.; Seo, H.; Park, J.; Jang, J.; Kim, K.J. Discovery and Rational Engineering of PET Hydrolase with Both Mesophilic and Thermophilic PET Hydrolase Properties. Nat. Commun. 2023, 14, 4556. [Google Scholar] [CrossRef]
- Ding, Z.; Xu, G.; Miao, R.; Wu, N.; Zhang, W.; Yao, B.; Guan, F.; Huang, H.; Tian, J. Rational Redesign of Thermophilic PET Hydrolase LCCICCG to Enhance Hydrolysis of High Crystallinity Polyethylene Terephthalates. J. Hazard. Mater. 2023, 453, 131386. [Google Scholar] [CrossRef]
- Meyer Cifuentes, I.E.; Wu, P.; Zhao, Y.; Liu, W.; Neumann-Schaal, M.; Pfaff, L.; Barys, J.; Li, Z.; Gao, J.; Han, X.; et al. Molecular and Biochemical Differences of the Tandem and Cold-Adapted PET Hydrolases Ple628 and Ple629, Isolated from a Marine Microbial Consortium. Front. Bioeng. Biotechnol. 2022, 10, 930140. [Google Scholar] [CrossRef]
- Liu, C.; Shi, C.; Zhu, S.; Wei, R.; Yin, C.C. Structural and Functional Characterization of Polyethylene Terephthalate Hydrolase from Ideonella Sakaiensis. Biochem. Biophys. Res. Commun. 2019, 508, 289–294. [Google Scholar] [CrossRef]
- Son, H.F.; Cho, I.J.; Joo, S.; Seo, H.; Sagong, H.Y.; Choi, S.Y.; Lee, S.Y.; Kim, K.J. Rational Protein Engineering of Thermo-Stable PETase from Ideonella Sakaiensis for Highly Efficient PET Degradation. ACS Catal. 2019, 9, 3519–3526. [Google Scholar] [CrossRef]
- Sun, J.; Cui, Y.; Wu, B. GRAPE, a Greedy Accumulated Strategy for Computational Protein Engineering. Methods Enzymol. 2021, 648, 207–230. [Google Scholar] [CrossRef]
- Shroff, R.; Cole, A.W.; Diaz, D.J.; Morrow, B.R.; Donnell, I.; Annapareddy, A.; Gollihar, J.; Ellington, A.D.; Thyer, R. Discovery of Novel Gain-of-Function Mutations Guided by Structure-Based Deep Learning. ACS Synth. Biol. 2020, 9, 2927–2935. [Google Scholar] [CrossRef] [PubMed]
- Lu, H.; Diaz, D.J.; Czarnecki, N.J.; Zhu, C.; Kim, W.; Shroff, R.; Acosta, D.J.; Alexander, B.R.; Cole, H.O.; Zhang, Y.; et al. Machine Learning-Aided Engineering of Hydrolases for PET Depolymerization. Nature 2022, 604, 662–667. [Google Scholar] [CrossRef] [PubMed]
- Biswas, K.M.; DeVido, D.R.; Dorsey, J.G. Evaluation of Methods for Measuring Amino Acid Hydrophobicities and Interactions. J. Chromatogr. A 2003, 1000, 637–655. [Google Scholar] [CrossRef]
- Zhou, Y.; Pan, Q.; Pires, D.E.V.; Rodrigues, C.H.M.; Ascher, D.B. DDMut: Predicting Effects of Mutations on Protein Stability Using Deep Learning. Nucleic Acids Res. 2023, 51, W122–W128. [Google Scholar] [CrossRef]
- Vila, J.A. Proteins’ Evolution upon Point Mutations. ACS Omega 2022, 7, 14371–14376. [Google Scholar] [CrossRef]
- Invitrogen life technologies. User Manual EasySelect TM Pichia Expression Kit for Expression of Recombinant Proteins Using PPICZ and PPICZα in Pichia Pastoris. Available online: https://documents.thermofisher.com/TFS-Assets/LSG/manuals/easyselect_man.pdf (accessed on 18 August 2024).
- Offei, B.; Braun-Galleani, S.; Venkatesh, A.; Casey, W.T.; O’Connor, K.E.; Byrne, K.P.; Wolfe, K.H. Identification of Genetic Variants of the Industrial Yeast Komagataella Phaffii (Pichia pastoris) That Contribute to Increased Yields of Secreted Heterologous Proteins. PLoS Biol. 2022, 20, e3001877. [Google Scholar] [CrossRef]
- Satyam, S.; Patra, S. Xanthine Oxidase Driven Bio-Fenton System for Advanced Pollutant Degradation in Sustainable Wastewater Treatment. Int. J. Biol. Macromol. 2025, 313, 144323. [Google Scholar] [CrossRef]
- Micsonai, A.; Wien, F.; Kernya, L.; Lee, Y.H.; Goto, Y.; Réfrégiers, M.; Kardos, J. Accurate Secondary Structure Prediction and Fold Recognition for Circular Dichroism Spectroscopy. Proc. Natl. Acad. Sci. USA 2015, 112, E3095–E3103. [Google Scholar] [CrossRef]
- Bradford, M.M. A Rapid and Sensitive Method for the Quantitation of Microgram Quantities of Protein Utilizing the Principle of Protein-Dye Binding. Anal. Biochem. 1976, 72, 248–254. [Google Scholar] [CrossRef]
- Blázquez-Sánchez, P.; Engelberger, F.; Cifuentes-Anticevic, J.; Sonnendecker, C.; Griñén, A.; Reyes, J.; Díez, B.; Guixé, V.; Richter, P.K.; Zimmermann, W.; et al. Antarctic Polyester Hydrolases Degrade Aliphatic and Aromatic Polyesters at Moderate Temperatures. Appl. Environ. Microbiol. 2022, 88, e01842-21. [Google Scholar] [CrossRef]
- Furtado, A.A.; Blazquez-Sanchez, P.; Grinen, A.; Vargas, J.A.; Leonardo, D.A.; Sculaccio, S.A.; Pereira, H.M.; Diez, B.; Garratt, R.C.; Ramirez-Sarmiento, C.A. Crystal Structure of Antarctic PET-Degrading Enzyme. Available online: https://www.wwpdb.org/pdb?id=pdb_00008spk (accessed on 23 December 2024).
- Khairul Anuar, N.F.S.; Abdul Wahab, R.; Huyop, F.; Normi, Y.M.; Oyewusi, H.A.; Susanti, E. In Silico Mutagenesis on Active Site Residues of Acinetobacter haemolyticus Lipase KV1 for Improved Binding to Polyethylene Terephthalate (PET). J. Biomol. Struct. Dyn. 2024, 28, 1–23. [Google Scholar] [CrossRef]
- Tiong, E.; Koo, Y.S.; Bi, J.; Koduru, L.; Koh, W.; Lim, Y.H.; Wong, F.T. Expression and Engineering of PET-Degrading Enzymes from Microbispora, Nonomuraea, and Micromonospora. Appl. Environ. Microbiol. 2023, 89, e00632-23. [Google Scholar] [CrossRef]
- Guo, R.T.; Li, X.; Yang, Y.; Huang, J.W.; Shen, P.; Liew, R.K.; Chen, C.C. Natural and Engineered Enzymes for Polyester Degradation: A Review. Environ. Chem. Lett. 2024, 22, 1275–1296. [Google Scholar] [CrossRef]
- Jaiswal, N.; Jaiswal, P. Thermostable α-Amylases and Laccases: Paving the Way for Sustainable Industrial Applications. Processes 2024, 12, 1341. [Google Scholar] [CrossRef]
- Kauts, S.; Mishra, Y.; Yousuf, S.; Bhardwaj, R.; Singh, S.K.; Alshabrmi, F.M.; Abdurahman, M.; Vamanu, E.; Singh, M.P. Toxicological Profile of Polyethylene Terephthalate (PET) Microplastic in Ingested Drosophila melanogaster (Oregon R+) and Its Adverse Effect on Behavior and Development. Toxics 2023, 11, 782. [Google Scholar] [CrossRef] [PubMed]
- Arnal, G.; Anglade, J.; Gavalda, S.; Tournier, V.; Chabot, N.; Bornscheuer, U.T.; Weber, G.; Marty, A. Assessment of Four Engineered PET Degrading Enzymes Considering Large-Scale Industrial Applications. ACS Catal. 2023, 13, 13156–13166. [Google Scholar] [CrossRef] [PubMed]
- Pfaff, L.; Gao, J.; Li, Z.; Jäckering, A.; Weber, G.; Mican, J.; Chen, Y.; Dong, W.; Han, X.; Feiler, C.G.; et al. Multiple Substrate Binding Mode-Guided Engineering of a Thermophilic PET Hydrolase. ACS Catal. 2022, 12, 9790–9800. [Google Scholar] [CrossRef]
- Jayasekara, S.K.; Joni, H.D.; Jayantha, B.; Dissanayake, L.; Mandrell, C.; Sinharage, M.M.S.; Molitor, R.; Jayasekara, T.; Sivakumar, P.; Jayakody, L.N. Trends in In-Silico Guided Engineering of Efficient Polyethylene Terephthalate (PET) Hydrolyzing Enzymes to Enable Bio-Recycling and Upcycling of PET. Comput. Struct. Biotechnol. J. 2023, 21, 3513–3521. [Google Scholar] [CrossRef]
- Zhou, Y.; Zhang, J.; You, S.; Lin, W.; Zhang, B.; Wang, M.; Su, R.; Qi, W. High Terephthalic Acid Purity: Effective Polyethylene Terephthalate Degradation Process Based on PH Regulation with Dual-Function Hydrolase. Bioresour. Technol. 2024, 413, 131461. [Google Scholar] [CrossRef]
- Liu, F.; Wang, T.; Liu, X.H.; Xu, N.; Pan, X.L. Efficient Biodegradation and Upcycling of Polyethylene Terephthalate Mediated by Cell-Factories. Front. Microbiol. 2025, 16, 1599470. [Google Scholar] [CrossRef]
- Knott, B.C.; Erickson, E.; Allen, M.D.; Gado, J.E.; Graham, R.; Kearns, F.L.; Pardo, I.; Topuzlu, E.; Anderson, J.J.; Austin, H.P.; et al. Characterization and Engineering of a Two-Enzyme System for Plastics Depolymerization. Proc. Natl. Acad. Sci. USA 2020, 117, 25476–25485. [Google Scholar] [CrossRef]
- Das, B.; Satyam; Patra, S. Some Recent Innovations Related to Enzyme Immobilization. Biocatalyst Immobilization Foundations and Applications. In Biocatalyst immobilization; Academic Press: Cambridge, MA, USA, 2023; pp. 149–163. [Google Scholar] [CrossRef]
- Pasula, R.R.; Lim, S.; Ghadessy, F.J.; Sana, B. The Influences of Substrates’ Physical Properties on Enzymatic PET Hydrolysis: Implications for PET Hydrolase Engineering. Eng. Biol. 2022, 6, 17–22. [Google Scholar] [CrossRef]
- Thomsen, T.B.; Almdal, K.; Meyer, A.S. Significance of Poly(Ethylene Terephthalate) (PET) Substrate Crystallinity on Enzymatic Degradation. New Biotechnol. 2023, 78, 162–172. [Google Scholar] [CrossRef]


Disclaimer/Publisher’s Note: The statements, opinions and data contained in all publications are solely those of the individual author(s) and contributor(s) and not of MDPI and/or the editor(s). MDPI and/or the editor(s) disclaim responsibility for any injury to people or property resulting from any ideas, methods, instructions or products referred to in the content. |
© 2025 by the authors. Licensee MDPI, Basel, Switzerland. This article is an open access article distributed under the terms and conditions of the Creative Commons Attribution (CC BY) license (https://creativecommons.org/licenses/by/4.0/).