Abstract
The combined disaster of roof water and rock burst occurs while working faces with roof-confined water during the mining process, and poses a significant threat to mine production safety. The drainage of confined water from the coal seam roof is a key factor contributing to the risk of rock bursts during mining. To examine the impact of the drainage of roof-confined water on coal seam mining, a similar simulation method was employed to study fracture development, rock layer displacement, and fracture evolution laws in the working face under a drainage condition. The results indicated that the actual fracture height of the model aligns with the theoretical fracture height, and the model fractures extend through the drainage area. The displacement of the rock layer below the drainage area exhibits a distinct step-like distribution at the drainage boundary, whereas the displacement of the rock layer above the drainage area forms a “V” shape distribution. The gradient on the drainage side is significantly smaller than that of the non-drainage area. The number of acoustic emission events and amount of energy concentration is the highest at the boundary of the drainage module. In terms of event occurrence, the temporal concentration is 1.35 times greater than the space concentration, while in terms of energy, the temporal concentration is 2.5 times greater than the space concentration. The findings hold important theoretical and practical significance for ensuring the safety of roof water-rich working faces in mining.
1. Introduction
Roof water is one of the main factors affecting the safety of the coal mining process. Extensive research has been carried out on the distribution, detection, and prediction of roof water seepage in coal mines [1,2,3,4,5]. The Jurassic coal seam, situated in western China, and characterized by a sandstone layer roof, encompasses an area of water-rich anomalies that exhibit irregular distribution [6]. The coal mine reportedly contains a pressurized aquifer in the roof, which after drainage caused the development of local stress anomalies in the coal seam, posing a significant threat to mining safety in the affected area.
Numerous studies have been conducted on the impact of the drainage of confined roof aquifers on the safety and operation of coal seam mining. The first was the study of the damage caused by drainage to water-bearing rock formations. The second covered the influence of drainage on the rock structure and coal seam stress distribution. Finally, one study addressed the risk of rock burst caused by the combination of drainage and mining [7,8,9,10,11,12,13,14].
Model similarity analysis has been used to investigate coal seam mining, focusing on the analysis of factors such as thick and hard roofs, faults, confined water, coal seam thickness, and multi-layer coal mining. These parameters were used to analyze the experimental results of fracture development, stress distribution, vibration propagation, and confined water conductance after mining [15,16,17,18,19,20,21,22,23].
Acoustic emission monitoring was performed during the compression and tensile experimental processes for sandstone, coal samples, concrete, and other test pieces. Acoustic emission monitoring has also been utilized in model similarity experiments [24,25,26,27,28].
In a simulation of underwater mining under roof pressure, studies typically rely on the preset aquifer location while monitoring fracture development during the mining process. Constructing a drainage zone characterized by stress changes and conducting similar simulation experiments are crucial steps for studying stress distribution and disaster risks in coal mining faces under roof-confined water drainage conditions. Therefore, drainage zone construction and similar simulation experiments were conducted, and the resulting fracture development and acoustic emission monitoring data were analyzed.
2. Methods and Experimental Model Production
Model similarity analysis is a scientific method based on the principle of similarity. The process entails the development of a model that closely simulates the prototype, which is the real-life research subject, in terms of key characteristics. This model is subsequently utilized to indirectly study the properties, behaviors, or laws of the prototype. Figure 1 illustrates the model similarity experiments and the analysis process.
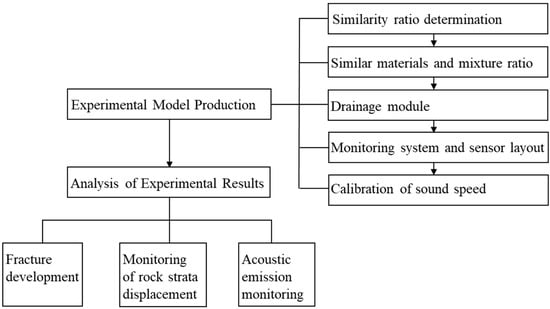
Figure 1.
Similar simulation experiments and analysis process.
In similar simulation experiments of water-bearing strata, water bags, fluid–solid coupling materials, or independent spring groups are generally used [29,30,31,32]. In this experiment, a drainage module combining porous materials and water bags was fabricated. The principle of a connector was used to regulate the water pressure of the drainage module. Based on existing research [32,33], acoustic emission monitoring and surface displacement observation were employed throughout the experimental process.
2.1. Similarity Ratio Determination
The coal thickness of the working face was 6.6 m, with an inclination angle of 0° to 2°, an average burial depth of 731.4 m, and a daily footage of approximately 8 m. The dimensions of the similar simulation experiment rack were 3 m × 1.5 m × 0.3 m. The model’s similarity ratio is shown in Table 1.

Table 1.
Model’s similarity ratio.
2.2. Simulation Materials and Mixture Ratio
The experiment used sand as the aggregate and gypsum and lime as binders. The proportion of materials in each rock layer is shown in Table 2.
Table 2.
Proportions of similar simulation materials.
2.3. Production of the Drainage Module
To study stress distribution and rock movement during the drainage process, a drainage module was constructed using water bags and porous materials. The module consisted of specially designed water bags (two) and porous materials, with a density of 1500 kg/m3 and a length of about 1 m. Through proportioning experiments, porous materials with a water–cement ratio of 1:1 were selected for drainage module production.
2.4. Monitoring System and Sensor Layout
The experimental monitoring process utilizes acoustic emission monitoring (DS5). The sensor layout principle is designed to cover both the mining and fracture areas, with four sensors arranged inside the fracture zone to enhance the monitoring effectiveness. The sensor location, drainage area location, and excavation range are illustrated in Figure 2.
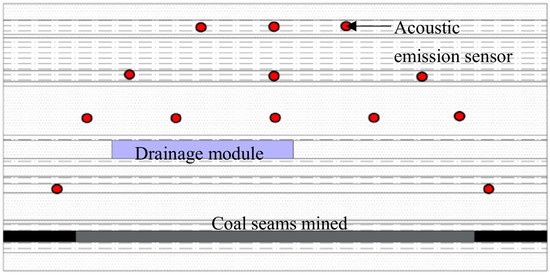
Figure 2.
Similar simulation experiment measuring point layout.
2.5. Calibration of Acoustic Emission Velocity During the Experimental Process
Lead breakage experiments were conducted on similar simulation models before mining, as shown in Figure 3. These experiments included a lead break test and waveform pickup.
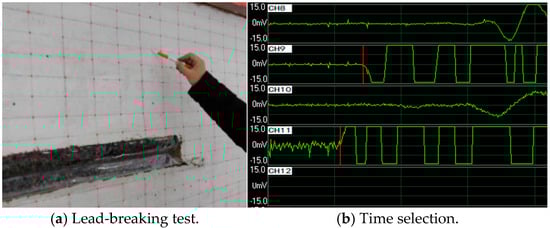
Figure 3.
Sound velocity correction.
As illustrated in Figure 3, the coordinates of the lead break test position (1200 mm, 830 mm) were determined using sensors #9 and #11 to obtain a wave velocity of 845 m/s.
3. Analysis of Experimental Results
The analysis of experimental results covers three key aspects: fracture development, rock strata displacement, and acoustic emission monitoring results. The fracture development analysis verifies the rationality of experimental fracture evolution and drainage modules. Meanwhile, the analysis of rock strata displacement and acoustic emission monitoring results assess the impact of roof-confined water drainage on the mining face.
3.1. Fracture Development
- (1)
- Height of fracture development in similar simulation experiments
The development of fractures during the experiment is directly related to the excavation distance of the model. The actual fracture development height is recorded during the experiment, while the theoretical height of the fracture is calculated as half of the width of the short side of the mining range. The relationship between the actual and theoretical fracture heights, as well as the number of model excavations, are shown in Figure 4.
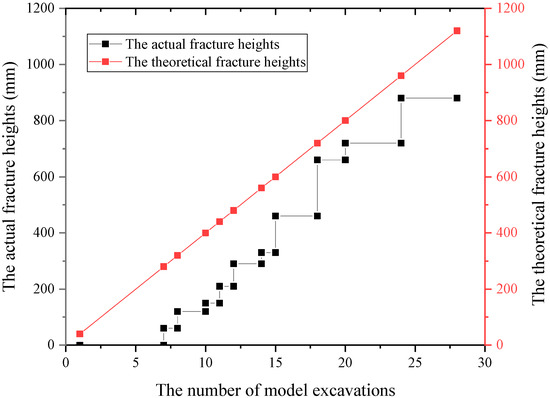
Figure 4.
The relationship between the actual and theoretical fracture heights and the number of model excavations.
As illustrated in Figure 4, the simulated actual fracture development height exhibits a stepped upward trend, which is generally linear and aligns with the theoretical fracture development height. However, the actual fracture development height remains below the theoretical value.
- (2)
- The influence of drainage modules on fracture propagation
In the early stage of the experiment, the fracture expansion did not reach the drainage module. In the middle stage, once the fracture expansion reached the drainage module, the rock fracture penetrated it, as shown in Figure 5. The drainage module had minimal influence on fracture propagation, and its impact remained controllable throughout the experiment. Additionally, the drainage module provided continuous support for the overlying rock during the experiment. The rationality of the drainage module simulation has been verified, successfully replicating both drainage and supporting functions in the rich water anomaly zone.
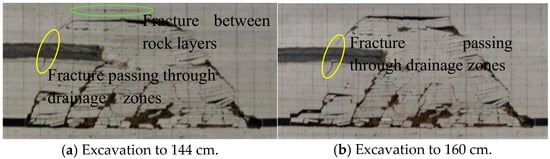
Figure 5.
Fracture development during the experimental process.
3.2. Monitoring of Rock Strata Displacement
Five displacement monitoring lines were designed above the coal seam, numbered #1 to #5, and positioned at distances of 30 mm, 130 mm, 330 mm, 530 mm, and 880 mm from the coal seam. Among them, displacement monitoring lines #1 to #3 are located below the drainage module, while lines #4 and #5 are located above it. Five monitoring nodes were established based on chronological order and degree of fracture development. Data extraction was performed for each of the five rock strata displacement monitoring lines. The chronological analysis of these results is presented in Figure 6.
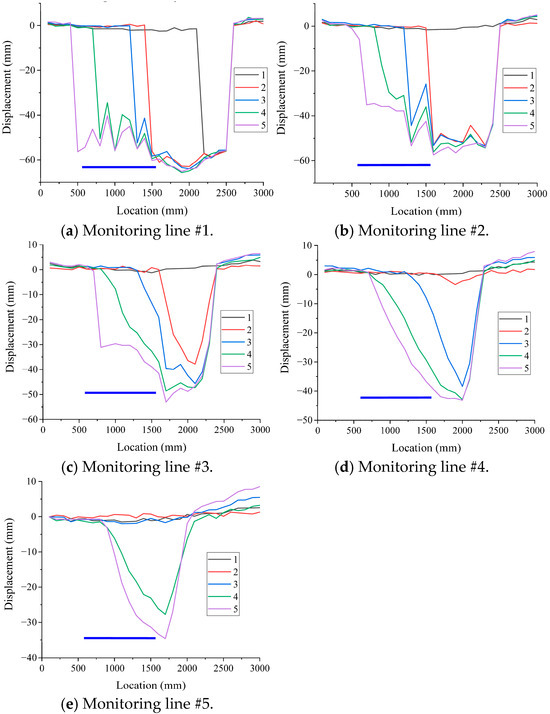
Figure 6.
Time sequence relationship of each monitoring line. (blue lins are the location of the Drainage area).
As shown in Figure 6, during the experiment, the maximum subsidence values recorded for displacement monitoring lines #1 to #5 were 65 mm, 57 mm, 53 mm, 43 mm, and 35 mm, respectively. The monitoring results of the five displacement monitoring lines indicate three distinct patterns. Displacement monitoring lines #1 and #2 exhibit similar trends, characterized by pronounced step-like shapes on both sides of the drainage module boundary, with settlement difference exceeding 10 mm between the steps. In contrast, displacement monitoring lines #4 and #5 also display similar trends, showing a symmetrical distribution on either side of the maximum subsidence point. However, a significant difference in gradient is observed between the drainage and non-drainage areas, with a gradient ratio ranging from 1.5 to 4.4 on both sides. Displacement monitoring line #3 presents a transitional behavior. In the early stage of the experiment, its results resemble those of lines #4 and #5. However, in the later stage, its displacement patterns align more closely with those of lines #1 and #2.
3.3. Acoustic Emission Monitoring
Based on the lead break test results, acoustic emission events recorded during the experiment were mapped using a planar model. The locations of all acoustic emission events are compared with the final fracture results at the end of the experiment, as shown in Figure 7.
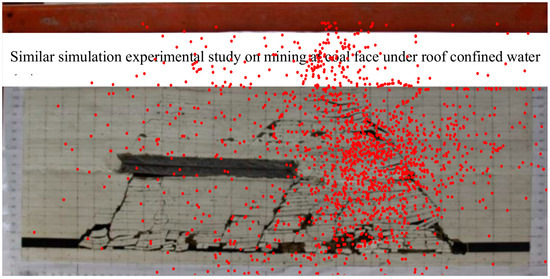
Figure 7.
Comparison diagram of crack results and acoustic emission event locations.
In Figure 7, the red dots represent the locations of all acoustic emission events monitored during the experiment, whereas the base map is a photograph of the model fracture at the end of the experiment.
As illustrated in Figure 7, a significant difference is observed in the density of acoustic emission events between the drainage module and its left boundary. In contrast, the right boundary of the drainage module exhibits a distribution pattern that closely aligns with the drainage module area. This consistency is due to the completion of the excavation of the model on the right boundary of the drainage module. The density of acoustic emission events across various regions of the model corresponds with the fracture distribution.
In addition to spatial characteristics, the temporal evolution of acoustic emission is also a critical factor. To analyze the chronological patterns of these events, the acoustic emission occurrences were screened on an hourly basis throughout the experiment, as shown in Figure 8, where the blue square represents the drainage module, while the gray square denotes the excavation area. The color of each event point corresponds to the time of the occurrence during the experiment. The spatial distribution of the acoustic emission events aligns with the mining direction. As the experiment progresses, the location of the acoustic emission events shifts from right to left over time.
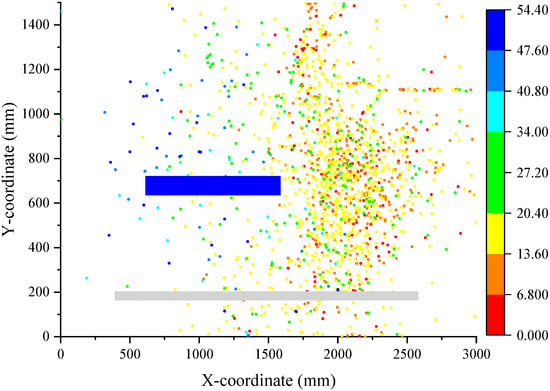
Figure 8.
Time sequence diagram of acoustic emission events.
Based on a comprehensive analysis of the spatial and temporal characteristics of acoustic emission events, a quantitative analysis was conducted on the number and energy of these events throughout the experiment. By examining the relationship between the number of acoustic emission events, event energy and location, and the number of model excavations during the experimental process, a detailed assessment was performed to quantify the correlation between these parameters. The relationships between the number of acoustic emission events, event energy, and the horizontal position of the model during the experiment are shown in Figure 9. Figure 10 illustrates the relationship between the number of acoustic emission events, event energy, and the number of model excavations throughout the experimental process. In both Figure 9 and Figure 10, the blue lines indicate the horizontal position of the model corresponding to the drainage module and the number of model excavations.
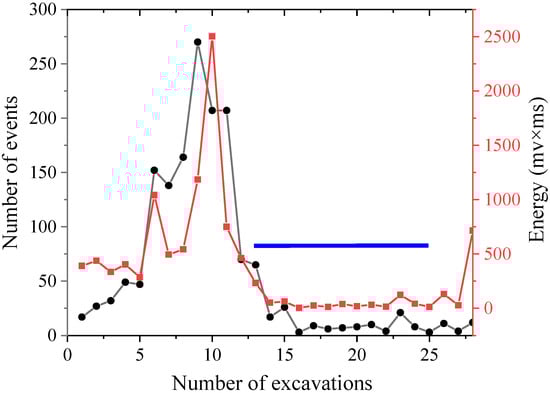
Figure 9.
The relationship between the number of acoustic emission events, energy, and the horizontal position of the model.
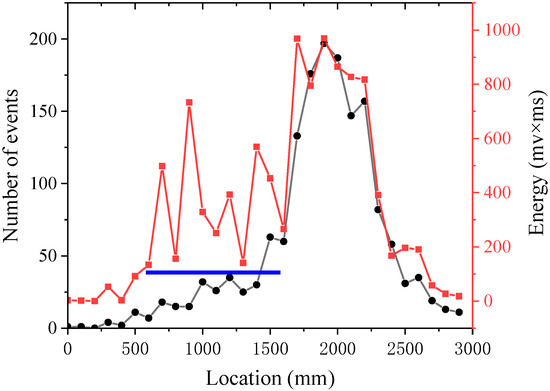
Figure 10.
The relationship between the number of acoustic emission events, energy, and number of excavations.
As shown in Figure 9, although the acoustic emission energy in the drainage module area fluctuates, the number of acoustic emission events and the corresponding energy during the experimental process are concentrated horizontally at the boundary of the drainage module. Both the amount and energy of acoustic emission events in the boundary area are significantly higher than those within the drainage module area and in regions farther away from it.
In terms of numerical values, the maximum number of acoustic emission events and energy at the boundary of the drainage module are 200 and 1000, respectively. In contrast, the average number of acoustic emission events and energy within the drainage module area are 25 and 400, respectively. Consequently, the ratios of the number and energy of acoustic emission events at the boundary to those within the drainage module area are 8 and 2.5, respectively.
Figure 10 further illustrates that, according to the relationship between the number of acoustic emission events and energy in the horizontal position of the model and the number of excavations during the experimental process, the number of acoustic emission events and energy are concentrated at the boundary of the drainage module. The number and energy of acoustic emission events at the boundary are notably higher than those within the drainage module area and in regions distant from it. When excavation reaches the boundary of the drainage module, the combined effects of the drainage module’s influence and the excavation process are superimposed and enhanced.
Quantitatively, the maximum number of acoustic emission events and energy at the boundary of the drainage module are 270 and 2500, respectively, whereas the maximum number of acoustic emission events and energy within the drainage module area are 10 and 100, respectively. Thus, the ratio of the number and energy of acoustic emission events at the boundary to those within the drainage module area is 27 and 25, respectively.
Based on the relationship between the number of acoustic emission events, energy, and the number of excavations during the experimental process in the model’s horizontal position, both the number and energy of acoustic emission events are concentrated at the boundary of the drainage module. However, there are differences in the degree of this concentration. In terms of the number of acoustic emission events, the ratio of the number of model excavations to the maximum horizontal position of the model is 1.35 (the ratio of the maximum number of acoustic emission events in Figure 9 to that in Figure 10). In terms of acoustic emission energy, this ratio is 2.5 (the ratio of the maximum energy value in Figure 9 to that in Figure 10).
The energy of acoustic emission events is distributed within a certain range on one side of the drainage zone, both in the horizontal position and in the number of model excavations. This indicates that the interaction between drainage and mining stress fields occurs only when the mining boundary reaches the spatial and temporal influence range of the drainage zone. The distribution pattern of acoustic emission events confirms the phenomenon of concentrated micro-seismic events at the boundary of the drainage zone observed on site.
4. Verification of On-Site Monitoring Results
The SOS micro-seismic monitoring system (Central Mining Institute, Katowice, Poland) is used for the regional monitoring of the 2202 working face of the coal mine. The system consists of acquisition stations, recorders, analyzers, earthquake pickups, and digital transmission systems. Figure 11 illustrates the hardware components of the SOS micro-seismic monitoring system, whereas Figure 12 illustrates the setup of the system.
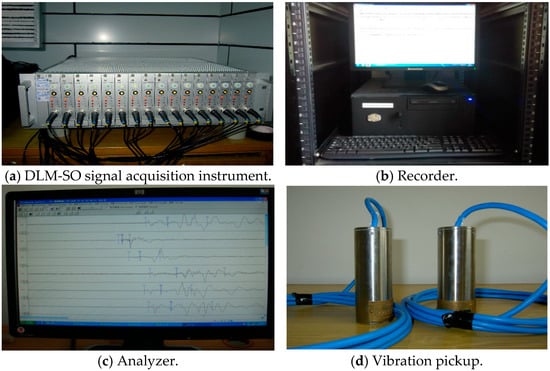
Figure 11.
Hardware of SOS micro-seismic monitoring system.
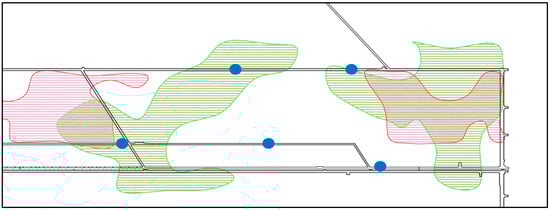
Figure 12.
Sensor arrangement of SOS micro-seismic monitoring system.
The distribution of micro-seismic events occurring during mining is shown in Figure 12. Figure 13 illustrates the categorization of micro-seismic event points based on their energy levels, which are segmented into four ranges, 104 J–5 × 10⁴ J, 5 × 10⁴ J–7.5 × 10⁴ J, 7.5 × 10⁴ J–105 J, and above 105 J, marked as red, cyan, yellow, and blue, respectively.
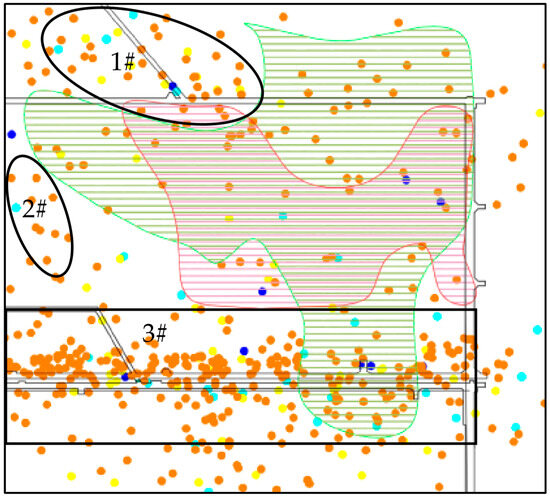
Figure 13.
Distribution map of micro-seismic events during mining.
During mining, the micro-seismic sources are identified as being predominantly concentrated in three types of areas: the mutual influence area of the drainage zone; the boundary of the drainage zone; and the working face along the air side, such as the 1#-3# source concentration areas depicted in Figure 13. The source concentration zone along the airside of the working face is also affected by the drainage area. The distribution is concentrated at the periphery of the drainage area, exhibits relative sparsity within the drainage area, and shows a specific concentration within the drilling field area inside the drainage area. For example, in the No. 3 source concentration area depicted in Figure 13, located within the drainage area of the Zhiluo Formation, there is a notable reduction in the degree of source concentration. Additionally, high-energy sources appear in the vicinity of the drilling site. The extent of mutual influence among hydrophobic areas is related to the spatial superposition relationship of these areas. The region of superposition and enhancement between the two hydrophobic areas is the focal point of micro-seismic sources, often characterized by concentrated and elevated energy levels. This is demonstrated by the concentration area of source No. 1, as shown in Figure 13.
5. Conclusions
In order to prevent and control rock burst caused by roof water drainage, a similar simulation experiment study was conducted on mining operations in a working face with roof-confined water. The conclusions are as follows.
The drainage module was reasonably configured. In similar simulation experiments, the drainage module had little effect on the height of fracture development and the integrity of fracture expansion.
The displacement of rock layers is significantly influenced by drainage modules. Specifically, the displacement curve showed a distinct step-like distribution in the drainage boundary area, with a height difference exceeding 10 mm for the rock layer below the drainage rock layer. In contrast, the displacement of the rock layer above the drainage rock layer displayed an asymmetric “V” shape, with a gradient ratio between the drainage and non-drainage zones ranging between 1.5 and 4.4.
The acoustic emission event and energy distribution were notably influenced by drainage modules. These events and their associated energy distribution were concentrated at the boundary of the drainage module. The ratio of the number of model excavations to the maximum horizontal position of the model is 1.35 in terms of the number of acoustic emission events, and this ratio is 2.5 in terms of acoustic emission energy. On-site monitoring results also verified the experimental results.
Model similarity studies under the influence of drainage properties under two-dimensional conditions have been carried out. In the future, subsequent model similarity studies will be performed to monitor the development of cracks by acoustic emission under three-dimensional conditions.
The research is carried out based on specific geological conditions, and comparative studies of changing geological parameters will be carried out in the future to increase the general adaptability of the research results.
Author Contributions
Conceptualization, F.L.; methodology, D.L.; software, F.L.; validation, Y.G.; resources, F.L.; data curation, F.L. and D.L.; writing—original draft preparation, F.L.; writing—review and editing, D.L. All authors have read and agreed to the published version of the manuscript.
Funding
This research received no external funding.
Data Availability Statement
The original contributions presented in this study are included in the article. Further inquiries can be directed to the corresponding authors.
Conflicts of Interest
The authors declare no conflicts of interest.
References
- Ye, Y.; Li, W.; Yang, Z.; Li, X.; Wang, Q. The Prediction of Aquifer Water Abundance in Coal Mines Using a Convolutional Neural Network–Bidirectional Long Short-Term Memory Model: A Case Study of the 1301E Working Face in the Yili No. 1 Coal Mine. Water 2025, 17, 1595. [Google Scholar] [CrossRef]
- Huang, Z.; Wang, K.; Liu, X.; Zhao, Y.; Li, X.; Fu, B.; Zhou, Y. Risk Identification Method and Application of Roof Water Inrush Under Multi-Working Face Mining. Appl. Sci. 2025, 15, 3511. [Google Scholar] [CrossRef]
- Xiao, J.; Wang, Y.; Zhang, B.; Wang, T.; Liu, Y.; Wang, Y.; Sun, Y. Analysis of the Evolution Law of Mining-Induced Water Flowing Fracture of Composite Hard Roof in the Border Mining Area of Inner Mongolia and Shaanxi. Energy Sci. Eng. 2025, 13, 1720–1731. [Google Scholar] [CrossRef]
- Du, L.; Zhu, W.; Wang, L.; Li, H.; Jiao, X.; Qin, T. Using roof borehole electrical resistivity tomography to monitor roof water infiltration in a mine work face. Sci. Rep. 2025, 15, 2621. [Google Scholar] [CrossRef] [PubMed]
- Gai, G.; Qiu, M.; Zhang, W.; Shi, L. Evaluation of water richness in coal seam roof aquifer based on factor optimization and random forest method. Sci. Rep. 2024, 14, 24421. [Google Scholar] [CrossRef]
- Chen, G. Study on the Deep Transfer and Storage Mechanism of Mine Water in the Eastern Margin of Ordos Basin. Ph.D. Thesis, China University of Mining and Technology, Xuzhou, China, 2020. [Google Scholar] [CrossRef]
- Shu, C.; Jiang, F.; Wang, B.; Du, X.; Wen, J. Mechanism and Treatment of Rock Burst on the Deep Working Face Induced by Drainage in Water-Rich Areas. Geotech. Geol. Eng. 2021, 39, 871–882. [Google Scholar] [CrossRef]
- Wang, B.; Jiang, F.; Zhu, S.; Zhang, X.; Shang, X.; Gu, Y.; Wu, Z. Investigating on the mechanism and prevention of rock burst induced by high intensity mining of drainage area in deep mines. J. China Coal Soc. 2020, 45, 3054–3064. [Google Scholar] [CrossRef]
- Li, F.; Cheng, Y.; Zhang, X.; Huang, S.; Li, D. Change Characteristics of the Advance Stress and Strata Fracture Structure of Spatial Isolated Island Formed by Roof Drainage. Processes 2023, 11, 2246. [Google Scholar] [CrossRef]
- Li, F.; Gu, Y.; Cheng, Y.; Li, D.; Wang, Y.; Zhang, S. Influence of roof confined water drainage on stress distribution in coal seam. Sci. Rep. 2024, 14, 24040. [Google Scholar] [CrossRef] [PubMed]
- Dou, L.; Zhou, K.; Cao, A.; Hou, T.; Gong, S.; Kan, J.; Ma, X. Rockburst mechanism caused by the mining-induced drain-age of confined water in deep extra-thick aquifer. J. China Coal Soc. 2024, 49, 351–366. [Google Scholar] [CrossRef]
- Zhou, K. Effect of Extra-Thick and Water-Bearing KeyStrata and Its Inducing Rock burst Mechanism by the Drainage of Confined Water through Stress Adjustment and Energy Accumulation. Ph.D. Thesis, China University of Mining and Technology, Xuzhou, China, 2022. [Google Scholar] [CrossRef]
- Wang, G. Study on Rock Burst under the Condition of Roof Drainage in Water-Rich Mine. Ph.D. Thesis, Liaoning Technical University, Fuxin, China, 2021. [Google Scholar] [CrossRef]
- Shao, J.; Zhang, Q.; Zhang, W.; Wang, Z.; Wu, X. Effects of the borehole drainage for roof aquifer on local stress in underground mining. Geomech. Eng. 2021, 24, 479–490. [Google Scholar] [CrossRef]
- Li, Q.; Yang, S.; Yue, H.; Kong, D. Study on Caving Characteristics of Roof and Floor and Law of Ground Pressure Behavior in Near-Vertical Coal Seams Mining: A Three-Dimensional Similarity Simulation Experiment. Rock Mech. Rock Eng. 2025, 1–34. [Google Scholar] [CrossRef]
- Sun, Q.; Zhao, R.; Zhang, J.; Chen, L.; Li, P. The law of overburden failure and water conservation mining method of extra thick coal seams covered by extremely thick soil layers. J. Min. Saf. Eng. 2025, 42, 1129–1140. [Google Scholar] [CrossRef]
- Wang, J.; Liu, S.; Yu, X.; Gu, H.; Liu, H.; Liu, C. Characteristics of Overlying Rock Breakage and Fissure Evolution in the Mining of Extra-Thick Coal Seams in Anticline Structural Area. Appl. Sci. 2025, 15, 8812. [Google Scholar] [CrossRef]
- Gai, Q.; He, M.; Li, S.; Gao, Y. Study on strike failure characteristics of floor in a new type of pillarless gob-side entry retaining technology above confined water. Tunn. Undergr. Space Technol. Inc. Trenchless Technol. Res. 2025, 161, 106596. [Google Scholar] [CrossRef]
- Tang, L.; Tu, S.; Tu, H.; Zhang, L.; Miao, K.; Zhao, H.; Ma, J. Interaction law between mining stress and fault activation and the effect of fault dip angle in longwall working face. Sci. Rep. 2024, 14, 25654. [Google Scholar] [CrossRef] [PubMed]
- Zhai, X.; Guo, Z.; Fang, J.; Zhang, Z.; Zhao, X. Study on deformation zoning of overlying strata and simulation of rock pressure behavior in longwall top coal caving mining. Coal Sci. Technol. 2025, 53, 96–106. [Google Scholar]
- Hu, T.; Han, K.; Song, C.; Che, J.; Li, B.; Huo, T.; Hu, T. Development Law of Water-Conducting Fracture Zones in Overburden above Fully Mechanized Top-Coal Caving Face: A Comprehensive Study. Processes 2024, 12, 2076. [Google Scholar] [CrossRef]
- Wang, K.; Meng, X.; Cheng, X.; Zhao, G.; Qi, M. Research on the evolution and application of mining-induced fractures based on the optical frequency domain reflection technology. J. Min. Saf. Eng. 2024, 41, 1000–1010. [Google Scholar] [CrossRef]
- Liu, Y.; Kong, D.; Li, P.; Wen, Z.; Li, F.; Zuo, Y.; Wu, G. The migration and evolution law of overlying strata and the instability and failure characteristics of end face roof under the condition of ascending mining in close distance coal seam: Case study. Eng. Fail. Anal. 2024, 165, 108809. [Google Scholar] [CrossRef]
- Zhang, X.; Yang, Z.; Ying, G. Acoustic Emission Assisted Inspection of Punching Shear Failure in Reinforced Concrete Slab–Column Structures. Buildings 2025, 15, 3226. [Google Scholar] [CrossRef]
- Li, B.; Sun, X.; Wang, E.; Li, N.; Liu, X.; Cao, X.; Liu, W. Time-frequency-fractal Characteristics of Acoustic Emission Signals During Coal-rock Rupture at Different Loading Rates. Rock Mech. Rock Eng. 2025, 1–17. [Google Scholar] [CrossRef]
- Liu, Z.; Ma, C.; Wei, X.; Yi, W.; Lei, J. Failure mechanisms of coarse-grained sandstone under pure mode I/II loading: Insights from energy evolution and acoustic emission. Nondestruct. Test. Eval. 2025, 40, 4415–4435. [Google Scholar] [CrossRef]
- Jiao, Z.; Ma, J.; Ni, Z.; Bao, W.; Lan, J.; Dong, C. Study on Mechanical Response and Failure Characteristics of Coal Specimens Under the Coupling Effect of Joints and Drillings. Processes 2025, 13, 2605. [Google Scholar] [CrossRef]
- Qin, X.; Su, H.; Yu, L.; Pham, T.N.; Zhao, E.; Zhang, M. Thermal Effects on the Generalized Mode III Fracture Behavior of Transversely Isotropic Sandstone: A Study Using Acoustic Emission Localization and 3D Scanning Reconstruction. Rock Mech. Rock Eng. 2025, 1–23. [Google Scholar] [CrossRef]
- Gai, Q.; He, M.; Gao, Y.; Tao, Z.; Zhang, C. Distribution characteristics of floor four zones and water preservation effectevaluation in 110 mining method above confined water. J. China Coal Soc. 2025. [Google Scholar] [CrossRef]
- Xiao, M.; Ju, F.; He, Z.; Wang, D. Investigation of mining-induced fracture evolution and water inflow patterns in water-rich coal seams of atypical Jurassic mining area. J. Min. Saf. Eng. 2025, 42, 890–903. [Google Scholar] [CrossRef]
- Zhao, B.; Gao, X.; Zhu, W.; Ding, J.; Gao, P. A Novel Carbon Fiber Composite Material for the Simulation of Damage Evolution in Thick Aquifers. Appl. Sci. 2025, 15, 7314. [Google Scholar] [CrossRef]
- Zhao, B.; Gao, X.; Zhu, W.; Ding, J.; Gao, P. A coustic behavior and time prediction method for water inrush of tunnel floor under osmotic water pressure. Results Eng. 2025, 26, 105547. [Google Scholar] [CrossRef]
- Zheng, K.; Yuan, L.; Zhang, P.; Wang, L. Rock bursts induced by thick-hard roof with compound key strata: Mechanisms and technical modes for prevention. Coal Geol. Explor. 2024, 52, 14–24. [Google Scholar] [CrossRef]


Disclaimer/Publisher’s Note: The statements, opinions and data contained in all publications are solely those of the individual author(s) and contributor(s) and not of MDPI and/or the editor(s). MDPI and/or the editor(s) disclaim responsibility for any injury to people or property resulting from any ideas, methods, instructions or products referred to in the content. |
© 2025 by the authors. Licensee MDPI, Basel, Switzerland. This article is an open access article distributed under the terms and conditions of the Creative Commons Attribution (CC BY) license (https://creativecommons.org/licenses/by/4.0/).