Abstract
Natural rock materials, containing micro-cracks and pore defects, significantly alter their mechanical behavior. This study investigated fracture interactions of red sandstone containing double close-round holes (diameter: 10 mm; bridge angle: 30°, 45°, 60°, 90°) using acoustic emission (AE) monitoring and the discrete element simulations method (DEM), which was a novel methodology for revealing dynamic failure mechanisms. The uniaxial compression tests showed that hole geometry critically controlled failure modes: specimens with 0° bridge exhibited elastic–brittle failure with intense AE energy releases and large fractures, while 45° arrangements displayed elastic–plastic behaviors with stable AE signal responses until collapse. The quantitative AE analysis revealed that the fracture-type coefficient k had a distinct temporal clustering characteristic, demonstrating the spatiotemporal synchronization of tensile and shear crack initiation and propagation. Furthermore, numerical simulations identified a critical stress redistribution phenomenon, that axial compressive force chains concentrated along the loading axis, forming continuous longitudinal compression zones, while radial tensile dispersion dominated hole peripheries. Crucially, specimens with 45° and 90° bridges induced prominently symmetric tensile fractures (85° to horizontal direction) and shear-dominated failure near junctions. These findings can advance damage prediction in discontinuous geological media and offer direct insights for optimizing excavation sequences and support design in cavern engineering.
1. Introduction
Rock materials serve as the primary structural medium in rock engineering, including mine roadways, traffic tunnels, and hydropower projects. Their load-bearing capacity is a critical determinant of rock mass stability [1,2,3]. As complex natural composites, rocks contain various defects, such as cracks and holes, that vary significantly in scale and distribution patterns, and these defects considerably complicate their failure and instability mechanisms [4,5]. The presence of such internal flaws results in the non-uniform and anisotropic mechanical behavior of rocks [6,7]. Indeed, as heterogeneous geological materials, the mechanical properties of rocks exhibit a strong dependence on the size and geometric distribution of their internal defects. Consequently, the mechanical response of defective rocks is governed by both defect the geometry and intrinsic properties of rock materials themselves [8,9]. Therefore, investigating the mechanical characteristics of rocks with prefabricated defects holds practical importance for enhancing disaster prevention in rock engineering.
Previous investigations demonstrated that pre-existing cavities critically controlled rocks’ stress distribution and failure patterns. Li et al. demonstrated that hole geometry governed marble strength via tangential stress and tensile cracks [10]. Zhou et al. confirmed this geometry dependence in rectangular cavities, where fracture characteristics relied on cavities’ quantity and configuration [11]. These studies established the fundamental role of cavity geometry on rocks’ fracture behavior, but its real-time links between internal stress and the specific fracture mode remained unclear.
Then, some investigations have demonstrated that stress redistribution around material cavities governs its distinct fracture behaviors. Zhao et al. classified three crack types near cylindrical holes of granite, which were roof–floor tensile cracks, sidewall compressive failures, and peripheral secondary cracks [12]. Carter et al. identified potential fracture initiation locations of void-containing rocks [13]. Yang et al. quantitatively characterized the tensile-to-shear fracture transition in flawed sandstone [14]. Collectively, these works effectively studied fracture propagation patterns of rocks with cylindrical cavities. However, the temporal and spatial evolution correlation of localized micro-fractures with redistribution stress was seldom established.
Some researchers have extensively investigated the crack initiation and propagation patterns, as well as their influencing factors, of rocks with pre-existing cavities. Zhao et al. identified an initial stress concentration phenomenon of double-hole specimens [15], and then Zhao et al. classified three hybrid bi-cavity failure modes as shear-dominated, tensile-shear coupled, and tensile-dominated [16]. Sarfarazi et al. showed tensile crack predominance in tunnel-like adjacent cavities [17]. Chen et al. identified the rock bridge angle as the critical parameter governing crack initiation and coalescence patterns [18]. Nevertheless, these studies did not establish relationships of rock macroscopic mechanical behaviors and their internal micro-fracture responses.
Previous studies significantly enhanced the understanding of how internal cavities influence rocks’ fracture and failure. They demonstrated that cavity geometry critically governed stress distribution, crack initiation and propagation patterns, and rock strength degradation. However, these studies primarily focused on specific, idealized cavity shapes and typically isolated cavities of rocks, leaving complex failure mechanisms under more realistic defect distributions (double prefabricated close-round holes) insufficiently explored. Limited investigations addressed the failure mechanism and crack evolution characteristics of rocks with prefabricated double-circular holes, particularly those employing an integrated approach combining AE monitoring and numerical simulation.
In this study, the mechanical response and AE characteristics of red sandstone containing prefabricated double holes were investigated using experimental research and numerical simulation. The evolution characteristics of AE signals along with the macroscopic fracture behavior of red sandstone with these holes were documented. Furthermore, PFC2D (Particle Flow Code) software (PFC2D 6.00), based on the discrete element method (DEM), was used to reveal the evolution of force chains and crack development in rocks with prefabricated holes. These results provide valuable insights into the failure and instability mechanisms of rocks containing boreholes in mining roadways. This work also offers guidance for evaluating the damage state of closely spaced roadways.
2. Experimental Procedure
2.1. Experimental Equipment
This compression test was conducted using an Instron 5985 system (Instron, Norwood, MA, USA, Figure 1a), with acoustic emission (AE) signals recorded through a PCI-II acquisition system (Physical Acoustics Corporation, Princeton, NJ, USA, Figure 1b). During AE monitoring testing, the data acquisition utilized 6 channels, with the sampling frequency set at 1 MHz; the threshold voltage was established at 100 mV and AE sensors were spatially arranged in a non-coplanar configuration to optimize signal triangulation (Figure 1c). AE sensors were fixed to the rock surface using adhesive tape and Vaseline. To mitigate boundary effects, a distance of 20 mm was maintained between the sample ends and the sensors.
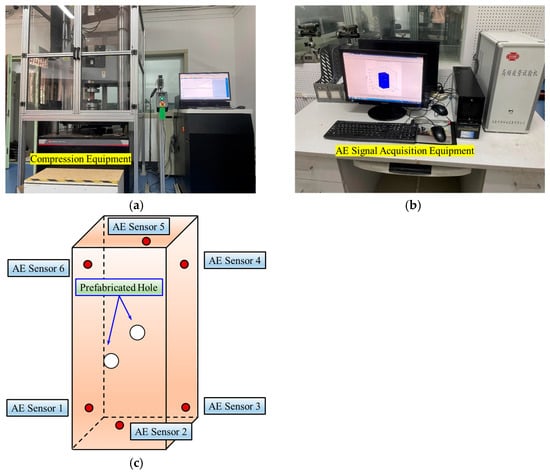
Figure 1.
Schematic diagram of (a) compression equipment, (b) AE signal acquisition equipment, (c) AE probe layout.
Six miniaturized sensors (operating frequency range was 125–750 kHz, resonant frequency was 300 kHz) were used to monitor AE signals [19,20,21]. AE system parameters were calibrated with a detection threshold of 45 dB and preamplifier gain of 40 dB to ensure a high signal-to-noise ratio. This configuration enabled comprehensive monitoring of fracture initiation and propagation during compression tests. AE signals were filtered to remove noise, achieving a high signal-to-noise ratio.
2.2. Specimen Preparation and Loading Scheme
Specimens (5 cm × 5 cm × 10 cm) were precision-machined from a homogeneous parent rock to minimize material variability, and their end faces were ground to strict geometric tolerances (<0.05 mm non-parallelism, <0.25° axial deviation) using diamond abrasives. Triplicate specimens were fabricated per inclination angle (rock bridge angle), with systematic testing conducted on optimally screened samples.
These specimens contained two prefabricated circular holes. The angle of the prefabricated holes, between the connecting line of the holes’ center and the horizontal direction, were measured as 30°, 45°, 60°, and 90°, which were labeled as DH1, DH2, DH3, and DH4, respectively. The prefabricated hole had a diameter of 1 cm and fully penetrated the specimen. The spacing between these two prefabricated circular holes maintained a constant distance of 1 cm. As illustrated in Figure 2, the detailed dimension of specimens with inclination angles of 45° and 90° were displayed.
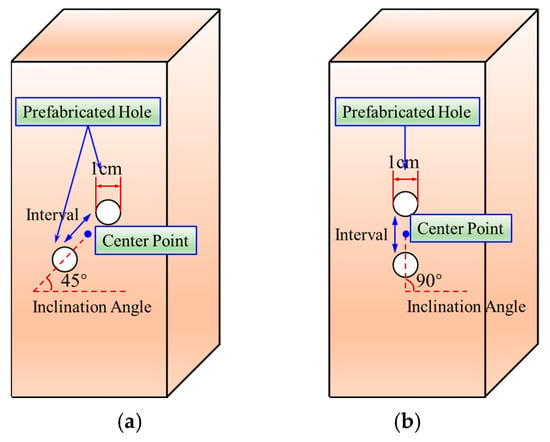
Figure 2.
Schematic diagram of specimen containing prefabricated holes, (a) 45° inclination angle and (b) 90° inclination angle.
The displacement-controlled loading pattern (0.1 mm/min) was implemented through the Instron 5985 system, with continuous AE signal monitoring, until rocks completely failed. This method ensured minimal end effect interference while capturing full-field damage data of rocks.
2.3. Theoretical Basis
The discrete element theory, proposed by P. A. Cundall et al., was the theoretical basis of the particle flow discrete element program [22]. This theory used granular structure parameters to describe the macroscopic mechanical properties of materials, which can break through the limitation of the macroscopic continuity hypothesis of traditional continuum mechanics, and it was more suitable for simulating and dealing with nonlinear problems such as rock deformation failure and cracks propagation.
There were two main bonding models defined in the particle flow program, which was the contact bonding (CB) model and the parallel bonding (PB) model. In the CB model, the rigidity between particles will not change as long as they are still in contact with each other, although the adhesive force has disappeared. This demonstrated that in the CB model, the bond fracture between particles did not immediately have a significant impact on the overall rigidity of the specimen, which was a rare case in rock materials. In contrast, in the PB model, the rigidity of particles was determined by their contact rigidity and bond rigidity [23,24]. Therefore, in the PB model, once the bond has broken, the rigidity between the particles will immediately decrease, which will directly affect the overall rigidity of the specimen. In view of this reason, the parallel bonding model was chosen to construct the discrete element numerical model in this study.
The uniaxial compression numerical simulation adopted a displacement-controlled loading mode. The axial load was applied to rigid boundary walls: the lower wall remained fixed in all directions, while the upper wall moved downward at a constant velocity to impose compressive displacement. This configuration effectively constrained the specimen axially and replicated the constrained loading platens of laboratory tests.
3. Results
3.1. AE and Stress Responses of Red Sandstone with Prefabricated Circular Holes Under Uniaxial Compression
As demonstrated in Figure 3, it was observed that the compaction and closure stages lasted longer for specimen DH1, with its stress curve displaying a concave growth pattern. In contrast, specimen DH4 exhibited a relatively shorter compaction and closure stage, characterized by a slight concave stress curve. The elastic deformation stages of specimens DH1, DH2, and DH3 were comparatively stable, exhibiting nearly linear stress growth. This indicated good homogeneity within these specimens and stable stress progression. Furthermore, their stress curves maintained approximately linear growth up to peak stress, followed by a sudden, cliff-like drop. However, during the critical failure phase of specimen DH4, its stress curve began to flatten, indicating the onset of partial plastic deformation within rocks.
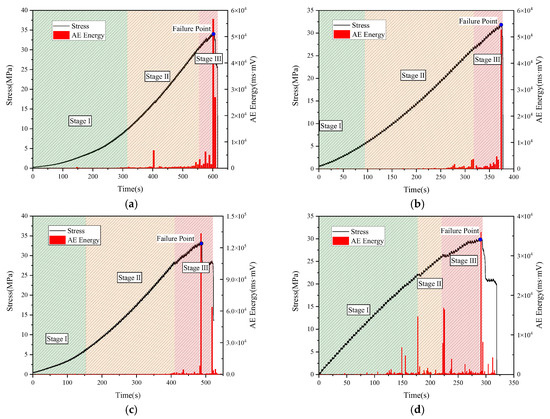
Figure 3.
Evolution characteristic of stress and AE energy of red sandstone with prefabricated circular holes under uniaxial compression, (a) DH1, (b) DH2, (c) DH3 and (d) DH4.
For specimens DH1, DH2, and DH3, the failure mode was relatively less influenced by the prefabricated holes, resulting in elastic–brittle fracture. Consequently, the rock bridge angle (distribution angle of prefabricated circular holes) affected the specimen fracture mode. As this angle increased, the failure mode transitioned from elastic–brittle fracture to elastic–plastic fracture. The peak strengths of specimens DH1, DH2, DH3, and DH4 were 33.76 MPa, 32.24 MPa, 32.26 MPa, and 29.23 MPa, respectively. When the rock bridge angle was 30°, 45°, and 60°, the peak strength exhibited minimal variation with changes in the prefabricated hole angles. The peak strengths of DH2 and DH3 were essentially identical, and the peak strength of DH1 was only 4.7% higher than that of DH2 and DH3. A similar pattern was observed regarding the specimens’ elastic modulus. The elastic moduli for specimens DH1, DH2, DH3, and DH4 were 12.42 GPa, 12.31 GPa, 12.34 GPa, and 11.21 GPa, respectively.
These observations indicate that for specimens DH1, DH2, and DH3, the mechanical responses were only moderately influenced by the rock bridge angle, resulting in a minor degradation of mechanical properties. However, when the rock bridge angle reached 90° (DH4), the mechanical properties of DH4 exhibited a significant decrease by approximately 12.1% in peak strength and 10.2% in elastic modulus compared to DH1 to DH3. This substantial degradation was attributed to the pronounced overlapping of stress fields around the prefabricated holes.
As illustrated in Figure 3, during the compaction and elastic deformation stages, specimens DH1, DH2, and DH3 exhibited generally low and infrequent AE energy values. This pattern indicated that cracks’ initiation and propagation behaviors were relatively limited in both frequency and scale at these stages. When minor stress fluctuations occurred during the critical failure stage, AE energy displayed an abrupt increase. Conversely, prior to large-scale fracture events, AE energy manifested a distinct jump-like surge.
In the period immediately preceding the critical failure–instability point, AE energy levels remained relatively stable with minimal fluctuations. Their values were consistently low during this comparatively quiescent phase, showing no discernible precursor phenomena to the impending instability. At the critical failure–instability point itself, AE energy exhibited a marked leap, and this surge represented a significant increase compared to the values recorded during the preceding deformation stages.
3.2. Fracture Evolution Characteristics of Red Sandstone with Prefabricated Circular Holes Under Uniaxial Compression
Average Frequency (AF) and Risetime Amplitude (RA) values served as established indicators to characterize fracture types of rocks during their fracture–instability processes [25,26,27,28]. Specifically, AF quantified the average frequency of AE hits per unit time, calculated by dividing the AE ring-down counts by the waveform duration. RA represented the ratio of risetime to peak amplitude, expressed as microsecond-per-volt.
In previous studies, the RA value was plotted along the x-axis and the AF value was assigned to the y-axis in RA-AF diagrams. A reference line with a slope of 1 was drawn to differentiate tensile cracks from shear cracks within the samples [29,30]. All data points positioned above this diagonal line were classified as tension cracks, while those falling below the line were interpreted as shear cracks. In this study, a fracture-type coefficient k was defined as the ratio AF/RA to characterize the evolution of different fracture types of rocks. Specifically, k > 1 represented tensile fractures, while k < 1 indicated shear fractures. Critically, this coefficient solely characterized fracture modes, and it did not quantify the failure intensity of rocks.
As illustrated in Figure 4, the temporal evolution of the fracture-type coefficient k revealed synchronized initiation and propagation characteristics between tensile and shear cracks for rocks containing prefabricated holes. When the bridge angle was 30°, AE events were predominantly concentrated within the 450 to 600 s interval. For the high-density of the fracture-type coefficient k, the k-value density ranged from 8.35 × 10⁻⁴ to 0.00167, and mainly shear fractures occurred during this period. Based on fracture-type coefficient characteristics, the shear fractures substantially outnumbered tensile fractures. When prefabricated holes were oriented at 45°, the fractures demonstrated primary concentration within the 250–320 s interval. At the fracture-type threshold (k = 1), k-values exhibited peak density with corresponding fracture density reaching 4.225 × 10⁻⁵. Both tensile and shear fractures showed pronounced spatial and temporal concentration around this transitional k-value and corresponding time window.
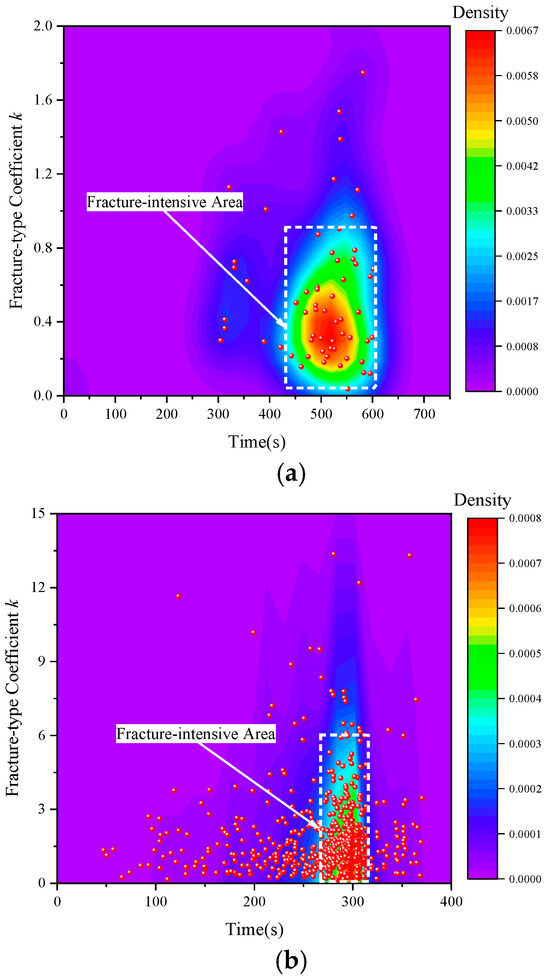
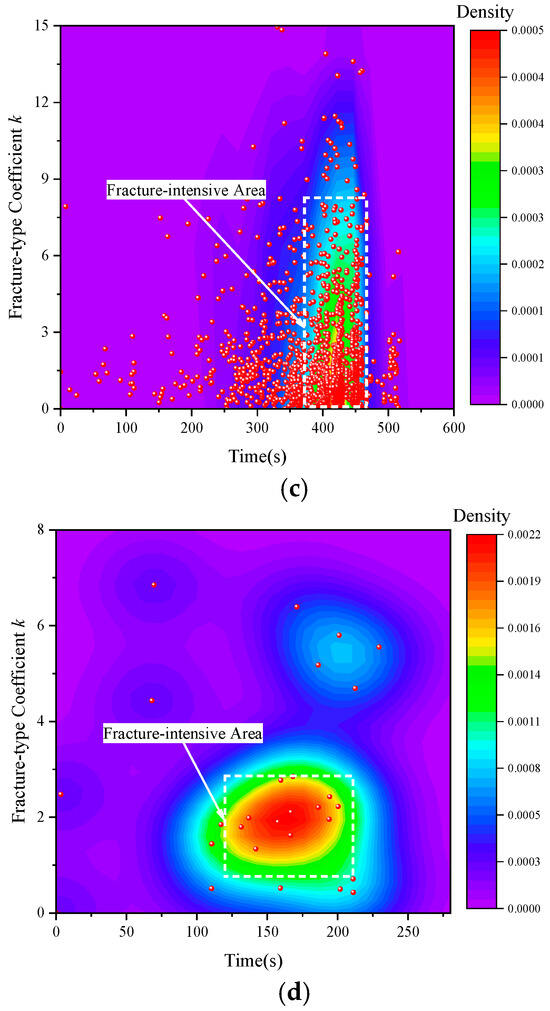
Figure 4.
Evolution characteristic of fractures of red sandstone with prefabricated circular holes under uniaxial compression, (a) DH1, (b) DH2, (c) DH3 and (d) DH4.
For specimen DH3, the tensile and shear fractures both exhibited abundance and spatial concentration. The fractures predominantly clustered within the 450–480 s interval, revealing temporally correlated fracture behaviors where tensile cracks significantly outnumbered shear cracks. The fracture-type coefficient demonstrated pronounced concentration near the tensile–shear transition threshold (k = 1), with corresponding fracture density reaching 3.150 × 10⁻⁵. During this fracture concentration period, tensile fracture density substantially exceeded that of shear fractures in specimen DH3. When the bridge angle was 90°, its fractures occurrence remained relatively low as the specimen predominantly experienced tensile failure. Within the high-density fracture cluster, the fracture-type coefficient k exhibited density values spanning 3.250 × 10⁻⁴ to 6.250 × 10⁻⁴. This density range and corresponding time interval confirmed significantly greater tensile fracture development.
3.3. AE Events and Macroscopic Fractures of Red Sandstone with Prefabricated Circular Holes Under Uniaxial Compression
As illustrated in Figure 5(i-a), high-energy AE events of specimen DH1 concentrated predominantly in the central region, with scattered occurrences in the upper-right and lower-left areas. This distribution delineated a fracture surface extending diagonally from upper-right to lower-left, with the most severe damage localized between prefabricated circular holes. Its surface cracks propagated from the upper-right region through prefabricated holes toward the lower-left section. Additionally, a longitudinal crack formed approximately perpendicular to the horizontal axis above the upper-right prefabricated hole, while an inclined crack interconnected the intermediate circular holes.
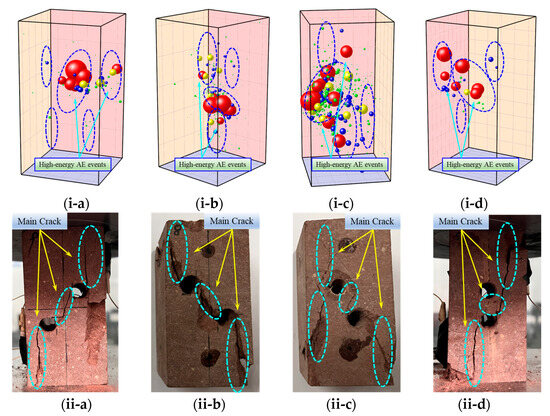
Figure 5.
AE events and macroscopic fracture characteristic of red sandstone with prefabricated circular holes under uniaxial compression, (i-a,ii-a) DH1, (i-b,ii-b) DH2, (i-c,ii-c) DH3, (i-d,ii-d) DH4.
For specimen DH2, high-energy AE events concentrated predominantly at the central junction of the holes, with secondary spatial distribution in the upper-left and lower-right regions. As illustrated in Figure 5(ii-b), the fractures propagated from the upper-left specimen region, transected the prefabricated circular hole junction, and extended toward the lower-right section. The resultant fracture surface exhibited pronounced symmetry yet deviated from a single inclined plane. Slightly inclined relative to the axis, the fracture paths propagated laterally along the upper-left perimeter of the circular hole. The surface crack propagation primarily followed the central axis connection plane of prefabricated holes. The lower-right fracture segment mirrored the upper-left configuration symmetrically, propagating axially rightward with minimal secondary cracking.
High-energy AE events in specimen DH3 predominantly clustered along two discrete fracture propagation pathways. The primary fracture path extended from the upper-right quadrant to the mid-left region, followed by a secondary pathway propagating toward the lower-right section. Scattered secondary AE events occurred throughout the central specimen region. Figure 5(ii-c) revealed an inclined macroscopic crack near the left prefabricated circular hole, and another dominant crack aligned with the prefabricated holes’ orientation. Specimen DH4 exhibited high-energy AE events primarily concentrated along a diagonal trajectory from the upper-left to lower-right regions, with peak density persisting in the central zone. Figure 5(ii-d) revealed a macroscopic surface crack initiating in the upper-right specimen region that propagated axially downward toward a circular hole in the lower section. Subsequently, the fracture extended axially toward the lower-left quadrant.
3.4. Force Chain Response Characteristics of Red Sandstone with Prefabricated Circular Holes Under Uniaxial Compression
As illustrated in Figure 6, the compressive and tensile force chains were designated by red and blue coloring, respectively. These force chains constituted interconnected transmission pathways formed by contact forces between particles, reflecting the micromechanical interactions within the granular medium.
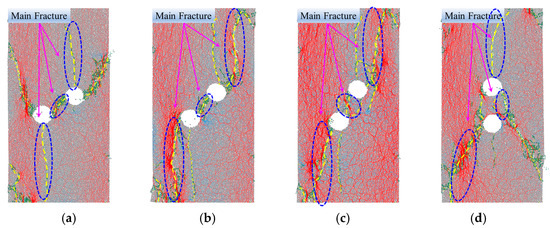
Figure 6.
Distribution characteristic of force chain and fracture of red sandstone with prefabricated circular holes under uniaxial compression, (a) DH1, (b) DH2, (c) DH3 and (d) DH4.
For specimen DH1, the compressive force chains formed primary vertical load-transfer paths aligned with the loading direction. The specimen’s left region displayed marked force chain aggregation, establishing a continuous high-strength compression band. Its tensile force chains predominantly localized near crack tips and stress-concentration zones around holes, exhibiting complementary distribution patterns to compressive domains. Then, the tensile cracks clustered peripherally around holes and along their interconnecting trajectories, forming an offset crack band oriented parallel to the principal stress direction. Moreover, its shear cracks dominated laterally to the holes and along specimen boundaries. Crucially, upper-right and lower-left perihole regions demonstrated interwoven shear–tensile crack networks, indicating localized shear stress concentrations.
For specimen DH2, its compressive force chains predominantly formed continuous primary load-transfer paths aligned with the loading direction, exhibiting significant concentration surrounding holes and at crack tips. And its tensile force chains primarily localized within crack-propagation zones and perihole regions, particularly proximal to fracture tips. Crucially, the compressive chains surrounding the holes displayed radial distribution patterns, indicating stress-field perturbation by the voids. Concurrently, its tensile chains concentrated above and below the holes facilitated crack initiation in these zones. Then, the tensile cracks clustered densely along interhole connection lines, forming a principal fracture band traversing the voids, while shear cracks dominated lateral hole peripheries and specimen boundaries.
As illustrated in Figure 6c, the compressive and tensile force chains of specimen DH3 exhibited complementary distributions, with tensile chains predominantly localizing at crack tips and stress-concentration zones. These tensile chains facilitated crack propagation through the specimen. The tensile cracks concentrated peripherally around holes, extending preferentially orthogonal to the interhole connection axis, and its shear cracks clustered dominantly on lateral hole peripheries and specimen boundaries. Primary fractures propagated progressively along the hole-connection trajectory, forming a continuous failure surface through radial extension from hole edges.
In specimen DH4, the compressive force chains formed a continuous primary load-transfer path aligned with the loading direction, indicating dominant stress transmission through these pathways. Its tensile force chains exhibited dispersed distributions, predominantly localizing within fracture-development zones and demonstrating tensile-stress facilitation of crack propagation. Its cracks concentrated dominantly above and below the holes, forming a distinct tensile fracture band between voids, and sparse shear cracks confirmed tensile-dominated failure under vertical hole alignment.
4. Discussion
The distribution angle of prefabricated circular holes significantly influenced the fracture mode of specimens. As the distribution angle (rock bridge angle) increased, the specimen fracture transitioned from brittle elastic fracture to ductile plastic fracture. This fracture mode transition stemmed from hole distribution angle variation, altering internal stress distribution and diminishing the effective load-bearing area along potential failure planes. Specifically, higher rock bridge angles led to increased stress concentration at the tips of the holes and adjacent internal defects. This intensified stress concentration triggered unstable defect propagation under lower global loads, leading ultimately to brittle fracture at smaller angles [3,4,5,6]. Conversely, at larger rock bridge angles, the altered stress state and distributed damage zones promoted more diffuse plastic deformation prior to its failure. Therefore, our findings also demonstrated that the macroscopic fracture behavior of rocks was critically dependent on internal defect distribution patterns, primarily mediated through their effect on localized stress fields and the material’s effective strength [3,4,5,6].
The macroscopic fracture behavior of rocks was found to be critically dependent on the distribution patterns of internal defects, particularly the distribution angles and distances [11,12,13]. Furthermore, the structural damage induced by these internal defects significantly compromised the rocks’ load-bearing capacity. Specifically, as the distribution angle increased, it led to a notable reduction in the effective load-bearing area within the specimens’ horizontal plane around the prefabricated circular holes. Consequently, the structural influence of these holes exacerbated the deterioration of key macroscopic mechanical properties, such as peak strength and elastic modulus. Additionally, the distribution angle, increasing from 30° to 60°, intensified the influence of boundary and end effects on the instability and final failure of the specimens. This intensified boundary effect, consistent with established findings [31,32,33], tended to decrease the peak strength. This decline in rocks’ strength drove the observed transition from brittle elastic failure to ductile plastic failure, ultimately resulting in greater failure intensity.
For specimens containing prefabricated holes, AE energy levels consistently remained low and showed subdued fluctuations upon entering the critical instability stage. This indicated that the measured AE energy accurately reflected the progressive damage evolution within rocks, encompassing the initiation, propagation, coalescence of internal cracks, and ultimate macroscopic rupture. High-energy AE events, indicative of significant fracture processes (specimen main rupture), were predominantly distributed both near the prefabricated holes and along the resultant main crack surfaces. Furthermore, these inclined prefabricated circular holes exerted a distinct guiding influence on crack propagation. Consequently, an approximately symmetrical fracture plane developed along the axis defined by the hole inclination. Critically, the fracture damage was universally observed at the hole perimeters. This highlighted that these junctions constituted inherent weak zones within the specimens, compromising their overall strength.
Moreover, the inclined prefabricated holes exerted a distinct guiding influence on fracture propagation. This led to the formation of approximately symmetrical rupture surfaces oriented along the axial direction defined by the hole inclination. Importantly, the connection area between paired holes consistently underwent fracture failure, acting as a critical weak zone significantly compromising specimen strength. Numerical simulations directly corroborated these experimental observations, revealing that this specific region exhibited the highest density of microcracks and the most concentrated force chains, providing a clear micromechanical basis for the macroscopic fracture patterns.
Furthermore, the prefabricated circular holes demonstrably reduced both the bearing capacity and elastic modulus of rocks. Macroscopic crack initiation consistently began at the weakened collapse zones of the hole walls. Subsequently, tensile failures commonly occurred at the upper and lower walls of the holes, progressively leading to instability and ultimate failure. Critically, the initiation, coalescence patterns of these cracks, and the final rock failure mode were strongly governed by the center-to-center distance between the double circular holes and their specific inclination angles.
Rock strength degradation intensified progressively with an increasing rock bridge angle (from 30° to 60°). Thus, the spatial distribution of prefabricated holes markedly influenced the dominant failure mechanisms. The connection area between holes consistently represented the zone of most severe mechanical property degradation. Consequently, macroscopic cracks predominantly nucleated and propagated within this connection area and near specimen boundaries, resulting in pronounced fragmentation zones at the tips of these cracks.
These findings hold some reference values and theoretical significance for studying failure mechanisms of closely distributed roadway in underground engineering. It can provide some insights for revealing the instability behaviors of roadways and offering reference values for analyzing the interactions between closely distributed roadways during the mining process. However, this study suffered from several limitations that constrain the broader applicability of its findings. Firstly, due to the relatively small size of the laboratory specimens and the numerical models, the simulations exhibited inherent size effects. Accurately capturing the instability behaviors of in situ, large-scale closely distributed roadways, where scale-dependent phenomena can be significant, remained challenging.
Secondly, the mechanical responses were investigated primarily under uniaxial stress conditions. This simplified loading scenario did not replicate the true three-dimensional stress states prevalent in deep underground mining environments, potentially altering fracture initiation and propagation modes. Thirdly, our discrete element method model employed a relatively homogeneous representation of rock materials. This key assumption might not adequately capture the complex heterogeneity, microcracks, and pre-existing discontinuities inherent in natural rock masses, which could influence stress distribution and fracture development. Finally, while some representative results were shown, the study presented data primarily from single simulations for each configuration. A lack of multiple replicates or comprehensive parametric variation for statistical analysis limited the assessment of result variability and the definitive quantification of trends across all potential scenarios.
5. Conclusions
In this investigation, the mechanical behavior and AE response characteristics of red sandstone containing two prefabricated cylindrical openings were revealed under uniaxial compression. The key conclusions were summarized as follows.
- (1)
- The distribution angle of prefabricated double circular holes dominated the fracture mechanisms of specimens. As the distribution angle increased, the failure mode transitioned from brittle–elastic to ductile fracture. The evolution of stress remained stable until peak strength, with consistently moderate AE energy fluctuations preceding to its instability. Notably, AE responses demonstrated limited precursory capability prior to rocks’ failure, and no significant precursory anomalies were observed.
- (2)
- The evolution of the fracture-type coefficient (k) exhibited distinct clustering characteristics throughout the rock failure process, revealing spatiotemporal synchronization for the propagation of tensile and shear cracks. Specimens with 30°, 45°, and 60° circular holes showed concentrated clusters of AE events, located predominantly near the prefabricated holes. High-energy AE events showed concentrated clustering along primary fracture surfaces, exhibiting an axisymmetric distribution aligned with the inclination of prefabricated holes.
- (3)
- The compressive force chains concentrated predominantly along the loading axis of rocks, forming a continuous longitudinal compression zone, that showed strong lateral concentration near cavity peripheries. In contrast, the tensile force chains dispersed widely, occurring primarily within crack propagation regions and stress-concentration zones around prefabricated holes. Moreover, cracks propagated preferentially along weakened compressive chain pathways, accompanied by tensile chain fracturing, ultimately forming through-going macroscopic failure bands.
Author Contributions
A.G.: Writing—original draft, Investigation, Visualization, Formal analysis, Data curation, Funding acquisition. J.F.: Review—editing, Investigation, Visualization, Supervision. K.J.: Review—editing, Methodology, Investigation, Visualization, Formal analysis, Supervision. C.Q.: Review—editing, Supervision, Funding acquisition. S.Z.: Review—editing, Investigation, Visualization, Supervision. Y.F.: Review—editing, Visualization. X.M.: Review—editing, Visualization. Z.W.: Review—editing, Supervision, Funding acquisition. All authors have read and agreed to the published version of the manuscript.
Funding
This study was supported by the Shandong Provincial Natural Science Foundation (Grant No. ZR2025QC469), the National Natural Science Foundation of China (Grant No. 52438007 and No. 12172036), the Gansu Provincial Young Doctor Program (Grant No. 2024QB-103), the Gansu Provincial Youth Science and Technology Foundation (Grant No. 24JRRA1012), and the Lanzhou Young Scientific and Technological Talents Innovation Project (Grant No. 2024-QN-74).
Data Availability Statement
The original contributions presented in the study are included in the article. Further inquiries can be directed to the corresponding author.
Conflicts of Interest
Author Jie Fu was employed by the company Power China International Group Limited. The remaining authors declare that the research was conducted in the absence of any commercial or financial relationships that could be construed as a potential conflict of interest.
References
- Labuz, J.F.; Biolzi, L. Experiments with rock: Remarks on strength and stability issues. Int. J. Rock Mech. Min. 2007, 44, 525–537. [Google Scholar] [CrossRef]
- Xing, Y.; Kulatilake, P.; Sandbak, L.A. Rock mass stability investigation around tunnels in an underground mine in USA. Geotech. Geol. Eng. 2017, 35, 45–67. [Google Scholar] [CrossRef]
- Ding, Q.F.; Li, B.; Su, H.J.; Xu, N.W.; Li, X.H.; Deng, X.Y. Damage mechanism and stability analysis of rock mass in the high geo-stress tunnel subjected to excavation. Geomat. Nat. Haz. Risk 2022, 13, 75–93. [Google Scholar] [CrossRef]
- Ren, Q.Y.; Gao, S.L.; Xiao, S.Q.; Meng, X.; Li, Z.Y. Macroscopic and mesoscopic damage characteristics and energy evolution laws of rock mass with double arcuate fractures under uniaxial compression. Int. J. Numer. Anal. Met. 2025, 49, 1038–1057. [Google Scholar] [CrossRef]
- Dong, L.J.; Zhang, Y.H.; Pei, Z.W.; Chen, Y.C.; Yang, L.B. Investigation of quantitative precursory indicators for rock failure using spatio-temporal characteristics of velocity. Measurement 2024, 238, 115275. [Google Scholar] [CrossRef]
- Cai, X.; Yuan, J.F.; Zhou, Z.L.; Pi, Z.Z.; Tan, L.H.; Wang, P.Y.; Wang, S.Y.; Wang, S.F. Effects of hole shape on mechanical behavior and fracturing mechanism of rock: Implications for instability of underground openings. Tunn. Undergr. Space Technol. 2023, 141, 105361. [Google Scholar] [CrossRef]
- Kumar, S.; Tiwari, G.; Das, A. Dynamic behavior of ungrouted and grouted rocks of different morphologies containing a flaw subjected to different thermal treatments. Rock Mech. Rock Eng. 2024, 57, 261–286. [Google Scholar] [CrossRef]
- Zhao, F.; Shi, Z.M.; Yu, S.B.; Zheng, H.C. A review of fracture mechanic behaviors of rocks containing various defects. Undergr. Space 2023, 12, 102–115. [Google Scholar] [CrossRef]
- Qin, Y.; Xu, N.X.; Han, J.; Zhou, W.J. Experimental study on the effects of geometric parameters of filled fractures on the mechanical properties and crack propagation mechanisms of rock masses. Rock Mech. Rock Eng. 2023, 56, 2697–2716. [Google Scholar] [CrossRef]
- Li, D.Y.; Zhu, Q.Q.; Zhou, Z.L.; Li, X.B.; Ranjith, P.G. Fracture analysis of marble specimens with a hole under uniaxial compression by digital image correlation. Eng. Fract. Mech. 2017, 183, 109–124. [Google Scholar] [CrossRef]
- Zhou, Z.L.; Tan, L.H.; Cao, W.G.; Zhou, Z.Y.; Cai, X. Fracture evolution and failure behaviour of marble specimens containing rectangular cavities under uniaxial loading. Eng. Fract. Mech. 2017, 184, 183–201. [Google Scholar] [CrossRef]
- Zhao, X.D.; Zhang, H.X.; Zhu, W.C. Fracture evolution around pre-existing cylindrical cavities in brittle rocks under uniaxial compression. Trans. Nonferr. Met. Soc. 2014, 24, 806–815. [Google Scholar] [CrossRef]
- Carter, B.J.; Lajtai, E.Z.; Yuan, Y. Tensile fracture from circular cavities loaded in compression. Int. J. Fract. 1992, 57, 221–236. [Google Scholar] [CrossRef]
- Yang, S.Q.; Huang, Y.H.; Tian, W.L.; Zhu, J.B. An experimental investigation on strength, deformation and crack evolution behavior of sandstone containing two oval flaws under uniaxial compression. Eng. Geol. 2017, 217, 35–48. [Google Scholar] [CrossRef]
- Zhao, T.D.; Li, Q.; Yu, B.B.; Huang, C.; Gao, Z.H. Mechanical behavior and failure characteristics of rock with double holes. Structures 2023, 54, 38–47. [Google Scholar] [CrossRef]
- Zhao, Z.L.; Jing, H.W.; Shi, X.S.; Han, G.S. Experimental and numerical study on mechanical and fracture behavior of rock-like specimens containing pre-existing holes flaws. Eur. J. Environ. Civ. Eng. 2022, 26, 299–319. [Google Scholar] [CrossRef]
- Sarfarazi, V.; Haeri, H.; Safavi, S.; Marji, M.F.; Zhu, Z.M. Interaction between two neighboring tunnel using PFC2D. Struct. Eng. Mech. 2019, 71, 77–87. [Google Scholar]
- Chen, M.L.; Jing, H.W.; Ma, X.J.; Su, H.J.; Du, M.R.; Zhu, T.T. Fracture evolution characteristics of sandstone containing double fissures and a single circular hole under uniaxial compression. Int. J. Min. Sci. Technol. 2017, 27, 499–505. [Google Scholar] [CrossRef]
- Xue, F.; Lin, Z.Q.; Wang, T.Z. Experimental study on cracking process and fracture properties of granite under mode I loading by acoustic emission and digital image correlation. Fatigue Fract. Eng. Mater. 2023, 46, 1921–1936. [Google Scholar] [CrossRef]
- Xue, F.; Lin, Z.Q.; Wang, T.Z. Experimental study on effects of cyclic loading paths on cracking behavior and fracture characteristics of granite. Eng. Fract. Mech. 2024, 295, 109761. [Google Scholar] [CrossRef]
- Xue, F.; Tong, Z.Y.; Chen, W.; Wang, T.Z.; You, X.B.; Lin, Z.Q. Experimental study on anchorage mechanical effect of rock bolts on cross-jointed rock mass using DIC and AE. Theor. Appl. Fract. Mech. 2025, 137, 104875. [Google Scholar] [CrossRef]
- Cundall, P.A.; Strack, O.D. A discrete numerical model for granular assemblies. Geotechnique 1979, 29, 47–65. [Google Scholar] [CrossRef]
- Cho, N.A.; Martin, C.D.; Sego, D.C. A clumped particle model for rock. Int. J. Rock Mech. Min. 2007, 44, 997–1010. [Google Scholar] [CrossRef]
- Zhang, R.; Li, J. Simulation on mechanical behavior of cohesive soil by Distinct Element Method. J. Terramech. 2006, 43, 303–316. [Google Scholar] [CrossRef]
- Aggelis, D.G. Classification of cracking mode in concrete by acoustic emission parameters. Mech. Res. Commun. 2011, 38, 153–157. [Google Scholar] [CrossRef]
- ElBatanouny, M.K.; Larosche, A.; Mazzoleni, P.; Ziehl, P.H.; Matta, F.; Zappa, E. Identification of cracking mechanisms in scaled FRP reinforced concrete beams using acoustic emission. Exp. Mech. 2014, 54, 69–82. [Google Scholar]
- Elfergani, H.A.; Pullin, R.; Holford, K.M. Damage assessment of corrosion in prestressed concrete by acoustic emission. Constr. Build. Mater. 2013, 40, 925–933. [Google Scholar] [CrossRef]
- Zhao, C.X.; Liu, J.F.; Dai, H.Y.; Yang, J.X.; Shi, X.C.; Wei, J.B. Frictional process, AE characteristics, and permeability evolution of rough fractures on Longmaxi shale with specific roughness under water injection. Eng. Geol. 2024, 339, 107650. [Google Scholar] [CrossRef]
- Zhai, S.B.; Su, G.S.; Yin, S.D.; Zhao, B.; Yan, L.B. Rockburst characteristics of several hard brittle rocks: A true triaxial experimental study. J. Rock Mech. Geotech. 2020, 12, 279–296. [Google Scholar] [CrossRef]
- Li, J.Y.; Liu, D.Q.; He, M.C.; Guo, Y.P.; Wang, H.S. Experimental investigation of true triaxial unloading rockburst precursors based on critical slowing-down theory. Bull. Eng. Geol. Environ. 2023, 82, 65. [Google Scholar] [CrossRef]
- Wang, Y.X.; Zhang, H.; Lin, H.; Zhao, Y.L.; Liu, Y. Fracture behaviour of central-flawed rock plate under uniaxial compression. Theor. Appl. Fract. Mec. 2020, 106, 102503. [Google Scholar] [CrossRef]
- Li, X.F.; Du, K.; Zhou, J.; Yin, Z.Q. Failure behaviors of square-tunnel-structured rock specimens under various inclined boundary stress conditions. Eng. Fail. Anal. 2024, 157, 107888. [Google Scholar] [CrossRef]
- Zhang, S.; Cao, H.; Hu, Q.C.; Peng, S.Y.; Zhang, X.H. Failure mechanism of rock specimens with an elliptical pre-hole under different stress conditions. Theor. Appl. Fract. Mech. 2023, 128, 104133. [Google Scholar] [CrossRef]
Disclaimer/Publisher’s Note: The statements, opinions and data contained in all publications are solely those of the individual author(s) and contributor(s) and not of MDPI and/or the editor(s). MDPI and/or the editor(s) disclaim responsibility for any injury to people or property resulting from any ideas, methods, instructions or products referred to in the content. |
© 2025 by the authors. Licensee MDPI, Basel, Switzerland. This article is an open access article distributed under the terms and conditions of the Creative Commons Attribution (CC BY) license (https://creativecommons.org/licenses/by/4.0/).