Abstract
During the calcination of petroleum coke in a vertical shaft calciner, the particle packing structure exerts a decisive influence on the bed resistance characteristics and further significantly affects the devolatilization efficiency. This study employs three-dimensional computed tomography (CT) scanning technology to digitally reconstruct the pore structure of a packed bed of petroleum coke particles. Moreover, a computational fluid dynamics (CFD) simulation model is developed to simulate gas flow at the pore scale within the packed bed. A systematic analysis is conducted on the influence mechanisms of various factors, including particle size, gas velocity, gas composition, temperature, and bed length, on the gas flow resistance characteristics within the bed. The research findings indicate that the porosity of the packed beds of petroleum coke particles with different sizes ranges from 38.7% to 52%. The pore size within the bed exhibits a positive correlation with particle size, and gas migration predominantly occurs through slit flow. Under identical inlet gas velocity conditions, smaller particle sizes result in higher maximum gas velocities and greater unit pressure drops within the bed. At low gas velocities (e.g., 0.01–0.06 m/s in this work), both the maximum gas velocity and maximum pore pressure demonstrate a significant linear increase. The various factors exhibit different degrees of influence on the unit pressure drop, with particle size having the most significant impact, followed by gas velocity, then temperature, and finally gas composition. Consequently, the relevant research findings provide crucial theoretical support for optimizing the calcination process in vertical shaft calciners, expanding the range of raw material adaptability, and reducing production energy consumption.
1. Introduction
Petroleum coke is an organic solid industrial raw material generated from residual oil of crude oil distillation through the delayed coking process [1]. After high-temperature calcination at 1250–1350 °C, its microstructure exhibits high crystallinity, along with high mechanical strength, excellent thermal and electrical conductivity, good corrosion resistance, and anti-friction properties. Consequently, it is widely applied in the field of advanced carbon material [2], such as graphite electrodes for electric arc furnaces, anodes for lithium-ion batteries, carbon-based nanomaterials, and prebaked anodes for aluminum electrolysis [3,4,5]. Furthermore, as the world’s largest consumer of petroleum coke [6], China relies on vertical shaft calciner (VSC) for over 70% of its petroleum coke calcination [7]. Inside the VSC, petroleum coke undergoes closed calcination in the form of a packed bed. The three-dimensional (3D) pore network structure formed by the interparticle gaps serves as the main channel for the escape of volatile matter, directly influencing the escape direction and efficiency of volatile gases during the calcination process [8]. Currently, the sources and compositions of petroleum coke feedstock are becoming increasingly complex. There is a rising trend in the content of inferior green coke, in particular, with a high fine coke ratio and high sulfur in the feedstock charged into the calciner, posing severe challenges to calcination quality control [9,10,11]. Therefore, a systematic analysis of the flow and transfer laws of volatile gases emitted during the high-temperature calcination process within the pore channels of the packed bed of petroleum coke is of great significance for improving feedstock adaptability, optimizing calcination processes, and enhancing calcination quality.
In recent years, significant progress has been made in the research field of resistance characteristics of particle-packed beds (regarded as porous media) in various reactors, providing valuable references for addressing relevant issues in the petroleum coke calcination process. Currently, the research methods in this field mainly include physical experiments [12,13,14], CFD numerical simulations [15,16], and three-dimensional computed tomography (3D-CT) scanning technology [17,18]. Experimental research primarily involves constructing cold and hot experimental setups to investigate the influence laws of particle size, particle size distribution, gas flow rate, and gas composition on the pressure drop across the particle bed. This research method has been widely applied in equipment such as sintered ore particle-packed beds [14,19], blast furnace waste heat recovery systems [20,21], and coke ovens [22]. Moreover, dimensional analysis relations or modified Ergun equations have been established, offering a certain theoretical basis for understanding the flow resistance characteristics within porous media. In addition, CFD numerical simulation technology reveals the resistance characteristics of particle-packed beds within reactors through numerical modeling. For instance, Zheng et al. [15] proposed a formula for calculating the flow resistance in porous media based on a variable-diameter tube ball model. They validated the accuracy and applicability of the formula using 45 sets of experimental data on porous media resistance under different conditions, providing a new approach for calculating the flow resistance in porous media. Mohammadpour et al. [16] employed a porous media model to conduct CFD simulations of gas mixing within a parallel flow regenerative shaft furnace and verified the accuracy of the simulation results through experiments. The study found that under different particle arrangements and volume ratios, the porous media model could reasonably and accurately predict the gas distribution within the packed bed, demonstrating its potential as a design tool for large-scale shaft furnaces.
For CFD simulations, accurately setting up the 3D structure of particle-packed beds is particularly crucial for the accuracy of the simulation results. Traditional modeling methods often struggle to precisely reproduce the complex structure of particle-packed beds, leading to a certain degree of deviation between the simulation results and the actual situation. In recent years, CT scanning technology has provided a new approach to address this issue. By acquiring projection images of particle-packed beds from different directions and performing 3D reconstruction of the digitized images, a 3D geometric model for CFD simulations can be constructed, enabling precise correspondence between physical experiments and simulations. As a result, this method has received widespread attention across various engineering disciplines [23,24]. For example, Wang et al. [17] conducted a statistical analysis of the micro-parameters of pore fissures in coal samples from the Bayangaole coal mine based on CT scanning technology, revealing the structural characteristics and related parameters of the pore fissures in the coal samples at the micrometer scale. This provided an important basis for a deeper understanding of the pore structure of the coal samples. Wang et al. [25] investigated the evolution characteristics of the bed pore structure during the iron ore sintering process using X-ray CT technology, offering theoretical guidance for the optimization of the iron ore sintering process. Kyrimis et al. [18] obtained the 3D structure of a polydisperse fixed-bed reactor through CT scanning technology and used it for CFD simulations, revealing the significant impact of the bed structure on flow characteristics. They pointed out that the network connectivity formed by large particles is poor, but the pore volume is large, which significantly reduces the flow velocity and pressure drop, providing important insights for reactor design and optimization. Moreover, Monfared et al. [26] studied the influence of the irregularity of biochar particle shapes and particle size distribution on the structural morphology of packed beds using X-ray CT technology. Liang [27] analyzed the resistance coefficient of real porous coal char particles under combustion conditions based on Micro-CT technology and CFD simulations. These studies have shown that the morphological complexity of particles, pore structure characteristics, and the direction of gas flow have a significant impact on the flow resistance of the bed.
Despite the remarkable progress achieved by previous studies in exploring the micro-scale pore structure and macro-level resistance characteristics of particle-packed beds, currently, there are only a limited number of reports on the refined characterization of the pore structure of petroleum coke packed beds and the investigation of internal gas-solid flow characteristics through the integration of CT scanning and CFD simulation techniques. In light of this, this study employs 3D CT scanning technology to digitally reconstruct the pore structure of petroleum coke particle-packed beds. Furthermore, it combines CFD simulation technology to establish a pore-scale gas flow model. A systematic multi-factor simulation study is carried out to thoroughly investigate the influence laws of key parameters, such as particle size distribution, gas flow rate, gas composition, and temperature, on the gas flow resistance within the bed. This study aims to provide theoretical support and technical guidance for the optimization of the petroleum coke calcination process in the VSC, thereby promoting the high-quality and sustainable development of the petroleum coke industry.
2. Experiment
2.1. Experimental Materials
The experimental material is calcined petroleum coke sourced from a carbon plant in China. In accordance with the Chinese standard GB/T 6003.1-2022 [10,11], the petroleum coke was sieved using 2–12 mesh sieves, yielding experimental samples in four distinct particle-size fractions: −12.5 + 8.0 mm, −5.0 + 3.2 mm, −3.2 + 2.5 mm, and −2.0 + 1.6 mm.
2.2. Characterization of Pore Structure in Petroleum Coke Packed Bed
An industrial 3D CT scanner (Industrial CT, MultiscaleVoxel-2000, Tianjin, China) was employed for non-destructive characterization of the pore structure of the packed bed of petroleum coke particles. To facilitate the detection of loosely packed petroleum coke particles, a custom-made acrylic cylindrical tube was used as the sample container. It had an outer diameter D of 90 mm and a height H of 100 mm. Figure 1 presents a schematic diagram of the cylindrical tube filled with petroleum coke particles for 3D CT testing. The petroleum coke particles were uniformly and densely filled into the interior of the cylindrical tube until it was fully filled. Subsequently, glue was applied to seal both ends of the cylindrical tube.
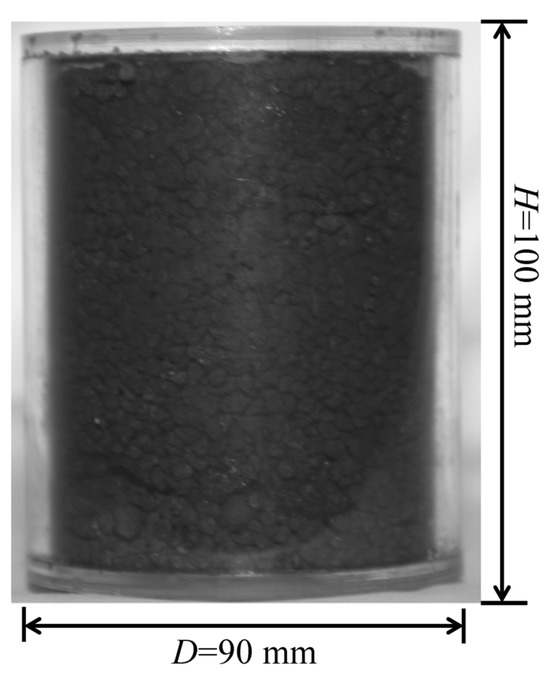
Figure 1.
Schematic diagram of cylindrical tube packed with petroleum coke particles for 3D CT testing.
Based on CT scanning and image processing techniques, a systematic characterization of the pore structure of packed petroleum coke particle beds was conducted, and corresponding 3D digital models were constructed. Figure 2 displays the 3D CT-scanned digital images of packed beds of petroleum coke particles with different particle sizes. Among them, Figure 2a–d are the central cross-sections of the 3D CT scanned samples; Figure 2e–h are the 3D views after binarization threshold segmentation and morphological contour separation operations; Figure 2i–l are the top views; and Figure 2m–p are the statistical particle size distribution diagrams. Table 1 presents porosity calculation results of petroleum coke packed beds at various size fractions. As can be seen from Figure 2 and Table 1, the pore sizes between petroleum coke particles are generally on the same scale level as the particle sizes. Moreover, it is observed that larger particle sizes are associated with larger pore sizes between particles. Through binarization threshold segmentation combined with quantitative analysis [28], the porosities of packed beds of petroleum coke particles with four different particle size fractions, namely −12.5 + 8.0 mm, −5.0 + 3.2 mm, −3.2 + 2.5 mm, and −2.0 + 1.6 mm, were measured to be 52%, 44.5%, 46.7%, and 38.7%, respectively. The obtained outcomes exhibit a high degree of conformity with the earlier measurements that were derived using the water displacement method by Reference [11], as shown in Table 1.
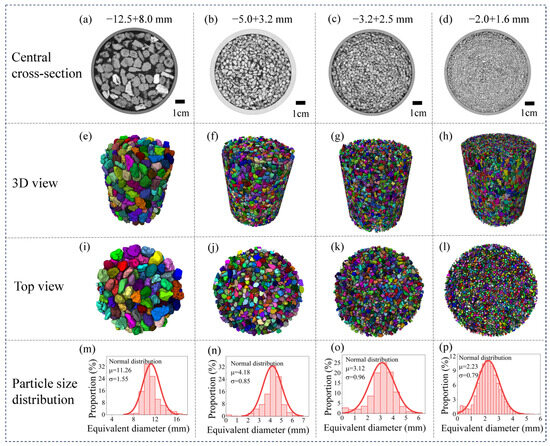
Figure 2.
3D CT scanning digital images of petroleum coke particle packed beds with different particle sizes: (a–d) central cross-sections, (e–h) 3D views, (i–l) top views, and (m–p) particle size distribution diagrams.

Table 1.
Porosity calculation results of petroleum coke packed beds at various size fractions.
3. Simulation Model for Gas Flow at Pore Scale in Packed Bed of Petroleum Coke Articles
Based on the geometric structure of the 3D CT-scanned digital images of the packed bed of petroleum coke particles in the acrylic circular tube, a two-dimensional bed layer region was extracted for geometric modeling. Mesh generation was carried out using CFD numerical simulation technology. A gas flow simulation model for the packed bed was constructed. Subsequently, multi-factor simulation experiments were implemented to investigate the influence patterns of petroleum coke particle size, gas velocity, temperature, gas composition, and bed size on the flow characteristics of the packed bed.
3.1. Mathematical Model
The continuity equation for laminar flow within pores is as follows:
Momentum conservation is described by the Navier-Stokes equations:
where ρ represents the fluid density, kg·m−3; u denotes the fluid velocity, m·s−1; p is the pressure, Pa; and μ signifies the dynamic viscosity of the fluid, Pa·s.
The setting of boundary conditions mainly involves three types: inlet, outlet, and lateral boundaries. The inlet boundary conditions are as follows:
where n represents the unit vector; U0 is the normal inflow velocity, m·s−1.
The outlet boundary conditions are as follows:
where p0 is the steady-state initial value, which is assumed to be p0 = 0 Pa.
The heat transfer equations for solids and fluids are as follows:
where Cp represents the specific heat capacity, J·(kg·K)−1; λ is the thermal conductivity, W·(m∙K)−1; and T denotes the temperature, K.
The boundary condition for the temperature field is a constant temperature boundary condition:
The system of partial differential equations composed of the aforementioned governing equations is discretized using the finite element method and then computed through direct solution methods for systems of linear equations.
3.2. Geometric Modeling and Mesh Generation
In Figure 3, a schematic representation outlining the simulation technical approach pertaining to the resistance properties associated with the pore structure within the petroleum coke bed is presented. In this study, three-dimensional images of the petroleum coke particle packed bed within an acrylic cylindrical tube were first obtained using an industrial CT scanner. Subsequently, a specific cross-sectional area of the particle packed bed was extracted to obtain its two-dimensional geometric structure. Then, the two-dimensional geometric structure image underwent binary threshold segmentation to be converted into a binary image for subsequent processing. After that, vectorization operations were performed on the segmented image to obtain a vectorized file of the geometric structure. Finally, CFD software was employed for mesh generation and two-dimensional modeling and simulation.
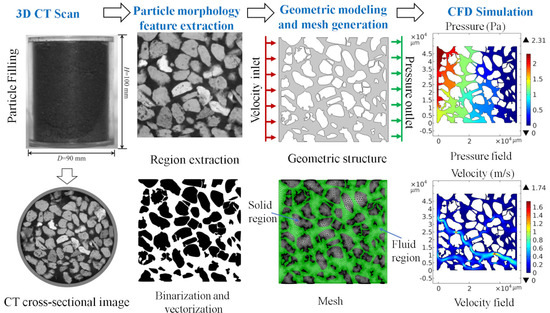
Figure 3.
Technical roadmap for the simulation model of resistance characteristics of pore structures in petroleum coke packed beds.
3.3. Model Parameters
The fluid medium utilized in the model is a volatile gas mixture. The gas flow velocity at the left inlet is 0.06 m∙s−1, while the right side is designated as a pressure outlet set to 0 Pa, as illustrated in the geometric schematic diagram in Figure 3. The top and bottom sides are defined as wall boundaries. Through CT scanning, computer image processing, and CFD numerical simulation techniques, the transport behavior of volatile gases within the packed bed of petroleum coke was examined. The seepage patterns of volatiles in the inter-particle gaps of petroleum coke at the pore scale, as well as the gas migration pathways, were explored. Specific simulation experimental conditions are outlined in Table 2. The baseline operating conditions are as follows: particle size is −2.0 + 1.6 mm, gas flow velocity is 0.06 m/s, the bed length is 50 mm, and the temperature is 1500 K. The gas composition is a volatile gas mixture with a volume ratio of CH4:H2:CO:N2 = 30:60:5:5 [28]. The fundamental physical property data employed in the simulation were calculated using thermodynamic polynomials for each substance sourced from the NIST standard reference database [29], and the properties of the gas mixture were computed using a volume-averaged method.

Table 2.
Simulation experimental conditions for gas flow in pore structures of the beds.
4. Results and Discussion
4.1. Model Validation
In our previous studies, a modified Ergun equation for packed beds of petroleum coke particles under various charging patterns was derived based on experimental research [11], as shown in Equation (7). To further validate the accuracy of the computational results obtained from the CFD simulation model for gas flow within the packed bed of petroleum coke particles developed in this study, the experimental data were compared with the simulation results.
where ΔP is the pressure difference between two test points, Pa; L is the distance between two test points, m; ε is the porosity of the coke bed; dp is the average particle diameter, m.
Figure 4 presents a comparison of pressure drop values calculated using the experimentally derived modified Ergun equation and those obtained from CFD simulations for packed beds with varying particle sizes. As shown in Figure 4, the pressure difference calculated for the packed bed of fine particles (−2.0 + 1.6 mm) exhibits the largest deviation from the simulated values, which is notably larger than the deviations observed in packed beds composed of coarser particles. However, the maximum deviation remains below 15%. This suggests a substantial consistency between the CFD simulation results and the calculations based on the modified Ergun equation (Equation (7)). A more in-depth analysis of the deviation sources indicates that the CFD simulation constructs the bed porosity structure based on the assumption of a uniform particle size. This assumption hampers the accurate representation of the pore characteristics resulting from the actual complex particle size distribution. In contrast, the modified Ergun equation is derived from statistically averaged experimental data, and inherent measurement errors in the experiments contribute to the unavoidable discrepancies in the calculated pressure drop values between the two approaches. Nevertheless, the overall deviations are minor and fall within acceptable limits, demonstrating the high reliability of the simulation results.
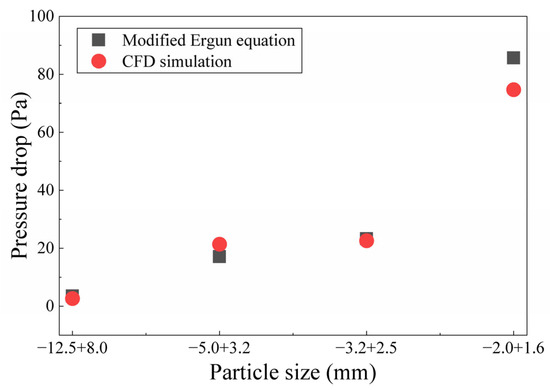
Figure 4.
Comparison of pressure drop values in packed beds with different particle sizes: calculations using the modified Ergun equation [11] based on experimental data and CFD simulation results.
4.2. Effect of Particle Size on Bed Resistance Properties
The inter-particle void structure in a packed bed of petroleum coke is closely related to particle size and morphology. For this reason, the alteration in flow characteristics of volatile gases within a 50 mm (length) × 50 mm (width) packed bed with respect to particle size was investigated. Figure 5 presents the cloud maps of the pressure field and the gas velocity field within the packed particle bed under the conditions of particle sizes of −12.5 + 8.0 mm, −5.0 + 3.2 mm, −3.2 + 2.5 mm, and −2.0 + 1.6 mm. As can be seen from Figure 5, the packed bed of petroleum coke particles exhibits typical porous media characteristics, where the macroscopic fissures with highly interconnected structures constitute the main low-resistance flow channels for volatile gases. Meanwhile, there is a significant pressure gradient distribution in the fissure regions, which further drives the gas to flow directionally along the fissures from high-pressure areas to low-pressure areas, thus forming a typical fissure flow migration pattern. Under the same gas flow velocity conditions (a velocity inlet of 0.06 m/s on the left side), as the particle size decreases from −12.5 + 8.0 mm to −2.0 + 1.6 mm, the maximum gas velocity increases from 1.75 to 2.45 m/s, and the maximum bed pressure drop rises from 2.65 to 74.7 Pa, increasing by a factor of 28. This indicates that a reduction in particle size leads to a significant increase in both the maximum gas velocity and bed pressure drop within the pore channels. Moreover, this result is consistent with the research conclusions reported by Hassan et al. [30] and Wang et al. [31], which state that a decrease in particle size (usually leading to a reduction in porosity) significantly increases the bed pressure drop. Additionally, the reduction in porosity implies a narrowing of the gas flow channels, which may in turn lead to an increase in the maximum gas velocity.
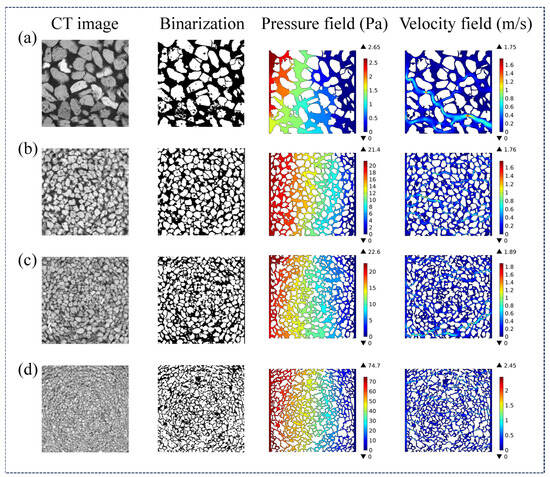
Figure 5.
CT scan images of packed particle beds and the corresponding gas flow cloud diagrams under varying particle size distributions: (a) −12.5 + 8.0 mm; (b) −5.0 + 3.2 mm; (c) −3.2 + 2.5 mm; (d) −2.0 + 1.6 mm.
4.3. Effect of Gas Velocity on Bed Resistance Properties
Figure 6 presents the contour maps of the velocity field and pressure field of volatile gases within the packed beds of petroleum coke particles with particle sizes of −12.5 + 8.0 mm and −2.0 + 1.6 mm under four gas velocity conditions: 0.01, 0.02, 0.04, and 0.06 m/s. Figure 7 illustrates the trends of the maximum gas velocity and maximum pressure within the bed pores as a function of different gas velocity conditions. From Figure 6 and Figure 7, for the packed bed of large particles with a size of −12.5 + 8.0 mm, when the inlet gas velocity increases from 0.01 to 0.06 m/s, the location of the region with the maximum pore gas velocity remains stable. The maximum pore gas velocity increases from 0.294 to 1.75 m/s, and the maximum pressure rises from 0.437 to 2.65 Pa, showing a six-fold increase. On the other hand, for the packed bed of fine particles with a size of −2.0 + 1.6 mm, within the same inlet velocity range, the maximum pore gas velocity increases from 0.411 m/s to 2.45 m/s, and the maximum pressure rises from 12.4 to 74.7 Pa, also showing a six-fold increase. The maximum gas velocity and maximum pore pressure exhibit a significant linear growth pattern. The study by Shen et al. [32] pointed out that at the microscopic pore scale, when the gas velocity is relatively low (such as the range of 0.01–0.06 m/s in this study), the viscous resistance plays a dominant role. This viscous resistance is linearly related to the velocity, and an increase in velocity at this stage mainly results in a linear increase in the pressure gradient. This phenomenon is consistent with the research conclusions of the present study. However, if the gas velocity exceeds a certain critical value, the inertial resistance, which is proportional to the square of the velocity, gradually begins to play a dominant role. Consequently, the pore gas velocity will exhibit a non-linear growth trend as the inlet gas velocity increases.
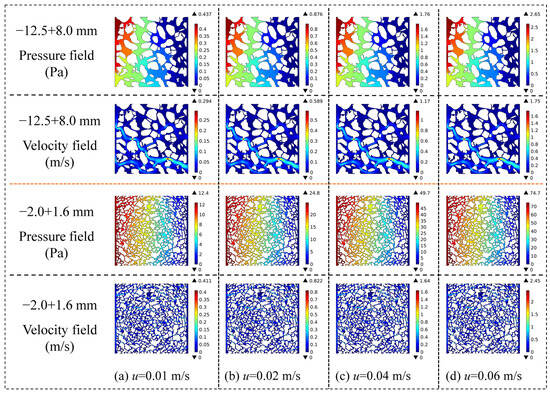
Figure 6.
Distribution cloud maps of the gas velocity field and pressure field inside the bed under different inlet gas velocity conditions.
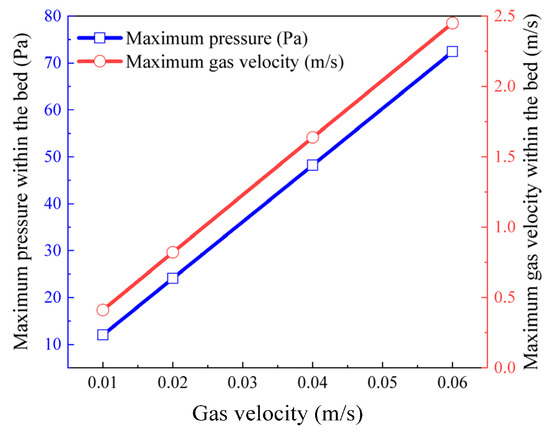
Figure 7.
Variation curves of the maximum gas velocity and maximum pressure inside the bed under different gas velocity conditions.
4.4. Effect of Bed Length on Bed Resistance Properties
As a crucial dimensionless number in fluid mechanics, the Reynolds number is employed to characterize the ratio of inertial force to viscous force during fluid flow, and serves as an important basis for determining the flow regime (laminar or turbulent flow) of the fluid. The Reynolds number, denoted as Re, can be calculated using Equation (8):
where d represents the characteristic length of the bed pore structure, m.
After substituting the extreme conditions in this study, such as the maximum pore size and the maximum fluid velocity, into Equation (8), it is obtained that Re is less than 10. Therefore, the gas flow in the packed bed of petroleum coke particles can be classified as laminar flow, where the flow resistance is primarily generated by the fluid’s viscous force, while the inertial force has a relatively minor impact. Given that the pore size is significantly larger than the mean free path of the fluid molecules (validating the continuum hypothesis), the flow conforms to the characteristics of Darcy flow.
To investigate the influence of the bed length on the migration of volatile gases within the bed, the evolution patterns of the pressure field and velocity field of volatile gases were examined under four operating conditions with bed lengths of 50, 100, 150, and 200 mm. Figure 8 shows the contour maps of the gas velocity field and pressure field within the packed bed of petroleum coke particles with a size of −12.5 + 8.0 mm under different bed lengths. Figure 9 presents the variation curves of the maximum gas velocity and maximum pressure within the bed under different bed lengths. From Figure 8 and Figure 9, when the bed length L increases from 50 to 200 mm, the maximum pressure in the bed rises from 2.65 to 8.10 Pa, with an increase of approximately 3.1 times. This is mainly attributed to the combined effects of the linear resistance in Darcy flow, the heterogeneity of the pore structure (such as tortuosity and pore size distribution), and inertial effects, which result in a non-linear increase in pressure with length. In contrast, the maximum gas velocity only increases from 1.75 to 1.81 m/s (an increase of about 3%). This is because, according to Darcy’s law, although the pressure increases with the increase in bed length, the increase is limited if the permeability decreases. Moreover, the gas velocity is mainly influenced by the inlet gas flow rate, so it changes slightly with the increase in bed length.
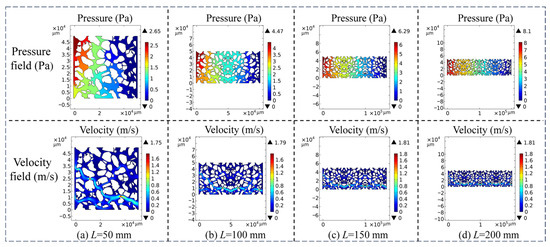
Figure 8.
Contour maps of gas flow velocity field and pressure field distribution in the bed porosity under varying bed lengths.
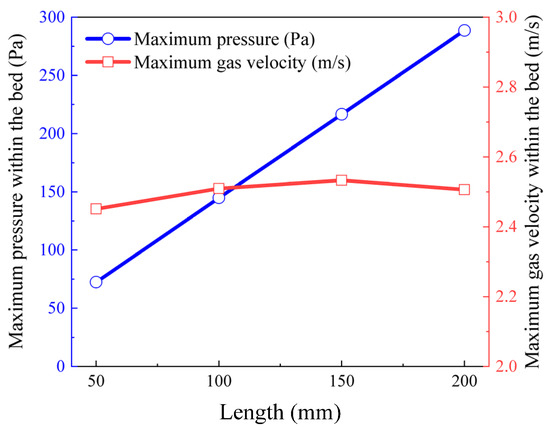
Figure 9.
Variation curves of the maximum gas velocity and maximum pressure within the bed under different bed lengths.
4.5. Effect of Temperature on Bed Resistance Properties
Figure 10 presents the contour maps of the unit pressure drop within the bed under different volatile gas temperatures and inlet flow velocities. As can be seen from Figure 10, under a constant gas inlet flow velocity, the pressure drop within the packed bed of fine petroleum coke particles with a size of −2.0 + 1.6 mm shows a significant increasing trend with the rise in gas temperature (from 600 K to 1500 K). Taking an inlet flow velocity of 0.06 m/s as an example, the unit pressure drop in the pores increases from 800.2 to 1448.92 Pa/m, with an increase of 1.8 times. This is because an increase in temperature intensifies the thermal motion of gas molecules, enhancing the collision frequency between molecules and the pore walls, thus increasing the pressure within the pores [33]. Meanwhile, under the constraint of a fixed bed volume, gas expansion due to heating further compresses the pore space, resulting in a pressure superposition effect. Under a constant gas temperature, the pressure drop in the bed increases significantly with an increase in the inlet flow velocity. Taking 1200 K as an example, when the flow velocity increases, the unit pressure drop in the pores rises from 209.42 to 1261.06 Pa/m, with an increase of 6.0 times. This is because an increase in gas flow velocity results in an increase in the mass of gas entering the bed pores per unit time. According to the ideal gas law, at a constant temperature, pressure is directly proportional to the amount of gas substance, leading to a further increase in the pressure drop.
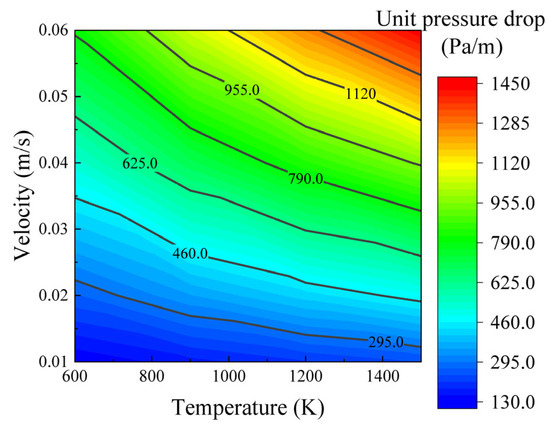
Figure 10.
Contour map of unit pressure drop in bed under different gas temperatures and inlet flow rates.
4.6. Effect of Gas Composition on Bed Resistance Properties
Figure 11 shows the pressure variation curves within the bed voids under different gas compositions (represented by kinematic viscosity). As can be seen from Figure 11, taking 1500 K as an example, the unit pressure drops of H2, the volatile mixture gas, CH4, and CO gases within the particle bed are 1227.4, 1448.9, 1655.2, and 1861.0 Pa/m, respectively. This indicates that gases with larger average molecular weights and lower kinematic viscosities encounter greater resistance when passing through particle pores. Qian et al. [34] explained the reason for the phenomenon that gases with higher molecular weights are more difficult to pass through pores from the perspective of molecular dynamics: In the free-molecular flow regime, gases with larger molecular weights exhibit an increased collision frequency. This results in a rise in gas viscosity, a reduction in kinematic viscosity, and consequently, a decrease in their transport rate. Moreover, the kinematic viscosity of gases continuously increases with rising temperature. Taking the volatile mixture gas as an instance, as the temperature climbs from 600 to 1500 K, the unit pressure drop within the bed rises from 800.2 to 1448.9 Pa/m. This is because an increase in temperature intensifies the thermal motion of gas molecules, enhancing the collision frequency and energy between molecules and the pore walls, thereby causing an increase in pressure within the pores. Furthermore, as revealed in the research by Xiong et al. [35], gas viscosity exhibits a correlation akin to the square root of temperature when subjected to high-magnitude temperature and pressure conditions. This serves to confirm the conclusions drawn in this study.
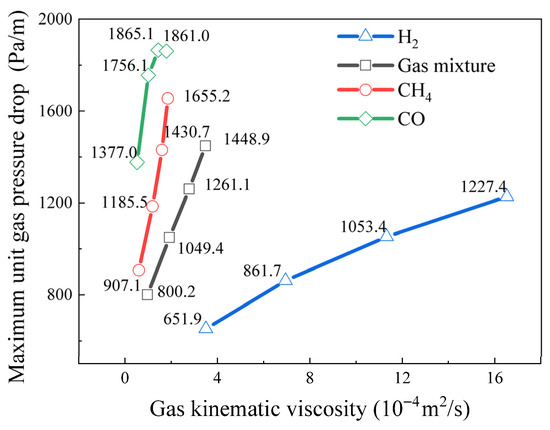
Figure 11.
Relationship curves between y pressure in the bed voids under different gas compositions and temperature conditions.
4.7. Evaluation of the Influence Degree of Various Factors
An L27 (313) orthogonal experimental table was employed to investigate the impacts of particle size (A), gas flow velocity (B), temperature (C), and gas composition (D) on the unit pressure drop of the bed. The experimental conditions and results are detailed in Table 3, while the results of the analysis of variance (ANOVA) are presented in Table 4. The main effect plot of the K values for each factor is shown in Figure 12, and the pie chart illustrating the degrees of contribution of diverse factors to the unit pressure drop of the bed is depicted in Figure 13.

Table 3.
Orthogonal experimental design table L27 (313) for factors influencing resistance characteristics.

Table 4.
Analysis of Variance (ANOVA) for factors influencing resistance characteristics.
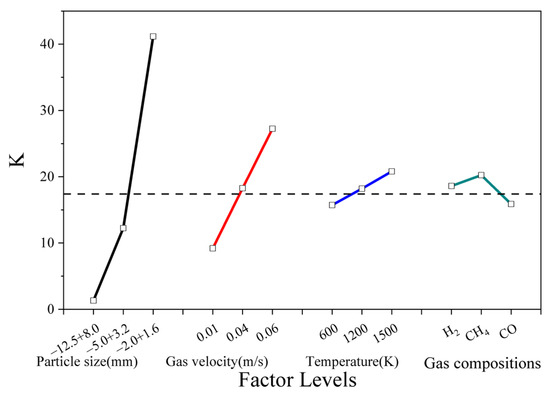
Figure 12.
Effects of each factor on K values.
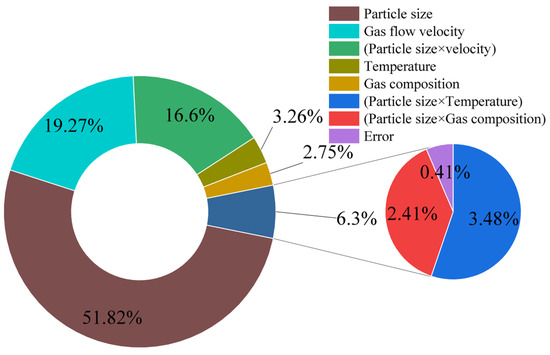
Figure 13.
Pie chart illustrating the degrees of contribution of diverse factors to the unit pressure drop of the bed.
As can be seen from Figure 12, when the particle size (A) decreases, the K value increases. This is because a reduction in particle size leads to a decrease in the inter-particle voids, enhancing the obstruction to gas flow. Consequently, the flow resistance coefficient related to the K value increases, indicating that particle size has a significant impact on the K value. When the gas flow velocity (B) increases, the K value rises. An acceleration in velocity intensifies the impact force of the gas on the particles, exacerbates the relative motion among particles, complicates the bed structure, and increases the resistance to gas flow, thereby elevating the K value. This impact is prominent. As the bed temperature (C) increases, the K value also increases correspondingly. Within a certain range, temperature changes affect the gas viscosity and particle surface properties, enhancing the gas-particle interaction, which results in an increase in bed resistance and a rise in the K value, although the impact is relatively minor. Regarding gas composition (D), as the kinematic viscosity of the gas increases, the K value first increases and then decreases. When the viscosity is low, an increase in viscosity raises the gas-particle friction force, causing the K value to rise. However, when the viscosity is excessively high, the gas flow characteristics change, making it easier for the gas to bypass the particles. This leads to a decrease in bed resistance and a reduction in the K value. The impact in this case is complex and relatively weak.
Combining the information from Table 3, Table 4, and Figure 13, the orthogonal experiment reveals that the A × B interaction has a relatively large impact, followed by the A × C and A × D interactions. According to the ANOVA, the p-values for the A × B, A × C, and A × D interactions are all less than 0.05, indicating statistical significance. The A × B interaction reflects the mutual influence between particle size and gas flow velocity, which jointly affects the K value. For instance, when the particle size is small, an increase in gas flow velocity has a more pronounced effect on the K value. Conversely, when the particle size is large, the impact of gas flow velocity diminishes.
From Figure 13, it can be observed that the factors contributing to the unit pressure drop of the particle bed, in descending order of contribution, are as follows: particle size (A) is the dominant factor; gas flow velocity (B) is also important; the A × B interaction reflects the synergistic effect; bed temperature (C) has a relatively minor impact; and gas composition (D) has the weakest impact.
5. Conclusions
This study digitally reconstructed the pore structure of a petroleum coke particle packed bed based on 3D CT scanning technology in conjunction with computer graphics. Additionally, it explored the influence mechanisms of particle size, gas velocity, gas composition, temperature, and bed length on the gas flow resistance characteristics within the bed layer by utilizing CFD numerical simulation technology. The main conclusions obtained are as follows:
- (1)
- Based on extracting typical 2D bed geometric structures from 3D CT scanning images and generating meshes, a CFD simulation model for pore-scale gas flow in a petroleum coke particle packed bed was developed. Numerically computed bed pressure drop values closely matched those calculated using the revised Ergun equation, with a data discrepancy of less than 15%, confirming the model’s reliability.
- (2)
- The interstitial spaces in the petroleum coke bed are the primary migration channels for volatile gases, with gas migrating via interstitial flow. Under a constant gas flow rate, as particle size decreases from −12.5 + 8.0 mm to −2.0 + 1.6 mm, the maximum gas flow velocity climbs from 1.75 m/s to 2.45 m/s, and the bed pressure drop surges from 2.65 Pa to 74.7 Pa, a 28-fold increase. Within the low-velocity range of 0.01–0.06 m/s, both the maximum gas flow velocity and the maximum pore pressure in the bed exhibit a significant linear increase with the gas flow rate. The bed pressure drop also increases significantly with rising gas temperature and inlet flow velocity. Additionally, a larger gas molecular weight decreases gas kinematic viscosity, thereby reducing its transport rate.
- (3)
- By using orthogonal experimental design and ANOVA analysis, the influence of various factors on the unit pressure drop of the petroleum coke packed bed layer was clarified. Experimental results show that particle size has the greatest impact, followed by gas flow velocity, temperature, and gas composition.
Author Contributions
Conceptualization, J.L. and J.H.; Data curation, J.H.; Formal analysis and Funding acquisition, J.H.; Investigation, J.L.; Methodology, Project administration, Resources, J.H.; Software, J.L.; Supervision, J.L. and S.Z.; Validation, J.H.; Visualization, J.L. and S.Z.; Writing–original draft, J.H. and J.L.; Writing—review & editing, J.H., J.L. and S.Z. All authors have read and agreed to the published version of the manuscript.
Funding
This work is financially supported by the Jiangxi Provincial Natural Science Foundation of China (20242BAB25251), the National Natural Science Foundation of China (52004112), the Program of Qingjiang Excellent Young Talents of Jiangxi University of Science and Technology (JXUSTQJYX2020016), the Scientific Research Foundation of Jiangxi University of Science and Technology (205200100517), the Jiangxi Provincial Key Laboratory of High-Performance Steel and Iron Alloy Materials (2024SSY05041).
Data Availability Statement
The original contributions presented in this study are included in the article, further inquiries can be directed to the corresponding author.
Conflicts of Interest
Author Songlin Zhou was employed by the company Yanggu Xiangguang Copper Company Ltd. The remaining authors declare that the research was conducted in the absence of any commercial or financial relationships that could be construed as a potential conflict of interest.
References
- Shen, F.H.; Qu, S.M.; Li, J.Y.; Yang, Z.H.; Zhou, C.G.; Yang, F.; He, Z.Q.; Xiang, K.S.; Shi, M.Q.; Liu, H. Development of chemical looping desulfurization method for high sulfur petroleum coke. Fuel 2024, 357, 129658. [Google Scholar] [CrossRef]
- Zheng, B.; Liu, Y.Q.; Zou, L.C.; Li, R.W.; Karimi, N. Heat transfer characteristics of calcined petroleum coke in waste heat recovery process. Math. Probl. Eng. 2016, 2016, 2649383. [Google Scholar] [CrossRef]
- Lou, B.; Zhang, J.; Li, J.; Chai, L.; Shi, N.; Wen, F.; Yang, X.; Huang, X.; Tian, L.; Liu, D. Comparative study on devolatilization behavior, microstructural evolution and resultant properties during calcination of petroleum coke with distinct mesophase texture. J. Anal. Appl. Pyrol. 2024, 177, 106329. [Google Scholar] [CrossRef]
- Cabral, R.L.B.; Galvão, E.R.V.P.; Fechine, P.B.A.; Galvão, F.M.F.; Nascimento, J.H.O.D. A minireview on the utilization of petroleum coke as a precursor for carbon-based nanomaterials (CNMS): Perspectives and potential applications. RSC Adv. 2024, 14, 19953–19968. [Google Scholar] [CrossRef]
- Wang, S.Y.; Sun, X.J.; Xie, L.F.; Ji, Y.J.; Lu, L.W.; Chen, Y.Q.; Huang, H.M.; Ye, D.Q. Preparation of heteroatom-doped hyper-crosslinked polymers via waste utilization of sulfur-containing petroleum coke: A promising adsorbent for CO2 capture. Environ. Pollut. 2025, 365, 125397. [Google Scholar] [CrossRef]
- Luo, Y.T.; Lu, B.; Deng, Y.X.; Yang, J.N. Analysis of China’s petroleum coke market in 2023 and forecast for 2024. Int. Pet. Econ. 2024, 32, 62–68. (In Chinese) [Google Scholar]
- Huang, J.D.; Li, J.; Li, M.Z.; Yan, K. Orthogonal design-based grey relational analysis for influence of factors on calcination temperature in shaft calciner. J. Chem. Eng. Jpn. 2019, 52, 811–821. [Google Scholar] [CrossRef]
- Huang, J.D.; Zhang, D.; Li, J. Influence mechanism of migration path of petroleum coke pyrolysis volatiles in a vertical shaft calciner. J. Cent. South Univ. (Sci. Technol.) 2023, 54, 465–476. [Google Scholar]
- Liu, L.C.; Cao, H.J.; Xiang, D.; Xia, Y.Y.; Li, P.; Zhou, Z.S. Technical and life cycle performance comparison between petroleum coke chemical looping combustion and oxy-combustion combining with advanced steam cycles for power generation processes. J. Clean Prod. 2023, 417, 137960. [Google Scholar] [CrossRef]
- Huang, J.D.; Lu, H.; Li, J.; Yang, Y.M. Heat transfer characteristics of petroleum coke particle packed bed: An experimental and CFD simulation study. Asia-Pac. J. Chem. Eng. 2025, 20, e3174. [Google Scholar] [CrossRef]
- Huang, J.D.; Lu, H.; Li, J.; Yang, Y.M. Resistance characteristics and particle movement behavior of a petroleum coke particle packed bed in a vertical shaft calciner under different burden distribution methods. Asia-Pac. J. Chem. Eng. 2024, 19, e3105. [Google Scholar] [CrossRef]
- Feng, J.S.; Dong, H.; Liu, J.Y.; Liang, K.; Gao, J.Y. Experimental study of gas flow characteristics in vertical tank for sinter waste heat recovery. Appl. Therm. Eng. 2015, 91, 73–79. [Google Scholar] [CrossRef]
- Feng, J.S.; Dong, H.; Li, H.Z.; Gao, J.Y. Flow resistance characteristics in vertical tank for sinter waste heat recovery. J. Cent. South Univ. (Sci. Technol.) 2017, 48, 867–872. [Google Scholar]
- Zhang, S.Z.; Wen, Z.; Liu, X.L.; Zhang, H.; Liu, X.H.; Wang, S. Effects of particle shape on permeability and resistance coefficients of sinter packed bed. J. Cent. South Univ. (Sci. Technol.) 2021, 52, 1066–1075. [Google Scholar]
- Zheng, K.C.; Liu, B.; Ren, F.Y.; Yang, S.Y.; Li, Z.D.; Hu, J.L. Theoretical derivation and analysis of flow resistance formula in porous media based on variable diameter tube ball model. Int. J. Heat Fluid Flow 2024, 107, 109326. [Google Scholar] [CrossRef]
- Mohammadpour, K.; Hermann, W.; Specht, E. CFD simulation of cross-flow mixing in a packed bed using porous media model and experimental validation. Comput. Part. Mech. 2019, 6, 157–162. [Google Scholar] [CrossRef]
- Wang, G.; Shen, J.N.; Chu, X.Y.; Cao, C.J.; Jiang, C.H.; Zhou, X.H. Characterization and analysis of pores and fissures of high-rank coal based on CT three-dimensional reconstruction. J. China Coal Soc. 2017, 42, 2074–2080. (In Chinese) [Google Scholar]
- Kyrimis, S.; Raja, R.; Armstrong, L. Image processing of computed tomography scanned poly-dispersed beds for computational fluid dynamic studies. Adv. Powder Technol. 2023, 34, 104199. [Google Scholar] [CrossRef]
- Zhang, S.Z.; Wen, Z.; Liu, X.L.; Xing, Y.; Zhang, H. Gas flow characteristics through irregular particle bed with the vertical confined wall for waste heat recovery. Int. J. Photoenergy 2022, 2022, 1890541. [Google Scholar] [CrossRef]
- Zhang, S.Z.; Wen, Z.; Liu, X.L.; Liu, X.H.; Wang, S.; Zhang, H. Experimental study on the permeability and resistance characteristics in the packed bed with the multi-size irregular particle applied in the sinter vertical waste heat recovery technology. Powder Technol. 2021, 384, 304–312. [Google Scholar] [CrossRef]
- Schwarzmayr, P.; Birkelbach, F.; Walter, H.; Javernik, F.; Schwaiger, M.; Hofmann, R. Packed bed thermal energy storage for waste heat recovery in the iron and steel industry: A cold model study on powder hold-up and pressure drop. J. Energy Storage 2024, 75, 109735. [Google Scholar] [CrossRef]
- Zhang, G.J.; Zhao, P.Y.; Xu, Y.; Zhang, Y.F. Characteristics of pressure drop of charred layer in coke dry quenching over coke oven gas. Energy Fuels 2017, 31, 4548–4555. [Google Scholar] [CrossRef]
- Leißner, T.; Diener, A.; Löwer, E.; Ditscherlein, R.; Krüger, K.; Kwade, A.; Peuker, U.A. 3D ex-situ and in-situ X-ray CT process studies in particle technology-A perspective. Adv. Powder Technol. 2020, 31, 78–86. [Google Scholar] [CrossRef]
- du Plessis, A.; Yadroitsev, I.; Yadroitsava, I.; Le Roux, S.G. X-ray microcomputed tomography in additive manufacturing: A review of the current technology and applications. 3D Print. Addit. Manuf. 2018, 5, 227–247. [Google Scholar] [CrossRef]
- Wang, J.K.; Ma, P.N.; Meng, H.X.; Cheng, F.Z.; Zhou, H. Investigation on the evolution characteristics of bed porous structure during iron ore sintering. Particuology 2023, 74, 35–47. [Google Scholar] [CrossRef]
- Monfared, Z.G.; Hellström, J.G.I.; Umeki, K. Effect of particle irregularity and particle size distribution on the morphology of packed beds of biochar particles. Sci. Rep. 2025, 15, 15086. [Google Scholar] [CrossRef] [PubMed]
- Liang, D. A comprehensive study on the effects of porous char particles on drag coefficients under combustion based on micro-CT and pore-resolving simulation. Powder Technol. 2025, 460, 121073. [Google Scholar] [CrossRef]
- Wang, C.H.; Chen, W.Z.; Liu, W.N. Testing and analyses on thermal physical parameters of green petroleum in coke calcining kin. Energy Metall. Ind. 2007, 26, 61–63. (In Chinese) [Google Scholar]
- Linstrom, P.J.; Mallard, W.G. (Eds.) NIST Chemistry WebBook, NIST Standard Reference Database Number 69; National Institute of Standards and Technology: Gaithersburg, MA, USA, 2025. [Google Scholar]
- Hassan, E.B.E.; Hoffmann, J. Review on pressure drop through a randomly packed bed of crushed rocks. Discov. Appl. Sci. 2024, 6, 126. [Google Scholar] [CrossRef]
- Wang, Y.W.; Lu, T. Influence of the particle diameter and porosity of packed porous media on the mixing of hot and cold fluids in a T-junction. Int. J. Heat Mass Transf. 2015, 84, 680–690. [Google Scholar] [CrossRef]
- Shen, W.J.; Song, F.Q.; Hu, X.; Zhu, G.M.; Zhu, W.Y. Experimental study on flow characteristics of gas transport in micro- and nanoscale pores. Sci. Rep. 2019, 9, 10196. [Google Scholar] [CrossRef] [PubMed]
- Li, Z.Q.; Wang, A.J.; Li, L.; Li, J.L.; Zhang, N.C.; Jin, K.Q.; Chang, J. Influence mechanism of gas pressure on multiscale dynamic apparent diffusion-permeability of coalbed methane. ACS Omega 2023, 8, 35964–35974. [Google Scholar] [CrossRef] [PubMed]
- Qian, J.H.; Wu, H.A.; Wang, F.C. A generalized knudsen theory for gas transport with specular and diffuse reflections. Nat. Commun. 2023, 14, 7386. [Google Scholar] [CrossRef] [PubMed]
- Xiong, W.; Zhang, L.H.; Zhao, Y.L.; Hu, Q.Y.; Tian, Y.; He, X.; Zhang, R.H.; Zhang, T. Prediction of the viscosity of natural gas at high temperature and high pressure using free-volume theory and entropy scaling. Petrol. Sci. 2023, 20, 3210–3222. [Google Scholar] [CrossRef]
Disclaimer/Publisher’s Note: The statements, opinions and data contained in all publications are solely those of the individual author(s) and contributor(s) and not of MDPI and/or the editor(s). MDPI and/or the editor(s) disclaim responsibility for any injury to people or property resulting from any ideas, methods, instructions or products referred to in the content. |
© 2025 by the authors. Licensee MDPI, Basel, Switzerland. This article is an open access article distributed under the terms and conditions of the Creative Commons Attribution (CC BY) license (https://creativecommons.org/licenses/by/4.0/).