Article

Proactive Defense Approach for Cyber–Physical Fusion-Based Power Distribution Systems in the Context of Attacks Targeting Link Information Systems Within Smart Substations

1
Shaanxi Power Transmission and Distribution Engineering Co., Ltd., Xi’an 710003, China
2
College of Electrical Engineering and New Energy, China Three Gorges University, Yichang 443002, China
*
Author to whom correspondence should be addressed.
Processes 2025, 13(10), 3269; https://doi.org/10.3390/pr13103269
Submission received: 19 August 2025 / Revised: 6 September 2025 / Accepted: 11 September 2025 / Published: 14 October 2025
(This article belongs to the Special Issue Hybrid Artificial Intelligence for Smart Process Control)

Abstract

The cyber–physical integrated power distribution system is poised to become the predominant trend in the development of future power systems. Although the highly intelligent panoramic link information system in substations facilitates the efficient, cost-effective, and secure operation of the power system, it is also exposed to dual threats from both internal and external factors. Under intentional cyber information attacks, the operational data and equipment response capabilities of the panoramic link information system within smart substations can be illicitly manipulated, thereby disrupting dispatcher response decision-making and resulting in substantial losses. To tackle this challenge, this paper delves into the research on automatic verification and active defense mechanisms for the cyber–physical power distribution system under panoramic link attacks in smart substations. Initially, to mitigate internal risks stemming from the uncertainty of new energy output information, this paper utilizes a CGAN-IK-means model to generate representative scenarios. For scenarios involving external intentional cyber information attacks, this paper devises a fixed–flexible adjustment resource response strategy, making up for the shortfall in equipment response capabilities under information attacks through flexibility resource regulation. The proposed strategy is assessed based on two metrics, voltage level and load shedding volume, and computational efficiency is optimized through an enhanced firefly algorithm. Ultimately, the efficacy and viability of the proposed method are verified and demonstrated using a modified IEEE standard test system.

1. Introduction

As large-scale sensing and measurement systems have advanced and communication networks have grown increasingly intricate, modern power distribution systems have transformed into cyber–physical distribution systems [1]. In intelligent distribution cyber–physical systems (CPSs), the number of intelligent terminals has surged into the millions. Given the constraints of economic costs and hardware infrastructure, the security defense measures for these intelligent terminals are relatively rudimentary, rendering them easy prey for cyber attackers [2]. Consequently, it is imperative to carry out a quantitative risk assessment of the threats stemming from cyber attacks in distribution CPSs, thereby offering insights for bolstering the system’s reliability and resilience [3].
Recently, certain research endeavors have commenced an exploration of post-fault restoration approaches for cyber–physical distribution systems. References [4,5,6] posit that the communication network is inoperative and, accordingly, utilizes unmanned aerial vehicles (UAVs), emergency communication vehicles, and peer-to-peer communication as emergency communication channels to facilitate an interaction between the information layer and the physical layer. This enables effective coordination among maintenance personnel, physical system reconfiguration, and operation, ultimately leading to load restoration. Reference [7] illustrates the interaction between the information layer and the physical layer through a time-unified model and organizes maintenance personnel for the coordinated restoration of both the communication network and the physical network. However, the aforementioned studies overlook the detailed modeling of actual operations when modeling the interaction between the information layer and the physical layer. Modeling oriented toward actual operations can more precisely mirror the true operational state of the system, thereby facilitating the development of rational restoration methods [8]. Reference [9] constructs a post-disaster restoration model for maintenance personnel that takes into account cyber–physical interactions, based on an analysis of power system control operations. While the actual operation-oriented modeling accurately reflects the true operational state of the system, the communication modeling in this model is relatively simplistic and fails to analyze the influence of different communication methods on post-disaster restoration capabilities.
With the advancement of large-scale sensing and measurement systems and the growing complexity of communication networks, modern power distribution systems have transformed into grid cyber–physical systems (GCPSs) tailored for distribution purposes. Given the open nature of information technology and terminal devices, cybersecurity concerns within distribution GCPSs also demand substantial attention. With the pervasive integration of intelligent terminals into the power grid and the absence of corresponding protective mechanisms for these terminals, network attackers can readily engage in malicious activities, including Trojan horse intrusions [10], worm viruses [11], and adversarial machine learning. Once a select few devices within distribution GCPSs are compromised, risks can propagate to the physical network via the communication network, potentially triggering catastrophic failures in distribution GCPSs [12]. In the existing body of research on risk assessment for distribution GCPSs, reference [13] pinpoints vulnerabilities, threats, and assets within the information infrastructure to precisely and efficiently evaluate system risks post-attack and implements protective strategies to alleviate the adverse impacts of threats. Reference [14] adopts a Bayesian attack graph approach to evaluate the most likely cyber-attack scenarios in distribution GCPSs, gauging risks based on the scale of affected consumers and the duration of disruptions. However, it fails to account for the attack selectivity of target nodes from the attacker’s perspective. Moreover, this method lacks universal risk indicators for cybersecurity assessment.
Current research has achieved notable advancements in deliberate attacks on power systems and corresponding defense strategies, proposing diverse modeling and optimization techniques. Reference [15] innovatively utilized a bilevel model to simulate physical attack behaviors on power systems. Reference [16] leveraged the linearization theory to convert the bilevel model into a solvable single-level mixed-integer programming problem. Reference [17] constructed a Defender–Attacker–Defender (DAD) trilevel optimization model based on the bilevel model and solved it using the Column-and-Constraint Generation (CCG) algorithm, yet neither considered cyber-attack methods. Reference [18] took into account cyber-attack behaviors and proposed vulnerability indicators along with robust reinforcement strategies. Reference [19] considered multi-round attacks by attackers and proposed a robust optimization model grounded in the interactive game theory among multiple decision-making entities, further enhancing the model’s practical applicability. Regarding coordinated attacks, reference [20] established a two-stage objective model integrating physical attacks on transmission lines and information attacks on nodes based on game theory. Reference [21] proposed a cyber–physical coordinated attack method that maximizes load loss through the synergistic combination of line disconnection attacks and load redistribution attacks; however, neither considered the multiple coupling effects between the power grid and the information network. Concerning cyber–physical coupling modeling of power grids, reference [22] established an interdependent model of the power cyber–physical system and highlighted that the interdependence between cyber and physical domains heightens the vulnerability of the network structure. Reference [23] proposed an analysis method for cascading failures in power grids considering both structural and functional coupling relationships based on the accident chain theory, but it did not sufficiently integrate deliberate attacks with the cyber–physical coupled system. In summary, these studies underscore the potential threats and complexities of cyber–physical coordinated attacks, yet they also exhibit certain limitations. Under the context of deliberate attacks, the modeling of power systems does not fully incorporate the multiple coupling attributes between cyber and physical layers in engineering practice. Therefore, it is imperative to construct a coordinated attack model that accounts for cyber–physical coupling effects to more accurately simulate attack scenarios and provide references for defense strategy decision-making.

2. Scenario Generation Method Considering External Uncertainties

2.1. CGAN Based on Wasserstein Distance

The GAN represents an unsupervised generative model rooted in game theory, progressively producing data samples that closely resemble authentic ones through the adversarial interplay between the generator network and the discriminator network. The CGAN, on the other hand, integrates supervised learning with semi-supervised learning, enabling the utilization of supplementary information as input to the generator during sample generation to steer the process. Its fundamental architecture is depicted in Figure 1. The generator creates data akin to the genuine distribution by mapping random noise, whereas the discriminator is tasked with discerning whether the samples constitute real data. Following training, the generator becomes adept at misleading the discriminator, rendering it incapable of distinguishing between generated and real data.
The generator learns the underlying distribution of real data x and is responsible for processing the noise vector z to generate data samples G(z) that follow the probability distribution Pz; the discriminator takes as input the data generated by the generator network and the real data x. The goal of the generator G is to produce samples with the same distribution as the real data to minimize interference with the discriminator. The discriminator D is used to distinguish between the generated samples G(z) and the real data x. Both can continuously improve their performance through iterative adversarial training until the discriminator D can no longer distinguish between the real data x and the generated samples G(z). The loss function LG of the generator G and the loss function LD of the discriminator D can be defined as
L G = E z P z [ D ( G ( z ) ) ]
L D = E z P z [ D ( G ( z ) ) ] E x P d [ D ( x ) ]
where E(·) is the expectation function; G(·) is the generator function; D(·) is the discriminator function; and Pd and Pz are the probability distributions of the real data and noise, respectively. The smaller the value of LG, the closer the samples generated by the generator are to the actual data, and the stronger the discriminator’s ability to distinguish data authenticity. Since the CGAN is prone to mode collapse and vanishing gradient problems, the Wasserstein distance is used to replace the JS divergence in the CGAN, and its objective function V(G, D) is expressed as
min max V ( G , D ) = E x P d [ D ( x ) ] E z P z [ D ( G ( z ) ) ]
By penalizing the gradient norm of the CGAN discriminator, the issue of the CGAN’s inability to constrain the discriminator under the 1-Lipschitz constraint is resolved. The overall objective function for training the CGAN with a gradient penalty term is expressed as Equations (4) and (5).
min max V ( G , D ) = E x P d [ D ( x ) ] E z P z [ D ( G ( z ) ) ] + ρ E x ^ P x ^ [ x ^ D ( x ^ ) 2 1 ]
x ^ = ε x + ( 1 ε ) G ( z ) , ε U [ 0 , 1 ]
where ρ is the gradient penalty coefficient.

2.2. Scenario Reduction Method Based on the IK-Means Method

Compared to the K-means algorithm, the IK-means clustering algorithm is optimized in terms of selecting initial cluster centers, making it simpler and more efficient in the process of clustering power system scenarios. This paper employs the IK-means algorithm to cluster a large number of scenarios generated by the CGAN. Quantitative analysis is conducted using two typical internal validity indices, namely the Davies Bouldin index D(i) and the Silhouette coefficient s(k), which are represented by Equations (6) and (7), respectively.
D ( i ) = 1 N s s = 1 N s max [ S i + S j d ( C i + C j ) ]
s ( k ) = b ( k ) a ( k ) max a ( k ) , b ( k )
where Ns represents the number of clusters; Ci and Cj are the centers of the i-th and j-th clusters, respectively; Si and Sj are the average distances from all samples in clusters I and j to their respective cluster centers Ci and Cj; d(Ci + Cj) is the distance between cluster centers Ci and Cj; a(k) is the average distance between the k-th sample and all other samples within its cluster; and b(k) is the average distance between the k-th sample and all other samples outside its cluster.

3. Active Defense Strategy for Cyber–Physical Integrated Power Distribution Systems

3.1. Analysis of the Information System Attack Process

The substation monitoring system has established a highly intricate and multi-tiered structural framework, where diverse levels—including the process level, bay level, and station level—are interconnected and function in harmony. Among these levels, various information links, such as SV/GOOSE, MMS, and IEC104, are deployed, acting akin to the neural pathways of the substation monitoring system. These links shoulder the pivotal responsibility of precisely transmitting and facilitating interactions of vital data across different levels. Whether it pertains to equipment status information, control commands, or monitoring data, all rely on these links for efficient and accurate transfer, thereby ensuring the substation operates normally in accordance with predefined operational modes and parameters, playing an indispensable and critical role in its stable functioning. However, when these information links fall prey to attacks, their original data transmission capabilities are severely disrupted or even obliterated, leading to potential data loss, inaccuracy, or delays. Given the intimate and inseparable connection between the substation monitoring system and the power supply and load sides of the power system, anomalies in data transmission through these links swiftly propagate to both ends, directly inducing significant fluctuations and instability in power supply and demand. Particularly in the face of malicious sabotage, such as deliberate attacks, the repercussions are more pronounced and severe. The output of new energy sources may plummet, and the clean electricity initially intended for grid supply cannot be delivered normally, resulting in a waste of power resources and an imbalance in grid power. Simultaneously, power on the load side also experiences a marked decline, leaving various electrical devices without adequate power support and the power supply unable to meet actual production and living requirements. This supply–demand imbalance is highly likely to trigger a cascade of reactions, including equipment damage, power outages, and other power faults and supply issues, thereby posing an exceptionally grave threat to the overall safe and stable operation of the power system.

3.2. Fixed–Flexible Adjustable Resource Response Strategy

The resource regulation strategy aims to minimize the total daily operating cost to achieve optimal economic benefits. It incorporates penalty costs for voltage fluctuation and load shedding. The mathematical expression of the objective function is as follows:
o b j = min i = 1 I t = 1 T λ U U i , t U N + λ L P i , t s h e
where I represents the total number of nodes; U i , t and U N represent the node voltage magnitude and the standard voltage value, respectively; and P i , t s h e represents the amount of load shedding, while λ U and λ L represent the voltage deviation coefficient and the penalty cost coefficient for load shedding, respectively.
Meanwhile, the flexible and fixed response resources within the system have limitations to their adjustment range and need to satisfy certain operational constraints. The constraint conditions for the energy storage system (ESSs) are as follows:
0 u d i s , t + u c h a , t 1
0 u d i s , t P d i s , t P d i s , max
0 u c h a , t P c h a , t P c h a , max
S i , t min S e s s , t S i , t max
S e s s , t + 1 = S e s s , t + η c h a P c h a , t P d i s , t η d i s
where (9) represents the charging and discharging state constraints of the energy storage equipment; (10) represents the energy state constraint of the energy storage equipment; (11) represents the constraints on the upper and lower limits of the state of charge (SOC) of the energy storage equipment; (12) represents the SOC constraint of the energy storage; u d i s , t and u c h a , t are binary variables indicating the charging and discharging status of the energy storage; S i , t max and S i , t min are the upper and lower capacity limits of the energy storage, respectively; P c h a , t and P d i s , t are the charging and discharging powers of the energy storage, respectively; and S e s s , t is the energy storage capacity at time t.
The constraint conditions for distributed photovoltaic (PV) systems and wind turbines (WTs) are as follows:
P i , min P V P i , t P V P i , max P V
P i , min W T P i , t W T P i , max W T
where P i , t P V represents the active power output of the i-th PV system at time t; P i , max P V and P i , min P V are the maximum and minimum limits of the active power output of the i-th PV system; P i , t W T represents the active power output of the i-th WT at time t; and P i , max W T and P i , min W T are the maximum and minimum limits of the active power output of the i-th WT.
After adding an On-Load Tap Changer (OLTC) to the system, the substation bus node becomes an adjustable variable, which can be substituted as follows:
U j , min 2 ( U j , t b a s e ) 2 r j , t U j , max 2 r j , min r j , t r j , max
where U j , t b a s e is the constant voltage value on the high-voltage side of the high-voltage-to-medium-voltage transformer; r j , max and r j , min are the squares of the upper and lower limits of the adjustable turns ratio of the OLTC; and r j , t is the square of the OLTC turns ratio, defined as the ratio of the secondary side to the primary side, and is a discrete variable. It can be further processed by introducing 0–1 variables as follows:
r j , t = r j , min + s r j , s σ j , s , t O L T C
where r j , s represents the difference in the square of the turns ratio between OLTC tap position s and tap position s − 1, that is, the incremental adjustment between adjacent tap positions. σ j , s , t O L T C is a binary variable. If constraints such as the limit on the number of adjustments in practical applications are considered, it can be further constrained and expanded as follows:
0 δ j , t O L T C , i n + δ j , t O L T C , d e 1
σ j , s , t O L T C σ j , s , t O L T C δ j , t O L T C , i n δ j , t O L T C , d e S R j
σ j , s , t O L T C σ j , s , t O L T C δ j , t O L T C , i n S R j δ j , t O L T C , d e
Taking into account factors such as equipment lifespan and economic efficiency, a limit on the total number of OLTC operations over multiple time periods is set as (21).
t = 1 T ( δ j , t O L T C , i n + δ j , t O L T C , d e ) N j O L T C , max
where δ j , t O L T C , i n and δ j , t O L T C , d e represent the indicators for OLTC tap position adjustment changes, which are binary variables. If δ j , t O L T C , i n = 1, it indicates that the OLTC tap position value at time period t is higher than that at time period t − 1; the same applies to δ j , t O L T C , d e in a similar manner; and N j O L T C , max represents the maximum number of permitted tap position adjustments for the OLTC within the all periods.
The constraints for capacitor banks (CBs) adjustments are given by (22).
Q j , t C B = y j , t C B Q j C B , e a 0 y j , t C B y j C B , max
where y j , t C B represents the actual number of CBs in operation, which is a discrete variable; y j C B , max is the upper limit on the number of CBs connected to node j; and Q j C B , e a is the power that can be compensated by each group of CBs. Since the switching of CBs is accomplished through mechanical devices, frequent adjustments can shorten their service life. Therefore, constraint (23) is further employed to limit the number of switching operations of the CBs:
t = 1 T y j , t C B y j , t 1 C B N j C B , max
where N j C B , max represents the upper limit on the number of switching operations. Additionally, regarding the absolute value constraint in the limit on the total number of operations within a time period, by defining an auxiliary variable δ j , t C B = y j , t C B y j , t 1 C B , where it represents the change in CB compensation capacity between adjacent time periods, we can obtain (24):
t = 1 T δ j , t C B N j C B , max δ j , t C B Y j C B , max y j , t C B δ j , t C B Y j C B , max
The power flow constraints in distribution networks are non-convex. To improve the solution success rate, a two-step relaxation process—comprising phase angle relaxation followed by convex relaxation—is applied. After relaxation, the power flow constraints become:
i u ( j ) P i j r i j I i j 2 = k v ( j ) P j k + P j
i u ( j ) Q i j x i j I i j 2 = k v ( j ) Q j k + Q j
U j 2 = U i 2 2 ( r i j P i j + x i j Q i j ) + I i j 2 ( r i j 2 + x i j 2 )
I i j 2 = P i j 2 + Q i j 2 U i 2
P j = P l o a d , j P i s h e + P c h a , j P d i s , j P D G , j
Q j = Q l o a d , j Q C B , j
where iu(j) and kv(j) represent the sets of branches with node j as the terminal node and the originating node, respectively; Pij and Qij are the active power and reactive power flowing from node i to node j; rij and xij are the resistance and reactance of branch ij; Pj and Qj are the equivalent active power and reactive power at node j; Iij is the current flowing through branch ij; Pload,j, Pcha,j, Pdis,j, PDG,j are the active power of the load, the charging power of energy storage, the discharging power of energy storage, and the output of distributed generation, respectively; and Qload,j is the reactive power of the load.
Finally, the node voltages and currents should satisfy the security constraint (31).
U min U j U max 0 I i j I max
The flexible resource considered in this article is the mobile energy storage system (MESS). The MESS model mainly consists of two key components: a mobile trajectory model and an output determination model. The mobile trajectory model is specifically crafted to figure out the route that the MESS takes as it moves among various grid-connection nodes within the distribution network. On the other hand, the output determination model serves the purpose of identifying the MESS’s present charging or discharging status, along with the specific values of its input and output power. When a binary variable is incorporated, the mobile trajectory model can be expressed in the following manner:
i Ω a i , t m 1
τ = t min ( t + t r i j , T ) a j , τ m ( 1 a i , t m ) min ( t r i j , T t )
m M a i , t m N u m
where Ω represents the set of candidate nodes for the grid connection of the MESS; M denotes the set indicating the number of MESSs; t r i j represents the time required for a MESS to move between two grid-connection nodes; a i , t m is a binary variable, which equals 1 when the m-th MESS is connected to node i at time step t; and Num indicates the maximum number of MESSs that can be connected to a candidate node. (32) posits that at any given time step, each MESS is permitted to establish a connection with only a single node; (33) lays out the specific temporal limitations that need to be adhered to when an MESS relocates between distinct grid-connection locations; and (34) highlights that there is a cap on the number of MESSs that can be linked to each grid-connection point. Based on the mobile path model mentioned earlier, it is reasonable to deduce that MESSs do not maintain a constant connection to the power grid to take part in the system’s optimized scheduling at all times. Instead, they engage in charging or discharging the system solely when they are connected to the grid. Consequently, when a MESS is linked to the grid, its output model can be formulated in the following way:
u m , t d + u m , t c i Ω a i , t m
0 P m , t d u m , t d P max d 0 P m , t c u m , t c P max c
0 Q m , t d u m , t d Q max d 0 Q m , t c u m , t c Q max c
( P m , t d ) 2 + ( Q m , t d ) 2 ( S m ) 2 ( P m , t c ) 2 + ( Q m , t c ) 2 ( S m ) 2
S O C t + 1 m = S O C t m + η c P m , t c Δ t / E m η d P m , t d Δ t / E m
S O C min S O C t m S O C max
where u m , t d and u m , t c represent the discharging state and charging state of the m-th MESS at a specific time t. Meanwhile, the symbols P m , t d / Q m , t d and P m , t c / Q m , t c for active power and reactive power denote the output or input values of the m-th MESS at time t, respectively. The apparent power of the MESS is denoted by S m ; Em stands for the storage capacity of the m-th MESS. ηc and ηd are used to represent the charging and discharging efficiencies of the MESS, correspondingly. Additionally, a variable S O C t m is employed to indicate the state of charge of the m-th MESS at time t. Equation (39) outlines the computational approach for determining the state of charge of the MESS at the subsequent time step, while Equation (40) specifies the allowable range within which the state of charge of the MESS must lie.

4. Solution Method Based on an Improved Firefly Algorithm

In this paper, the global optimization capability and convergence efficiency are significantly enhanced through dynamic adaptive step size and elite retention strategies. Compared to traditional heuristic algorithms, the IFA can automatically adjust the search step size based on the iteration progress, preventing premature convergence to local optima. Meanwhile, by strengthening the pulling effect of the optimal solutions, it reduces ineffective searches, thereby achieving a faster convergence speed and higher solution quality in complex power systems with multiple constraints. To enhance the computational accuracy and global optimization capability of the firefly algorithm (FA), this paper proposes improvements to its adaptive step size and position update formulas, and employs the improved firefly algorithm (IFA) to solve the active defense optimization model of intelligent systems incorporating various flexible resources. First, optimization variables, i.e., decision variables, are selected as firefly individuals. Using the initial power flow calculation results of these optimization variables and the constraints that must be satisfied, a certain number of firefly individuals, denoted as xm (where m = 1, 2, …, M), are randomly generated. The initial objective function values corresponding to each firefly individual are then calculated using (8). Subsequently, through population iteration, the fluorescence brightness and attractiveness of each firefly individual are updated to attract neighboring firefly individuals toward the one with the highest brightness, thereby searching for the position of the brightest and most attractive firefly and the globally optimal objective function value. This method offers advantages such as simple operation, ease of global optimization, and relatively high optimization efficiency. The specific implementation method of the IFA is as follows.
(1) Calculation of relative fluorescence brightness and attractiveness. The Euclidean distance is employed to compute the distance between two firefly individuals during the K-th iteration:
r b p , K = x b , K x p , K = h = 1 d ( x b , K , h x p , K , h ) 2
where r b p , K represents the distance from firefly xb to firefly xp during the K-th iteration; K denotes the iteration number; x b , K is the position of firefly xb at the K-th iteration; x p , K is the position of firefly xp at the K-th iteration; d is the dimension of the solution space search; and x b , K , h is the h-th component of the spatial position coordinates of firefly xb at the K-th iteration. By substituting Equation (41) into Equation (42), the relative fluorescence brightness between two firefly individuals is calculated, and (43) is utilized to compute the attractiveness between firefly individuals:
I b p , K ( r b p , K ) = I b e γ r b p , K 2
β b p , K ( r b p , K ) = β 0 I b p , K ( r b p , K ) / I b
where I b p , K represents the relative fluorescence brightness between firefly xb and firefly xp during the K-th iteration; Ib denotes the absolute brightness of firefly xb; γ is the light absorption intensity coefficient, indicating that the fluorescence of fireflies gradually weakens with increasing distance and absorption by the propagation medium, set as a constant; β b p , K is the attractiveness of firefly xb to firefly xp during the K-th iteration; and β0 is the initial attractiveness of firefly xb at its starting position.
(2) Updating the positions of firefly individuals. During the optimization process of the algorithm, firefly xb attracts firefly xp, causing a change in the position of firefly xp. As the number of iterations increases, the distances between fireflies continuously decrease, and the relative attractiveness between individuals gradually strengthens, thereby reducing the algorithm’s local optimization capability. Although the position update formula in the FA includes a random term with a characteristic coefficient to prevent premature convergence to local optima, it does so at the cost of increasing the number of iterations to improve algorithm accuracy. To prevent the best individual in each iteration from being damaged or lost, an elitism preservation strategy from genetic algorithms is employed to enhance the position update formula. By strengthening the pulling effect of the best firefly individual in the current population on other individuals, the influence of this population on others is increased, ensuring that the best individual in each generation is not lost and effectively preventing the algorithm from getting trapped in local optima, thereby improving optimization accuracy. The improved position update formula is as follows:
x p . K + 1 = x b , K + β b p , K ( r b p , K ) ( x b , K x p , K ) + s 1 ( r 1 0.5 ) ( x g , K x p , K )
where s 1 is the step size, with s 1 ∈[0, 1]; r1 is a random number uniformly distributed within the interval [0, 1]; x g , K represents the optimal position occupied by an individual in the firefly population during the K-th iteration.
The values of the fundamental parameters γ, β0, and r1 in the firefly individual position update process exert a certain influence on the solution-finding process. A larger γ facilitates the algorithm’s refined local search, whereas a smaller γ promotes global search. A smaller β0 can enhance the algorithm’s robustness, while a larger β0 may accelerate convergence but reduce solution accuracy. r1 reflects the randomness of the algorithm’s optimization process; appropriate randomness can help the algorithm escape local optima, but excessive randomness may prevent the algorithm from converging to the optimal solution. Additionally, the selection of s 1 plays a crucial role in the algorithm’s convergence speed and optimization accuracy. If a fixed step size is used, a larger step size accelerates convergence but reduces computational accuracy, whereas a smaller step size improves accuracy but slows down convergence. Therefore, this paper adopts an adaptive step size approach, where the step size is initially set to a larger value at the beginning of the optimization process and gradually decreases to a minimal value as the number of iterations increases. This prevents oscillations caused by fireflies missing the optimal position due to an excessively large step size. Thus, the adaptive step size during the K-th iteration is given by
s K = s max e [ cos ( 2 K / K max ) ( 1 + 4 K / K max ) ] + S min
where Kmax represents the maximum number of iterations; s max denotes the maximum step size; and S min indicates the minimum step size.
(3) Outputting the optimal value. Among the firefly individuals xb after position updates, the objective function values corresponding to these individuals are recalculated using Equations (41) to (45). By comparing these values, the minimum objective function value and the position of the corresponding firefly individual are identified as the local optimal result. Subsequently, the local optimum of the current iteration is compared with that of the previous iteration. If the difference in objective function values between the two iterations is less than the required precision and the number of iterations exceeds the maximum number of iterations Kmax, the final result is outputted. Otherwise, the iteration continues, and the distances between firefly individuals, relative fluorescence brightness, and attractiveness are recalculated using (8), followed by updating the individual positions.

5. Case Study

5.1. The Introduction of the Testing System

To further demonstrate the efficacy and practicality of the algorithm proposed in this paper, an enhanced IEEE-33 node test system was employed, with its structural topology depicted in the subsequent Figure 2. Specifically, the wind farm and photovoltaic power plant were integrated at nodes 27 and 10, respectively. The system features five access points for mobile energy storage devices, situated at nodes 7, 13, 20, 25, and 31. These nodes are located in critical load concentration areas or renewable energy-rich zones within the power grid topology. For instance, nodes 7 and 31 are near wind and PV connection points, effectively mitigating the impact of renewable energy output fluctuations on local voltage. Nodes 13, 20, and 25 are situated at the ends of feeders or in load-dense areas. By deploying the MESS, they can swiftly respond to voltage violations and load shedding requirements. Additionally, their geographical distribution covers the main vulnerable sections of the system, forming a spatially and temporally complementary flexible regulation capability. This approach maximizes comprehensive benefits in enhancing system resilience, reducing network losses, and optimizing economic operation. The SVG was installed at node 26, while three capacitor banks were positioned at nodes 12, 18, and 24. This study employed MATLAB R2024b software for programming, with a computational environment consisting of 16 GB RAM, an Intel Core i7/AMD Ryzen 7 processor made in China, and a 100 GB SSD made in China. The optimization problems were solved using the CPLEX commercial solver.

5.2. Analysis of Typical Scenario Generation Results

The typical wind power and photovoltaic scenarios generated using the CGAN-IK-means algorithm are illustrated in Figure 3 below. It should be noted that the wind power and photovoltaic output curves overlap and are difficult to distinguish due to the minimal prediction errors, which also indirectly demonstrates the effectiveness of the CGAN.
Upon examining the aforementioned figure, it becomes evident that the algorithm proposed in this paper synergizes the dual strengths of the CGAN’s generation capacity, grounded in the Wasserstein distance, with the optimized selection of initial clustering centers. On one front, through adversarial training between the generator and discriminator, the CGAN adeptly captures the intricate nonlinear distribution traits of wind power and photovoltaic output data, notably their inherent stochastic volatility and spatio-temporal correlations. The incorporation of the Wasserstein distance further bolsters the congruence between generated scenarios and the distribution of real data, circumventing the mode collapse issue prevalent under traditional distance metrics and ensuring that the generated scenarios statistically align more closely with actual output fluctuation ranges and trends. On the other front, the IK-means algorithm surmounts the constraint of traditional K-means’ susceptibility to initial points by optimizing the choice of initial clustering centers, guaranteeing that the clustering process commences from a more judicious starting point. Coupled with the clustering demands for output fluctuations in power system scenarios, it efficiently partitions the vast array of scenarios generated by the CGAN into representative typical fluctuation patterns. This methodology not only retains the diversity of the original data but also accentuates pivotal fluctuation characteristics through the refinement of clustering centers, ultimately yielding a high-precision, low-redundancy portrayal of wind power and photovoltaic output fluctuations.
This paper utilizes real wind power data from Brazil [24] and real photovoltaic data from the National Energy Administration [25] for validation and testing. The relevant results are presented in Table 1. Here, a smaller Davies–Bouldin Index (DBI) indicates better intra-cluster compactness and inter-cluster separation. A Silhouette coefficient (SC) value closer to 1 signifies a superior clustering performance. The Root Mean Square Error (RMSE) measures the discrepancy between generated scenarios and actual data, reflecting sample fidelity. The K-means, Gaussian Mixture Model (GMM), and Variational Autoencoder (VAE) methods are referenced from [26,27,28].
The CGAN significantly outperforms other methods in terms of the DBI and SC metrics, particularly excelling in wind/photovoltaic data, with a 30–40% reduction in the DBI and a 10–15% improvement in the SC. This is attributed to its adversarial training mechanism, which enables it to capture the nonlinear distribution characteristics of the data and avoid the sensitivity of K-means to initial cluster centers. The GMM and VAE exhibit a similar performance on data with simple distributions, but experience performance degradation in complex photovoltaic fluctuation scenarios. The CGAN achieves the lowest RMSE, indicating a high degree of consistency in the spatiotemporal correlation between generated samples and actual data. For instance, in photovoltaic data, the CGAN’s RMSE is 62% lower than that of K-means and 35% lower than that of VAE, as it optimizes the generator through discriminator feedback, avoiding ambiguity in generated samples. Due to the limitations of its latent variable assumptions, VAE exhibits larger errors in non-Gaussian distributed data, while the GMM struggles to adapt to extreme fluctuation scenarios owing to its fixed distribution assumptions.

5.3. Analysis of Fixed Resource Response Under Deliberate Attacks

To further validate the effectiveness of the method proposed in this paper, three different operational scenarios were set up.
  • Scenario 1: Normal operation.
  • Scenario 2: Subject to an information attack from 5:00 to 9:00, resulting in a 20% reduction in renewable energy output.
  • Scenario 3: Subject to an information attack from 16:00 to 20:00, leading to a 20% decrease in load power.
The charging and discharging power of the ESS under the three different scenarios is shown in Figure 4 below.
Upon scrutinizing Figure 4, it becomes apparent that when an information attack on the power system triggers a decline in renewable energy output, the system scales back power dispatch directives for renewable sources. To uphold power equilibrium, energy storage devices must ramp up discharge to offset the deficit in renewable energy generation. Concurrently, owing to the system’s diminished anticipation of future renewable energy output, it curtails charging schedules for energy storage to mitigate overcharging hazards, culminating in a scenario of reduced charging and increased discharging. Conversely, when an information attack induces a drop in load power, the system diminishes generation dispatch. Under such circumstances, both renewable energy sources and conventional generating units may experience simultaneous output reductions. Energy storage devices, sensing an excess of power in the system, prioritize switching to charging mode to absorb surplus electrical energy. Simultaneously, to brace for potential abrupt surges in load, the system limits energy storage discharge to preserve backup capacity, ultimately forging an operational state characterized by “increased charging and decreased discharging.” The disparities in energy storage behavior under these two scenarios arise from the interference of information attacks on system state perception and the adaptive modifications of the power balance mechanism.
Figure 5 further compares network losses across the three scenarios.
Upon examining Figure 5, it is evident that when an information attack on the distribution network results in a decline in renewable energy output, traditional generator units are forced to ramp up their production to bridge the power deficit. Given that numerous traditional generating units are situated at the periphery of the transmission network, the augmented power they generate must traverse longer distances to reach load centers, thereby elevating line current and significantly increasing resistive losses. Concurrently, the curtailment of renewable energy output may disrupt the originally optimized power distribution, potentially causing a reverse power flow or overload conditions on certain lines, further aggravating voltage fluctuations and inadequate reactive power compensation, and leading to heightened losses in equipment such as transformers. Ultimately, this culminates in a comprehensive surge in network losses. Conversely, when an information attack induces a reduction in the load power, the output of both renewable energy sources and conventional generating units diminishes simultaneously. The decreased power transmission along lines results in a lower current, directly reducing resistive losses. Moreover, enhanced voltage quality following load reduction diminishes reactive power flow, thereby decreasing additional losses in equipment like transformers. Simultaneously, the system may further mitigate network losses by optimizing operational modes to minimize the utilization of circuitous power supply routes or overloaded lines. Consequently, network losses demonstrate a decreasing trend.
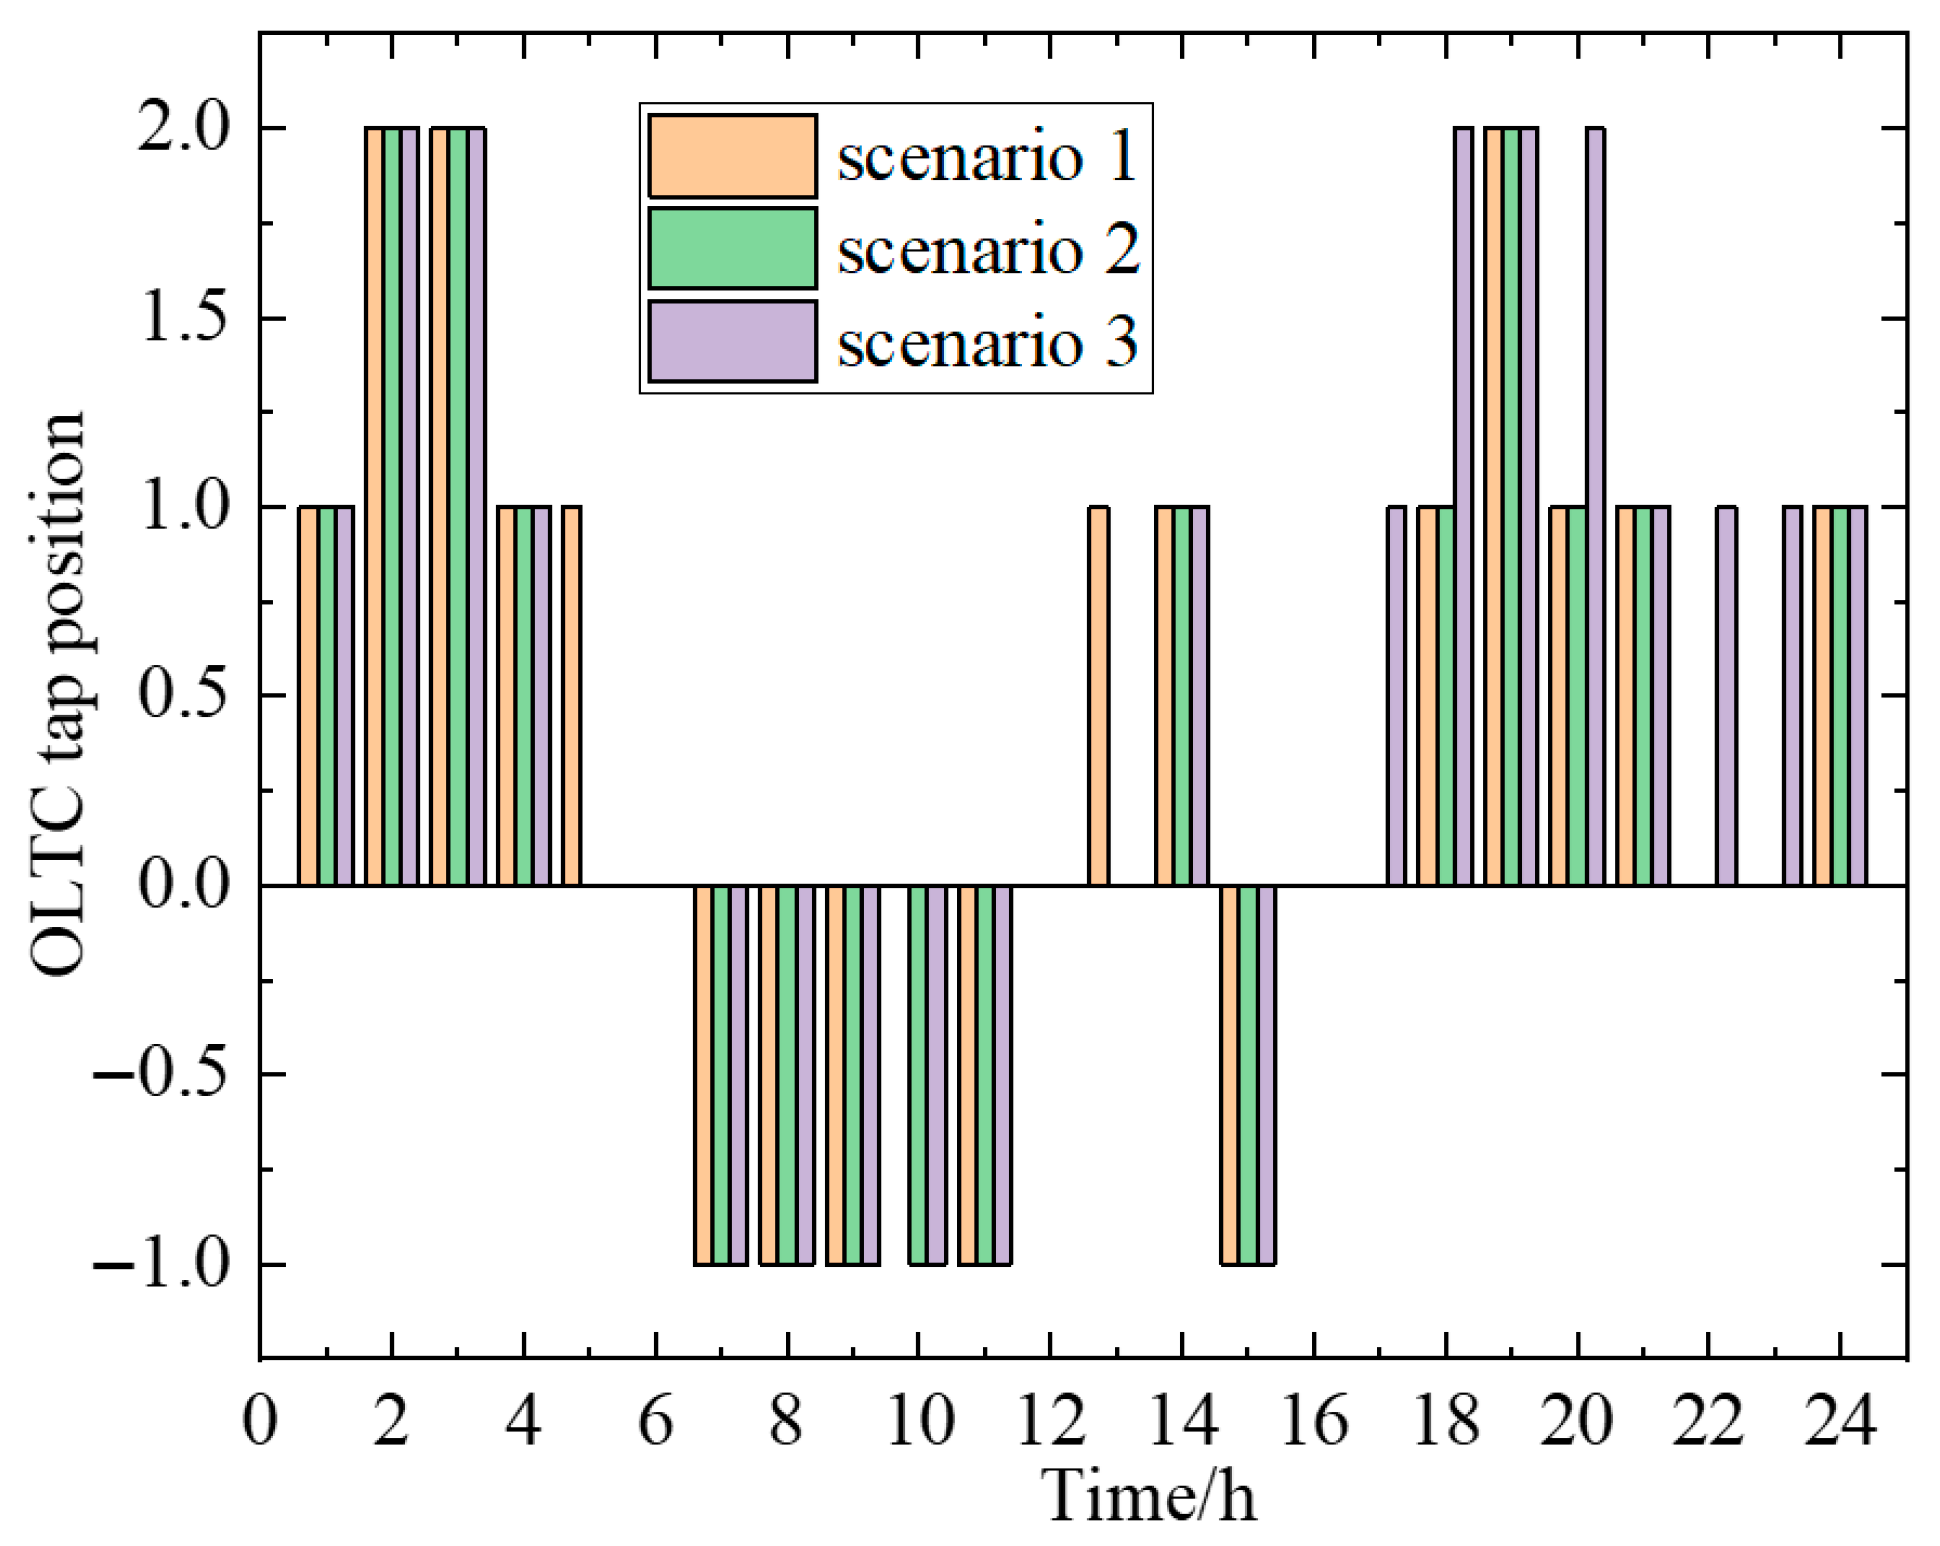
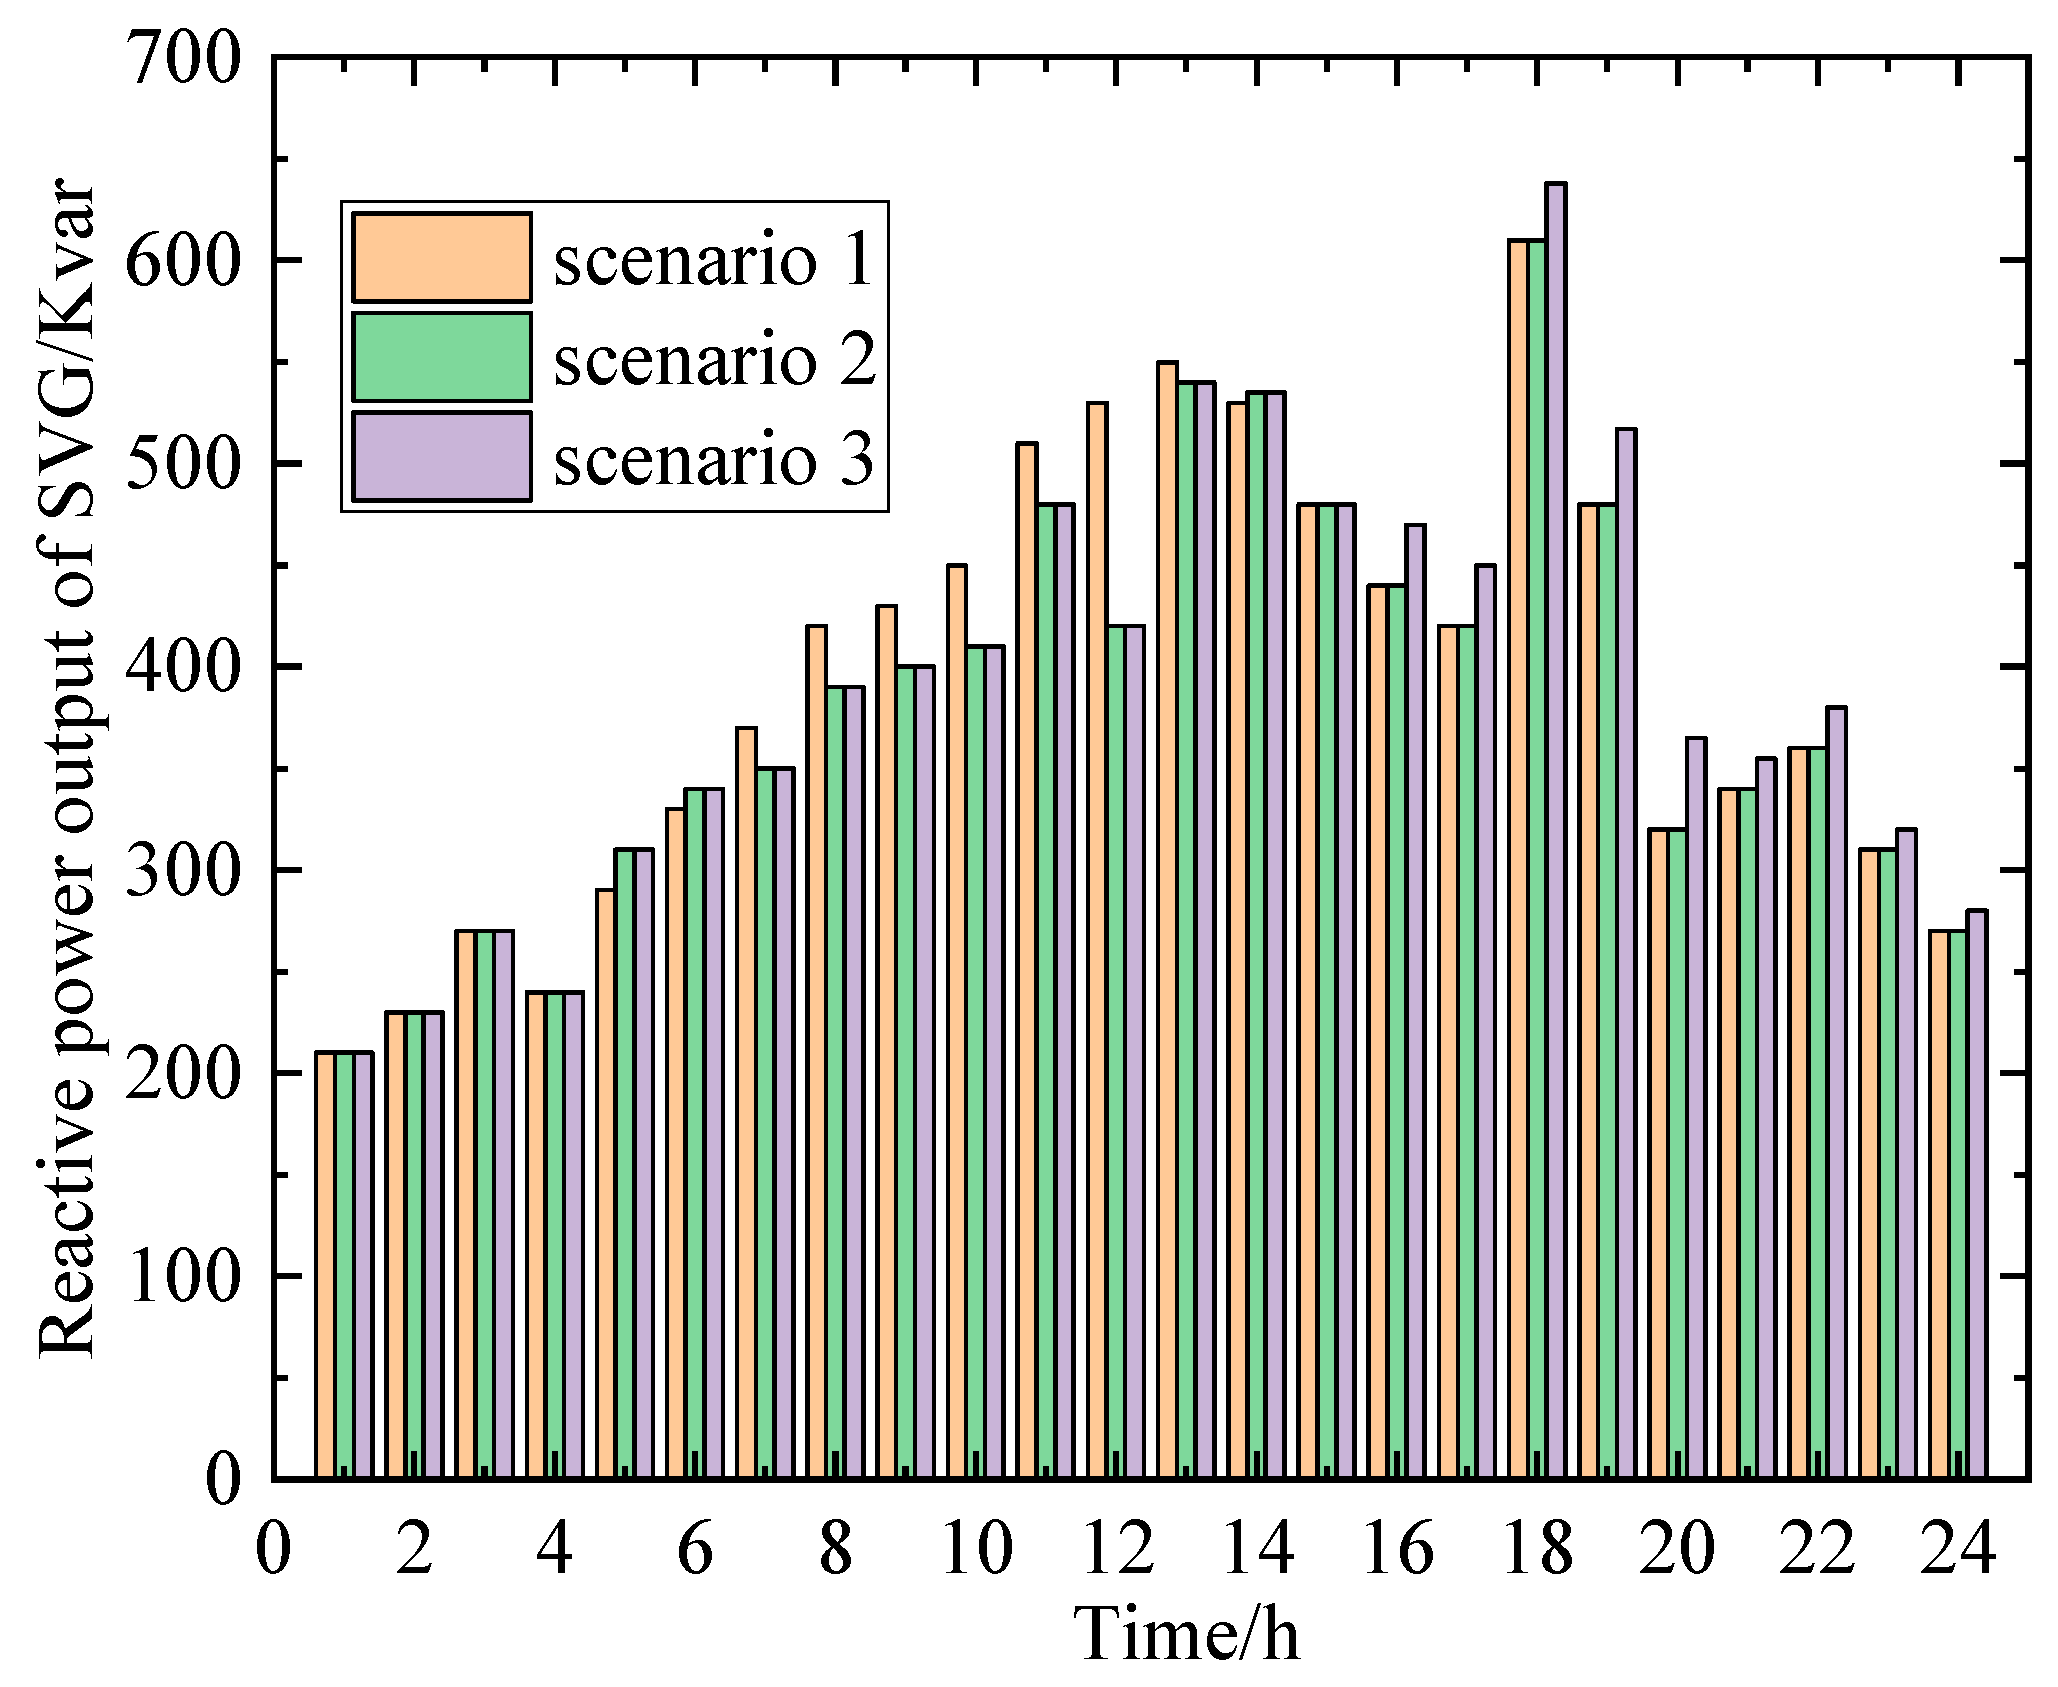
Figure 6, Figure 7 and Figure 8, respectively, illustrate the operational status of fixed resources within the system, including OLTC, capacitor banks, and SVG.
When a distribution network falls victim to an information attack, the equilibrium between power supply and demand is disrupted, precipitating power curtailment. This imbalance induces voltage fluctuations and degrades the overall voltage profile. The OLTC can fine-tune the voltage transformation ratio by adjusting transformer tap positions, thereby modulating the output voltage level. Capacitor banks are capable of supplying or absorbing reactive power to/from the system, compensating for reactive power deficits or surpluses, enhancing the power factor, and offering vital voltage support. The SVG excels in swiftly and continuously adjusting reactive power, precisely tracking alterations in system reactive power and responding promptly. Through the harmonious interplay of these three components—where the OLTC orchestrates macro-level voltage adjustments by varying transformer ratios, capacitor banks provide fundamental reactive power compensation, and the SVG executes precise and rapid reactive power regulation—the system maintains a reactive power balance. This, in turn, facilitates secure voltage control and guarantees the stable operation of the distribution network amidst abnormal conditions, such as information attacks.

5.4. Analysis of Flexible Resource Response Under Deliberate Attacks

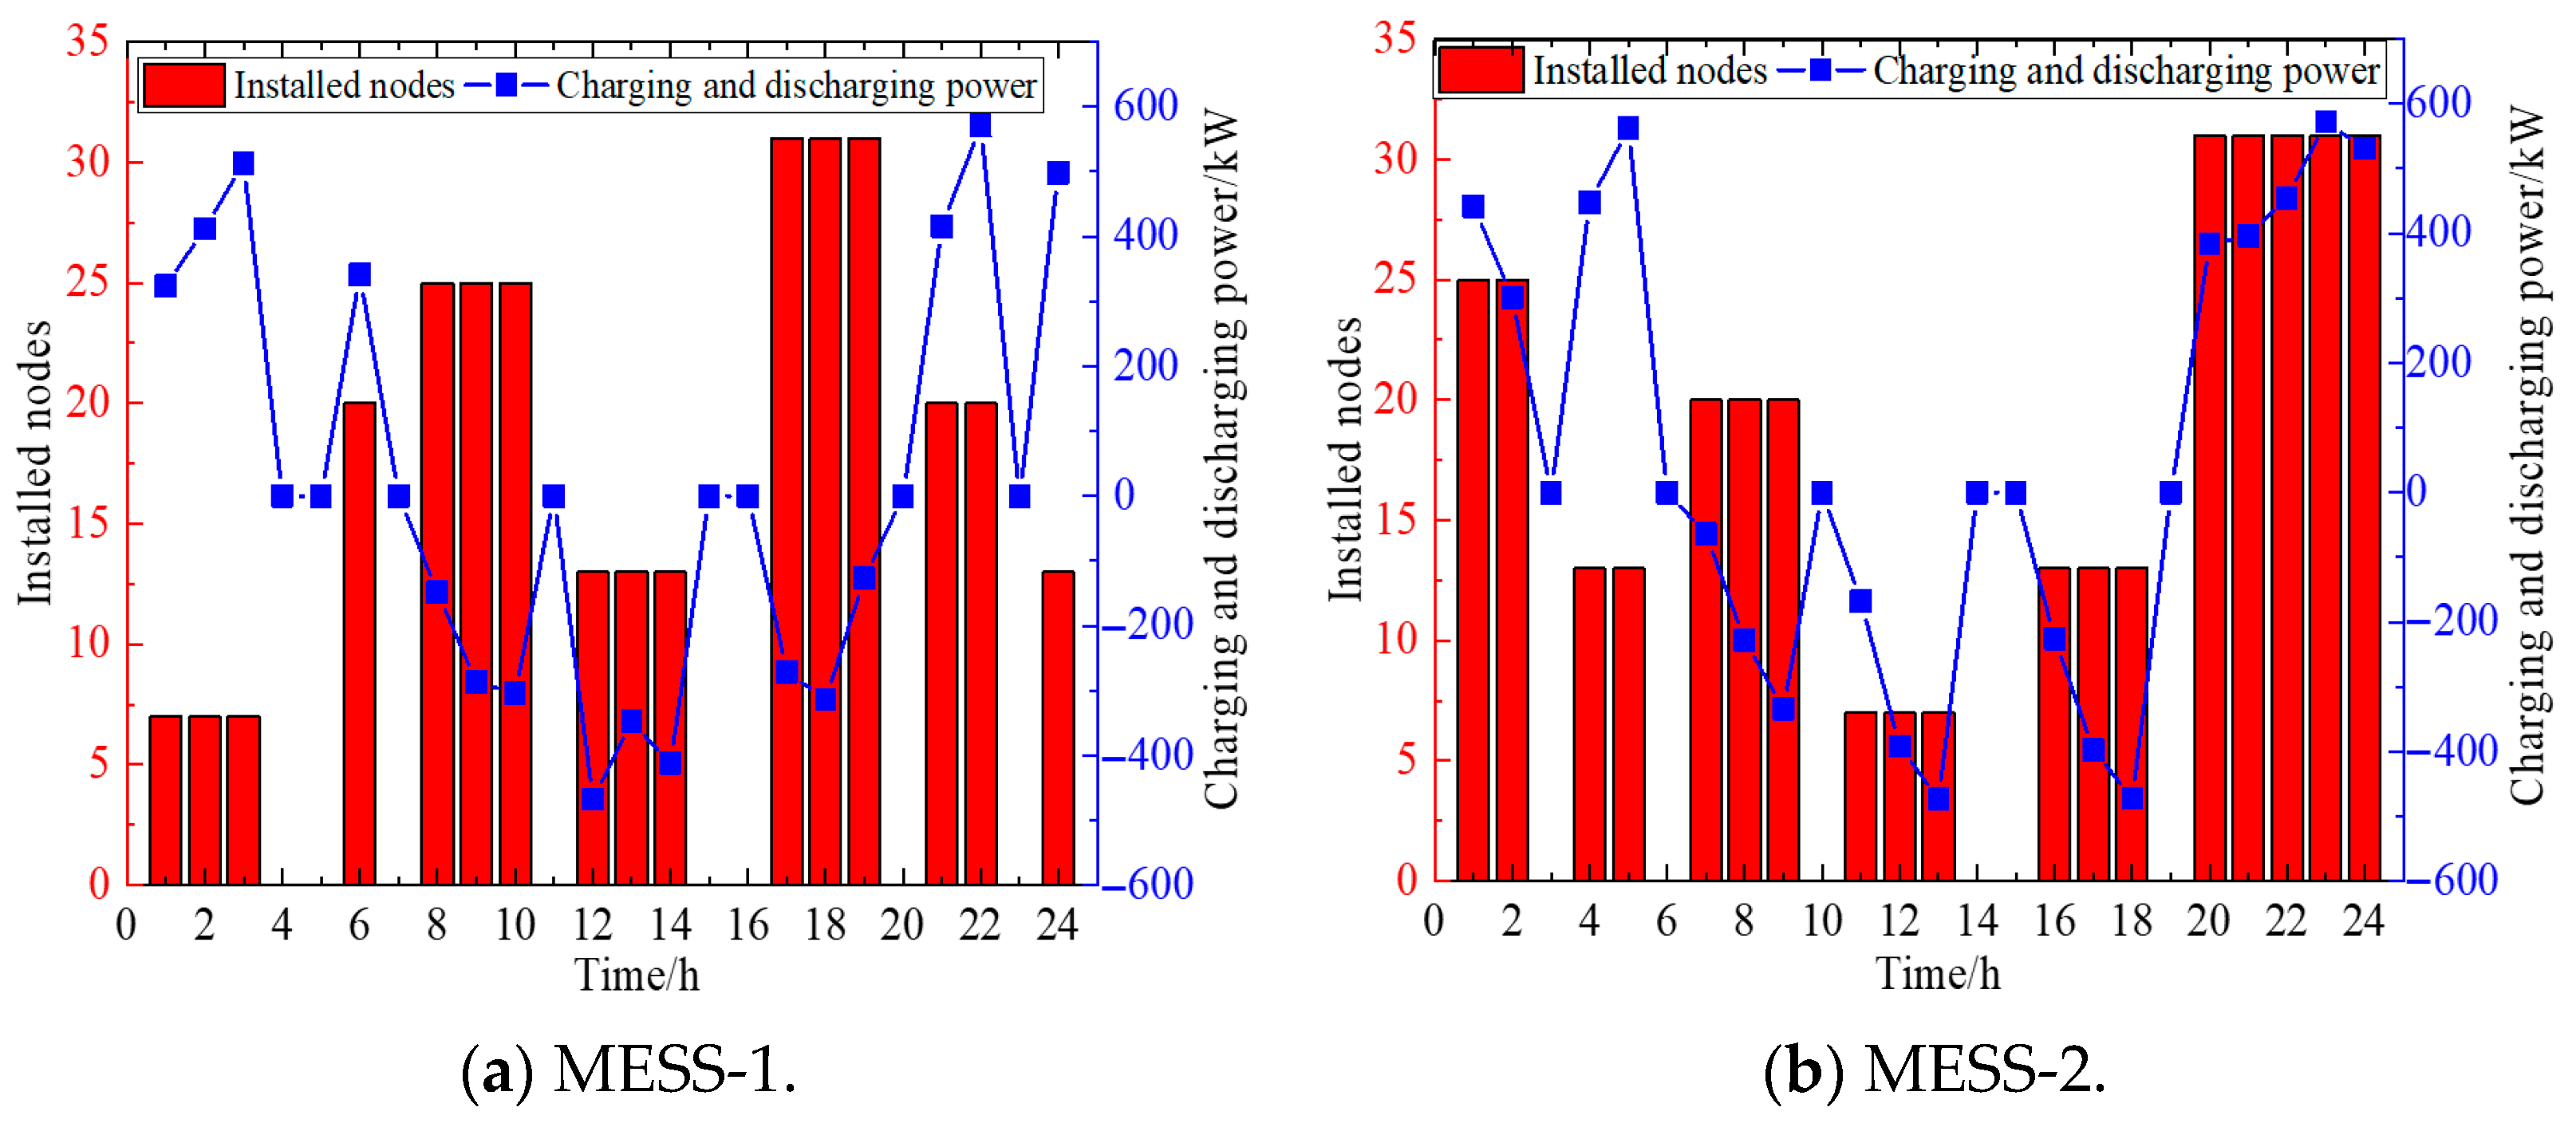
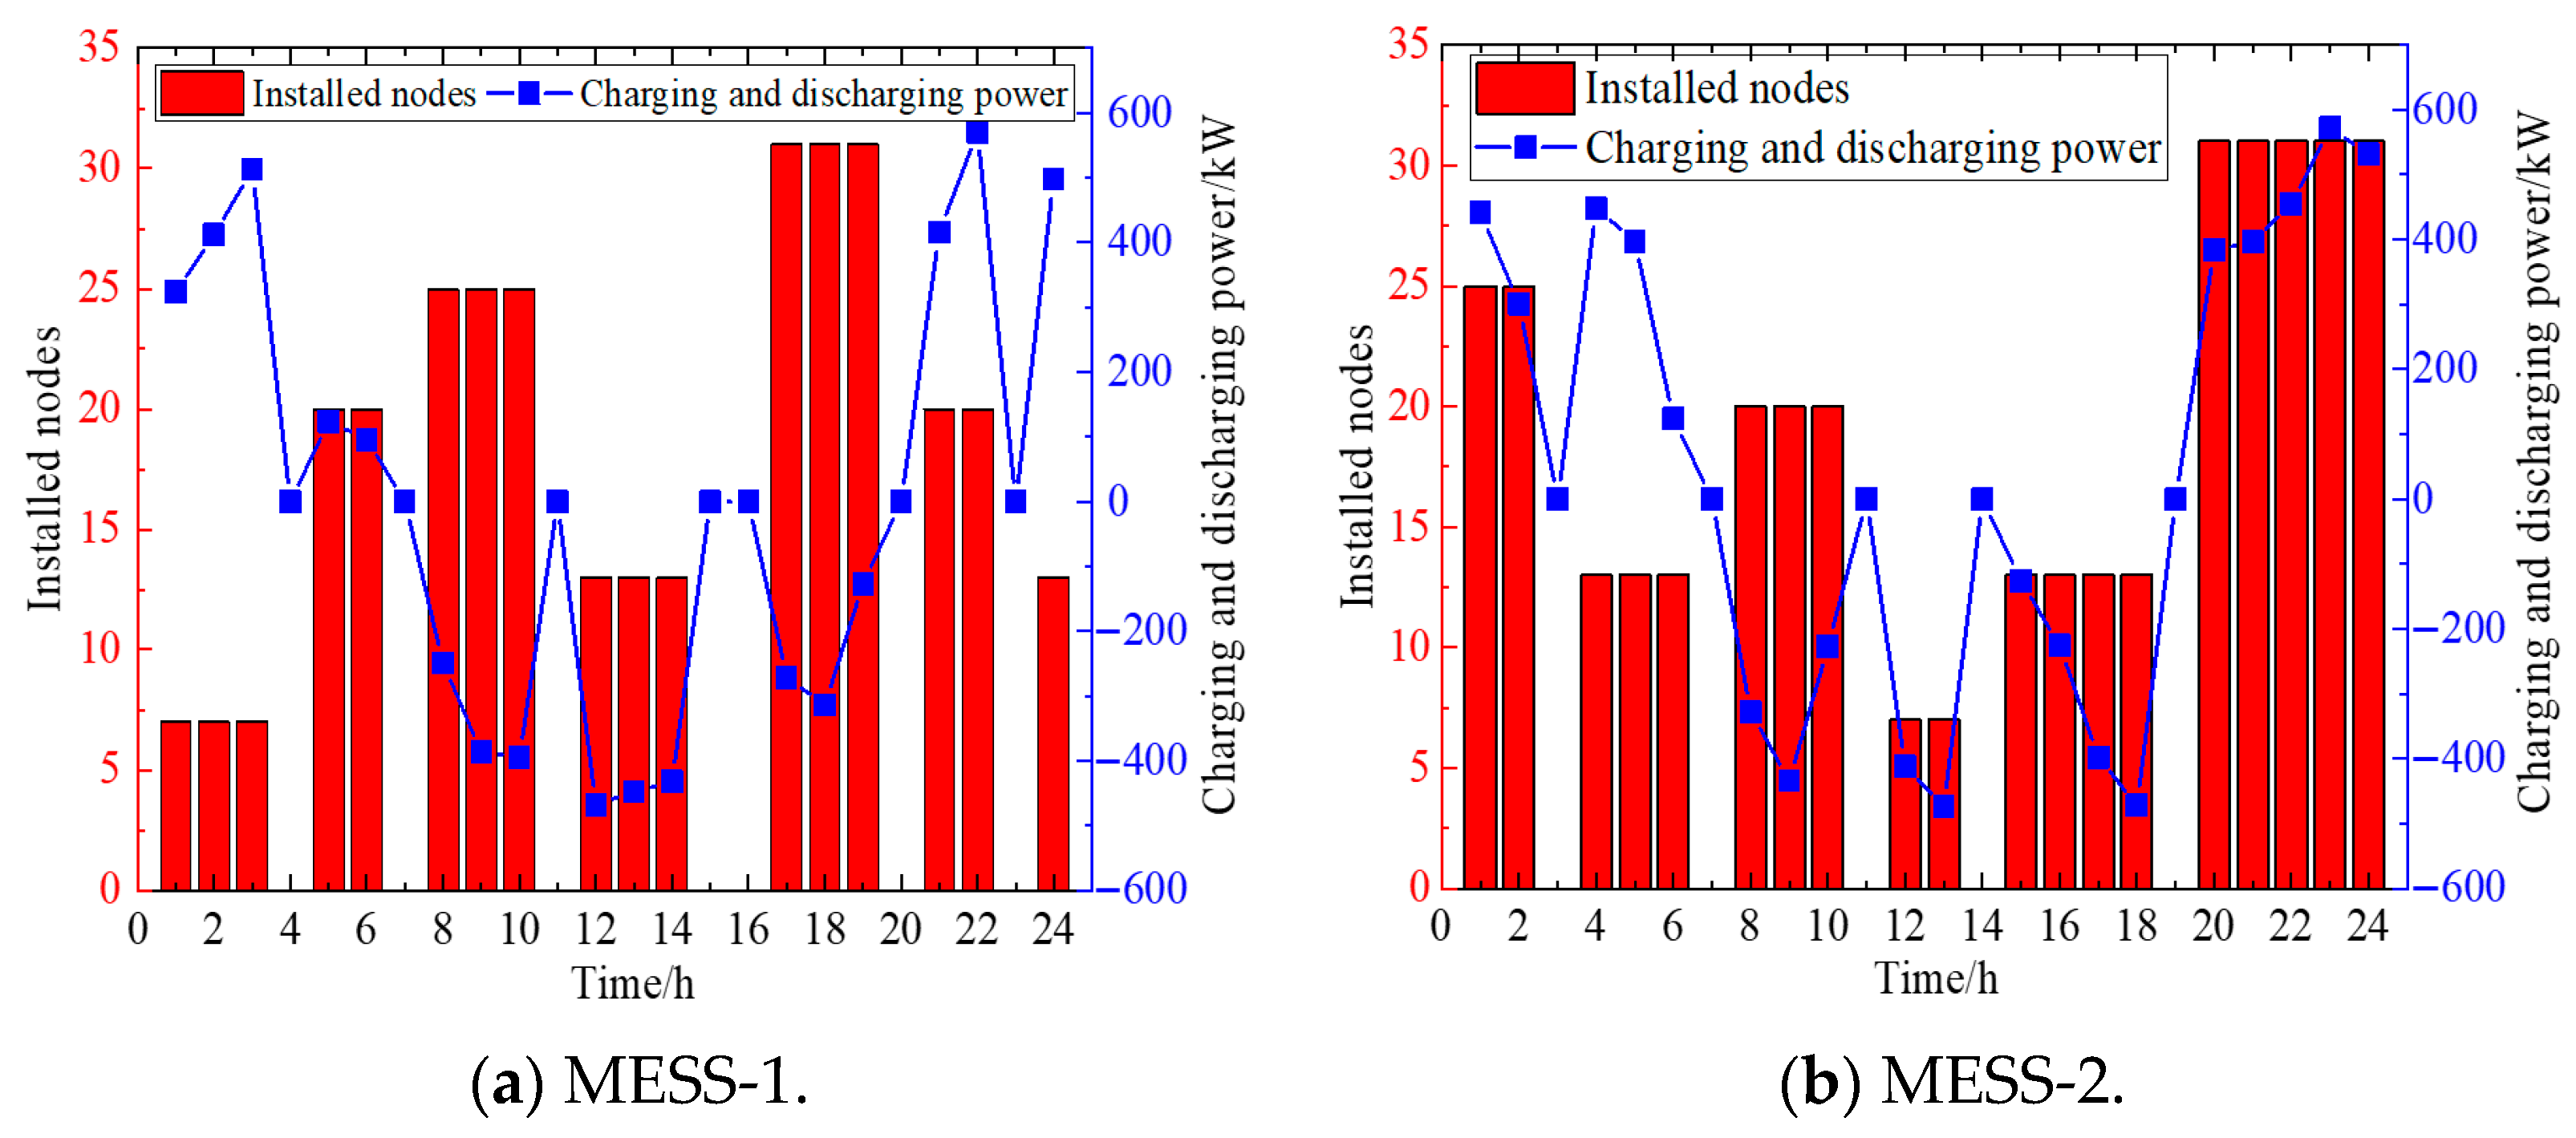
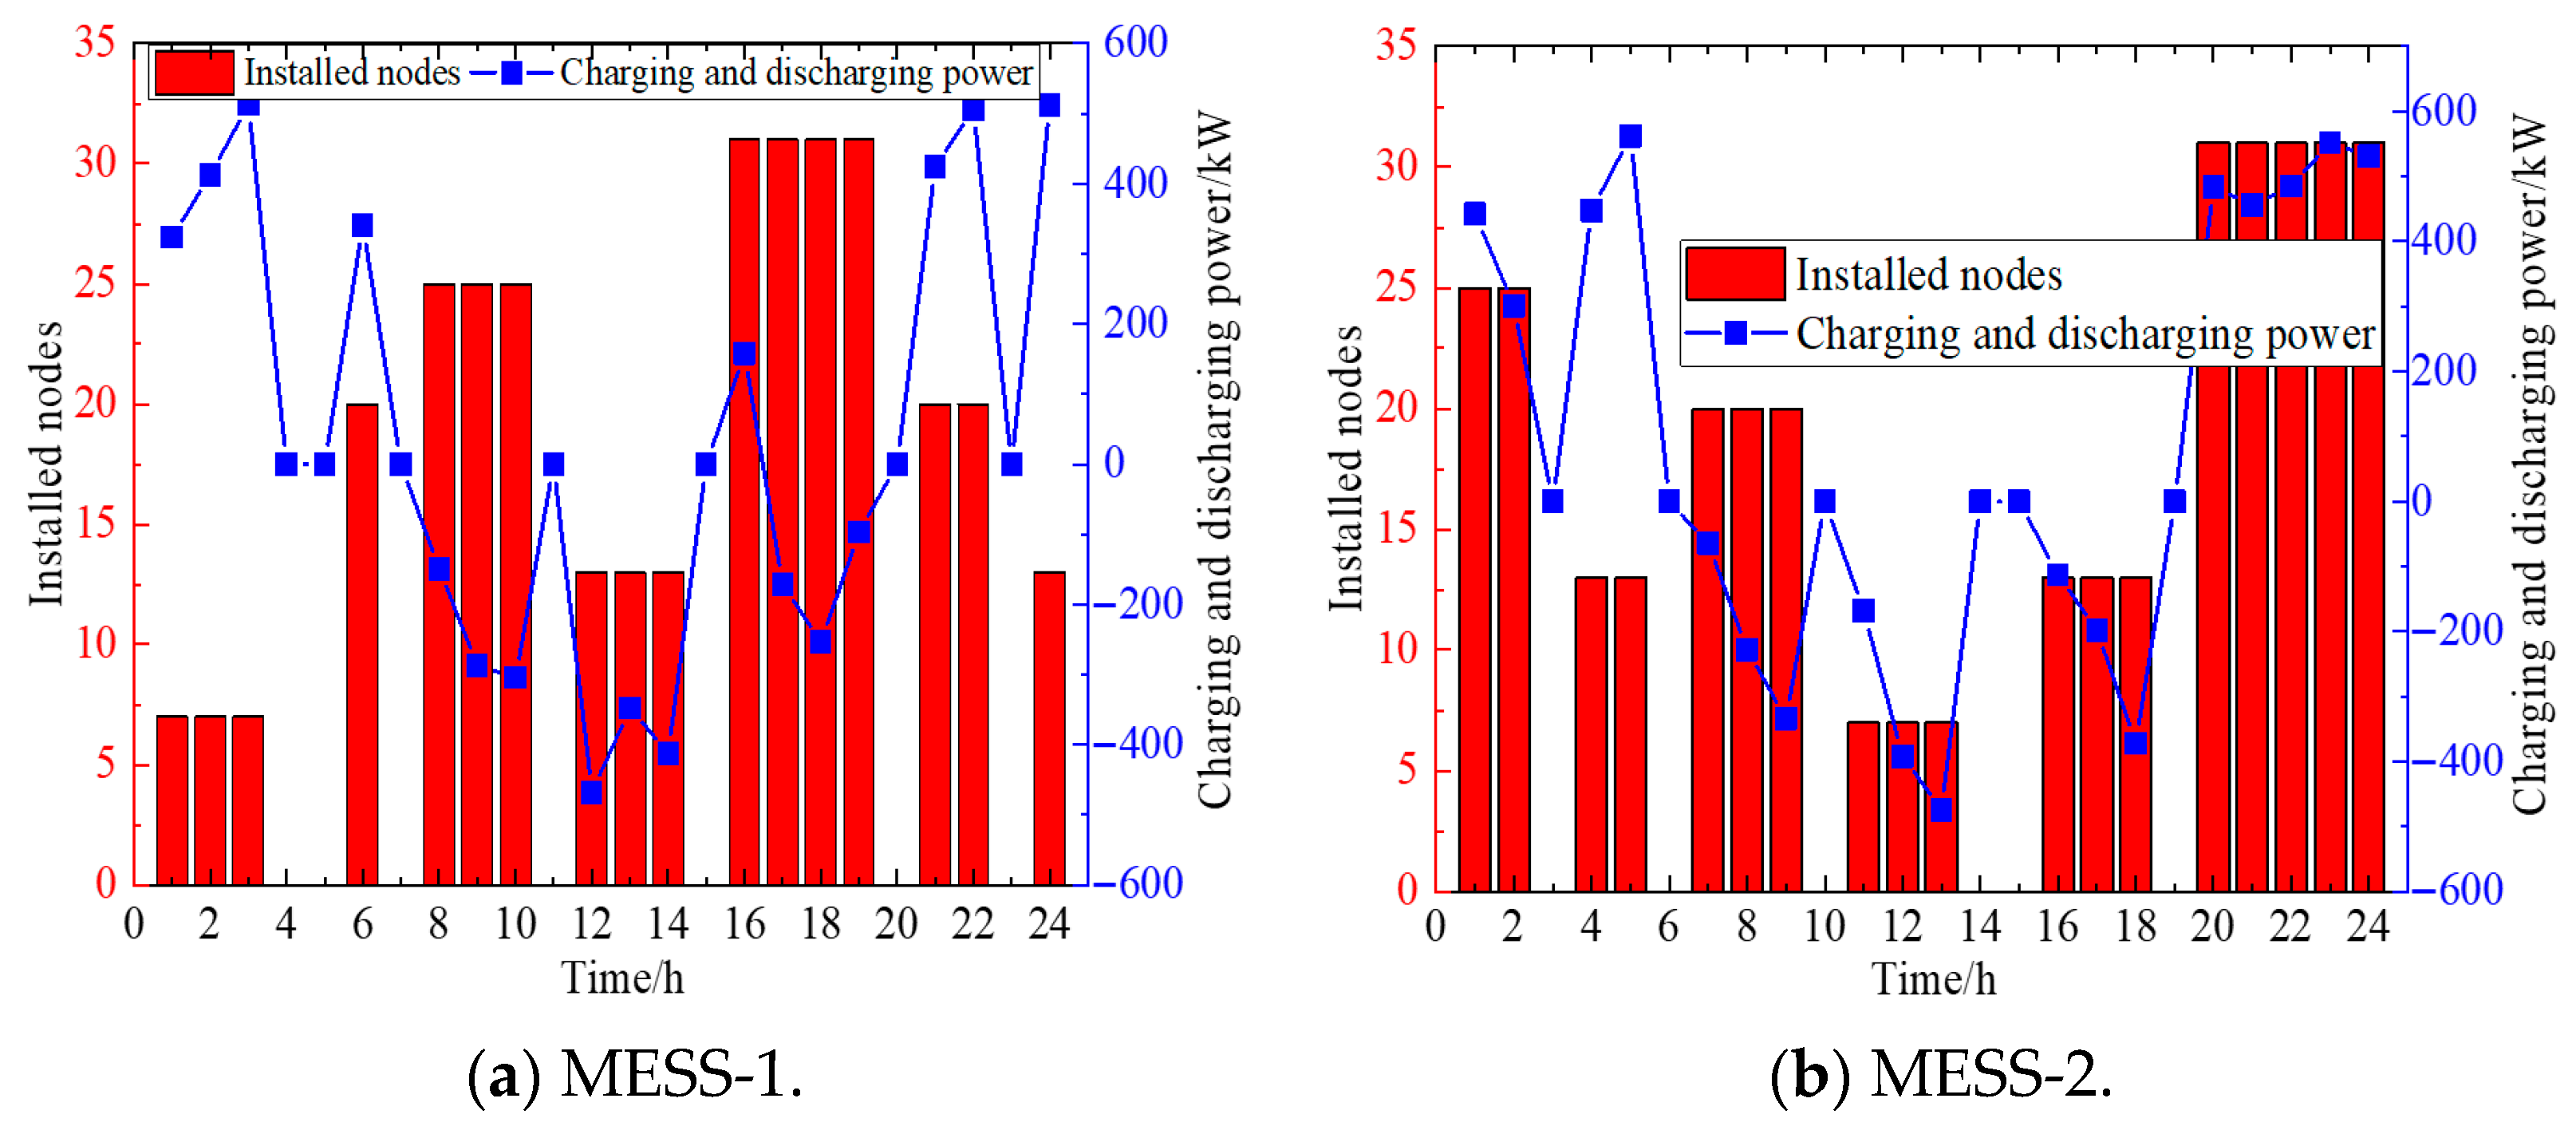
The fixed resources mentioned above only offer temporal flexibility but lack spatial transferability. Mobile energy storage systems (MESSs), on the other hand, possess both temporal and spatial flexibility, enabling them to assist the system in achieving power balance and transfer. The installation nodes and power profiles of mobile energy storage vehicles under different scenarios are illustrated in Figure 9, Figure 10 and Figure 11 below.
By observing the above results, it can be found that mobile energy storage vehicles offer scheduling flexibility in both time and space. Compared to traditional fixed energy storage systems, mobile energy storage vehicles possess a significant advantage in flexible deployment. They can rapidly respond to power fluctuation demands in different regions and at different times, relocating promptly to nodes experiencing power deficits or voltage anomalies based on the actual load distribution and power generation conditions, thereby achieving precise power compensation and voltage support. In contrast, traditional fixed energy storage systems are constrained by their installation locations and can only serve specific areas. Additionally, mobile energy storage vehicles can swiftly arrive at affected regions in emergency scenarios, such as extreme weather or equipment failures, providing emergency power support and effectively mitigating the risks of local power imbalances and voltage collapse, further enhancing the resilience and stability of the distribution network.

5.5. Analysis of System Recovery Effectiveness

Table 2 summarizes the multi-indicator results under different scheduling strategies. The evaluation metrics include economic cost, average voltage deviation, and total load shedding amount, assessed from the perspectives of both economic cost and system security level. The economic cost values are calculated through a comprehensive optimization model, encompassing the commissioning and dispatch costs of fixed resources, such as capacitor banks, OLTC, SVG, as well as flexible resources including fixed/mobile energy storage systems. Additionally, penalty costs for voltage deviations and load shedding are also factored in.
By observing Table 2, it can be found that the economic investment cost of the method proposed in this paper is the highest, yet it achieves the smallest average voltage deviation and the least total load shedding. The high economic investment cost of the collaborative scheduling strategy for fixed and flexible resources proposed in this paper stems from the simultaneous deployment of various fixed resources, such as capacitor banks, OLTCs, SVGs, and fixed energy storage systems, along with flexible resources, like mobile energy storage vehicles. The cumulative costs of initial equipment procurement, installation, and subsequent operation and maintenance contribute to the overall cost increase. However, the collaborative operation of multiple resources fully leverages their respective advantages: fixed resources provide fundamental reactive power compensation, voltage regulation, and energy storage support, while flexible resources like mobile energy storage vehicles can precisely and rapidly respond to local power and voltage variations, enabling resource complementarity and optimized allocation. This significantly enhances the distribution network’s ability to regulate power fluctuations and voltage anomalies, effectively reducing the average voltage deviation and minimizing load shedding operations during load fluctuations, resulting in the smallest total load shedding amount.
External risks primarily include the uncertainty of renewable energy output, which also increases the risks to the safe and stable operation of the system. Table 3 further compares the scheduling results under different uncertainty characterization methods.
The method proposed in this paper employs the GCAN-Improved IK-means algorithm based on the Wasserstein distance to cluster wind and photovoltaic power output scenarios. Compared to the traditional K-means algorithm, IK-means significantly enhances clustering quality by optimizing the strategy for selecting initial cluster centers, thereby avoiding the local optimum issues caused by random initialization in conventional methods. Meanwhile, the scenario data generated by the GCAN more closely align with actual power distribution characteristics, enabling the clustering results to more precisely capture the spatiotemporal coupling characteristics and fluctuation patterns of renewable energy output. In the optimal scheduling of power systems, high-quality clustered scenarios provide a more representative uncertainty set for the robust optimization model. Compared to traditional robust optimization methods, the model proposed in this paper reduces excessively conservative decision spaces while ensuring safety constraints. By accurately matching renewable energy output with load demand, it effectively enhances renewable energy accommodation capacity, mitigates the risks of voltage fluctuations and forced load shedding caused by power imbalances, and ultimately achieves synergistic optimization of renewable energy accommodation rate, voltage stability, and power supply reliability.
It should be noted that while selecting more typical scenarios leads to more precise scheduling decisions, it also significantly increases computational complexity. Table 4 analyzes the relationship between computational time and economic cost under different numbers of scenarios.
In power system scheduling, when characterizing the uncertainty of renewable energy through scenario generation methods, a larger number of typical scenarios enables a more comprehensive coverage of the stochastic fluctuation characteristics of renewable energy output. This reduces decision-making biases caused by missing scenarios, thereby enhancing the adaptability of scheduling plans to actual operating conditions and making decisions such as unit commitment and energy storage allocation closer to the true optimal solutions. However, an increase in the number of scenarios directly leads to exponential growth in the variables and constraints of the optimization model, significantly elevating computational complexity and potentially causing excessively long solution times or even the curse of dimensionality. In practical scheduling, a trade-off between accuracy and efficiency is necessary. Typically, scenario reduction techniques are employed to compress scenario scale while preserving key scenario characteristics. Alternatively, by combining statistical properties of historical data with real-time operational requirements, sensitivity analysis can be used to determine threshold values for core scenarios that influence scheduling outcomes. Ultimately, the smallest scenario set that meets system safety and economic operation requirements within the allowable computational resources is selected.

5.6. Discussion on the Extensibility of the Method

To further verify the effectiveness and feasibility of the method proposed in this paper, this study conducts a comparison with some other commonly used defense methods in power systems, including the robust optimization method based on box models [33], the distributed defense method based on multi-agent systems [34], and the defense strategy based on power system self-recovery [35]. In detail, the robust optimization method employs box models to describe the endogenous and exogenous uncertainties within the system, with the upper and lower prediction error bounds set at 10%. The distributed defense method utilizes communication and coordination mechanisms among multiple agents to achieve information sharing and strategy coordination. When an attack is detected, the agents can swiftly assess the threat level and dynamically adjust defense strategies, such as load transfer and power source switching, through a negotiation mechanism to prevent global paralysis caused by a single point of failure. The power system self-recovery strategy achieves a stable operation through load shedding and network reconfiguration. The detailed comparison results under multiple operating scenarios are presented in Table 5 below.
By observing the table above, it can be found that the method proposed in this paper accurately generates typical scenarios through the CGAN-IK-means model and combines a fixed–flexible resource response adjustment strategy to swiftly and precisely counter attacks, enabling rapid system recovery. Although the traditional robust optimization method considers various uncertainties, it relies on preset scenarios and may fail to cover all actual attack situations, resulting in slower recovery. The distributed defense method based on multi-agent systems enhances system flexibility through collaborative responses among multiple agents, but the negotiation process may increase the response time. The self-recovery strategy solely relies on the system’s inherent redundancy and recovery capabilities, resulting in the slowest recovery speed. Although the method in this paper requires a higher initial investment, in the long run, it reduces operation and maintenance costs by optimizing resource scheduling. The traditional robust optimization method involves a conservative design that leads to substantial initial investment and may incur unnecessary costs due to over-design. The distributed defense method based on multi-agent systems incurs increased operational costs due to communication and computational overhead. The self-recovery strategy: While incurring no additional defense costs, it may result in greater losses from faults and downtime in the long term. The method in this paper utilizes optimization algorithms to rapidly generate defense strategies, significantly shortening response time. The traditional robust optimization method involves a complex computational process, leading to longer response times. The negotiation process among multiple agents in the distributed defense method based on multi-agent systems increases response time.
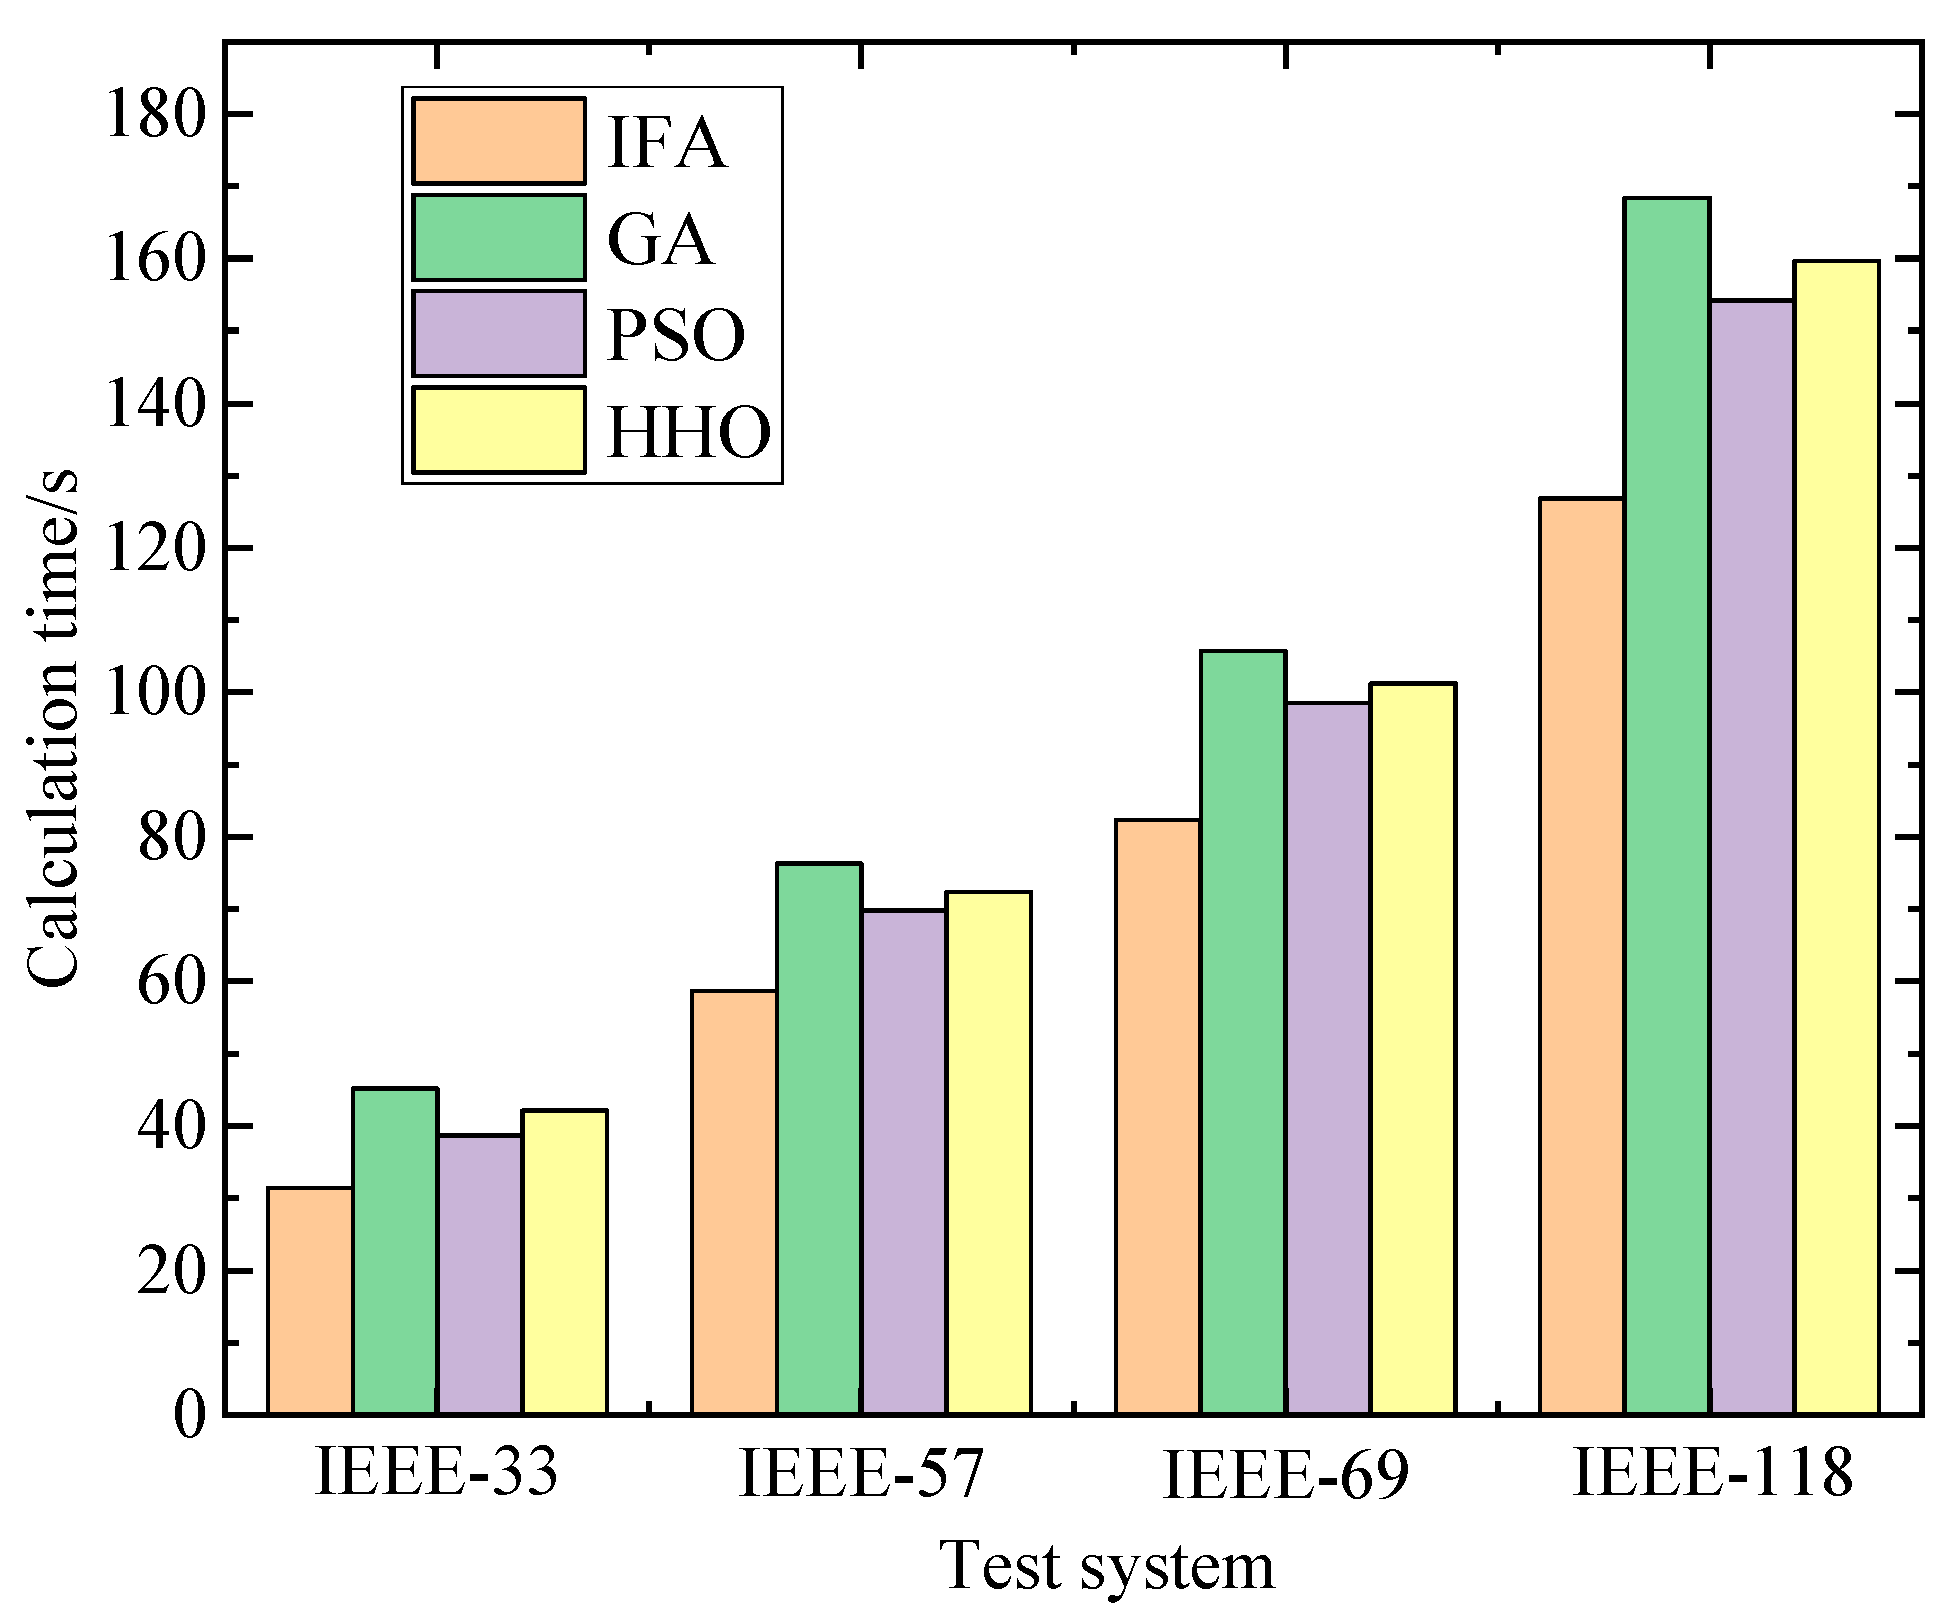
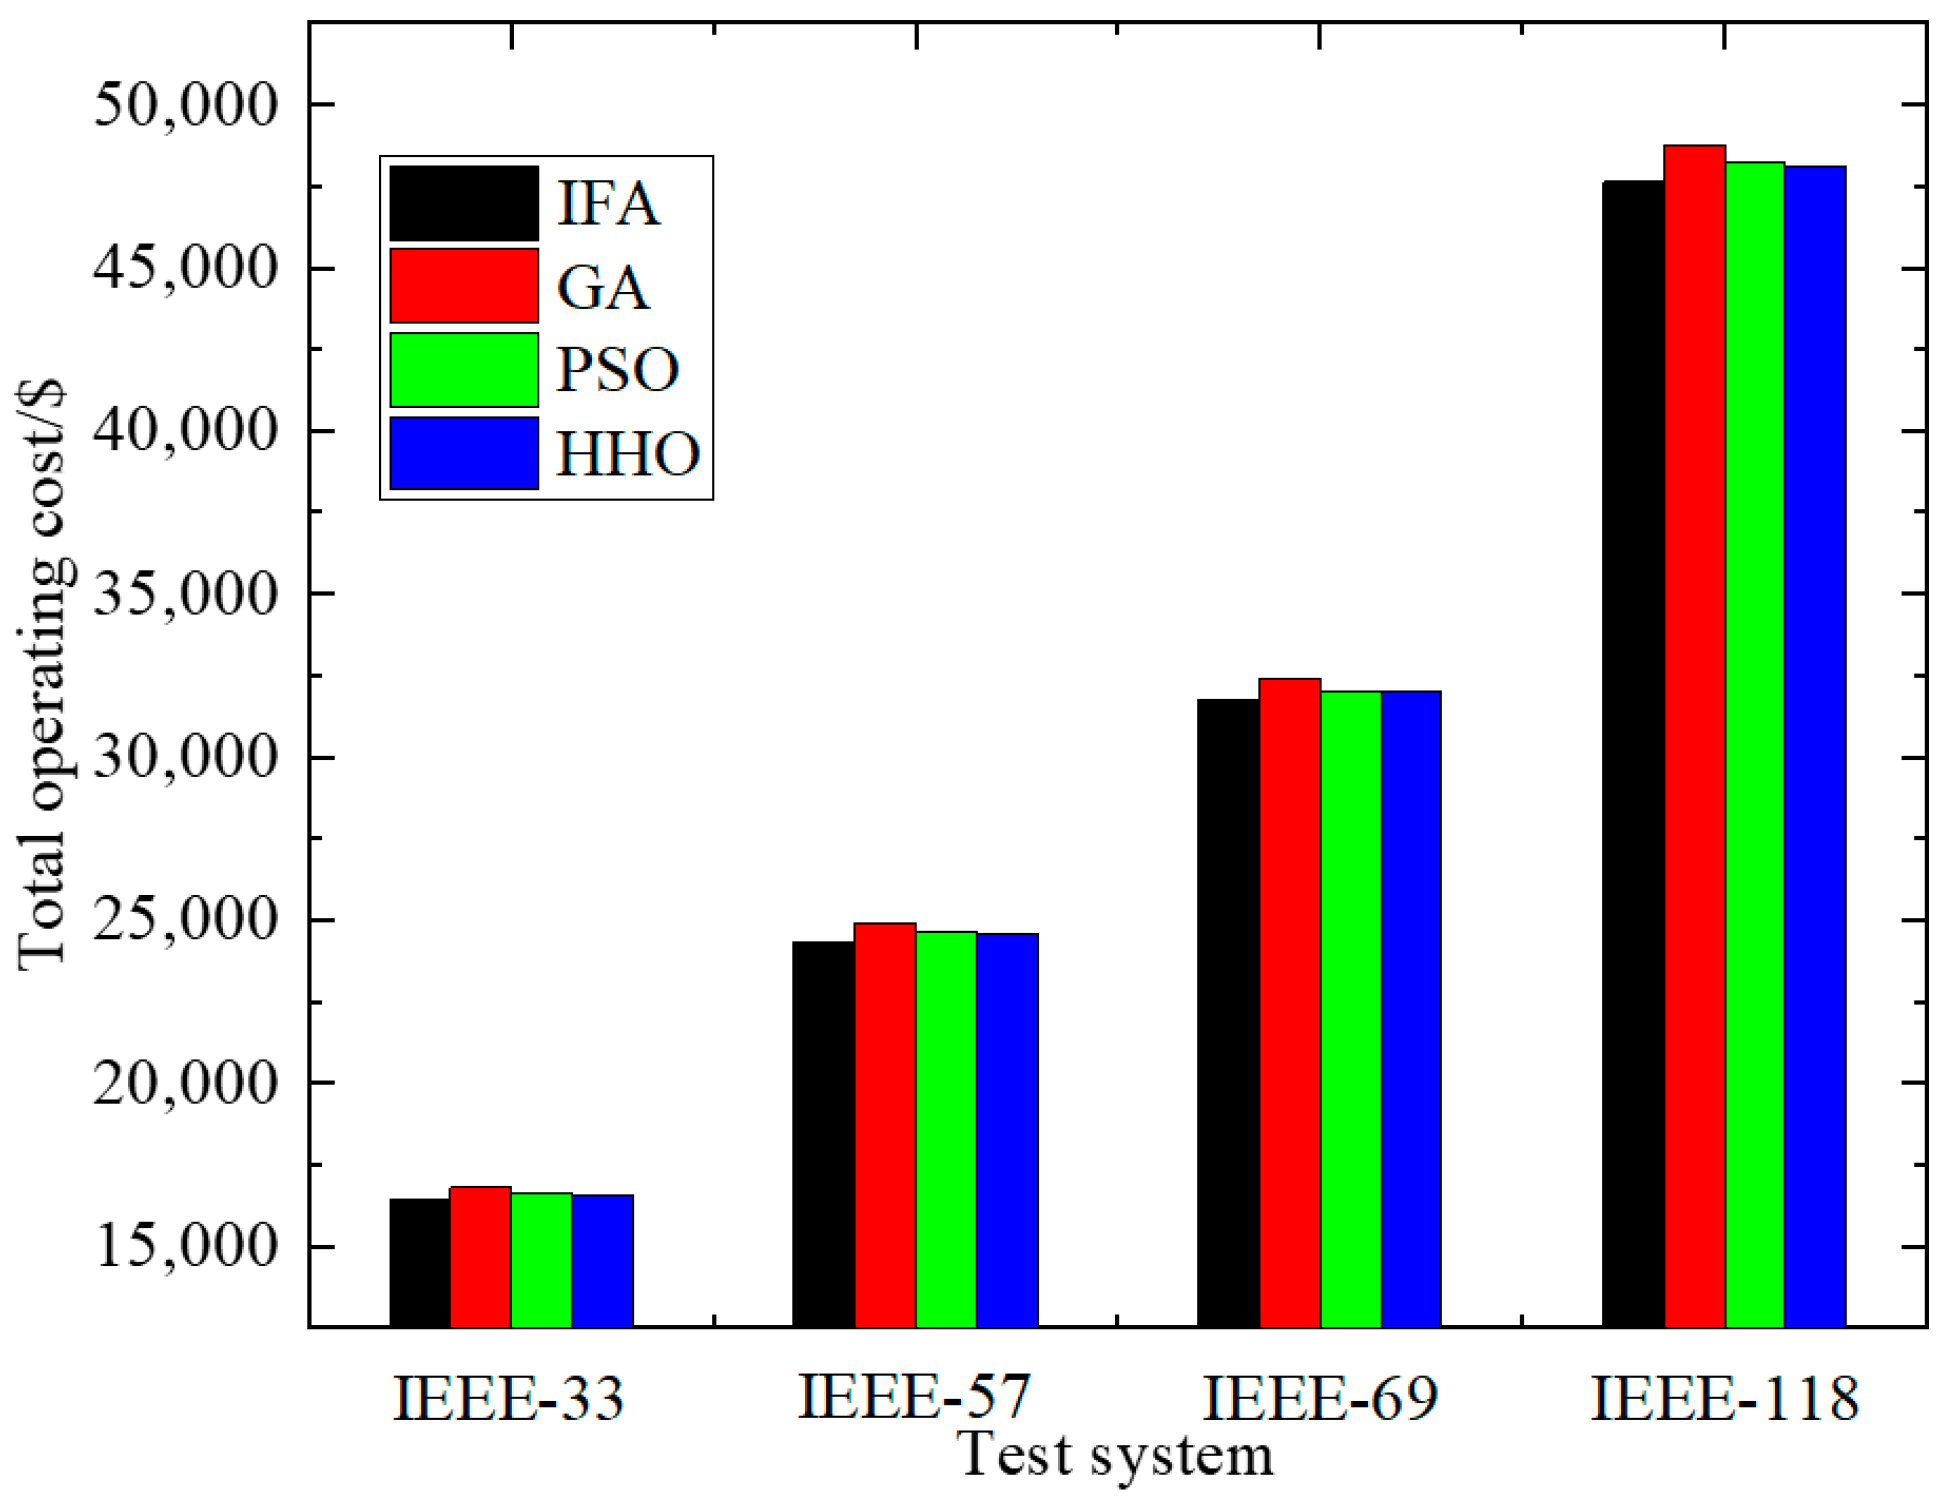
On the other hand, this study employs the IFA for problem-solving and optimization. Other commonly used optimization algorithms, including the Genetic Algorithm (GA) [36], Particle Swarm Optimization (PSO) [37], and Harris Hawks Optimization (HHO) [38], are used for comparison. Considering that the scale of the test system significantly impacts solution efficiency, this study selects IEEE-33, IEEE-57, IEEE-69, and IEEE-118 bus test systems of varying scales for validation. The relevant results are shown in Figure 12 and Figure 13 below.
Observing Figure 12 and Figure 13, the IFA optimizes its global search capability through adaptive step size and elite retention strategies, reducing the number of ineffective iterations. For instance, in the IEEE-118 bus system, the IFA’s computation time is approximately 25% shorter than that of the GA, due to its mechanism of dynamically adjusting attraction and step size parameters, which avoids getting trapped in local optima. The IFA more precisely matches renewable energy output with load demand in resource scheduling, minimizing voltage deviations and load shedding penalty costs. For example, in the IEEE-57 bus system, the IFA’s economic cost is about 1.4% lower than that of the PSO because it reduces reserve capacity requirements through coordinated optimization of fixed and flexible resources. The GA requires more iterations to converge due to the randomness of its crossover and mutation operations, resulting in a significant increase in the computation time, especially in complex systems. For instance, in the IEEE-118 bus system, the GA’s computation time is 33% longer than that of the IFA, as the population diversity maintenance mechanism adds computational overhead. Although the GA exhibits strong global search capabilities, it lacks sufficient local optimization, leading to a relatively conservative resource scheduling approach. For example, in the IEEE-33 bus system, the GA’s economic cost is 2.0% higher than that of the IFA due to premature convergence, which results in a lower renewable energy accommodation rate. The PSO converges quickly but is prone to getting stuck in local optima, requiring more adjustments, especially in larger-scale systems. For example, in the IEEE-69 bus system, the PSO’s computation time is 20% longer than that of the IFA because insufficient adjustment of the particle swarm’s inertia weight reduces search efficiency in the later stages. The PSO tends to average out resource allocation, failing to fully leverage the spatiotemporal complementarity of flexible resources. For example, in the IEEE-57 bus system, the PSO’s economic cost is 1.4% higher than that of the IFA due to imprecise scheduling of distributed photovoltaic systems. The HHO achieves a good balance between exploration and exploitation by simulating the hunting behavior of hawks, but its parameter adjustment is relatively complex. For instance, in the IEEE-118 bus system, the HHO’s computation time is 26% longer than that of the IFA because the energy function update rules increase computational complexity. The HHO performs stably in multi-objective optimization but lacks the fine-grained flexibility resource scheduling strategies of the IFA. For example, in the IEEE-33 bus system, the HHO’s economic cost is about 0.8% lower than that of the IFA, but its advantage diminishes in large-scale systems as fixed resource constraints limit its optimization space.

6. Conclusions

This paper delves into the critical challenges faced by the cyber–physical integrated power distribution system, particularly focusing on the dual risks—internal and external—that threaten its efficient, economical, and safe operation. The vulnerability of smart substations’ panoramic link information systems to deliberate cyber information attacks, which can maliciously alter operational data and impair equipment response capabilities, thereby influencing dispatcher decisions and potentially causing substantial losses, is a pressing concern that necessitates effective countermeasures. To tackle these challenges, this research proposes an innovative approach encompassing automatic verification and active defense mechanisms tailored for the cyber–physical power distribution system under panoramic link attacks. By employing the CGAN-IK-means model, we effectively generate typical scenarios to address internal risks stemming from the uncertainty of new energy output information, providing a robust foundation for risk assessment and management. For external threats posed by deliberate cyber information attacks, the formulation of a fixed–flexible adjustment resource response strategy represents a significant advancement. This strategy adeptly compensates for the deficiencies in equipment response capabilities through flexibility resource regulation, ensuring system resilience and stability even under adverse conditions. The evaluation of this strategy, based on the voltage level and load shedding amount, coupled with the enhanced computational efficiency achieved through an improved firefly algorithm, underscores its practical viability and superiority. However, the results rely solely on simulation data, lacking empirical validation from real power system operational data or pilot projects. Consequently, the adaptability and robustness of the proposed method in practical engineering applications have not been fully verified. Future research can focus on two directions: First, conducting case studies on actual power grids by incorporating real operational data or deploying pilot projects to further calibrate model parameters and optimize defense strategies; second, integrating feedback from field tests to refine multi-scenario adaptability analysis and explore the extended application of the method in complex power grid environments, thereby enhancing the practical value and industry-wide promotion potential of the research findings.

Author Contributions

Conceptualization, Y.W., X.H., Z.C., B.W., J.C. and H.Z.; software, Y.W., X.H., Z.C., B.W., J.C. and H.Z.; investigation, Y.W., X.H., Z.C., B.W., J.C. and H.Z.; writing—original draft preparation, Y.W., X.H., Z.C., B.W., J.C. and H.Z. All authors have read and agreed to the published version of the manuscript.

Funding

This research is funded by Special Cost Project of State Grid Shaanxi Electric Power Co., Ltd.: Research, Development and Application of the Panoramic Link-Decoupled Automatic Verification System for Substation Monitoring Information with Project Number: (B626JS25Z000—Shaan Dian Jian She [2025] No. 28).

Data Availability Statement

The original contributions presented in this study are included in the article. Further inquiries can be directed to the corresponding author.

Conflicts of Interest

Authors Yuan Wang, Xingang He, Zhi Cheng, Bowen Wang and Jing Che were employed by the company Shaanxi Power Transmission and Distribution Engineering Co., Ltd. The remaining authors declare that the research was conducted in the absence of any commercial or financial relationships that could be construed as a potential conflict of interest.

References

  1. Sun, C.; Su, Q.; Li, J. Secure Tracking Control and Attack Detection for Power Cyber-Physical Systems Based on Integrated Control Decision. IEEE Trans. Inf. Forensics Secur. 2025, 20, 968–979. [Google Scholar] [CrossRef]
  2. Chen, L.; Zhang, X.; Xiao, F. A Stability Condition for Asynchronous and Aperiodic Sampled-Data Cyber-Physical Systems Under DoS Attacks. IEEE Trans. Ind. Cyber-Phys. Syst. 2025, 3, 397–407. [Google Scholar] [CrossRef]
  3. Yang, L.; Cao, X.; Zhou, Y.; Lin, Z.; Zhou, J.; Guan, X.; Wu, Q. Frequency-Constrained Coordinated Scheduling for Asynchronous AC Systems under Uncertainty via Distributional Robustness. IEEE Trans. Netw. Sci. Eng. 2025, 1–18. [Google Scholar] [CrossRef]
  4. Zhang, H.; Chen, C.; Lei, S.; Bie, Z. Resilient distribution system restoration with communication recovery by drone small cells. IEEE Trans. Smart Grid 2022, 14, 1325–1328. [Google Scholar] [CrossRef]
  5. Ye, Z.; Chen, C.; Liu, R.; Wu, K.; Bie, Z.; Lou, G.; Gu, W.; Yuan, Y. Boost distribution system restoration with emergency communication vehicles considering cyber-physical interdependence. IEEE Trans. Smart Grid 2022, 14, 1262–1275. [Google Scholar] [CrossRef]
  6. Wang, C.; Yan, M.; Pang, K.; Wen, F.; Teng, F. Cyber-physical interdependent restoration scheduling for active distribution network via ad hoc wireless communication. IEEE Trans. Smart Grid 2023, 14, 3413–3426. [Google Scholar] [CrossRef]
  7. Sun, X.; Chen, J.; Zhao, H.; Zhang, W.; Zhang, Y. Sequential disaster recovery strategy for resilient distribution network based on cyber–physical collaborative optimization. IEEE Trans. Smart Grid 2022, 14, 1173–1187. [Google Scholar] [CrossRef]
  8. Xu, L.; Guo, Q.; Sheng, Y.; Muyeen, S.M.; Sun, H. On the resilience of modern power systems: A comprehensive review from the cyber-physical perspective. Renew. Sustain. Energy Rev. 2021, 152, 111642. [Google Scholar] [CrossRef]
  9. Tian, M.; Dong, Z.; Gong, L.; Wang, X. Coordinated repair crew dispatch problem for cyber–physical distribution system. IEEE Trans. Smart Grid 2022, 14, 2288–2300. [Google Scholar] [CrossRef]
  10. Su, Q.; Sun, J.; Li, J. Node Recovery Optimization of Cyber–Physical Power Systems Based on an SEIRD Epidemic Model. IEEE Internet Things J. 2025, 12, 11011–11022. [Google Scholar] [CrossRef]
  11. Haridas, R.; Sharma, S.; Bhakar, R.; Gu, C. A Novel Integrated Load Redistribution Attack Model to Induce Cascading Failures in Cyber Physical Systems. IEEE Trans. Ind. Cyber-Phys. Syst. 2025, 3, 454–463. [Google Scholar] [CrossRef]
  12. Haque, K.A.; Sun, S.; Huo, X.; Goulart, A.E.; Davis, K.R. Scalable Discrete Event Simulation Tool for Large-Scale Cyber-Physical Energy Systems: Advancing System Efficiency and Scalability. IEEE Access 2025, 13, 101900–101921. [Google Scholar] [CrossRef]
  13. Presekal, A.; Ştefanov, A.; Semertzis, I.; Palensky, P. Spatio-Temporal Advanced Persistent Threat Detection and Correlation for Cyber-Physical Power Systems Using Enhanced GC-LSTM. IEEE Trans. Smart Grid 2025, 16, 1654–1666. [Google Scholar] [CrossRef]
  14. Wang, Y.; Li, J.; Qiu, J.; Chen, Y. Adaptive Early Warning Method of Cascading Failures Caused by Coordinated Cyber-Attacks. CSEE J. Power Energy Syst. 2025, 11, 406–423. [Google Scholar] [CrossRef]
  15. Yu, X.; Liu, N.; Xue, Y. The Role of Cyber-Physical-Social Systems in Smart Energy Future. IEEE Trans. Ind. Cyber-Phys. Syst. 2024, 2, 35–42. [Google Scholar] [CrossRef]
  16. Yang, Y.; Zhang, P.; Wang, C.; Zhao, Z.; Lai, L.L. State Transition Modeling Method for Optimal Dispatching for Integrated Energy System Based on Cyber—Physical System. J. Mod. Power Syst. Clean Energy 2024, 12, 1617–1630. [Google Scholar] [CrossRef]
  17. Qin, P.; Fu, Y.; Wu, K.; Zhang, J.; Wu, X.; Zhao, X. Packet Routing and Energy Cooperation for RTU Satellite-Terrestrial Multi-Hop Network in Remote Cyber-Physical Power System. IEEE Trans. Netw. Sci. Eng. 2024, 11, 3585–3597. [Google Scholar] [CrossRef]
  18. Davarikia, H.; Barati, M. A tri-level programming model for attack-resilient control of power grids. J. Mod. Power Syst. Clean Energy 2018, 6, 918–929. [Google Scholar] [CrossRef]
  19. Xiang, Y.; Zhang, X.; Shi, D.; Diao, R.; Wang, Z. Robust Optimization for Transmission Defense Against Multi-Period Attacks with Uncertainties. Int. J. Electr. Power Energy Syst. 2020, 121, 106154. [Google Scholar] [CrossRef]
  20. Ruan, Z.; Lv, L.; Liu, Y.; Yang, J.; Liu, J.; Ni, W. Research on Multi-Objective Defense Strategies for Power CPS Based on Pareto Optimality. J. Electr. Power Syst. Autom. 2019, 31, 36–42. [Google Scholar]
  21. Yang, Y.; Lan, S.; Qin, Z.; Liu, H. Network-Physical Coordinated Attacks in Cyber-Physical Power Systems. Electr. Power Autom. Equip. 2020, 40, 97–103. [Google Scholar]
  22. Zhang, J.; Wu, J.; Qi, X.; Yang, X.; Sun, L. Cascading Failure Analysis and Risk Assessment of CPPS Based on Network Dependency. Power Syst. Prot. Control 2023, 51, 164–171. [Google Scholar]
  23. Zhang, Y.; Liu, W.; Liu, G.; Huang, S. Modeling and Vulnerability Analysis of Cyber-Physical Power Systems Considering Topological Correlation and Dual Coupling. Proc. CSEE 2021, 41, 5486–5500. [Google Scholar]
  24. Available online: https://www.kaggle.com/datasets/PROPPG-PPG/hourly-weather-surface-brazil-southeast-region (accessed on 15 August 2023).
  25. Available online: https://gitcode.com/open-source-toolkit/8a397 (accessed on 14 September 2018).
  26. Lin, Y.; Luo, H.; Chen, Y.; Yang, Q.; Zhou, J.; Chen, X. Enhancing Participation of Widespread Distributed Energy Storage Systems in Frequency Regulation Through Partitioning-Based Control. Prot. Control Mod. Power Syst. 2025, 10, 76–89. [Google Scholar] [CrossRef]
  27. Wang, Y.; Li, L.; Chang, L.; Guan, J.; Peng, H.; Wu, B. Conditional Scenario Generation Method of New Energy Prediction Error Based on GMM. In Proceedings of the 2025 8th International Conference on Energy, Electrical and Power Engineering (CEEPE), Wuxi, China, 25–27 April 2025; pp. 394–399. [Google Scholar] [CrossRef]
  28. Wu, Q.; Lu, T.; Ding, Z.; Shi, L.; Xu, Y.; Xu, X. Automatic Completion Method of Power Missing Data in Distribution Network Based on GCN-VAE Model. In Proceedings of the 2024 China International Conference on Electricity Distribution (CICED), Hangzhou, China, 12–13 September 2024; pp. 1117–1121. [Google Scholar] [CrossRef]
  29. Huo, Y.; Yang, J.; Qu, J.; Zhang, C.; Zhou, L.; Zhao, W.; Jiang, H.; Wu, Z.; Dai, J.; Duan, W.; et al. Lightweight Data-Driven Planning Method of Hybrid Energy Storage Systems in the New Power System. IEEE Trans. Ind. Appl. 2025, 61, 4792–4800. [Google Scholar] [CrossRef]
  30. Chen, S.; Chen, W.; Lin, J.; Chen, L. Modeling and Optimal Operation of Mobile Energy Storage Units Considering the Operation Safety of the Distribution Networks. In Proceedings of the 2024 4th Power System and Green Energy Conference (PSGEC), Shanghai, China, 22–24 August 2024; pp. 1243–1247. [Google Scholar] [CrossRef]
  31. Wang, Z.; Li, X.; Xia, Y.; Zhao, T.; Xia, X.; Li, Y. Power System Evolutionary Planning Based on LHS-kmeans Method for Generating Future Load Scenarios. In Proceedings of the 2021 3rd International Conference on Smart Power & Internet Energy Systems (SPIES), Shanghai, China, 25–28 September 2021; pp. 381–385. [Google Scholar] [CrossRef]
  32. Wang, B.; Xu, Z.; Guan, X. Robust Load Frequency Control for Uncertainties Multi-Area Power Systems with Couplings of Systems Dynamics and Reconfigurable Communication Networks. IEEE Trans. Power Syst. 2025, 40, 2584–2599. [Google Scholar] [CrossRef]
  33. Stecher, J.; Kiltz, L.; Graichen, K. Generalized Tolerance Optimization for Robust System Design by Adaptive Learning of Gaussian Processes. IEEE Access 2025, 13, 68959–68983. [Google Scholar] [CrossRef]
  34. Liu, S.; Zenelis, I.; Li, Y.; Wang, X.; Li, Q.; Zhu, L. Markov Game for Securing Wide-Area Damping Control Against False Data Injection Attacks. IEEE Syst. J. 2021, 15, 1356–1365. [Google Scholar] [CrossRef]
  35. Cao, Y.; Zhou, B.; Chung, C.Y.; Zhou, K.; Zhu, L.; Shuai, Z. Resilience-Oriented Coordinated Topology Reconfiguration of Electricity and Drainage Networks with Distributed Mobile Emergency Resources. IEEE Trans. Smart Grid 2025, 16, 786–800. [Google Scholar] [CrossRef]
  36. Xu, H.; Yu, T.; Ren, C.; He, S. Finite-Time Decentralized Sliding Mode Control for Interconnected Systems and Its Application to Electrical Power Systems: A GA-Assisted Design Method. IEEE Trans. Circuits Syst. I Regul. Pap. 2024, 71, 2835–2847. [Google Scholar]
  37. Butti, O.S.T.A.; Burunkaya, M.; Rahebi, J.; Lopez-Guede, J.M. Optimal Power Flow Using PSO Algorithms Based on Artificial Neural Networks. IEEE Access 2024, 12, 154778–154795. [Google Scholar] [CrossRef]
  38. Wang, X.; Wang, S.; Ren, J.; Jing, W.; Shi, M.; Zheng, X. A Novel Harmonic Detection Method for Microgrids Based on Variational Mode Decomposition and Improved Harris Hawks Optimization Algorithm. IEEE Access 2024, 12, 60797–60807. [Google Scholar] [CrossRef]
Figure 1. The structural diagram of the CGAN.
Processes 13 03269 g001
Figure 2. The topological diagram of the test system.
Processes 13 03269 g002
Figure 3. Typical scenarios generated by the method proposed in this paper.
Processes 13 03269 g003
Figure 4. The charging and discharging power of the ESS.
Processes 13 03269 g004
Figure 5. Network losses across the three scenarios.
Processes 13 03269 g005
Figure 6. Operational status of OLTC.
Processes 13 03269 g006
Figure 7. Operational status of capacitor banks.
Processes 13 03269 g007
Figure 8. Operational status of SVG.
Processes 13 03269 g008
Figure 9. The operational performance of the MESS under Scenario 1.
Processes 13 03269 g009
Figure 10. The operational performance of the MESS under Scenario 2.
Processes 13 03269 g010
Figure 11. The operational performance of the MESS under Scenario 3.
Processes 13 03269 g011
Figure 12. Comparison of computation time among different methods.
Processes 13 03269 g012
Figure 13. Comparison of operational costs among different methods.
Processes 13 03269 g013
Table 1. Comparison of performance among different scenario generation methods.
Data SetMethodDBISCRMSE
Wind power dataCGAN0.820.760.045
K-means1.250.620.078
GMM1.030.680.065
VAE0.950.710.058
PV dataCGAN0.780.790.032
K-means1.180.590.085
GMM0.970.650.061
VAE0.890.730.049
Table 2. Multi-indicator results under different scheduling strategies.
MethodEconomic Cost/USDAverage Voltage Deviation/p.u.Total load Shedding Amount/MW
Our proposed method16,3240.020.21
Method considering only fixed resources [29]14,5260.060.82
Method considering only flexible resources [30]15,3310.040.54
No defense strategy implemented13,1680.081.03
Table 3. The scheduling results under different uncertainty characterization methods.
MethodRenewable Energy Accommodation Rate/%Average Voltage Deviation/p.u.Total Load Shedding Amount/MW
The proposed method 96.80.020.21
K-means clustering [31]94.30.060.581
Robust optimization [32]91.70.070.92
Table 4. Computational time and economic cost under different numbers of scenarios.
Number of ScenariosEconomic Cost/USDComputational Time/s
516,324157
1016,117324
1515,923473
2015,804668
Table 5. Detailed comparison results of different methods under multiple operating scenarios.
MetricThe Proposed MethodTraditional Robust Optimization MethodDistributed Defense Method Based on Multi-Agent SystemsSelf-Recovery Strategy
Economic Cost/USD16,42518,54717,17518,854
Renewable Energy Accommodation Rate/%96.891.793.585.2
Voltage Fluctuation Value/p.u.0.020.070.050.10
Load Shedding Amount/MW0.210.920.651.50
Disclaimer/Publisher’s Note: The statements, opinions and data contained in all publications are solely those of the individual author(s) and contributor(s) and not of MDPI and/or the editor(s). MDPI and/or the editor(s) disclaim responsibility for any injury to people or property resulting from any ideas, methods, instructions or products referred to in the content.