Abstract
Ultra-short-term wind power exhibits significant minute-level fluctuation characteristics, leading to substantial instantaneous prediction errors. To mitigate the impact of instantaneous wind power prediction errors, the following steps are taken: First, the correlation between instantaneous prediction errors and meteorological factors is determined, and strongly associated variables are selected as model inputs. Next, the particle swarm optimization algorithm is employed to optimize the initial weights and threshold parameters of the spatiotemporal backpropagation neural network prediction model to enhance its performance. Subsequently, based on the nonlinear relationship between wind speed/direction data and instantaneous prediction errors, a wind speed matrix gradient correction method and a deep learning correction method with physical constraints on prediction errors are constructed to address errors caused by declining model generalization under strong disturbances. To validate the effectiveness of the proposed prediction algorithm integrating parameter optimization and the error correction method, it is compared with typical convolutional neural networks, long short-term memory networks, and backpropagation neural algorithms. The results demonstrate that compared to other wind power prediction strategies, this method reduces the mean absolute percentage error, root mean square error, and mean absolute error by 48.49%, 45.51%, and 50.8%, respectively. These results confirm that combining error correction strategies with prediction model parameter optimization effectively enhances the ability to reduce instantaneous wind power prediction errors, providing a practical technical solution for optimizing ultra-short-term wind power prediction accuracy and offering valuable insights for ensuring the stability of wind power grid integration.
1. Introduction
Building a sustainable low-carbon society is the basic point for mankind to cope with global warming [1]. However, renewable clean energy sources such as wind power and solar power, which are used to replace traditional fossil energy sources [2], have a high incidence of curtailment of wind and solar power due to their inherent intermittency and to ensure the stability of the power system [3,4]. In order to improve the acceptance rate of this type of energy in the power grid, improving the control and intermittent improvement of the power supply side by improving the accuracy of wind power prediction in wind farms has been widely studied.
Ultra-short-term wind power forecasting is an important basis for wind power plants to develop daily power generation plans [5]. Although many scholars have studied ultra-short-term power forecasting in recent years, the prediction accuracy is generally low due to the influence of ultra-short-term transient weather factors, especially in extreme environments.
In Ref. [6], the historical time series data were used to calculate the financial technical indicators, and the Monte Carlo method and the ranking ant colony method were used for parameter optimization for wind power prediction; this method did not take into account the influence of meteorological factors on the wind power prediction model. In Ref. [7], the nonlinear mapping relationship between the extended sensitive meteorological factors and wind power output was used by using the long short-term memory neural network to predict wind power; however, this method exhibits relatively weak capability under strong disturbances. In Ref. [8], a two-stage wind power prediction based on long-time coarse prediction and short-time scale fine correction was proposed, which only considers the impact of different time scales on prediction accuracy without accounting for environmental factors. In Ref. [9], the convolutional neural network was used to divide the original wind power data into time series data at different time scales to obtain more feature information; this method improved feature extraction in the prediction model but overlooked the influence of sensitivity factors. In Ref. [10], reconstructed data and normalized meteorological data were used as inputs, and a bidirectional long short-term memory neural network was used to make short-term predictions of wind power; the generalization performance of this model was relatively poor when facing strong disturbances. In Ref. [11], the non-stationary wind power time series was decomposed into relatively stationary components using empirical mode decomposition and used as the dataset for the prediction model. However, only the dataset was improved, resulting in poor model adaptability and generalization capability. In Ref. [12], the model input time series data are decomposed into high-frequency and low-frequency components, and differential information extraction is performed on these components to achieve wind power prediction. This method neglects the influence of meteorological factors. In Ref. [13], by reducing the time granularity of the least squares support vector machine (LS-SVM) prediction model for chaotic sequences, the prediction error was decreased; however, this method increases the computation time and exhibits poor generalization capability. In Ref. [14], the prediction results were corrected by establishing an error correction module and calculating confidence intervals through probability fitting distribution of errors, while neglecting the influence of sensitive meteorological factors. In Ref. [15], by establishing a loss function and modifying the prediction of wind power based on the correlation between errors and power, this method does not take into account the influence of meteorological factors on the model and involves a large amount of computation.
When the wind power experiences minute-level drastic fluctuations and the wind farm is large in scale, the methods mentioned in the aforementioned references have difficulty in effectively overcoming the ultra-short-term instantaneous wind power prediction errors, which may affect the stability of the power grid. To address these issues, this paper proposes a spatiotemporal backpropagation neural network and an error correction method model:
Part 1: Establish a CNN-BPNN prediction model and optimize its initial weights and thresholds using a particle swarm optimization algorithm; compared with CNN-LSTM and single BPNN, the prediction accuracy is improved, thereby overcoming the errors in ultra-short-term instantaneous wind power prediction. The detailed content is in Section 2 and Section 2.1, Section 2.2 and Section 2.3.
Part 2: In the face of strong interference caused by minute-level violent fluctuations in wind power, a wind speed matrix gradient error correction method is adopted to address the error problem caused by the decline in model generalization ability under strong disturbances; compared with traditional prediction models that do not use this method, the MAPE, RMSE, and MAE indicators of the proposed method are reduced. The detailed content is in Section 2 and Section 2.4.
Part 3: Conduct simulation experiments to verify the practicality of the CNN-BPNN prediction model and the wind speed matrix gradient error correction method in overcoming instantaneous wind power prediction errors. The detailed content is in Section 3.
Part 4: Summarize the research results, point out the shortcomings of the study, and propose future research directions. The detailed content is in Section 4.
2. Materials and Methods
2.1. Correlation Analysis of Influencing Factors on Ultra-Short-Term Instantaneous Prediction Error of Wind Power
When the wind power fluctuates violently in the minute-level time step and the scale of the wind farm is large, a large instantaneous prediction error will be generated, and when the prediction error exceeds ±15% [16], it will have a great impact on the frequency stability, voltage stability, and reserve capacity scheduling of the power system [17]. Therefore, in order to overcome the ultra-short-term instantaneous prediction error of wind power, it is necessary to analyze the factors affecting the instantaneous prediction error.
There are many factors influencing the ultra-short-term instantaneous prediction error of wind power, among which meteorological factors are particularly important. The Spearman [18] correlation analysis method can effectively evaluate the correlation between instantaneous prediction errors and meteorological factors because it is insensitive to outliers and does not require normal distribution of data. The correlation coefficient is:
where: is expressed as the difference in the rank of pairwise samples on two variables; is expressed as the total number of samples.
The value range of the Spearman correlation coefficient is (−1,1), and the absolute value reflects the strength of the correlation between variables (the larger the absolute value, the stronger the correlation), and the symbol represents the correlation direction (positive/negative correlation), as shown in Table 1; the data in this table are sourced from Reference [18].

Table 1.
Spearman correlation analysis degree table.
The key meteorological parameters in the numerical weather prediction (NWP) data of wind farms were selected as the analysis variables, including wind speed (V), wind direction (S), air density (U), ground pressure (Q), surface temperature (T), and relative humidity (R), and the instantaneous prediction error (E) was combined with a comprehensive analysis to explore the influence mechanism and correlation characteristics of each meteorological element on the ultra-short-term instantaneous prediction error of wind power. By analyzing the influence strength relationship of meteorological factors on wind power prediction in Figure 1, we identify strongly correlated variables as model considerations to reduce the computational load. The correlation coefficient is shown in Figure 1.
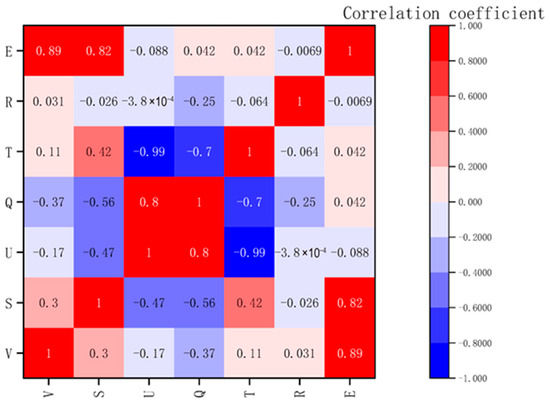
Figure 1.
Correlation coefficient plots between various meteorological elements and wind power.
Through Spearman correlation analysis, it is found that wind speed () and wind direction () have a strong positive correlation with the instantaneous prediction error, indicating that these two meteorological parameters have a decisive impact on prediction accuracy. In contrast, the correlation coefficients of ground pressure, air density, ground humidity, and relative humidity are all low, indicating that their influence on the instantaneous prediction error is negligible. Based on this analysis result, in order to improve the computational efficiency and prediction accuracy of the model, this study focuses on selecting wind speed and wind direction as the core input variables when constructing the prediction model, and excludes the interference of other weakly related meteorological parameters in the resulting error.
2.2. Spatiotemporal BP Neural Network Prediction Model
The CNN-BPNN spatiotemporal fusion model consists of two parts: the spatial convolution module (CNN) and the BP neural network (BPNN). The spatial convolution module is used to extract spatial features of the data, while the BP neural network is used to extract time-series features of the data, enabling spatiotemporal feature fusion for model input. The prediction error of ultra-short-term wind power forecasting is continuously reduced through iterative forward and backward propagation. The flow of the spatiotemporal BP neural network prediction model is shown in Figure 2.
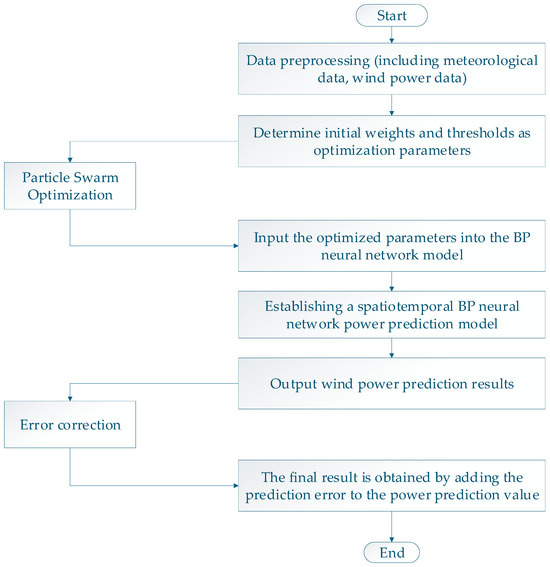
Figure 2.
Model prediction process.
2.2.1. CNN Convolution Module
The CNN convolution module [19] first uses a multi-layer convolution structure to extract multi-level spatial features from the input data, generates a feature vector graph, then reduces the dimensionality of the feature vectors through the pooling layer, and finally inputs the extracted multiple feature vectors into the BP neural network for model training; the convolutional layer operation is shown in Equation (2) and Figure 3.
where represents the result of the convolutional mapping; represents the sequence number of the input feature; is expressed as an activation function; represents input feature data; “” represents a standard convolution operation; represents the output result when the J-th feature is input to j − 1 layer; represents the bias matrix of the output feature; represents the j-th convolutional kernel matrix that connects the I-th input feature and the J-th output feature.
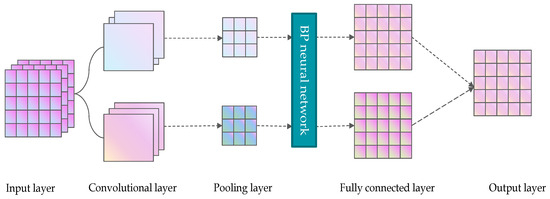
Figure 3.
CNN convolution module extraction process.
2.2.2. BP Neural Networks
The BP neural network is a training model based on an error backpropagation algorithm, and its core mechanism consists of two alternating processes: forward propagation and backpropagation [20]. In the forward propagation stage, the input signal is passed forward layer by layer, passing through the hidden layer until the output layer produces the prediction result [21]. In the backpropagation stage, the network calculates the gradient of the output error and reversely adjusts the connection weights and bias parameters of each layer along the network structure. This iterative parameter optimization process gradually reduces the difference between the output of the network and the expected value, thereby continuously improving the fitting ability of the model. The whole learning process is essential to realize the dynamic correction of network parameters through the reverse transmission of error signals. The structural diagram of the model is shown in Figure 4.
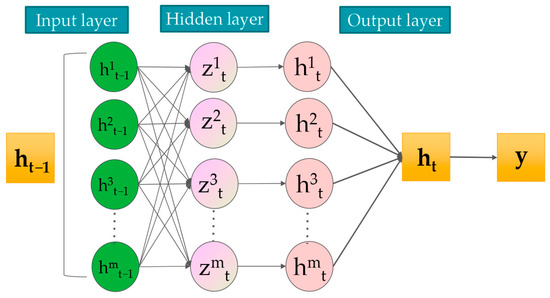
Figure 4.
BP neural network.
During forward propagation: (the explanation of formula symbols can be found in Appendix A, and the same applies to the formulas below.)
After the end of forward propagation, the loss function is calculated based on the actual value and the predicted result .
During backpropagation:
According to the chain rule, we calculated the gradients , , of the loss function for each layer parameter, and based on the gradient descent strategy, updated the network weights and offsets with the negative gradient direction of the target.
Until the loss value converges or reaches a predetermined threshold, and output the prediction result.
2.3. Initialization Weight and Threshold Optimization Based on Particle Swarm Optimization Algorithm
Initialization weights and thresholds are the most important parameters of spatiotemporal BP neural network prediction models. Too large weights and thresholds may increase the computational effort of the model, while smaller weights and thresholds may cause the model to fall into a local minimum during the iteration process, be unable to capture the time series features of the input data and reduce the prediction accuracy of the model. In order to overcome the ultra-short-term instantaneous prediction error of wind power, it is necessary to optimize the above parameters.
The particle swarm optimization algorithm [22] is an optimization method based on population information, which can find the optimal solution in the global search space, so the initial weight value and threshold of the BP neural network are optimized through this algorithm, and the specific process is as follows:
Step 1: Let the number of neurons in the input layer of the model be a and the number of neurons in the output layer be b, then, the number of neurons in the hidden layer is:
Step 2: The set of ownership values and thresholds in the model is taken as the optimization parameters and represented by randomly generated individuals by the system. Secondly, the sum of all threshold numbers and weight numbers in the model is used as the individual search space dimension M of the particle swarm algorithm; that is
Thus, the M-dimension vector is used to represent the position vector of the nth particle in the nth generation population. The and are used to represent the global optimization position and the individual optimal position of the initialized particle swarm, respectively.
Step 3: The input of the model is all the particles, and the particle fitness function is established to evaluate the quality of the particles, while the position and velocity of each particle are updated on this basis. The larger the value of the particle fitness function is, the better is the fitness of the particle; the fitness function is defined as
where represents the number of training samples, and respectively represent the predicted output value and actual output value of the i-th sample.
Based on and , we update the velocity of the particles as follows:
where represents the individual optimal solution in the m-th generation population; is expressed as the global optimal solution in the m-th generation population; , represent updated learning factors; , are represented as random numbers between [0, 1]; represents the updated inertia weight, in which case the particle’s position is updated to:
Step 4: after determining the weight values and thresholds of the model, predictions can be made.
2.4. Ultra-Short-Term Transient Error Correction Strategy
While improving the accuracy of the spatiotemporal BP neural network prediction model, in order to avoid severe fluctuations in wind speed that may reduce the model’s generalization and generate significant instantaneous prediction errors, an error correction switching strategy is adopted to correct the power prediction results.
2.4.1. Error Correction Unit Based on Cross-Processing
The ultra-short-term instantaneous prediction error of wind power is related to the wind speed (V) and wind direction (S) factors, and an error correction unit for , and is constructed, while a fitting function is used to reveal their mapping relationship.
where represents the error value at time t; represents the wind speed at the moment; represents the direction of the wind at the moment; represents a mapping function for error correction units; , , and are the dimensions of historical data.
Due to the dimensional difference between the influencing factor values, normalization is required [23], as shown in Equation (13).
where represents the normalized value; represents the values to be normalized; represents the minimum value to be normalized; represents the maximum value to be normalized.
After processing, the relationship between wind speed, wind direction, and can be expressed as:
where represents the weight coefficient; represents the non-linear correlation value between the influencing factor and .
By cross-processing, complementary features can be achieved between different data sources to overcome the short-term instantaneous prediction errors of wind power.
where represents the value after cross-processing.
The prediction error corrected by cross-processing can be expressed as:
where: and represent the weight coefficient between the new influencing factors.
2.4.2. Deep Learning Error Correction Considering Physical Constraints
Considering the physical constraints of instantaneous prediction error, a deep learning error correction unit with wind speed (V) and wind direction (S) as input features is constructed, and the regular term of its own loss function is replaced by an error correction unit loss function based on cross-processing, while a new loss function is constructed as shown in Equation (17).
where represents the loss function as the control weight of the regularization term; represents the corrected error value; represents the number of samples.
2.4.3. Error Correction of Matrix Gradient Adaptive Selection Strategy to Deal with Strong Perturbations
Considering the influence of severe fluctuations in wind speed in the ultra-short term on the generalization performance of the prediction model, the Toepliz matrix [24] (hereinafter referred to as the matrix ) gradient value based on the time series of wind speed is used to reflect the fluctuation in wind speed.
Assuming a continuous wind speed of , the matrix can be expressed as:
where represents a matrix that is recursively filled along the diagonal direction with as the main diagonal and as the adjacent diagonal.
When the wind speed fluctuates violently, the sliding window mechanism is used to analyze the time series data of wind speed, and the matrix is updated on a rolling basis according to the updated wind speed (V) data to reflect the fluctuation characteristics of wind speed. The updated matrix is:
From the above equation, it can be seen that with the continuous update in wind speed, the new wind speed value will constantly replace the wind speed value of the previous time step , but the order of the matrix will not change.
A matrix gradient method was used to quantify the relationship between the above update changes. Suppose the matrix after rolling time steps is , and its order is , and the matrix is now divided into column vector forms, then the expression is that the first two terms of the matrix are backward differential as the first term of the transverse gradient ; The last two items are forward-differential as the last term of the transverse gradient . The rest of the terms are summed by difference operations with the two terms before and after being averaged as the middle term of the transverse gradient , and its expression is:
The longitudinal gradient is obtained using the same calculation method as above, and its expression is:
Merging the transverse and longitudinal gradients , the expression of the matrix gradient is:
where represents the element value of the i-th row and the j-th column of ; represents the element value of the i-th row and the j-th column of . The index reflecting the intensity of wind speed fluctuation is obtained by normalizing the matrix gradient difference between two adjacent time steps, and its expression is as follows:
where represents the standard value of the matrix gradient; , represent the gradient values of the matrix at time t and the previous time , respectively.
The large size will cause the performance of the error correction unit based on cross-processing to deteriorate when processing complex nonlinear data, and it is easy to produce instantaneous prediction errors. In contrast, the deep learning error correction unit can better adapt to the dynamic change characteristics of the error due to its powerful timing modeling ability, so as to show better correction performance. Therefore, in order to make the model better adapt to the frequent and violent fluctuations in wind speed in the ultra-short period by taking advantage of its advantages and disadvantages, an adaptive selection strategy for error correction is proposed, in which the threshold value is set according to the error distribution under the gradient difference of each time step of the matrix , and the error correction unit is adaptively selected for error correction. The adaptive selection strategy process of the error correction unit is shown in Figure 5.
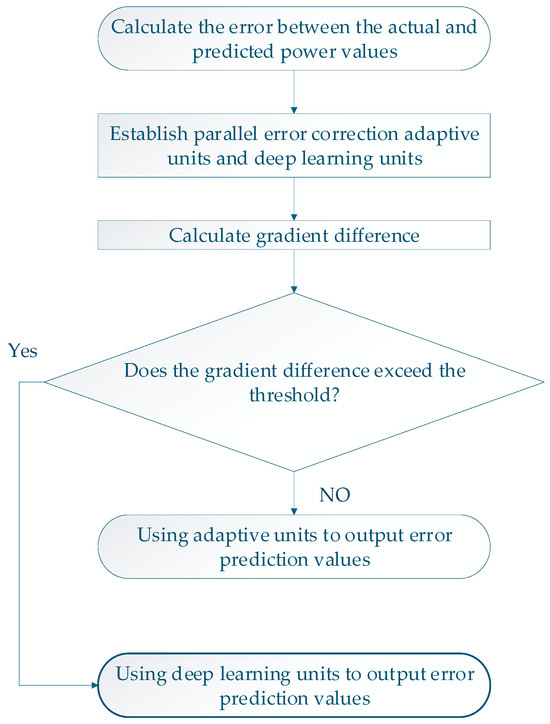
Figure 5.
Adaptive selection strategy for error correction units.
3. Case Analysis
Using measured data from three wind farms in East China over a 30-day period, with installed capacities of 50 MW, 70 MW, and 100 MW, respectively, the 50 MW wind farm serves as the primary focus of this study. The data include wind speed, wind direction, and corresponding wind power output from NWP data, sampled at 15-min intervals with a time window set to 16. The measured data are divided into training and testing sets, with the first 29 days used as the training set for model development and the 30th day as the testing set. Mean Absolute Percentage Error (MAPE), Root Mean Square Error (RMSE), and Mean Absolute Error (MAE) are used as evaluation metrics [25].
Experimental simulations using 30 days of single-field data may face issues such as insufficient sample size and limited scenario coverage. Therefore, the data in this paper should only be considered as preliminary experimental results, with plans to expand the data scale in the future to enhance generalizability.
3.1. Comparative Analysis of Model Predictions
To validate the prediction performance of the CNN-BPNN network, the results were compared with CNN-LSTM (Model 1) and BPNN (Model 2), as shown in Figure 6 and Table 2. It can be seen that compared with other models, the proposed models MAPE, RMSE, and MAE are reduced by 48.49%, 45.51%, and 50.8%, respectively.
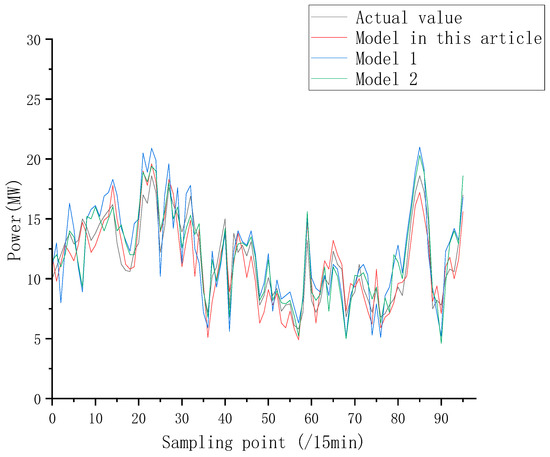
Figure 6.
Comparison of prediction results from different wind power forecasting models.

Table 2.
Wind power prediction model evaluation index comparison.
3.2. Initialization of Weight Values and Threshold Parameter Optimization
The population number, parameter dimension M, and maximum number of iterations of the particle swarm optimization algorithm are set to 12, 3, and 120 [26], respectively. The results are shown in Table 3.

Table 3.
Weight values and threshold optimization results.
Since the prediction accuracy of the spatiotemporal backpropagation neural network model largely depends on the initialization weight value and threshold setting of the model, in order to overcome the ultra-short-term instantaneous prediction error of wind power, the initialization parameters of the model need to be optimized. The optimization performance is verified by comparing with the gray wolf optimization algorithm (GWO) and the sparrow search algorithm (SSA); the results are shown in Figure 7. It can be seen that the initial fitness values of PSO, GWO, and SSA are 0.84, 0.91, and 0.94 respectively, and PSO optimizes parameters to prevent the model from falling into local optima, exhibiting faster convergence speed and better convergence compared to the other two algorithms, indicating its superior optimization performance over the other two algorithms.
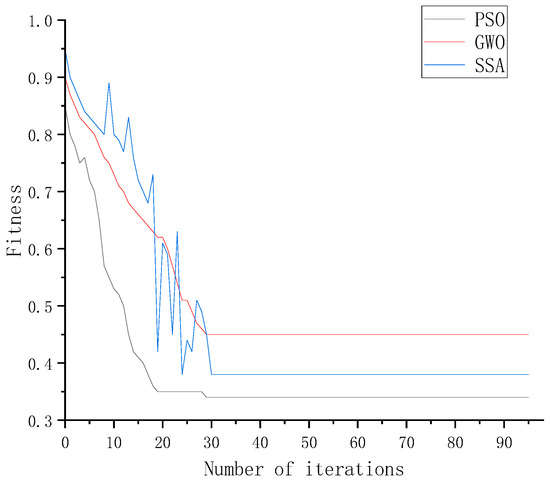
Figure 7.
Iterative fitness curve.
In order to verify the ability of the prediction model to overcome the instantaneous prediction error, the data of the first 4 h are used as input to predict the wind power in the next 4 h. Comparative experiments were carried out with GWO-CNN-BPNN (Model 1) and SSA-CNN-BPNN (Model 2), and the results are shown in Figure 8 and Table 4. It can be seen that compared to GWO-CNN-BPNN and SSA-CNN-BPNN, the PSO-CNN-BPNN model exhibits smoother fluctuations in wind power, with better prediction accuracy and generalization performance, and is more capable of overcoming instantaneous prediction errors.
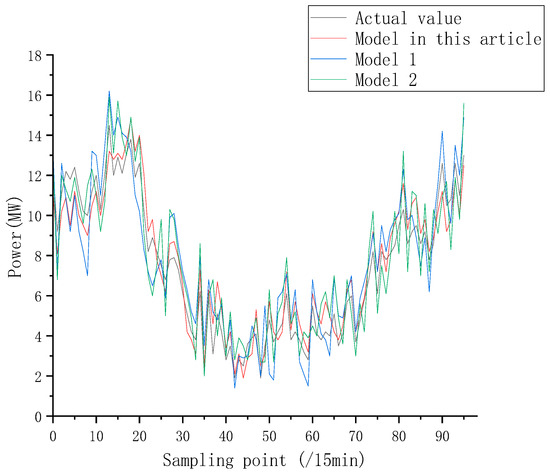
Figure 8.
Comparison of predictions from various parameter-optimized models.

Table 4.
Parameter optimization model evaluation metrics comparison.
3.3. Analysis of the Correction Effect of Ultra-Short-Term Instantaneous Error
In the process of wind power prediction on the test set, the error distribution of each gradient difference of the Toepliz matrix is shown in Figure 9.
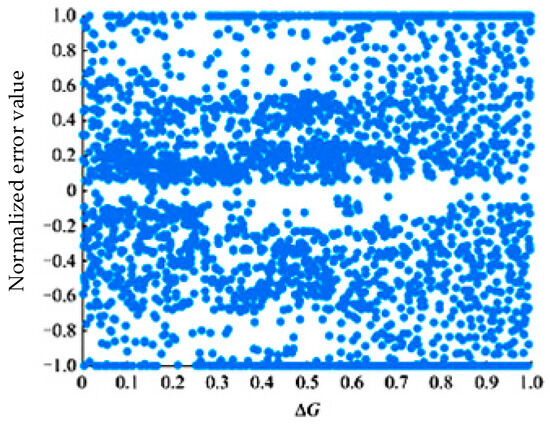
Figure 9.
Error distribution at different gradient differences.
As can be seen from the figure, when , the distribution of errors is relatively concentrated, indicating that the instantaneous prediction error of the wind power prediction model is relatively small. When , the distribution of errors is scattered, indicating that the instantaneous prediction error fluctuates greatly and the amplitude is also large. However, the error correction unit based on cross-processing cannot adapt to the drastic change in error when it gradually increases, which may increase the instantaneous prediction error of the prediction model. Therefore, it is necessary to analyze , set the initial error threshold to 0% and the value step to 10%, and predict the wind power RMSE of the test set at different thresholds . The results are shown in Figure 10.
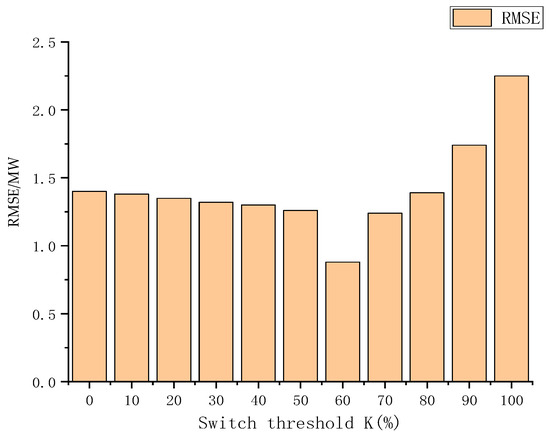
Figure 10.
RMSE for each policy at different thresholds.
When set at = 0% and = 100%, it means that only the deep learning unit and the error correction based on the cross-processing unit are used separately. As can be seen from the evaluation index in the figure above, when RMSE is the lowest, the error threshold is 60%. Therefore, = 60% is used as the adaptive selection threshold of the error correction units; when is greater than threshold , the deep learning error correction unit is selected for correction, and when is less than threshold , the error correction unit based on cross-processing is selected for correction.
In order to verify the error correction effect of the matrix gradient error correction selection strategy under different wind speed fluctuation degrees, it was compared with the prediction model that only used the error correction unit based on cross-processing (Strategy 1) and the prediction model that only used the deep learning error correction unit (Strategy 2). The error value of the wind power prediction of the above strategy is calculated, and the results are shown in Figure 11 and Figure 12.
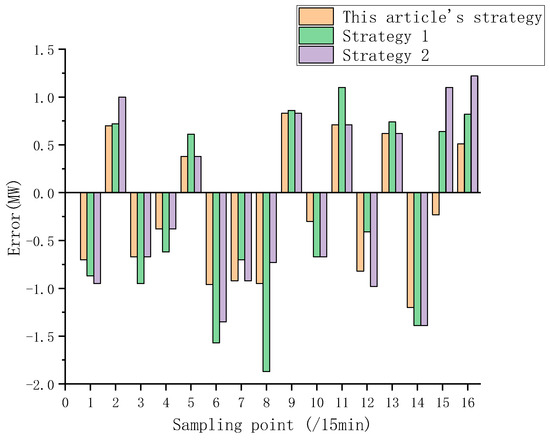
Figure 11.
Comparison of wind power prediction errors by strategy (wind speed fluctuation is flat).
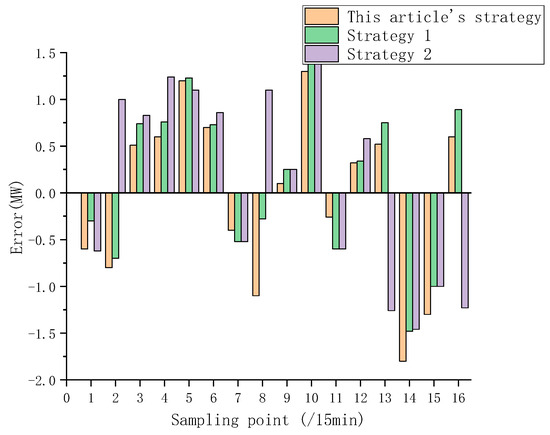
Figure 12.
Comparison of wind power prediction errors by strategy (wind speed fluctuates dramatically).
In order to facilitate the analysis, the effective correction is set to the situation that the prediction error value of the strategy in this paper is lower than that of both strategy 1 and strategy 2. As can be seen from the above figure, when the wind speed fluctuation is relatively flat, the difference between the prediction error values of different strategies is small, and the effective error correction sample accounts for 81.25%. However, when the wind speed fluctuates drastically, the prediction error gap between different strategies gradually increases, and the effective error correction sample accounts for 68.75%. It can be seen that the prediction error of the modified strategy in this paper is smaller than that of the other two strategies under different wind speeds, and the proportion is relatively large, indicating that the correction effect of the proposed strategy is better in the face of different wind speed fluctuations.
In order to verify the ability of the matrix gradient error correction selection strategy to overcome the instantaneous prediction error, the results are shown in Figure 13 and Table 5 by comparing the error correction unit based on cross-processing (strategy 1) and the deep learning error correction unit (strategy 2). It can be seen that strategy 1 cannot capture the temporal characteristics of wind speed fluctuations in the face of severe and frequent wind speed fluctuations in the ultra-short term, resulting in poor ability to overcome instantaneous prediction errors. Compared with strategy 1, strategy 2 can use deep learning to mine the law of wind speed time series change and accurately track the actual wind speed fluctuation change; its ability to overcome the instantaneous prediction error is improved, but strategy 2 is more sensitive to the input data, which will lead to a poor explanatory performance of the model. The MAPE and RMSE of the proposed method in this article are both lower than those of strategy 1 and strategy 2, indicating its superior ability to improve the generalization ability of the prediction model and overcome the instantaneous prediction error.
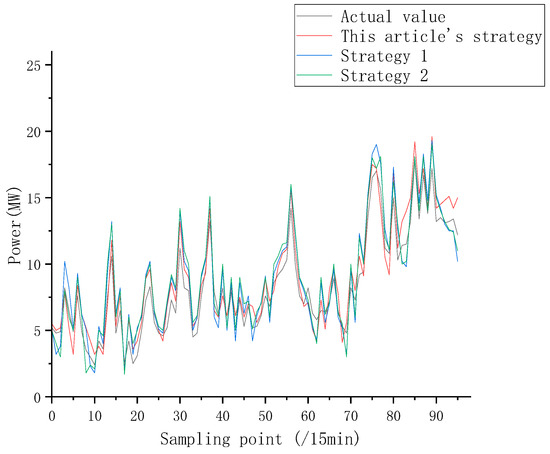
Figure 13.
Comparison of forecasts for different strategies (wind speed fluctuates violently and frequently).

Table 5.
Evaluation indicators for different strategies.
4. Results and Discussion
In order to overcome the ultra-short-term instantaneous prediction error, a PSO parameter optimization spatiotemporal BP neural network prediction model combined with meteorological influencing factors was constructed, and the instantaneous prediction error correction was carried out by the error correction adaptive selection strategy.
- To mitigate the impact of instantaneous prediction errors, a CNN-BPNN prediction model is employed to determine the correlation between instantaneous prediction errors and meteorological factors. The performance of BPNN is optimized using the particle swarm optimization algorithm to adjust initial weights and threshold parameters. Compared with the CNN-LSTM method in Reference [26] and the BPNN method in Reference [20], this method reduces the mean absolute percentage error, root mean square error, and mean absolute error by 48.49%, 45.51%, and 50.8%, respectively, which enhances the model’s capability to overcome ultra-short-term wind power instantaneous prediction errors.
- In order to solve the error caused by the decline in the generalization of the model under strong disturbance, according to the nonlinear correlation between the wind speed, wind direction data, and the instantaneous prediction error, a matrix gradient error correction unit about wind speed and a deep learning error correction unit based on the physical constraints of the prediction error were constructed, and combined with the adaptive selection strategy of the matrix gradient difference, the ability of the model to overcome the ultra-short-term instantaneous prediction error of wind power was further improved.
- The proposed method employs an instantaneous prediction error correction strategy to enable the predicted output to more accurately track the planned curve, enhancing the reliability of wind power participation in new electricity market dispatch, and providing an important basis for wind farms to formulate daily power generation plans and smooth grid fluctuations.
Although this method improves the interpretability of the predictive model, it still has some limitations: 30 days of data are insufficient to cover seasonal variations, which may lead to inadequate model adaptability to extreme seasons; moreover, the single-site validation based solely on wind farm data from East China requires further verification of the model’s applicability in scenarios such as coastal areas and mountainous regions; the hybrid model structure is relatively complex and poses an overfitting risk with small sample sizes, necessitating validation through larger datasets. Therefore, future research directions will primarily address these issues to further enhance the model’s generalizability.
Author Contributions
Conceptualization, R.H.; methodology, J.S.; software, R.H.; validation, R.H. and L.G.; formal analysis, R.H.; investigation, R.H.; resources, J.S.; data curation, R.H.; writing—original draft preparation, R.H.; writing—review and editing, R.H.; visualization, J.S.; supervision, J.S.; project administration, L.G.; funding acquisition, J.S. All authors have read and agreed to the published version of the manuscript.
Funding
This work was supported by the National Natural Science Foundation of China, grant number 52277012.
Data Availability Statement
The original contributions presented in this study are included in the article. Further inquiries can be directed to the corresponding author(s).
Conflicts of Interest
The authors declare no conflicts of interest.
Abbreviations
The following abbreviations are used in this manuscript:
| BPNN | Back Propagation Neural Network |
| CNN | Convolutional Neural Network |
| LSTM | Long Short-Term Memory |
| PSO | Particle Swarm Optimization |
| GWO | Grey Wolf Optimizer |
| SSA | Sparrow Search Algorithm |
| RMSE | Root Mean Square error |
| MAE | Mean Absolute Error |
| MAPE | Mean Absolute Percentage Error |
Appendix A
The formula symbol descriptions are used in this manuscript:

Table A1.
List of formula symbols.
Table A1.
List of formula symbols.
| Formula Symbol | Description |
|---|---|
| The correlation coefficient | |
| The sample rank difference | |
| The predicted result | |
| The network weight value | |
| The network offset | |
| The gradient of the loss function for predicted values | |
| The gradient of loss function for weight values | |
| The gradient of the loss function for the offset value | |
| The result of the convolutional mapping | |
| The sequence number of the input feature | |
| The input feature data | |
| The fitness function | |
| The activation function | |
| The particle position | |
| The matrix gradient |
References
- Li, Y.; He, S.; Xu, Y. Progress in Aviation and Climate Change Research. Adv. Earth Sci. 2024, 39, 1112–1122. [Google Scholar] [CrossRef]
- Li, H.; Liu, D.; Qin, J.; Han, X.; Zhao, P.; Sun, Y.; Sun, Y. Research on Random Programming Method for DC Transmission of New Energy Bases Considering the Uncertainty of Wind and Solar Power Output. Power Syst. Technol. 2024, 48, 2795–2803. [Google Scholar] [CrossRef]
- Yang, C.; Zhang, S.; Wang, X.; Sun, Y.; Zhu, H.; Shen, W. Optimization configuration of pumped storage capacity based on smoothing wind and solar fluctuations. Power Syst. Clean Energy 2023, 39, 140–146. [Google Scholar] [CrossRef]
- Liu, Z.; Wu, X.; Zhou, Z.; Ma, S.; Guo, H.; Wang, Y. Collaborative planning method for wind solar energy storage considering smooth output. Smart Power 2024, 52, 25–32. [Google Scholar] [CrossRef]
- Gao, X.; Li, G. Power fluctuation suppression analysis of wind power generation system based on hybrid energy storage. Elect. Equip. Econ. 2024, 5, 210–212. [Google Scholar] [CrossRef]
- Wu, H.; Sun, R.; Liao, S.; Ke, D.; Xu, J.; Xu, H. Short term wind power probability prediction method based on improved meteorological clustering classification. Autom. Electr. Power Syst. 2022, 46, 56–65. [Google Scholar] [CrossRef]
- Liu, Y.; Yang, M.; Yu, Y.; Li, M.; Wang, B. Wind power prediction for turning weather days based on multi scenario sensitive meteorological factor optimization and small sample learning and expansion. High Volt. Eng. 2023, 49, 2972–2982. [Google Scholar] [CrossRef]
- Zhang, H.; Yue, D.; Dou, C.; Li, K. Two-Step Wind Power Prediction Approach with Improved Complementary Ensemble Empirical Mode Decomposition and Reinforcement Learning. IEEE Syst. J. 2022, 16, 2545–2555. [Google Scholar] [CrossRef]
- Wang, C.; He, Y.; Zhang, H.; Ma, P. Wind power forecasting based on manifold learning and a double-layer SWLSTM model. Energy 2024, 290, 130076. [Google Scholar] [CrossRef]
- Ying, H.; Deng, C.; Xu, Z.; Huang, H.; Deng, W.; Yang, Q. Short-term prediction of wind power based on phase space reconstruction and BiLSTM. Energy Rep. 2023, 9, 474–482. [Google Scholar] [CrossRef]
- Ding, Y.; Chen, Z.; Zhang, H.; Wang, X.; Guo, Y. A short-term wind power prediction model based on CEEMD and WOA-KELM. Renew. Energy 2022, 189, 188–189. [Google Scholar] [CrossRef]
- Sun, Y.; Yang, J.; Zhang, X.; Hou, K.; Hu, J.; Yao, G. An Ultra-Short-Term Wind Power Forecasting Model Based on EMD-EncoderForest-TCN. IEEE Access 2024, 12, 60058–60069. [Google Scholar] [CrossRef]
- Wang, W.; Wei, Y.; Ten, X. Short term wind power prediction based on VMD-SSA-LSSVM. Acta Energy Sol. Sin. 2023, 44, 204–211. [Google Scholar] [CrossRef]
- Li, D.; Li, Y. Ultra short-term wind power prediction based on deep learning and error correction. Acta Energy Sol. Sin. 2021, 42, 200–205. [Google Scholar] [CrossRef]
- Zhao, T.; Xie, L.; Ye, J. Short term wind power prediction based on error correction using NNA-ILSTM. Smart Power 2022, 50, 29–36. [Google Scholar] [CrossRef]
- Yuan, C.; Wang, S.; Sun, Y.; Wu, Y.; Xie, D. Ultra short term wind power prediction based on hybrid feature dual derivation and error correction. Autom. Electr. Power Syst. 2024, 48, 68–76. [Google Scholar] [CrossRef]
- Zhang, G.; Liu, F.; Wang, S.; Li, J. Inertia requirement analysis of frequency stability in high proportion new energy power systems. Proc. CSU-EPSA 2022, 34, 81–87. [Google Scholar] [CrossRef]
- Li, P.; Luo, X.; Meng, Q.; Zhu, M.; Chen, J. Ultra short term load forecasting of user level integrated energy systems based on Spearman correlation threshold optimization and VMD-LSTM. J. Glob. Energy Interconnect. 2024, 7, 406–420. [Google Scholar] [CrossRef]
- Wang, C.; Kou, P.; Wang, R.; Gao, X. Prediction of Wind Speed for Multiple Wind Turbines Using Point Cloud Distribution and Spatiotemporal Correlation at Multiple Spatial Scales. Autom. Electr. Power Syst. 2021, 45, 65–73. [Google Scholar] [CrossRef]
- Chen, L.; Hao, Y.; Li, Q.; Ding, J. Improved SSA optimized BP neural network traffic volume prediction model. J. Harbin Inst. Technol. 2024, 45, 186–199. [Google Scholar] [CrossRef]
- Ni, Y.; Yan, M.; Liu, R. Short term prediction of ionospheric TEC based on DOA-BP neural network. Acta Aeronaut. Astronaut. Sin. 2024, 45, 186–199. [Google Scholar] [CrossRef]
- Han, H.; Xu, Z.; Wang, J. Multi-task and multi-objective particle swarm optimization algorithm based on Q-learning. Contral Decis. 2023, 38, 3039–3047. [Google Scholar] [CrossRef]
- Li, S.; Li, C.; Wu, H.; Fang, Z.; Zhao, H.; Liao, S. Cascade hydropower peak shaving method based on complex constraint normalization processing strategy. Power Syst. Technol. 2023, 47, 3576–3585. [Google Scholar] [CrossRef]
- Feng, X.; Shi, J.; Dai, M.; Liu, L. Design of 5G terminal baseband channel estimation algorithm based on correlation matrix Toeplitz characteristics. Chin. High Technol. Lett. 2025, 35, 9–19. [Google Scholar] [CrossRef]
- Kang, Y.; Liu, X.; Lei, Z. Short term wind power prediction based on robust sparse width learning system. Acta Energy Sol. Sin. 2024, 45, 32–43. [Google Scholar] [CrossRef]
- Zhao, R.; Ding, Y. Wind power prediction based on particle swarm optimization extreme learning machine. J. Shanghai Dianji Univ. 2019, 22, 187–192. [Google Scholar] [CrossRef]
Disclaimer/Publisher’s Note: The statements, opinions and data contained in all publications are solely those of the individual author(s) and contributor(s) and not of MDPI and/or the editor(s). MDPI and/or the editor(s) disclaim responsibility for any injury to people or property resulting from any ideas, methods, instructions or products referred to in the content. |
© 2025 by the authors. Licensee MDPI, Basel, Switzerland. This article is an open access article distributed under the terms and conditions of the Creative Commons Attribution (CC BY) license (https://creativecommons.org/licenses/by/4.0/).