Article

Integrating Acheta domesticus into Cocoa Cream Products: Nutritional Enhancement and Impact on Technological Properties

1
Faculty of Technology Novi Sad, University of Novi Sad, Bulevar cara Lazara 1, 21000 Novi Sad, Serbia
2
Innovation Centre of the Faculty of Technology and Metallurgy, University of Belgrade, Karnegijeva 4, 11120 Belgrade, Serbia
3
Faculty of Food Technology Osijek, Josip Juraj Strossmayer University of Osijek, Franje Kuhača 20, 31000 Osijek, Croatia
4
Institute of Food Science and Technology, Hungarian University of Agriculture and Life Sciences, Villányi út 29-43, H-1118 Budapest, Hungary
*
Author to whom correspondence should be addressed.
Processes 2025, 13(10), 3162; https://doi.org/10.3390/pr13103162 (registering DOI)
Submission received: 30 August 2025 / Revised: 30 September 2025 / Accepted: 1 October 2025 / Published: 4 October 2025
(This article belongs to the Special Issue Advances in the Design, Analysis and Evaluation of Functional Foods)

Abstract

Over the past few decades, people have become increasingly aware of how the ingredients in their food affect their health, leading to significant changes in dietary habits. A notable trend is the growing demand for high-protein foods. However, as consumption of high-protein products increases, manufacturers face challenges in sourcing enough protein to meet this rising demand. One promising alternative is insect protein, which has attracted considerable attention in recent years due to its high nutritional value, with Acheta domesticus protein containing up to 80% protein per gram. To explore this potential, this study was conducted to investigate the effects of integrating different concentrations (10%, 12.5%, and 15%) of Acheta domesticus protein powder into cocoa cream products. The study’s findings indicated that incorporation of Acheta Domesticus protein resulted in a limited alteration in the particle size distribution of the cocoa cream, while sensory evaluations confirmed the absence of a gritty texture. In addition to sensory analysis, the study examined chemical composition, rheological properties, texture, color, and thermal characteristics. These results were compared with a control sample. The findings of this study indicate that the samples with 12.5 and 15% of the added protein can claim a nutritional statement “source of protein”.

Graphical Abstract

1. Introduction

Significant changes in human lifestyle and dietary habits have occurred over the past decade, reflected in a growing demand for foods that promote muscle development and overall health [1]. Products enhanced with proteins, phenolic compounds, or other functional ingredients satisfy the market trends set by consumers for foods with various functionalities besides nutritional value.
Protein-enriched foods quickly emerged as one of the fastest-growing product categories targeting image- and health-conscious consumers [2]. Proteins derived from animals, and recently plants, are commonly used to enrich a wide variety of food products. The investigation of proteins from plants and other alternative sources has been driven by the rapid growth of protein-fortified food production [3]. Increasing attention is being paid to the amount and origin of protein in consumers’ diets, as these choices are now recognized as critical factors for the global environment and the pursuit of a more sustainable future [4,5]. Thus, alternative proteins derived from plants, microalgae, and especially insects have gained more interest in recent years [6]. Insect farming has become a focal point as a result of more favorable conditions such as less need for land and feed compared to the conditions required for livestock production [7]. For example, to produce 1kg of animal protein, it is necessary to ensure 200 m2 of land and 15,400 L of water for livestock. In contrast, for insect breeding, for the same amount of protein, these values are significantly lower (15 m2 and 15.4 L, respectively), indicating the cheaper cost of this production. More importantly, the values for greenhouse gas emissions (GHG) for insect breeding are 1.84-fold smaller for CO2 and 22.8-fold smaller for CH4 emissions. Additionally, ammonia release for insect farming was 5.4 mg which is 31.5-fold lower than for livestock breeding (170 mg) [7,8,9]. This data potentially makes insect breeding more environmentally friendly.
In many Asian, Latin American, Oceanian, and African countries, insects are accepted and consumed as food intended for humans [10]. Since 2003, the Food and Agriculture Organization (FAO) has officially recognized insects as a viable food source and is actively encouraging entomophagy because of the potential for environmentally friendly food production [7,11]. However, despite nearly 2000 edible insect species cataloged to this day [7], there is not sufficient data about their nutritional profile. This gap can be explained by the influence of the different factors such as the species of the insect, the stage of the development, feed origin, and the season and location in which breeding occurs [12]. Generally, insects are considered as a food rich in protein (40–80%), minerals (Ca, Zn, and Fe), and vitamins [13]. Since the insect’s amino acid composition is very similar to beef, insects can potentially serve as an alternative to conventional meats like pork, beef, and chicken [14,15]. The most commonly consumed insects as a source of protein are Acheta domesticus, Tenebrio molitor, Ruspolia differens, Spodoptera littoralis, and many more [7].
Acheta domesticus, also known as house cricket, is a commonly consumed insect in the human diet, recognized for its high digestibility. It is rich in protein (more than 60%), and contains significant amounts of palmitic and stearic acids, but is especially rich in unsaturated fatty acids, such as oleic and linoleic acids. These nutritional qualities make it an adequate additive to enrich cocoa cream—a product low in protein and high in hydrogenated fat [16,17].
This study aimed to develop a functional cocoa cream product by incorporating different concentrations of Acheta domesticus protein powder (10, 12.5, and 15%). Additionally, the main objective of this study was to determine the influence of the added protein powder on technological parameters of produced cocoa cream samples such as particle size distribution, rheological, and thermal and textural properties. Finally, color and sensory analyses were conducted in order to determine the consumer acceptance of enriched cocoa cream samples.

2. Materials and Methods

2.1. Materials

The materials used for preparation of control cocoa cream sample (C) included powdered sugar (purchased from “Jaffa”, Crvenka, Serbia), partially hydrogenated MKP vegetable fat (donated from “Dijamant”, Zrenjanin, Serbia), cocoa and milk powder (donated from “Pionir”, Subotica, Serbia), and sunflower lecithin (produced in “Sojaprotein”, Bečej, Serbia). The enrichment of cocoa cream samples included the addition of Acheta domesticus protein powder with a minimum of 75% of protein (purchased from Thailand Unique, Udon Thani, Southeast Asia).

2.2. Preparation of Cocoa Cream Samples

Cocoa samples were formulated using a laboratory ball mill with the maximum capacity of 5 kg. The produced batch weighed 3 kg. The production conditions were 40 ˚C at maximum speed of the mixture for 1.5 h. The control sample was developed from 10% of each compound—milk and cocoa powder; 30% MKP fat; and 50% powdered sugar. Additionally, sunflower lecithin was added as an emulsifier (0.5%), along with vanillin (0.04%). Enhanced samples were produced following the same procedure as the control, but with the incorporation of 10%, 12.5%, and 15% Acheta domesticus powder, aiming to obtain products that could be classified as a source of protein. Fortified samples were labeled according to the addition of protein powder as CP10, CP12.5, and CP15.

2.3. Chemical Composition of Cocoa Cream Samples

The chemical composition of chocolate was analyzed by determining the contents of moisture, protein, total fat, ash, and dietary fiber using standard AOAC methods (931.04, 939.02, 963.15, 930.22, and 985.29, respectively) [18]. The results were expressed as g/100 g. The non-fiber carbohydrate content was calculated using the following equation [19]:
%   C a r b o h y d r a t e = 100 ( %   m o i s t u r e + %   p r o t e i n + %   f a t + %   a s h + %   f i b e r   c o n t e n t )
The energy value (kJ/100 g) was determined by multiplying the contents of protein and carbohydrates by 17 kJ/100 g, dietary fiber by 8 kJ/100 g, and fat by 37 kJ/100 g.

2.4. Particle Size Distribution of Protein and Cocoa Cream Samples

The particle size distribution of protein powder and cocoa cream samples was determined using the Mastersizer 2000 laser diffraction particle size analyzer (Malvern Instruments, Malvern, UK). This piece of equipment was used for analyzing particle size in the protein powder (CP), control sample (C), and enhanced cocoa spreads (CP10, CP12.5, and CP15). The Hydro 2000 μP unit was used for the dispersion of C, CP10, CP12.5, and CP15 in the sunflower oil, while the Scirocco unit was used for dispersing CP in the air. The gathered results were presented as a volume-based particle size distribution by means of the Mastersizer 2000 software (version number 5.60, Malvern, UK) and described by the following parameters: volume mean diameter D[4,3] and parameters d(0,1), d(0,5), d(0,9), which represent the particle sizes where 10, 50, or 90% of the total particle volume included particles that are smaller than that size. Particles of the protein powder were measured by dispersing the powder in the air, and the dry, solid particles of protein were measured. On the other hand, fortified and control cocoa cream products were measured by dispersing each sample in sunflower oil and measuring the size distribution of solid particles.

2.5. Rheological Properties of Cocoa Spread Samples

Rheological properties were determined by applying the method of hysteresis loop at the temperature of 40 ± 1 °C [20]. For this method, concentric cylinder system was used with a sensor Z20 din. The equipment used for this method was Rheo Stress 600 (Haake, Karlsruhe, Germany). Using this method, the shear rate was gradually increased from 0 s−1 to 60 s−1 during the 180 s, maintained constant for 60 s at 60 s−1, and then decreased back to 0 s−1 within 180 s.

2.6. Thermal Properties of Cocoa Spreads

Melting behavior was analyzed using a DSC Q100 (TA Instruments). About 5 mg of each sample was sealed in aluminum pans and heated from 10 to 50 °C at 5 °C/min, with an empty pan as reference. The onset temperature (Tonset), peak maximum (Tpeak), conclusion temperature (Tend), and melting enthalpy (Hmelt) were determined by using the instrument’s data analysis software (version number V5.7.0, TA Instruments, New Castle, DE, USA) [21].

2.7. Textural Properties of Cocoa Spreads

Textural properties were measured using a Texture Analyzer TA.XT Plus (Stable Micro Systems, Godalming, UK) at 21 ± 1 °C following the Chocolate Spread–SPRD2_SR_PRJ method (Stable Micro Systems software, version 4.0.13.0, Godalming, UK). Samples were placed in a cone holder, leveled, and tested with a 45° cone probe (wide 38 mm) penetrating at 3 mm/s. The peak force (kg), representing firmness at the defined penetration depth, was recorded [22].

2.8. Color Analysis

Surface color of cocoa cream samples was measured with a MINOLTA Chroma Meter CR-400 (Minolta Co., Ltd., Osaka, Japan) using D65 illumination, a 2* standard observer angle, and an 8 mm aperture. Measurements were taken at five spots and the mean value was recorded. The instrument was calibrated with a Minolta calibration plate (No. 11333090; Y = 92.9, x = 0.3159, y = 0.3322). Color was expressed in CIELab coordinates: L* (lightness), a* (red–green), and b* (yellow–blue) [23].

2.9. Sensory Evaluation

The sensory evaluation panel consisted of 11 trained assessors (6 women and 5 men), all with backgrounds in food technology. Panelists were recruited following ISO 8586:2012 guidelines [24]. The study was approved by the Ethical Committee (020-80/20) and conducted in accordance with the Declaration of Helsinki (1975, revised 2013). Participation was voluntary, written consent was obtained, and the confidentiality of all data was ensured.
In consultation with the panel leader, a preliminary assessment of four cocoa spread samples with distinct sensory characteristics was carried out. Based on group consensus, a list of relevant attributes was established to describe the sensory profiles. Evaluation forms were then developed, including definitions of each attribute with corresponding minimum and maximum intensity limits.
Panelists evaluated the samples, using a 7-point scale, for the following attributes: color uniformity (1 = extremely bright, 7 = extremely dark), gloss (1 = matte, 7 = extremely glossy), hardness (1 = very soft, 7 = very hard), spreadability (1 = extremely bad, 7 = extremely good), graininess (1 = grainy, 7 = smooth), melting behavior (1 = melts quickly, 7 = melts slowly), cocoa flavor (1 = weakly expressed, 7 = strongly expressed), cocoa aroma (1 = absent, 7 = strongly expressed), cocoa taste (1 = absent, 7 = strongly expressed), protein aroma (1 = absent, 7 = strongly expressed), and protein taste (1 = absent, 7 = strongly expressed).
The tests were conducted in the sensory laboratory at the Faculty of Technology Novi Sad. The cocoa spread samples were served at 21 °C on three-digit-numbered plastic cups in individual cabinets illuminated with white light (color temperature: 6500 K), designed in accordance with ISO 8589 [25]. Mineral water at room temperature was served between sample servings as taste neutralizer. The average scores for each sample and attribute were calculated.

2.10. Statistical Analysis

Each experiment was carried out in three repetitions, while the sensory assessment was conducted with 11 panelists. Statistical evaluation of the data was performed using one-way ANOVA, and mean differences were further examined with Duncan’s post hoc test at a 5% significance level, applying Statistica 13.3 software (TIBCO Software Inc., Palo Alto, CA, USA, 2016).

3. Results and Discussion

3.1. Chemical Composition

The chemical composition of the examined samples is presented in Table 1. As expected, the addition of CP significantly increased the protein content (p ≤ 0.05), with a noticeable change observed in all other components as well. In contrast, an opposite effect was observed for fat and cabohydrate content; higher levels of protein addition led to a significant (p ≥ 0.05) reduction in the fat and carbohydrate fraction among the samples compared to the control sample.
With the higher addition of the protein, it was noticed that the energy value decreased. However, samples CP12.5 and CP15 were not significantly (p ≥ 0.05) different when compared. According to the Legislative of Republic of Serbia’s regulation on nutrition and health claims regarding nutritional statements, a product where at least 12% of the total energy value comes from a protein can state that it is a ‘’source of protein’’ [26]. In the CP sample, protein contributes 11.88% of the total energy value, while this value in CP12.5 and CP15 was above 12%. Therefore, CP12.5 and CP15 can claim the nutritional statement ‘’a source of a protein’’.

3.2. Particle Size Distribution

Particle size distribution (PSD) is crucial for rheological properties and directly influences the sensory profile. The largest particles d(0,9) are important for mouth-feel, notably grittiness, but smaller particles are responsible for flow properties [27]. Prior to sensory evaluation, it is important to determine the particle size distribution in the samples to assess whether the addition of Acheta domesticus protein powder (CP) affects particle diameter in the enriched samples. Additionally, by comparing the enriched samples (CP10, CP12.5, CP15) with the control (C) and after analyzing the results, the authors can predict whether the gritty feeling would occur or not after consumption. However, this prediction still requires confirmation through sensory evaluation. Based on these considerations, the results for CP, C, and enriched samples (CP10, CP12.5, and CP15) were analyzed and the results are presented in Figure 1 and Table 2.
It is generally desirable for particles to remain within the range of 15–30 µm to prevent a gritty sensation during consumption [28]. Taking into account the previous statement, it is noticeable from Table 1 that CP had D[4,3] higher values than this interval (50.06 µm), indicating a potential risk of grittiness.
The addition of all concentrations of protein into the cocoa cream product significantly (p ≤ 0.05) increased the values of particle size parameters d(0.5), d(0.9), and D[4,3] of enriched chocolates, which also showed significant differences (p ≤ 0.05) when compared to each other. The enhancement of cocoa cream samples in different concentrations (10, 12.5 and 15) significantly (p ≤ 0.05) increased the value of parameter D[4,3] to the values of 21.60, 24.86, and 26.86, respectively, compared to the control sample (16.15 µm). However, this increase did not surpass the optimal interval (15–30 μm), which provides the appropriate rheological and sensory characteristics of chocolate and cocoa-related products. In other studies [22,29], the addition of different proteins (hydrolizated and non-hydrolizated) also influenced the distribution of the particles in the food matrix by increasing or decreasing it, depending on the PSD of the enrichment compound. In these studies, PSD was in the optimal interval, without the presence of a sandy mouthfeel.

3.3. Rheological and Textural Properties

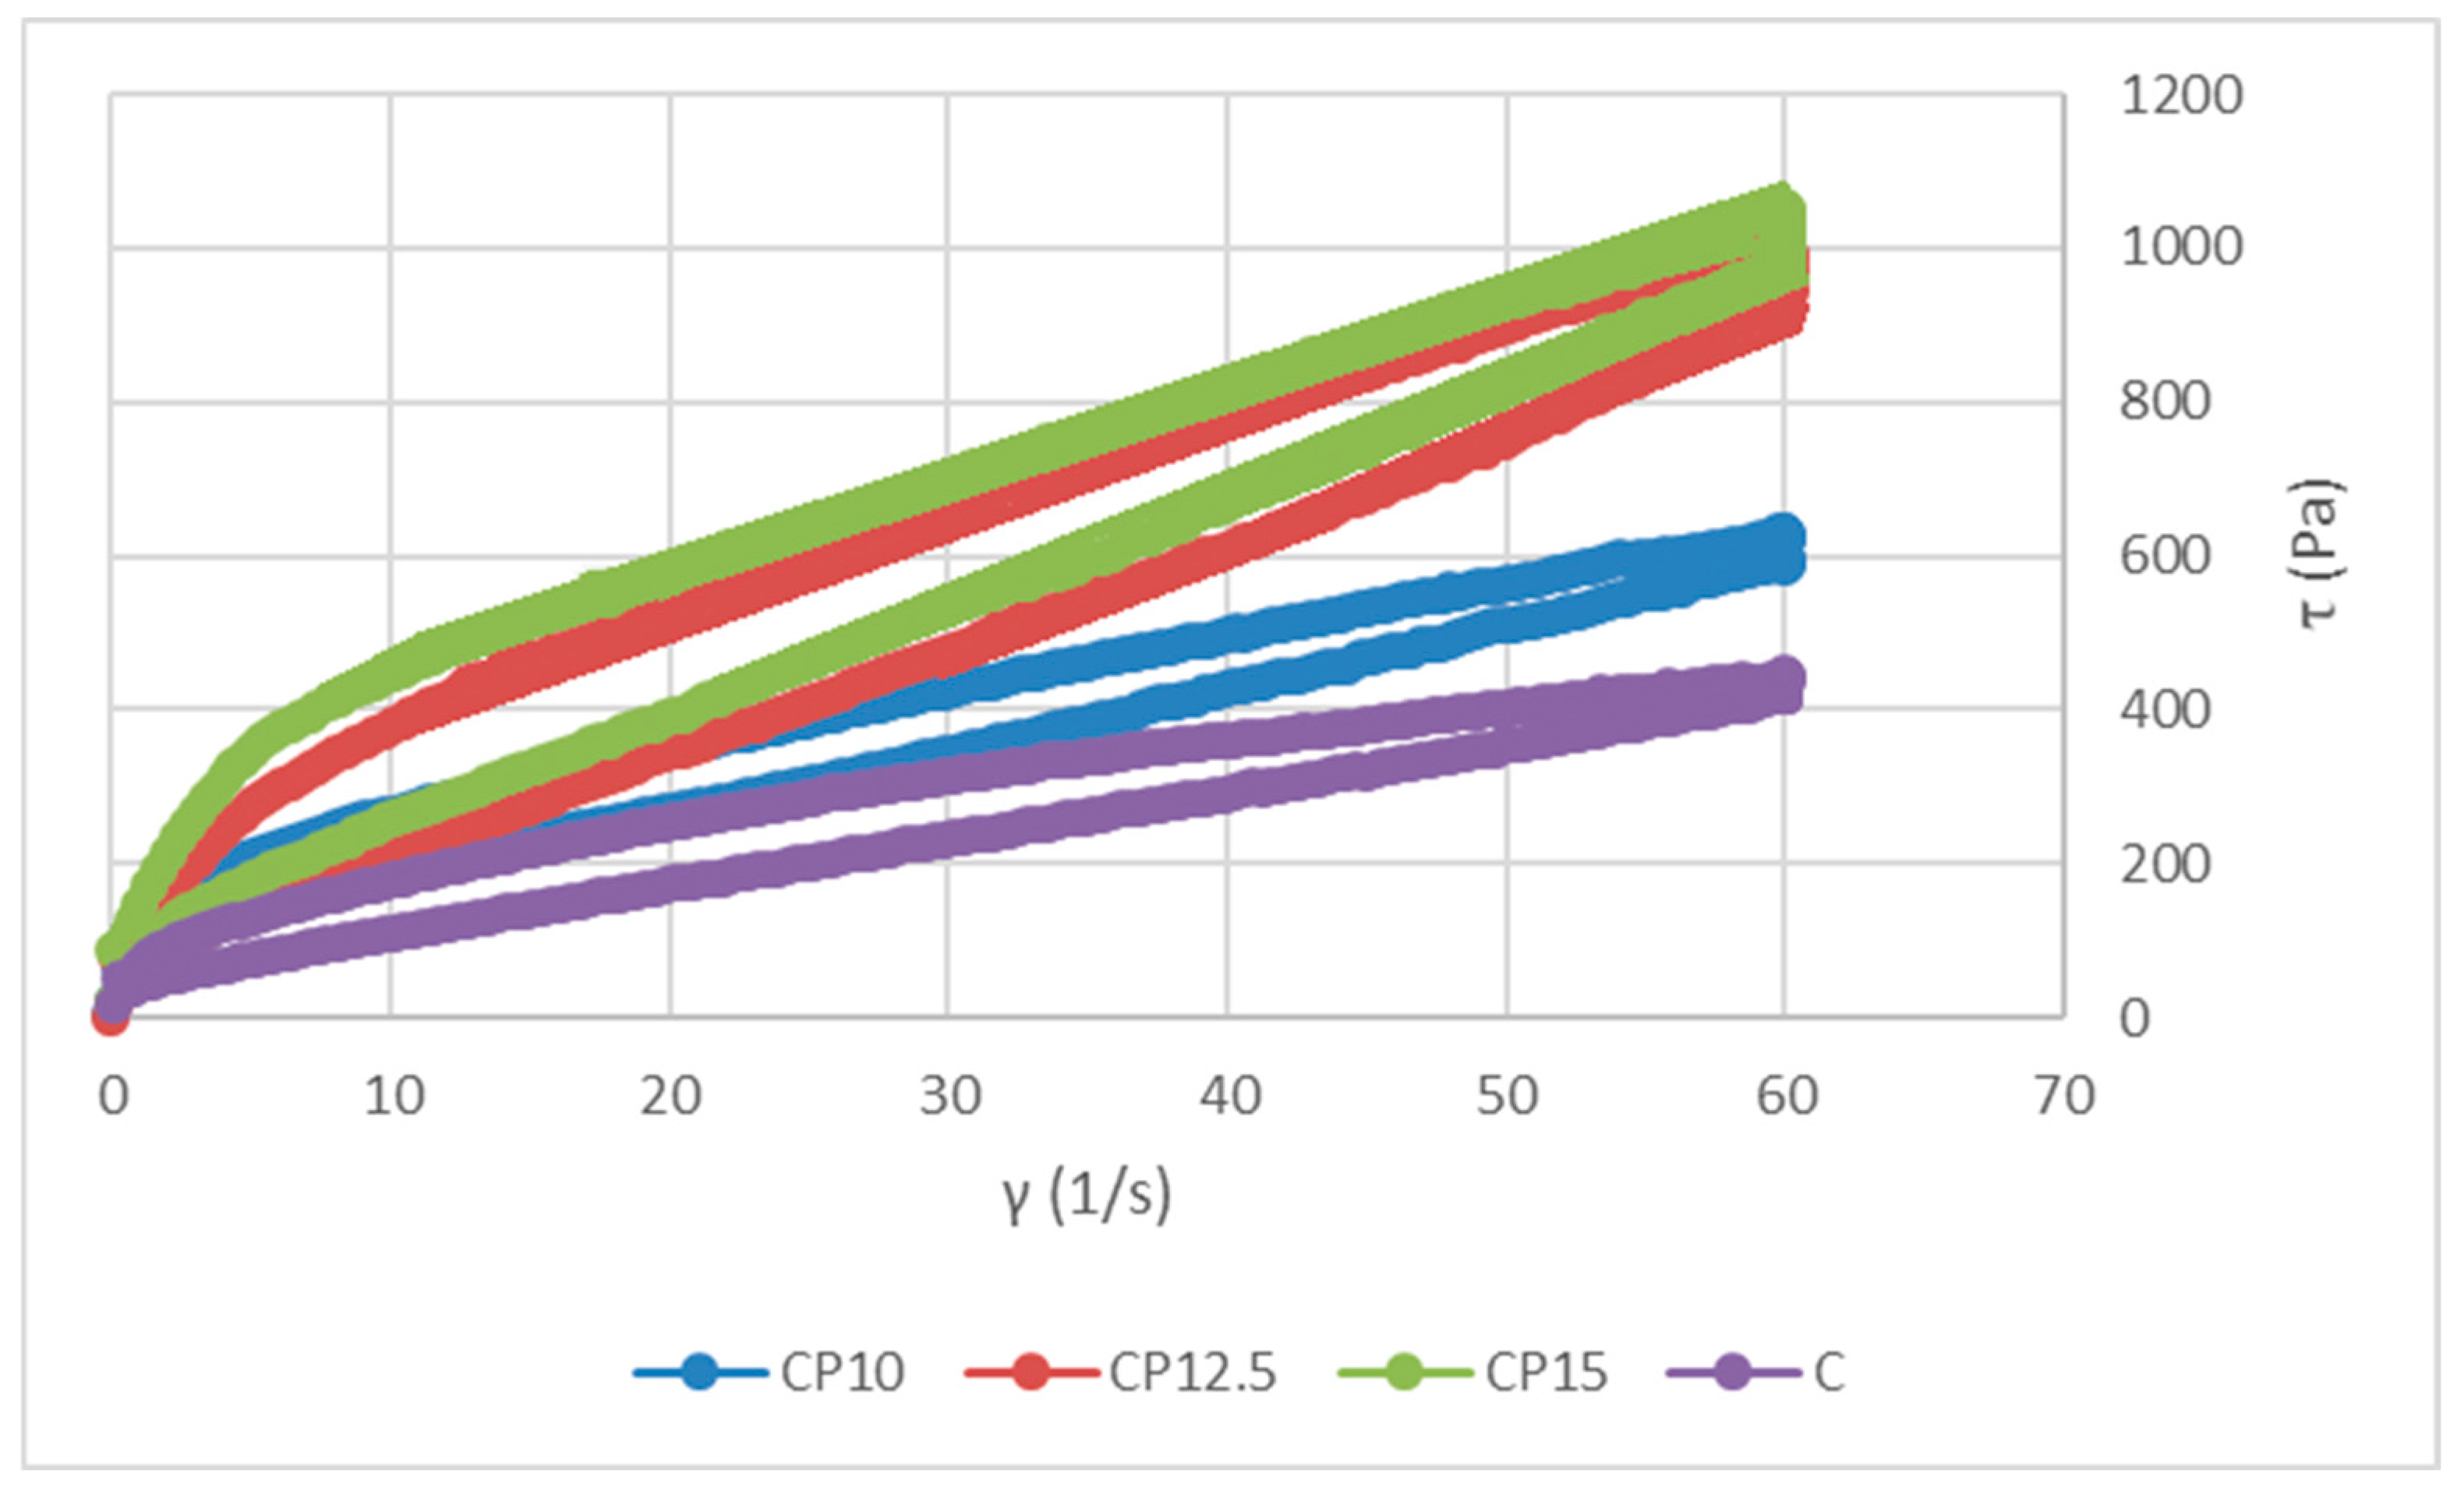
Besides the PSD, rheological properties are one of the most important parameters from the industry point of view. All samples exhibited thixotropic behavior with the increase in viscosity in accordance with added concentration of protein powder. The highest viscosity was observed in CP15 sample, while the lowest value was noticed in the control sample (Figure 2). The obtained flow curves were used to determine the rheological parameters such as Casson viscosity (Pa*s) and yield stress (Pa), as presented in Table 3. The rise in viscosity with the addition of fine particles that increase the PSD were in agreement with several studies [30,31,32]. The addition of protein as solid particles also decreased the fat content present in the cocoa cream matrix. This directly impacted the viscosity by increasing it following the added concentration of the protein powder [33]. The previously described phenomenon occurs as a result of interactions between the solid particles in the matrix [34].
Regarding this, the values of Casson viscosity were significantly different (p ≤ 0.05) among the samples. Additionally, the yield stress showed no significant difference (p ≥ 0.05) between CP12.5 and CP15, although these samples had significantly (p ≤ 0.05) lower values compared to C and CP10.
Hardness is often used as a parameter of a textural quality of produced food products [35]. The results obtained indicate that the hardness of the samples gradually increased (p ≤ 0.05) with the addition of the solid particles, particularly CP, with the highest value present for CP15 (2920 kg), and the lowest being present in the C sample (2.260 kg).

3.4. Thermal Properties

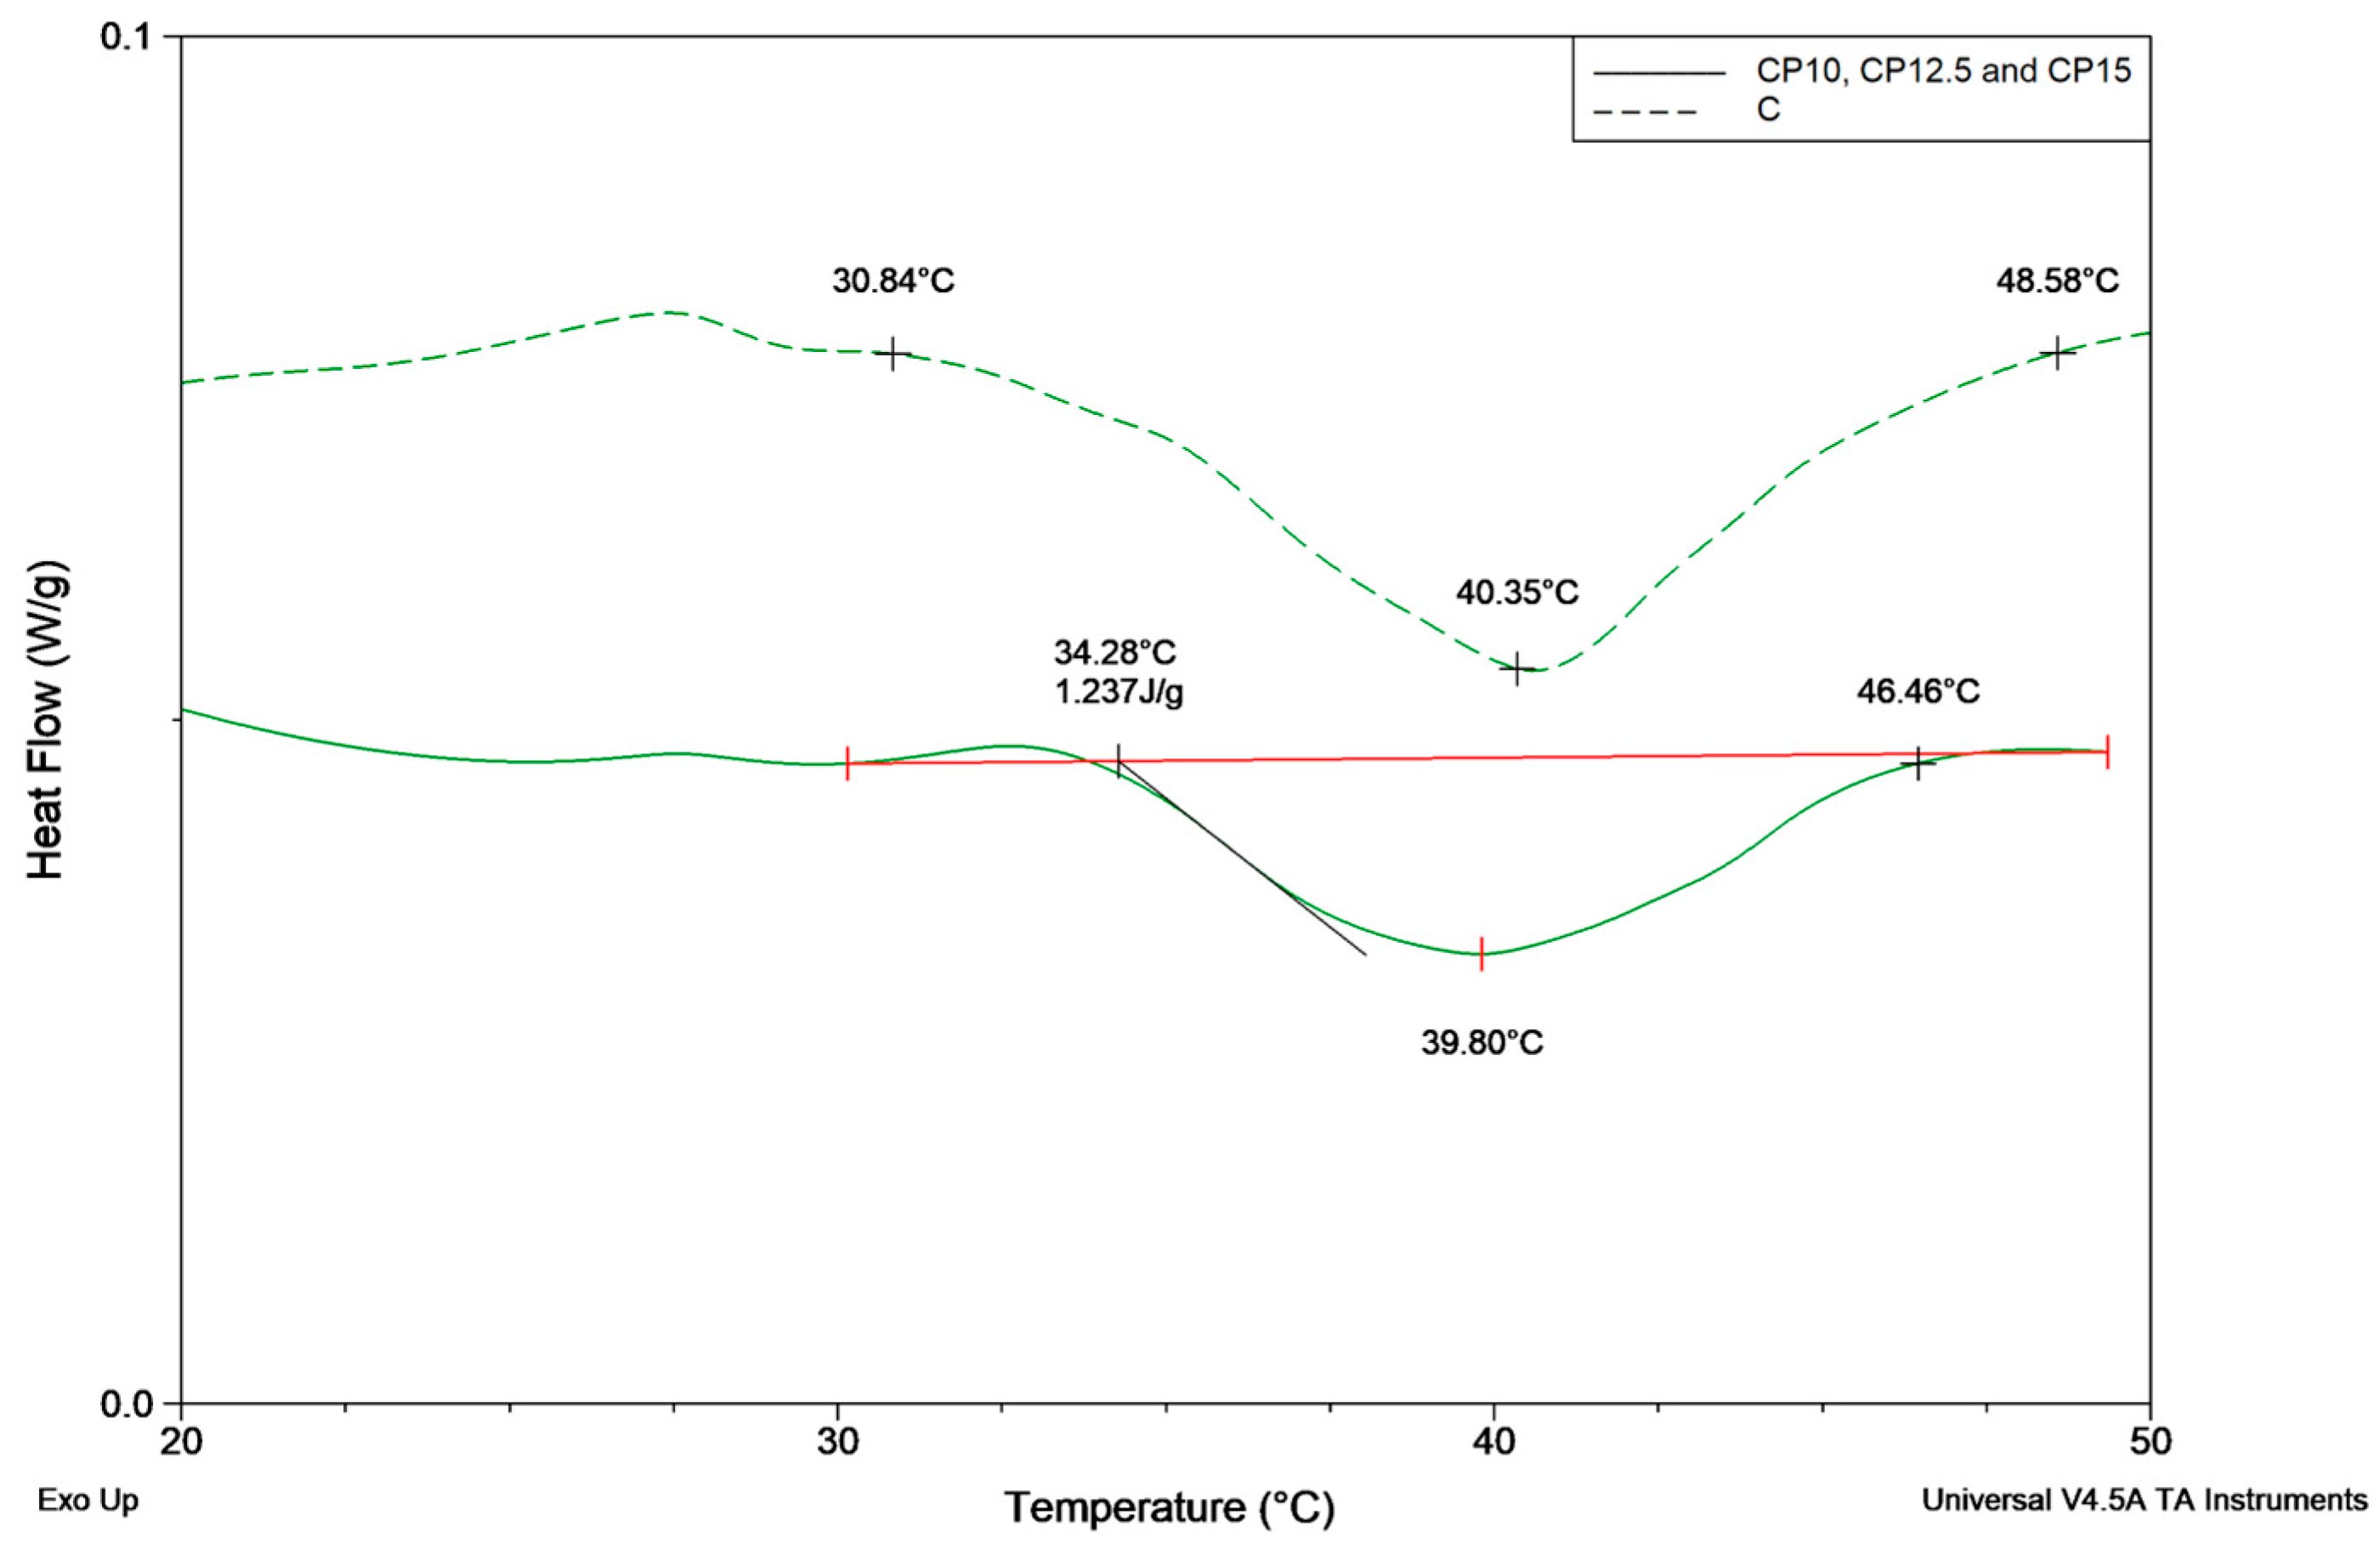
Apart from particle size distribution and rheological assessments, differential scanning calorimetry (DSC) has been employed to investigate the melting properties of cocoa spreads manufactured with the addition of the protein at varying the concentration [27]. The DSC parameters—onset temperature (Tonset), peak temperature (Tpeak), and end temperature (Tend)—are shown in Figure 3.
The addition of the protein powder significantly (p ≤ 0.05) changed the melting properties of the cocoa spreads by increasing the Tonset from 30.48 °C to 34.28 °C. Additionally, noticeable changes were observed in other parameters without a significant decrease in Tpeak (from 40.35 to 39.80 °C). The value for Tend significantly decreased (from 48.58 to 46.46 °C). However, further increases in protein concentration did not affect the melting parameters, instead producing a curve fitting effect. In another study [36], with whey used as a protein-based carrier for phenol compounds, used for fortifying white chocolate, the addition of the capsules did not significantly (p ≥ 0.05) impact the melting properties. This can probably be explained by the small amount of the compound added into the white chocolate.

3.5. Color and Sensory Analysis

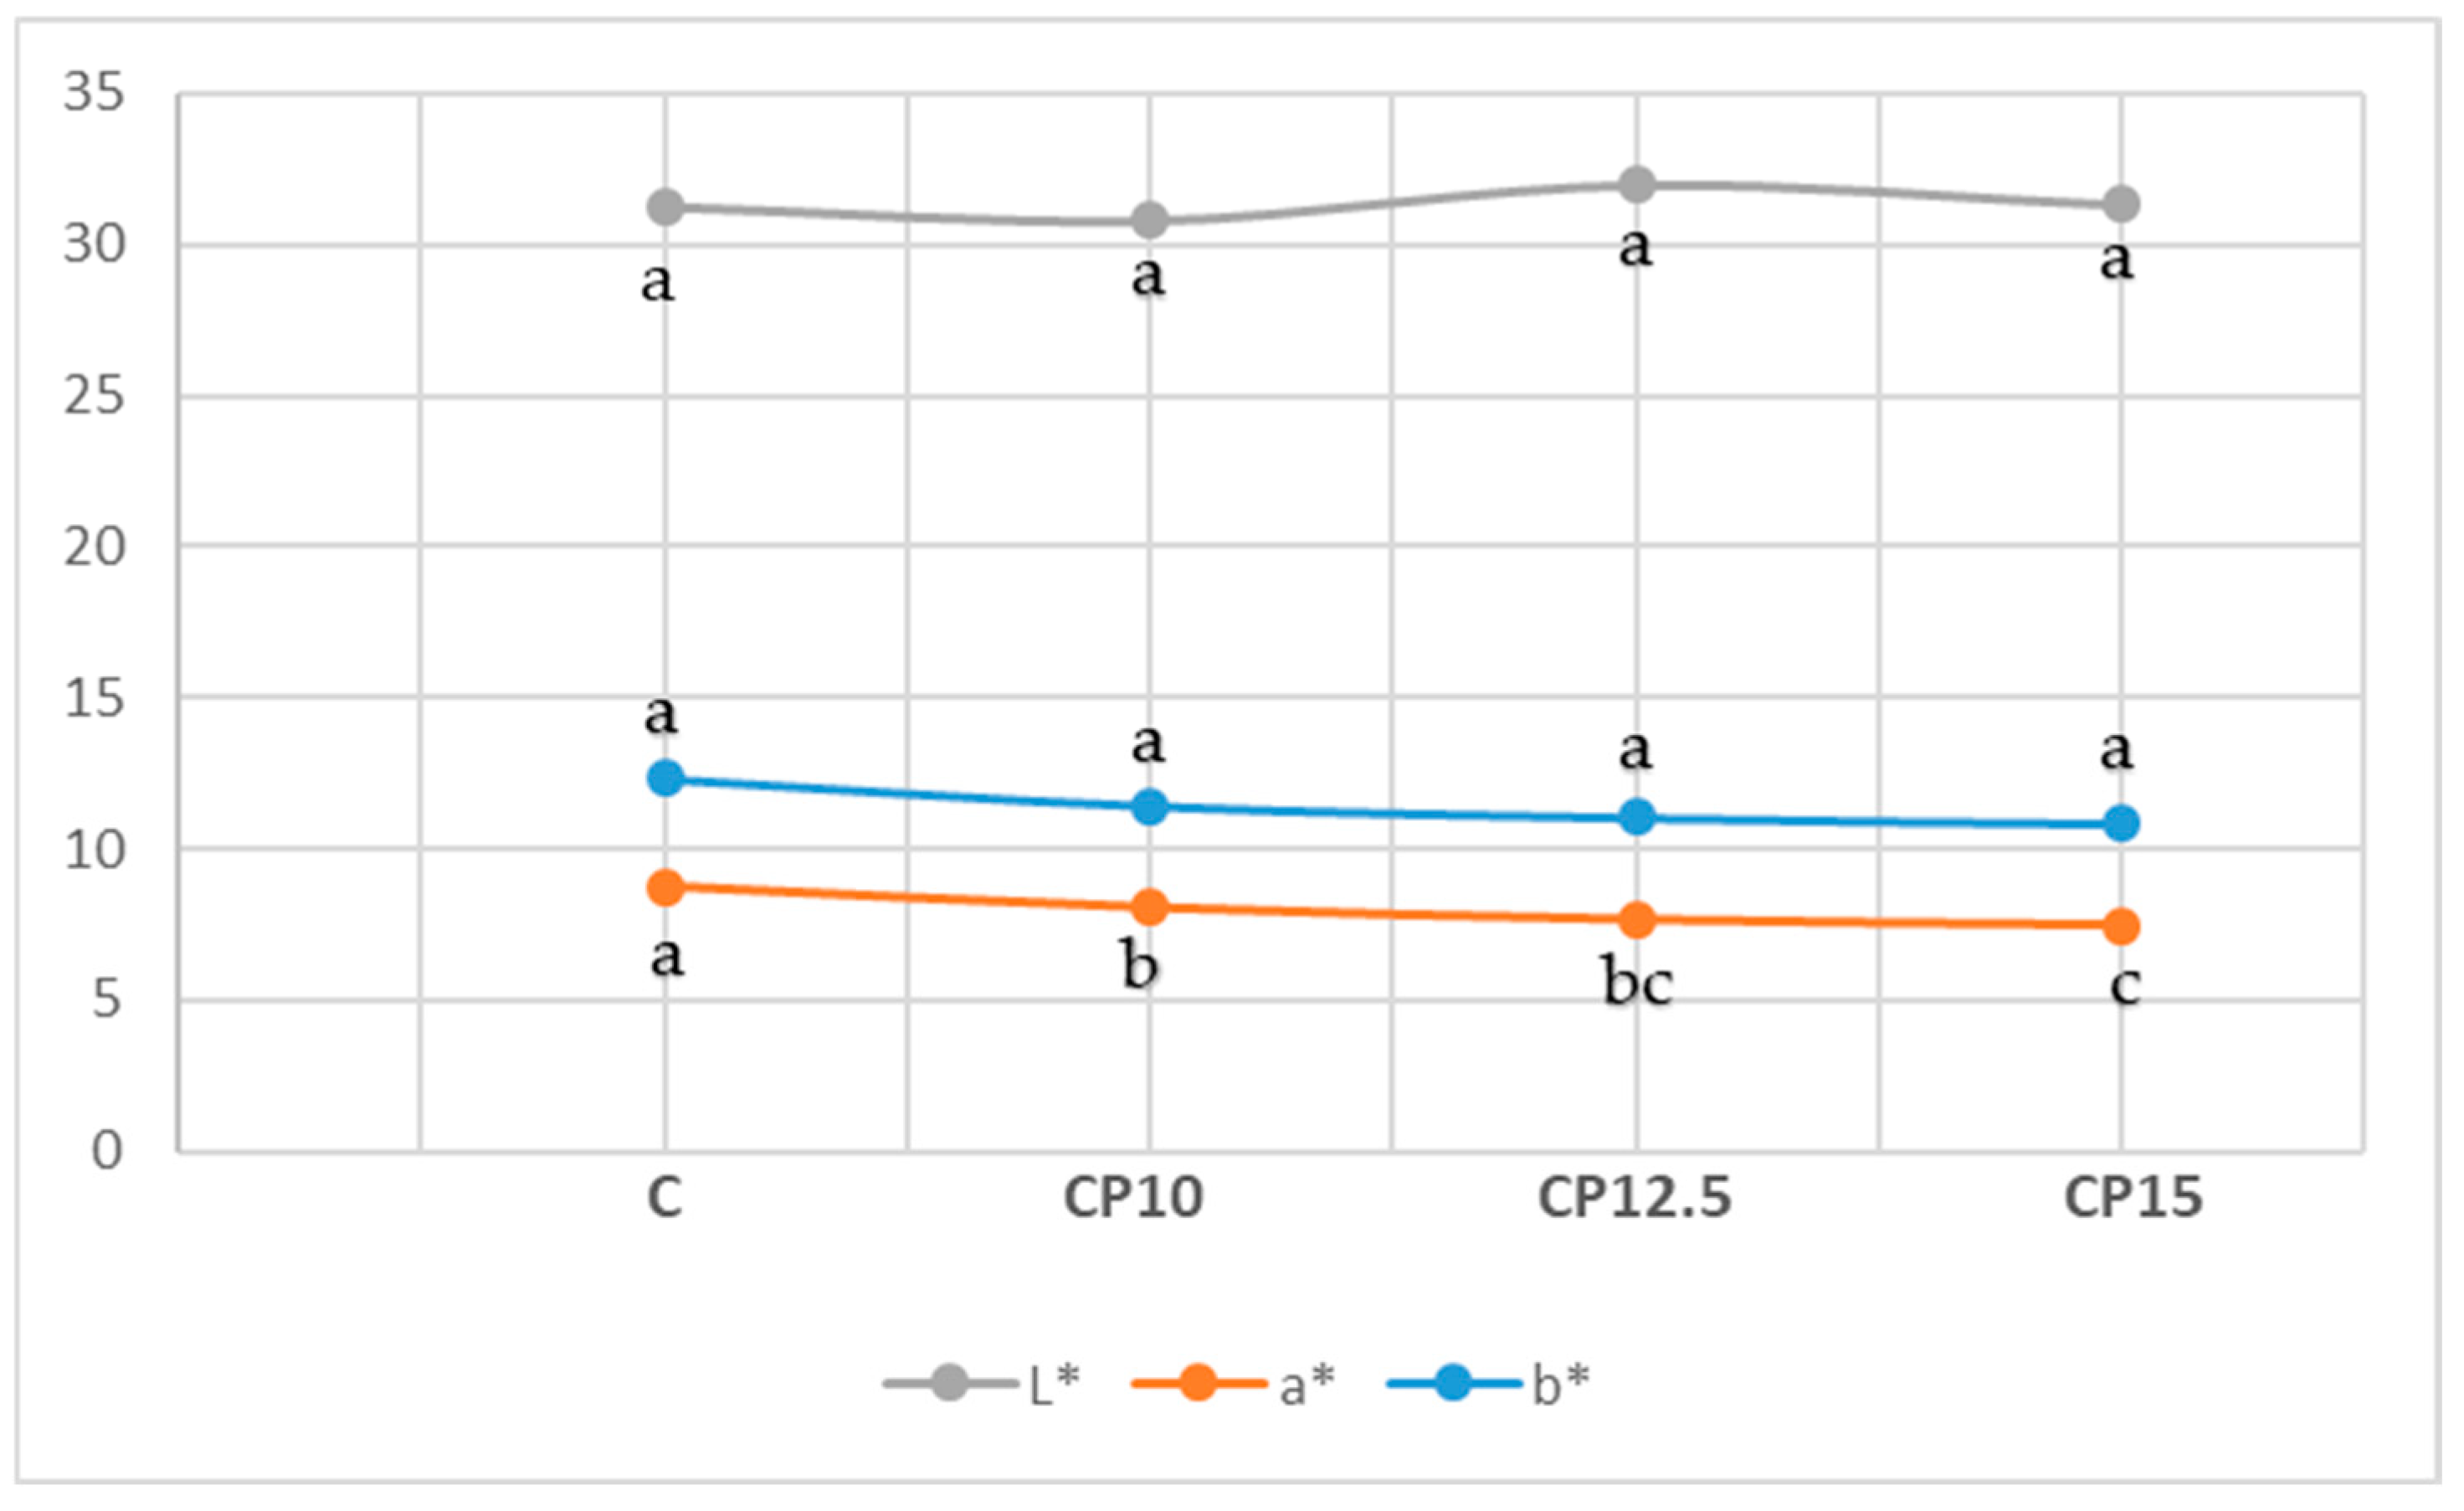
Consumer acceptance of appearance, color, and other sensory attributes is a key objective during the development of new products. After reviewing the literature, the six roles of product appearance to consumers were recognized: conveying esthetics, symbolism, function, ergonomics, attracting attention, and aiding categorization. Product appearance can signal quality, usability, and functional value; influence attention; and shape how easily a product is categorized. Consumer choice can be influenced by the color or appearance of developed food [37,38]. The results the analysis conducted regarding the color and sensory attributes are presented in Figure 4 and Figure 5, respectively. The CP, naturally brownish, did not significantly change (p ≥ 0.05) the overall color of the fortified cocoa cream products. In Figure 4, it is noticeable that the L* parameter, responsible for the lightness, was not significantly different (p ≥ 0.05) among the samples. The same trend was present for the b*, responsible for the red to green tone. On the other hand, evident changes (p ≤ 0.05) were present for the a*, in charge of the yellow to blue tone of the samples. According to the results, the highest value was observed for the C sample (8.75 ± 0.18). Higher enrichment led to a decrease in the value for a*, from 8.05 to 7.47 for CP10 and CP15, respectively. This indicates that the addition of CP decreases the yellow and increases the presence of a blue tone.
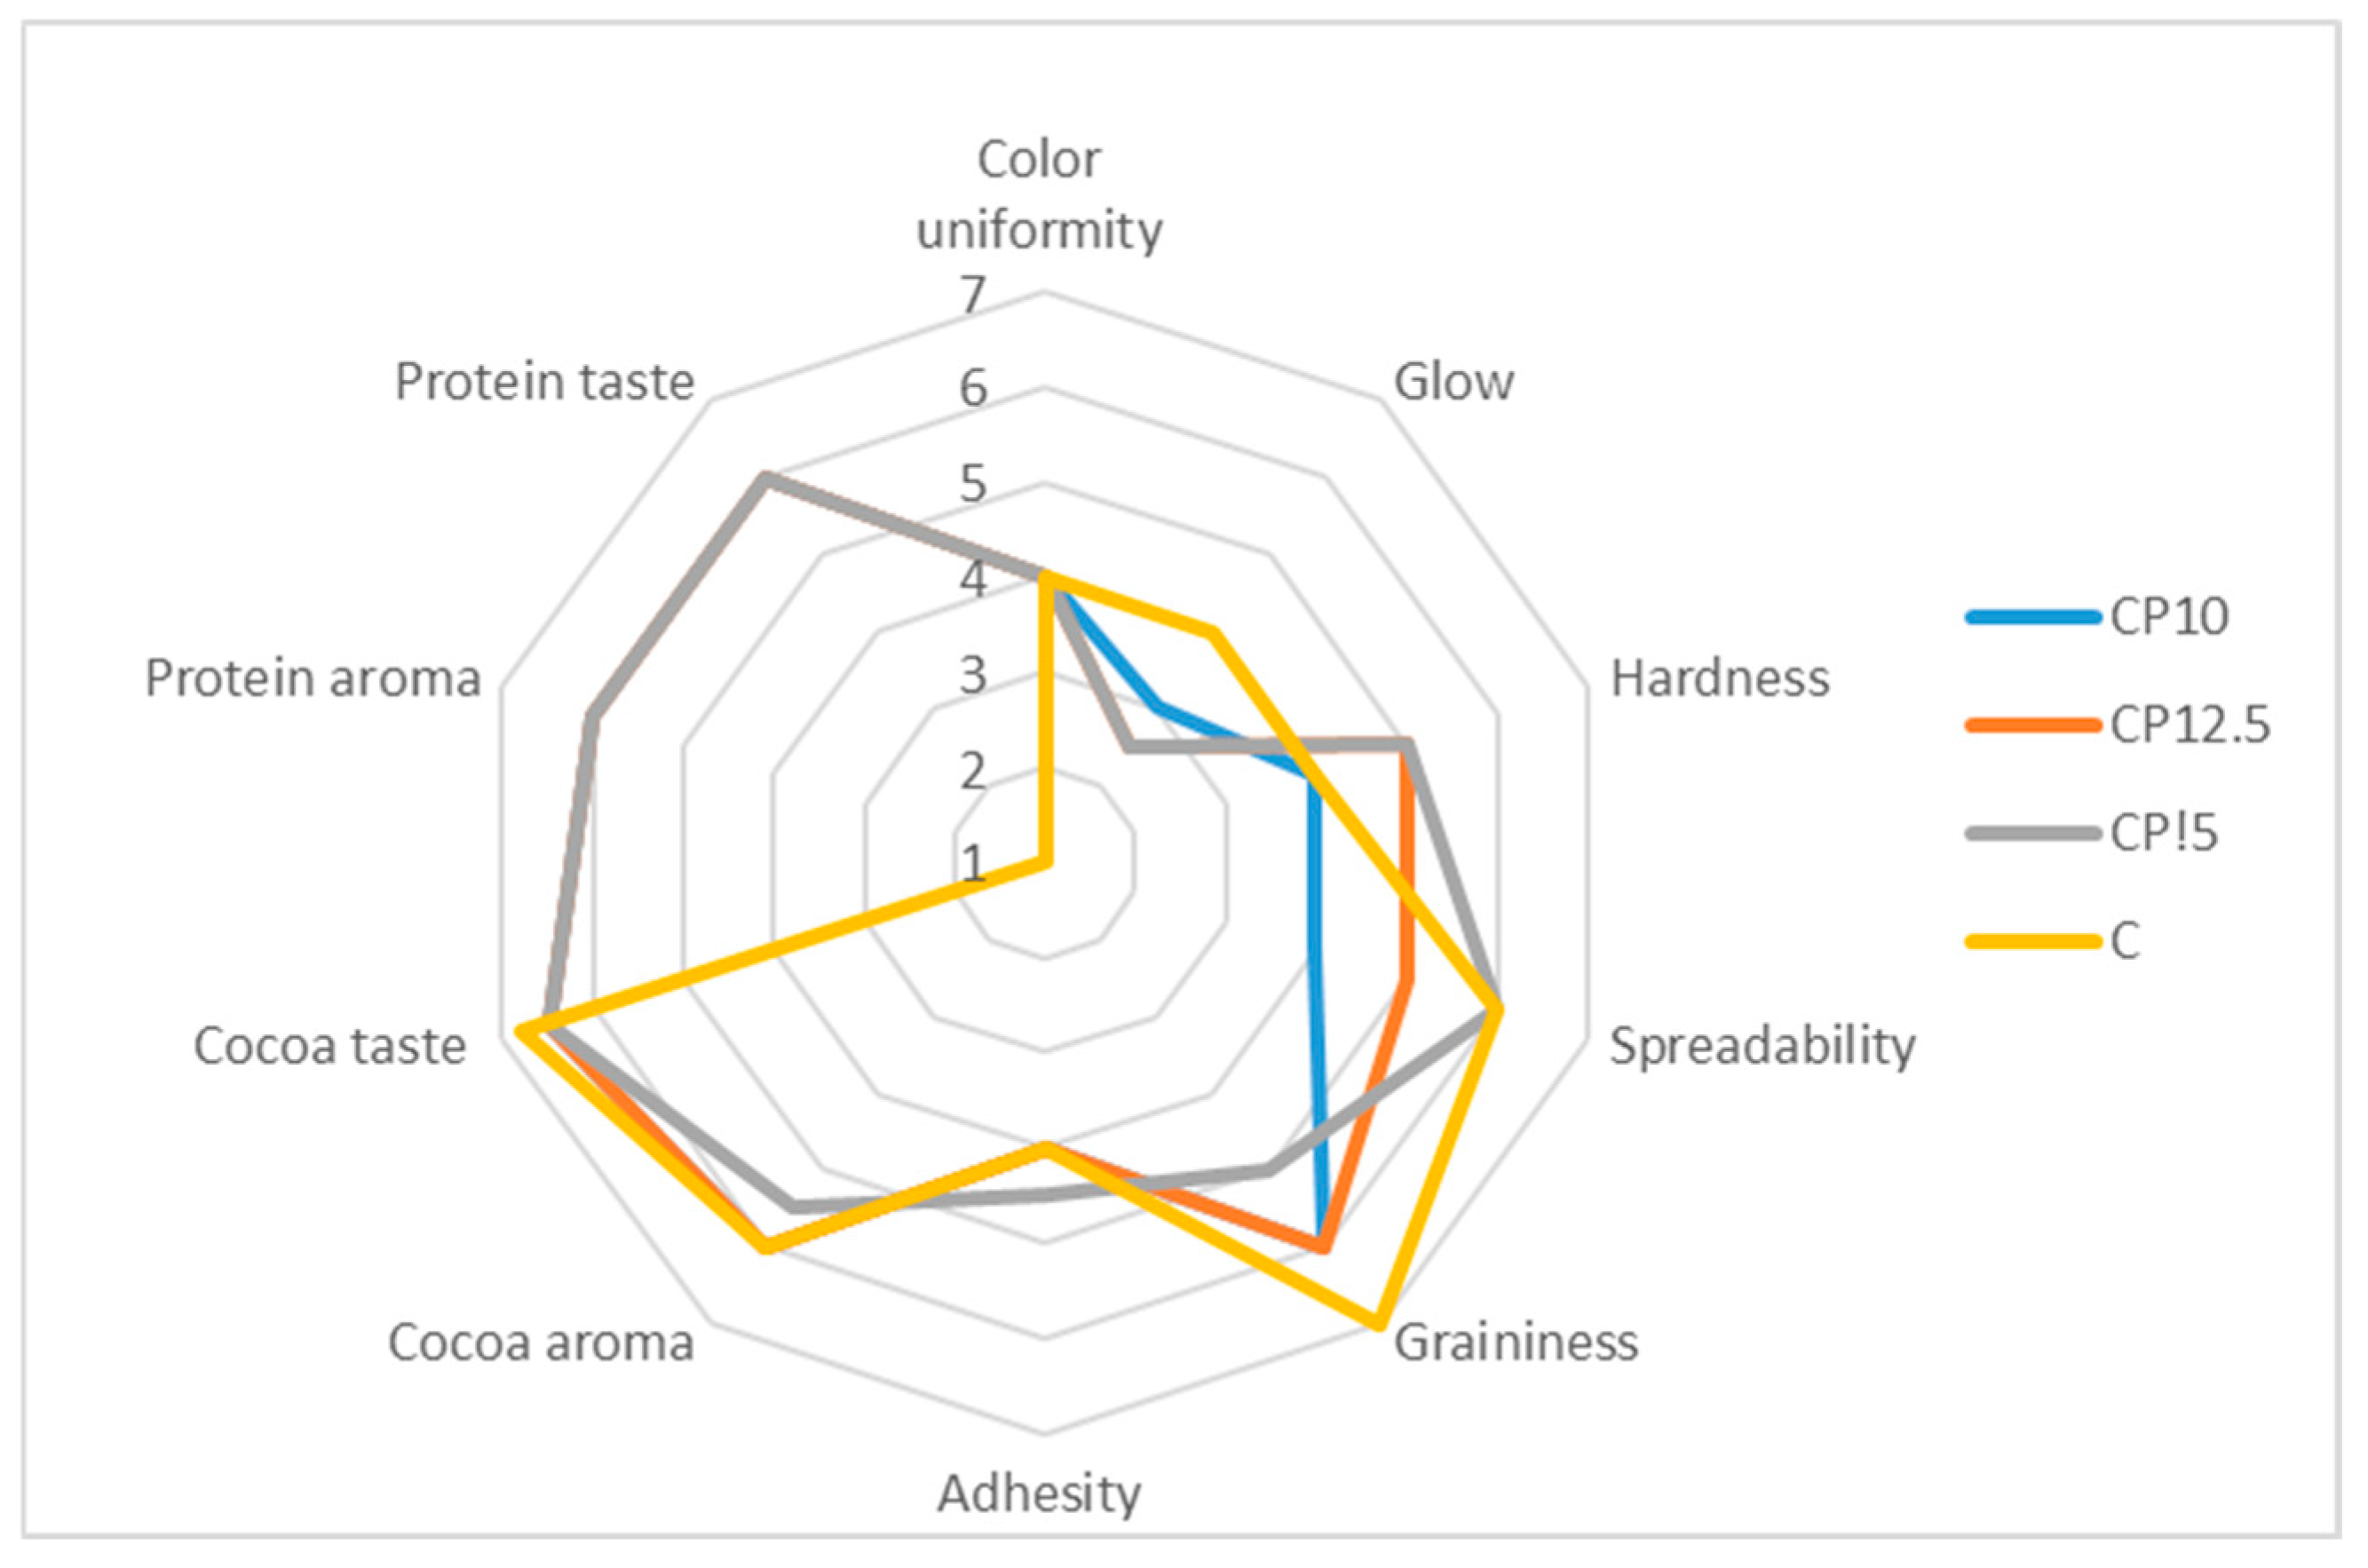
Additionally, sensory evaluation was conducted to determine the overall acceptance of developed product, and the results are presented in Figure 5. Sensory evaluation includes smelling, tasting, sight, touch, and hearing, to analyze and interpret human responses to products like food and beverages [39]. After the evaluation, the collected results were analyzed using one-way ANOVA, revealing that one parameter (color uniformity) showed no significant difference (p ≥ 0.05) among the samples. Additionally, all enriched samples were graded identically for the taste and protein aroma. Furthermore, cocoa taste and aroma were not significantly (p ≥ 0.05) different among the samples. Regarding the other properties, such as glow on the surface, a matte surface was noticed in enriched samples, due to the presence of CP and the decreased fat level as a consequence of protein enrichment.
The control sample was rated as extremely smooth, while the enriched samples had a lower rating, due to the presence of protein. The panelists graded the fortified cocoa products as very good with regard to the taste and smell of the protein, describing it as being similar to a roasted peanut. This can be explained by the thermal treatment that Acheta domesticus, or house cricket, undergoes [40]. These results indicate that the function spreads developed were generally accepted and with minimum changes in sensory attributes compared to the control. In a previous study [41], the authors determined the effect of the concentration of whey protein added into chocolate spreads, regarding mouthfeel and overall sensory attributes. The findings indicate that the lower addition of whey protein had a positive effect on the sensory properties, with 88% of total consumers grading these products as excellent. Additionally, after the incorporation of cricket flour in chocolate desserts in concentrations of 1, 3, and 5%, the sensory panel accepted all products with regard to each attribute, but the sample fortified with 5% was graded the highest. Furthermore, when cricket flour was added to chocolate desserts at concentrations of 1%, 3%, and 5%, the sensory panel found all samples acceptable for every attribute, with the 5% fortified sample receiving the highest rating [42].

4. Conclusions

Interest in insects as an alternative protein source is rising in Western countries; however, most Western consumers still respond with aversion or disapproval. This reluctance is mainly fueled by food taboos grounded in sociocultural norms and psychological resistance. Additionally, factors such as food neophobia and negative beliefs and attitudes toward insects further decrease consumers’ willingness to pay for insect-based products. On the other hand, providing information about the sustainability and environmental benefits of edible insects could increase consumers’ willingness to try and accept these products.
This study concludes that Acheta domesticus, classified as an alternative source of protein, has noteworthy potential for incorporation into confectionery products as part of functional food innovations. In terms of particle size distribution (PSD), even the highest tested concentration of cricket powder (CP) did not lead to a gritty texture, a notable benefit that enhances consumer acceptance of the final product. From a manufacturing perspective, the textural and rheological properties remained within acceptable ranges, even though protein enrichment altered these parameters compared to the control sample. Sensory assessments supported these technological findings and were consistent with both PSD and color analysis, showing that most evaluated attributes received high marks from the panelists. Notably, the samples labeled CP12.5 and CP15 meet the criteria to claim to be a “source of protein” on their packaging, which strengthens their market potential and firmly positions them in the expanding market for functional, high-protein foods.
However, the present study has certain limitations, such as the absence of data on amino acid profiles, protein bioavailability, digestibility, and antioxidant properties. These aspects are essential for a comprehensive evaluation of the nutritional and functional quality of cricket protein. It is therefore recommended that future research focuses on thoroughly assessing the complete nutritional composition of Acheta domesticus, as well as its suitability for inclusion in a variety of food systems. Furthermore, additional studies on consumer attitudes and acceptance of insect-based foods will provide crucial information for the successful development and marketing of these novel products.

Author Contributions

Conceptualization, M.S., I.L. and B.Š.; methodology, M.S. and I.L.; software, M.S.; validation, Đ.A., D.Z. and M.S.; formal analysis, M.S.; investigation, M.S.; resources, I.L. and B.Š.; data curation, A.G.; writing—original draft preparation, M.S.; writing—review and editing, M.S., A.G., I.L. and B.Š.; visualization, M.S.; supervision, B.P. and D.Z. All authors have read and agreed to the published version of the manuscript.

Funding

This research was supported by the Ministry of Science, Technological Development and Innovations, Serbia (program 451-03-126/2025-03/200134 and 451-03-137/2025-514 03/200134) and the Croatian Science Foundation (IP-2022-10-1960).

Data Availability Statement

The data presented in this study are available on request from the corresponding author.

Conflicts of Interest

The authors declare no conflicts of interest.

Abbreviations

The following abbreviations are used in this manuscript:
CPCricket protein
CP10Sample with 10% of cricket protein
CP12.5Sample with 12.5% of cricket protein
CP15Sample with 15% of cricket protein
PSDParticle size distribution

References

  1. Stožinić, M.; Ačkar, Đ.; Šojić, B.; Sedlar, T.; Popović, L.; Pajin, B.; Flanjak, I.; Bulatović, M.; Petrović, J.; Nikolić, I.; et al. Incorporation of Pork Meat and Blood Plasma Proteins into a Cocoa Cream Matrix: Characterization, Comparison of Functional Properties, and In Vitro Simulated Digestion. Foods 2025, 14, 2547. [Google Scholar] [CrossRef]
  2. Banovic, M.; Arvola, A.; Pennanen, K.; Duta, D.E.; Brückner-Gühmann, M.; Lähteenmäki, L.; Grunert, K.G. Foods with increased protein content: A qualitative study on European consumer preferences and perceptions. Appetite 2018, 125, 233–243. [Google Scholar] [CrossRef]
  3. Munialo, C.D. An exploration of alternative proteins as a potential sustainable solution to meeting the nutritional needs of the ever-increasing global population. Int. J. Food Sci. Technol. 2024, 59, 2846–2859. [Google Scholar] [CrossRef]
  4. Aiking, H. Future protein supply. Trends Food Sci. Technol. 2011, 22, 112–120. [Google Scholar] [CrossRef]
  5. Day, L. Proteins from land plants—Potential resources for human nutrition and food security. Trends Food Sci. Technol. 2013, 32, 25–42. [Google Scholar] [CrossRef]
  6. Popović, L. Proteins and Biochemical Transformations. Monography, Faculty of Technology Novi Sad, University on Novi Sad, Novi Sad, Serbia, 2022. [Google Scholar]
  7. Liceaga, A.M. Edible insects, a valuable protein source from ancient to modern times. Adv. Food Nutr. Res. 2022, 101, 129–152. [Google Scholar] [CrossRef] [PubMed]
  8. Goodland, R.; Anhang, J. Livestock and Climate Change: What if the Key Actors in Climate Change Are… Cows, Pigs, and Chickens? Washington, USA. 2009. Available online: https://awellfedworld.org/wp-content/uploads/Livestock-Climate-Change-Anhang-Goodland.pdf (accessed on 19 August 2025).
  9. Huis, A.V.; Itterbeeck, J.V.; Klunder, H.; Mertens, E.; Halloran, A.; Muir, G.; Vantomme, P. Edible Insects: Future Prospects for Food and Feed Security; Food And Agriculture Organization of the United Nations: Rome, Italy, 2013; Available online: http://www.fao.org/docrep/018/i3253e/i3253e.pdf (accessed on 20 September 2025).
  10. Murefu, T.; Macheka, L.; Musundire, R.; Manditsera, F. Safety of wild harvested and reared edible insects: A review. Food Control. 2019, 101, 209–224. [Google Scholar] [CrossRef]
  11. Van Huis, A. Potential of Insects as Food and Feed in Assuring Food Security. Annu. Rev. Entomol. 2013, 58, 563–583. [Google Scholar] [CrossRef] [PubMed]
  12. Nowak, V.; Persijnm, D.; Rittenschober, D.; Charrondiere, R. Review of food composition data for edible insects. Food Chem. 2016, 193, 39–46. [Google Scholar] [CrossRef]
  13. Mwangi, M.N.; Oonincx, D.G.A.B.; Stouten, T.; Veenenbos, M.; Melse-Boonstra, A.; Dicke, M.; van Loon, J.J.A. Insects as sources of iron and zinc in human nutrition. Nutr. Res. Rev. 2018, 31, 248–255. [Google Scholar] [CrossRef]
  14. Berg, J.; Wendin, K.; Langton, M.; Josell, Å.; Davidsson, F. State of the Art Report: Insects as food and feed. Ann. Exp. Biol. 2017, 5, 1–9. [Google Scholar]
  15. Zielińska, E.; Baraniak, B.; Karaś, M.; Rybczyńska, K.; Jakubczyk, A. Selected species of edible insects as a source of nutrient composition. Food Res. Int. 2015, 77, 460–466. [Google Scholar] [CrossRef]
  16. Pilco-Romero, G.; Chisaguano-Tonato, A.M.; Herrera-Fontana, M.E.; Chimbo-Gándara, L.F.; Sharifi-Rad, M.; Giampieri, F.; Battino, M.; Vernaza, M.G.; Álvarez-Suárez, J.M. House cricket (Acheta domesticus): A review based on its nutritional composition, quality, and potential uses in the food industry. Trends Food Sci. Technol. 2023, 142, 104226. [Google Scholar] [CrossRef]
  17. Giampieri, F.; Alvarez-Suarez, J.M.; Machì, M.; Cianciosi, D.; Navarro-Hortal, M.D.; Battino, M. Edible insects: A novel nutritious, functional, and safe food alternative. Food Front. 2022, 3, 358–365. [Google Scholar] [CrossRef]
  18. AOAC—Association of Official Analytical Chemists. International, Official Methods of Analysis of the Association of Official Analytical Hemists International, 17th ed.; Association of Official Analytical Communities: Gaithersburg, MD, USA, 2000. [Google Scholar]
  19. Hailu Kassegn, H. Determination of proximate composition and bioactive compounds of the Abyssinian purple wheat. Cogent Food Agric. 2018, 4, 1421415. [Google Scholar] [CrossRef]
  20. IOCCC. Viscosity of Cocoa and Chocolate Products. Anal. Method 2007, 46, 1–7. [Google Scholar]
  21. Aidoo, R.P.; Afoakwa, E.O.; Dewettinck, K. Rheological properties, melting behaviours and physical quality characteristics of sugar-free chocolates processed using inulin/polydextrose bulking mixtures sweetened with stevia and thaumatin extracts. LWT—Food Sci. Technol. 2015, 62, 592–597. [Google Scholar] [CrossRef]
  22. Lončarević, I.; Petrović, J.; Teslić, N.; Nikolić, I.; Maravić, N.; Pajin, B.; Pavlić, B. Cocoa Spread with Grape Seed Oil and Encapsulated Grape Seed Extract: Impact on Physical Properties, Sensory Characteristics and Polyphenol Content. Foods 2022, 11, 2730. [Google Scholar] [CrossRef] [PubMed]
  23. CIE. International Commission on Illumination, Colorimetry: Official Recommendation of the Inter-National Commission on Illumination; Publication CIE No. (E-1.31); CIE: Vienna, Austria, 1976. [Google Scholar]
  24. ISO 8586; Sensory Analysis—General Guidelines for the Selection, Training and Monitoring of Selected Assessors and Expert Sensory Assessors. ISO: Geneva, Switzerland, 2007.
  25. ISO 8589; Sensory Analysis-General Guidance for the Design of Test Rooms. ISO: Geneva, Switzerland, 2007.
  26. Rulebook of the Republic of Serbia on Nutrition and Health Claims Which Are Indicated on Food Declaration. No. 51/2018, 103/2018, 110/2023 and 62/2025). Available online: https://www.paragraf.rs/propisi/pravilnik-o-prehrambenim-zdravstvenim-izjavama-na-deklaraciji-hrane.html (accessed on 20 August 2025).
  27. Afoakwa, E.O.; Paterson, A.; Fowler, M. Effects of particle size distribution and composition on rheological properties of dark chocolate. Eur. Food Res. Technol. 2008, 226, 1259–1268. [Google Scholar] [CrossRef]
  28. Bolenz, S.; Holm, M.; Langkrär, C. Improving particle size distribution and flow properties of milk chocolate produced by ball mill and blending. Eur. Food Res. Technol. 2013, 238, 139–147. [Google Scholar] [CrossRef]
  29. Stožinić, M.V.; Zarić, D.B.; Rakin, M.B.; Lončarević, I.S.; Pajin, B.S.; Bulatović, M.L. Impact of whey bioactive hydrolysates on the quality of fat fillings for confectionery products. Food Feed. Res. 2024, 51, 189–198. [Google Scholar] [CrossRef]
  30. Afoakwa, E.O.; Paterson, A.; Fowler, M. Factors influencing rheological and textural qualities in chocolate—A review. Trends Food Sci. Technol. 2007, 18, 290–298. [Google Scholar] [CrossRef]
  31. Tárrega, A.; Ramírez-Sucre, M.O.; Vélez-Ruiz, J.F.; Costell, E. Effect of whey and pea protein blends on the rheological and sensory properties of protein-based systems flavoured with cocoa. J. Food Eng. 2012, 109, 467–474. [Google Scholar] [CrossRef]
  32. Barišić, V.; Ačkar, Đ.; Lončarević, I.; Petrović, J.; Benšić, M.; Paulik, D.; Doko, K.; Jozinović, A.; Babić, J.; Šubarić, D.; et al. Cocoa Shell as a Bulking Agent in Nutritionally Improved Cocoa Spreads with Sugar Substitutes. Curr. Res. Nutr. Food Sci. 2024, 12, 1118–1130. [Google Scholar] [CrossRef]
  33. Do, T.A.; Hargreaves, J.M.; Wolf, B.; Hort, J.; Mitchell, J.R. Impact of particle size distribution on rheological and textural properties of chocolate models with reduced fat content. J. Food Sci. 2007, 72, E541–E552. [Google Scholar] [CrossRef]
  34. Sokmen, A.; Gunes, G. Influence of some bulk sweeteners on rheological properties of chocolate. LWT—Food Sci. Technol. 2006, 39, 1053–1058. [Google Scholar] [CrossRef]
  35. Shakerardekani, A.; Karim, R.; Ghazali, H.M.; Chin, N.L. Textural, Rheological and Sensory Properties and Oxidative Stability of Nut Spreads—A Review. Int. J. Mol. Sci. 2013, 14, 4223–4241. [Google Scholar] [CrossRef]
  36. Jovanović, P.; Pajin, B.; Lončarić, A.; Jozinović, A.; Petrović, J.; Fišteš, A.; Zarić, D.; Tumbas Šaponjac, V.; Ačkar, Đ.; Lončarević, I. Whey as a Carrier Material for Blueberry Bioactive Components: Incorporation in White Chocolate. Sustainability 2022, 14, 14172. [Google Scholar] [CrossRef]
  37. Creusen, M.E.; Schoormans, J.P. The different roles of product appearance in consumer choice. J. Prod. Innov. Manag. 2005, 22, 63–81. [Google Scholar] [CrossRef]
  38. Mugge, R.; Dahl, D.W.; Schoormans, J.P. “What you see, is what you get?” Guidelines for influencing consumers’ perceptions of consumer durables through product appearance. J. Prod. Innov. Manag. 2018, 35, 309–329. [Google Scholar] [CrossRef]
  39. Setser, C.S. Sensory evaluation. In Advances in Baking Technology; Springer: Boston, MA, USA, 1993; pp. 254–291. [Google Scholar]
  40. Fröhling, A.; Bußler, S.; Durek, J.; Schlüter, O.K. Thermal impact on the culturable microbial diversity along the processing chain of flour from crickets (Acheta domesticus). Front. Microbiol. 2020, 11, 884. [Google Scholar] [CrossRef] [PubMed]
  41. Kumar, P. Process optimization for the preparation of chocolate spread incorporating whey protein concen-trate, cocoa powder, olive oil, and butterfat using response surface methodology. J. Food Process. Preserv. 2015, 39, 745–757. [Google Scholar] [CrossRef]
  42. Opris, G.A.; Rosan, C.A.; Vicas, S.J. Development and Characterization of a Novel Sweet Product Rich in Polyphenols and Protein Derived from Acheta domesticus. Bull. Univ. Agric. Sci. Vet. Med. Cluj-Napoca Food Sci. Technol. 2025, 82, 184–196. [Google Scholar] [CrossRef] [PubMed]
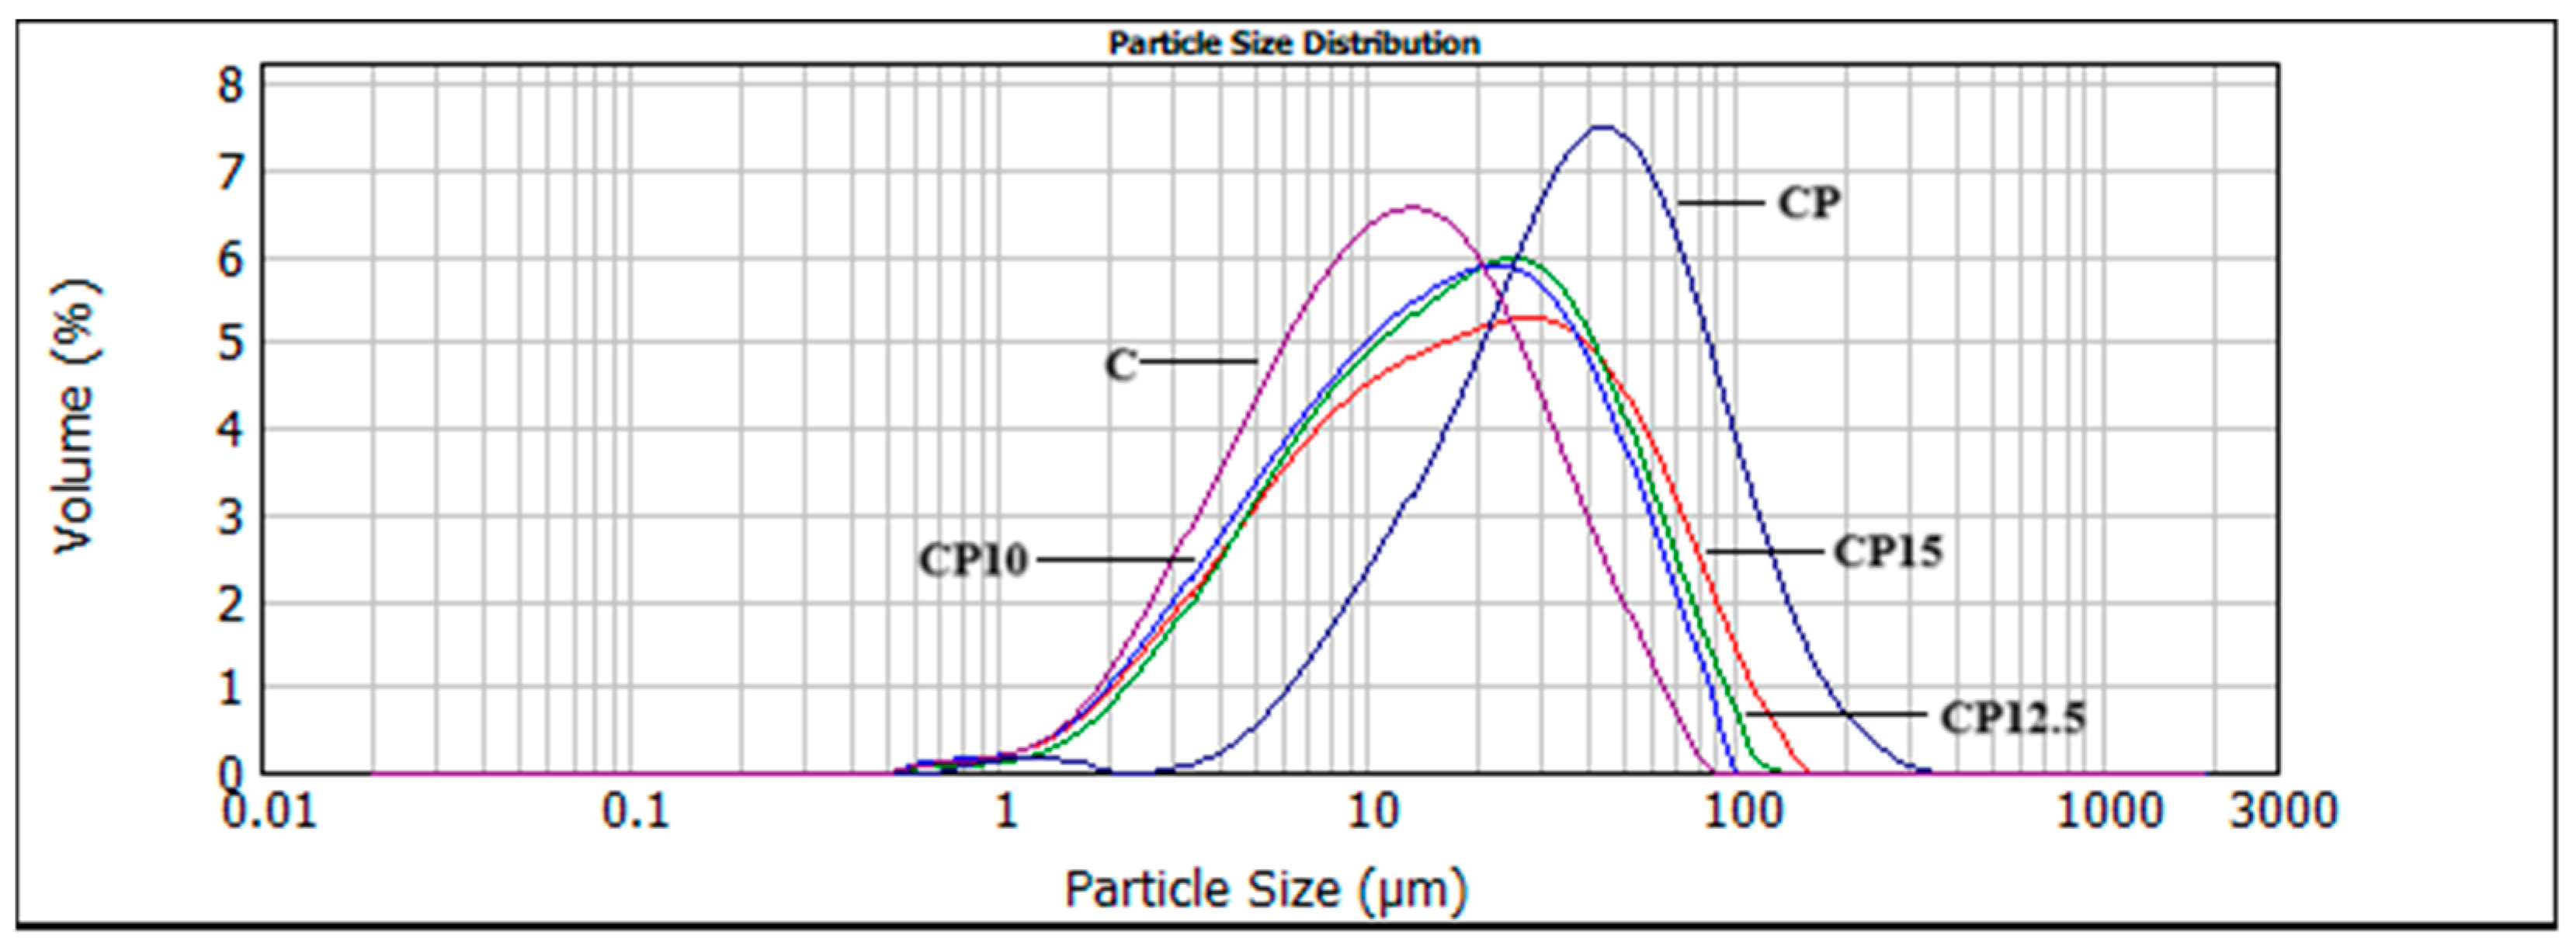
Figure 1. Particle size distribution in protein powder (CP), control (C), and enriched cocoa samples (CP10, CP12.5, and CP15).
Processes 13 03162 g001
Figure 2. Rheological properties of control (C) and enriched cocoa samples (CP10, CP12.5, and CP15).
Processes 13 03162 g002
Figure 3. Melting properties in control (C) and enriched cocoa samples (CP10, CP12.5, and CP15).
Processes 13 03162 g003
Figure 4. Color properties of control (C) and enriched cocoa samples (CP10, CP12.5, and CP15). Values represent average of measurements, with different letters in superscript being significantly different (p ≤ 0.05).
Processes 13 03162 g004
Figure 5. Sensory properties of control (C) and enriched cocoa samples (CP10, CP12.5, and CP15).
Processes 13 03162 g005
Table 1. Chemical composition of control and fortified samples.
SampleProteinFatCarbohydratesDietary FiberMoistureAshEnergy
C4.41 ± 0.31 a34.01 ± 1.07 a54.87 ± 0.15 a3.96 ± 1.31 a0.99 ± 0.02 a1.76 ± 0.01 a2297.81 ± 1.15 a
CP1011.88 ± 0.17 b30.54 ± 0.04 b49.12 ± 0.01 b5.27 ± 0.02 b1.27 ± 0.02 b1.92 ± 0.03 b2209.14 ± 1.00 b
CP12.512.83 ± 0.14 c28.53 ± 0.16 c48.52 ± 0.01 c6.78 ± 0.60 c1.23 ± 0.01 c2.11 ± 0.04 c2152.80 ± 1.75 c
CP15 14.34 ± 0.41 c27.87 ± 0.10 d48.28 ± 0.08 d7.13 ± 0.0.13 d1.19 ± 0.02 d1.19 ± 0.01 d2152.80 ± 1.48 c
Values represent average of triplicates ± SD. Values are expressed as g/100 g, except for energy (KJ/100 g). Means with different letters in superscript in columns are significantly different (p ≤ 0.05).
Table 2. Particle size parameters for CP, C, and enhanced cocoa samples (CP10, CP12.5, and CP15).
Particle Size Distribution Parameters (µm)
Samplesd(0,1)d(0,5)d(0,9)D[4,3]
CP11.11 ± 0.07 a39.04 ± 0.14 a102.44 ± 0.00 a50.06 ± 0.01 a
C3.53 ± 0.01 b11.89 ± 0.06 b35.10 ± 0.01 b16.15 ± 0.13 b
CP103.84 ± 0.00 c15.82 ± 0.01 c48.45 ± 0.07 c21.60 ± 0.00 c
CP12.53.82 ± 0.07 d16.83 ± 0.04 d57.65 ± 0.01 d24.86 ± 0.04 d
CP154.00 ± 0.07 e18.11 ± 0.00 e62.90 ± 0.04 e26.86 ± 0.02 e
Values represent average of triplicate ± es ± SD. Means with different letters in superscript in columns are significantly different (p ≤ 0.05).
Table 3. Rheological and textural properties of control and enriched cocoa cream spreads.
Rheological ParametersTextural Properties
SamplesCasson Viscosity (Pa*s)Yield Stress (Pa)Hardness (kg)
C3.847 ± 0.84 a1.846 ± 0.02 a2.260 ± 0.31 a
CP106.417 ± 0.35 b3.016 ± 0.15 b2.601 ± 0.02 b
CP12.58.617 ± 0.46 c0.862 ± 0.46 c2.804 ± 0.12 c
CP1515.39 ± 0.01 d0.928 ± 0.08 c2.920 ± 0.14 d
Values represent average of triplicates ± SD, with different letters in superscript in columns being significantly different (p ≤ 0.05).
Disclaimer/Publisher’s Note: The statements, opinions and data contained in all publications are solely those of the individual author(s) and contributor(s) and not of MDPI and/or the editor(s). MDPI and/or the editor(s) disclaim responsibility for any injury to people or property resulting from any ideas, methods, instructions or products referred to in the content.