1. Introduction
Tight sandstone gas reservoirs are highly valuable unconventional gas reservoirs, which refers to the accumulation of natural gas in sandstone reservoirs with a porosity less than 10%, overburden permeability less than 0.1 × 10
−3 μm
2, or air permeability less than 1.0 × 10
−3 μm
2 [
1,
2,
3,
4]. According to statistics, the number of basins with tight sandstone gas reservoirs worldwide has exceeded 70, making it one of the largest unconventional natural gas reservoirs currently under development. At present, large-scale natural gas geological reserves of about 6500 × 10
8 m
3 have been discovered in Guang’an, Hechuan, Anyue, and other places, and the gas reservoirs generally contain water, with complex gas–water relationships [
5,
6,
7,
8,
9].
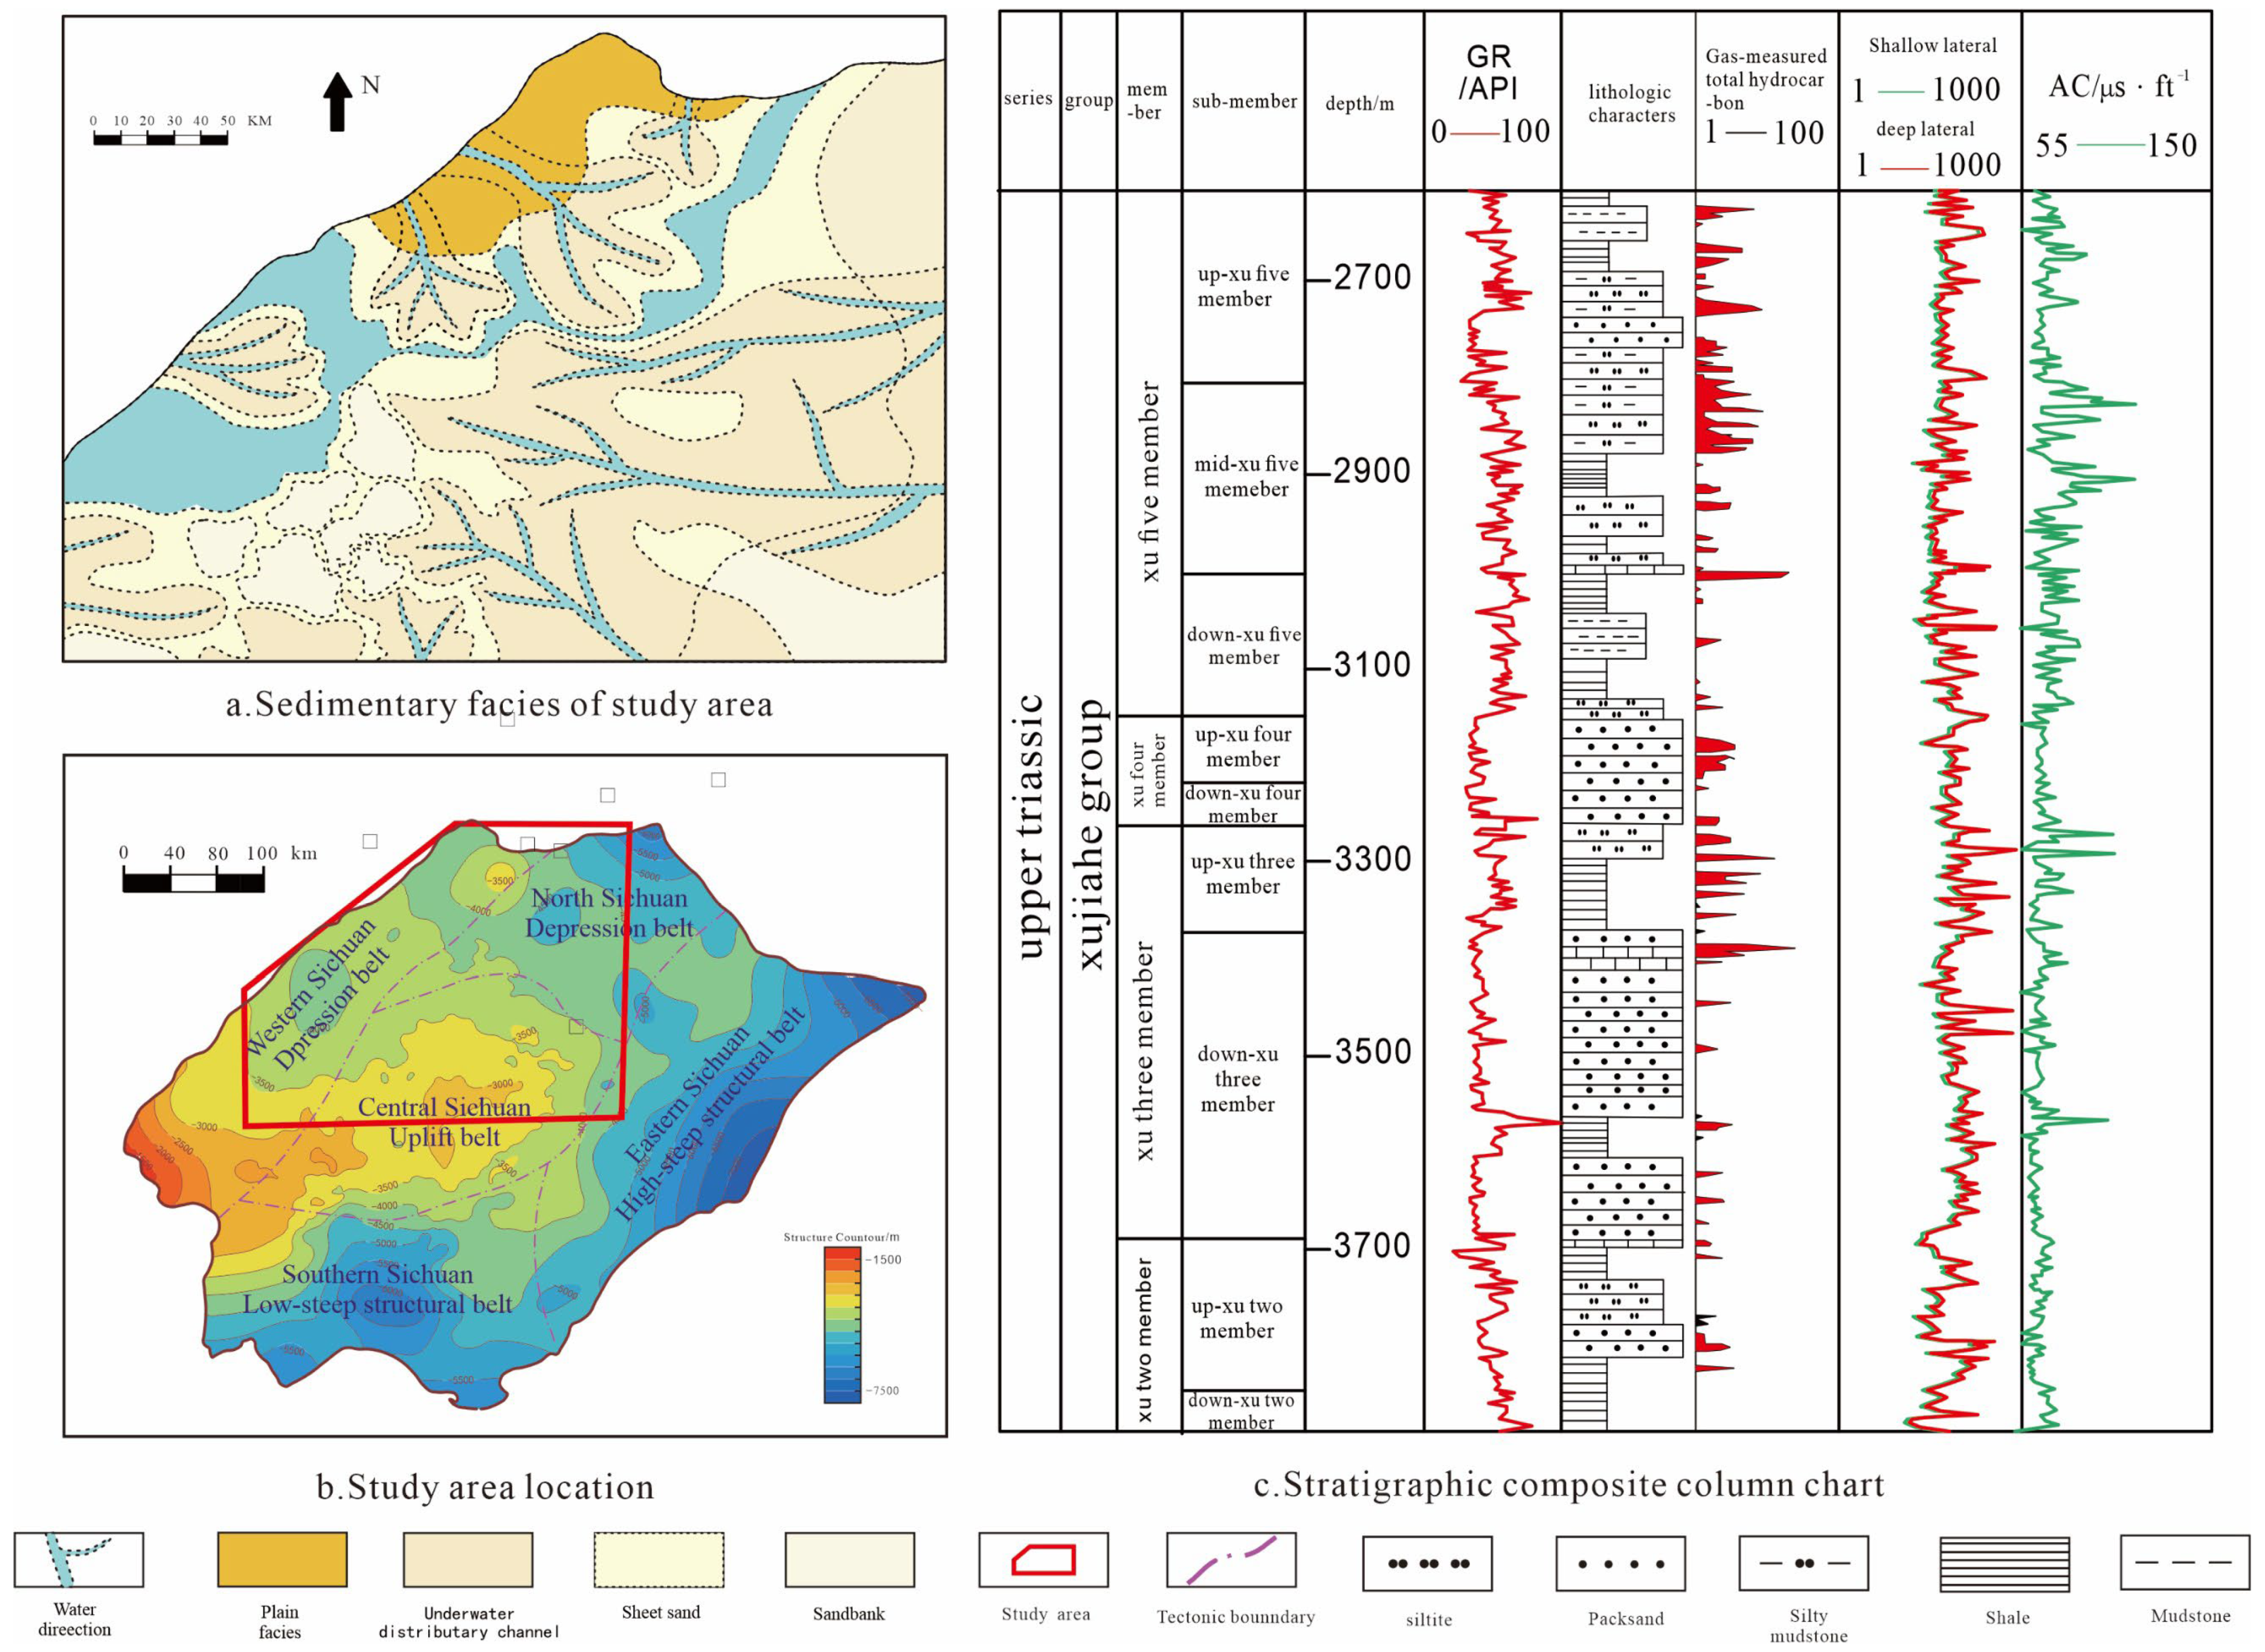
The northwest central Sichuan region has made significant contributions to the Sichuan Basin, becoming an important production area for tight sandstone in China. The Tianfu and Qiulin gas fields in this area are important parts of the tight sandstone gas fields in the Xujiahe Formation. The tight sandstone of the Upper Triassic Xujiahe Formation is widely developed in the Sichuan Basin, and the hydrocarbon source rocks are mainly composed of mudstone in the upper parts of the Xu-1, Xu-3, Xu-5, and Xu-6 sections. The tight sandstone is mainly developed in the lower parts of the Xu-2, Xu-4, and Xu-6 sections, which are good reservoirs. The Xu-3 and Xu-4 sections are the main production layers.
The tight sandstone gas reservoir in the Xujiahe Formation has a stable and gentle structural background, extensive coverage of high-quality source rocks, and a large area of heterogeneous tight reservoirs. The water saturation of the gas reservoir is high and the total gas production intensity of the source rocks is low. Previous studies on Xujiahe Formation gas reservoirs have not yet explained the essential characteristics of large and medium-sized gas fields with a high water cut in low-gas-intensity areas. It is urgent to clarify the occurrence and migration laws of different fluids in tight sandstone reservoirs, determine the natural gas filling characteristics and influencing factors of different types of tight sandstone reservoirs, solve the complex gas–water distribution problem of tight sandstone reservoirs, and realize the prediction of favorable areas for tight sandstone gas exploration and development in the Xujiahe Formation and Shaximiao Formation in the Sichuan Basin.
Based on the study of the basic characteristics of the tight sandstone reservoir in the Xujiahe Formation of the northwest-to-central Sichuan Basin, this article uses a nuclear magnetic resonance gas–water injection simulation to simulate the natural gas injection process using tight sandstone samples from the Xu-3 section of the Tianfu and Qiulin gas fields. The changes in pore water, gas–water dynamics, and gas–water injection characteristics during the natural gas reservoir formation process are quantitatively characterized and analyzed, and the main controlling factors are discussed in combination with mineral, pore, and organic geochemical characteristics.
2. Geological Background and Samples
2.1. Geological Background
The Sichuan Basin is a complex superimposed basin of Paleozoic–Cenozoic marine continental facies, which can be divided into two major evolutionary stages, the craton basin of the Sinian Middle Triassic and the foreland basin since the Late Triassic. Its structure has regional differences. The high and steep tectonic zones in eastern Yunnan, northern Guizhou, southeastern Chongqing, western Hunan, eastern Sichuan, and western Hubei are characterized by regional high-amplitude uplift and strong compression, with structural forms mostly manifested as high and steep folds. The low and gentle tectonic zones in southern Sichuan, southwestern Sichuan, and northern Sichuan are characterized by regional uplift and exhibit a relatively low, gentle, and flat structural morphology. The western Sichuan low and gentle tectonic zone and the central Sichuan low and flat tectonic zone are characterized by the development of Mesozoic and Cenozoic foreland basins, and the regional structural expression is gentle (
Figure 1b) [
10,
11,
12,
13,
14].
Except for the erosion of the Devonian Carboniferous strata in the upper Paleozoic, other strata in the Sichuan Basin are well developed and widely distributed. The upper Triassic Xujiahe Formation is underlain by the middle Triassic Leikoupo Formation and overlayed by the lower Jurassic Ziliujing Formation. Influenced by the multi-curtain tectonic movement and multi-directional source system during the Indo-Sinian period, the upper Triassic Tong Xujiahe Formation developed a set of “skip”-thickened shale strata with land-based clastic rocks and have a large formation thickness [
15,
16], distributed between 300 and 3500 m, and the lithology of the strata is mainly composed of interbedded conglomerates, sandstones, and shale (
Figure 1c).
The Jianyang block of the Tianfu gas field is located in the Nanchong structural group of the Chuanzhong ancient uplift gentle tectonic zone in the Sichuan Basin. It mainly exposes Jurassic and Cretaceous strata, and the lithology is mudstone or sandstone. The Xujiahe Formation in this area is generally characterized by a southeast–northwest dipping fold monocline and locally developed northeast nose protrusions on this monocline background. The eastern part of the area is the western section of the Penglai Town structure and the western section of the Jiangnan hidden structure. The lithology is mainly composed of large sets of stacked sand interbedded with thin layers of mud and shale, and the thickness of the sand body is relatively large, reflecting the sedimentary characteristics of the delta front. The Qiulin 1 well block in the Qiulin area is located on a downward slope in the ancient depression of northern Sichuan in the Sichuan Basin. It has developed northwest-oriented Qiulin nose-shaped structures and east–west nose-shaped Jinhua structures on a monocline background. The surface mainly exposes the Jianmenguan Formation of the Cretaceous or Penglaizhen Formation of the Jurassic. The surface structure is characterized by northwest-oriented Qiulin nose-shaped structures and east–west Jinhua nose-shaped structures on a northwest dipping monocline, with locally formed high points. The Xujiahe Formation in this area has a clear positive correlation between the bedding scale and sandstone grain size. Small cross-bedding is mainly developed in fine-to-medium sandstone, while in coarse sandstone or gravel bearing coarse sandstone, it is characterized by larger grain sizes. Medium-to-large-scale cross bedding is dominant, while intact oblique bedding is either undeveloped or poorly developed, reflecting the sedimentary environment of rivers and deltas dominated by traction flow (
Figure 1a).
2.2. Samples
In order to reduce the impact of structural differences, this study selected nine different depth tight sandstone samples from the Xujiahe Formation in the relatively flat northwest-to-central Sichuan region of the Sichuan Basin. The basic information of the samples is shown in
Table 1.
The nine selected tight sandstone samples are from the Xujiahe Formation in the Qiulin and Yongqian blocks, with permeability ranging from 0.014 × 10⁻³ to 0.402 × 10⁻³ μm2, the maximum pore throat radius ranging from 0.357 to 1.092 μm, the average pore throat radius ranging from 0.065 to 0.282 μm, and the median pore throat radius ranging from 0.009 to 0.149 μm. The overall permeability, maximum pore throat radius, average throat half pore size, and median pore throat radius of the samples in the Qiulin area are significantly higher than those in the Yongqian area.
There is no significant difference in the mineral content of tight reservoir rock samples in the northwest and central Sichuan regions (
Figure 2a;
Table 2). The quartz content in sandstone ranges from 39.8 to 68.9%, with an average of 58.2%, and the clay content ranges from 12.8 to 19.3%, with an average of 16.1%. According to the sandstone type chart, the lithology of the reservoir rocks in the Xu-3 section is mainly lithic feldspar sandstone and feldspar lithic sandstone, with the rest being feldspar sandstone (
Figure 2b;
Table 2). According to observations of rock debris and core samples, as well as a microscopic identification of thin sections, the sample layers in the Sichuan Basin are mainly composed of lithic feldspar sandstone and feldspar lithic sandstone, with feldspar and rock debris as the main components. The feldspar content is relatively high, generally above 15%, and some sand formations have a rock debris content exceeding 50%. The sand body of the Xujiahe Formation is fine in grain size, mainly fine overall, with medium–good sorting and secondary edge–secondary circle behavior, and the debris particles are mostly in point–line contact and exhibit pore cementation (
Figure 3).
According to the results of scanning electron microscopy (
Figure 4), the pore types in the storage space of the Xu-3 reservoir rock in the Qiulin area are diverse [
17,
18,
19,
20], mainly including residual intergranular pores, intragranular solution pores, matrix pores, intergranular solution pores, and microcracks. The overall pore size of the storage space is relatively small, and the main pore types are intergranular micropores and intragranular solution pores. The pore morphology is mostly of the crack type, with cast film pores as the main type. The more regular pores (circular) are dead pores, which are not conducive to gas occurrence and migration. Some of the larger intergranular pores, intragranular pores, and microcracks are filled with detrital quartz, blocking the natural gas migration pathway. More than 70% of the particles are in point–line contact, and their throat types are mainly intergranular gaps and bundle-like throats. Occasionally, necking and sheet-like throats are mainly seen, and no small pore gap throat is observed.
The pore structure parameters of tight reservoir rock samples are shown in
Table 1. The adsorption curve morphology is generally in an “S” shape, belonging to type II or type III (
Figure 5a,d). The position and degree of the curve inflection point are different, and the pore structure characteristics vary greatly (
Figure 5b,e,g,h) [
19,
20,
21,
22,
23,
24,
25,
26,
27,
28,
29]. The low-temperature nitrogen adsorption experiment results show that the pore morphology types of 2–50 nm mesopores are mainly parallel plate-like pores and fracture-type pores, and the pore volume of 2–50 nm is mainly provided by 4 nm pores (
Figure 5c,f,g,h). The high-pressure mercury injection experiment results show that the pores larger than 50 nm in the Yongqian block samples are mainly provided by 550–1100 nm pores, and the pores larger than 50 nm in the Qiulin area samples are mainly provided by 105–500 nm pores.
3. Experimental Testing and Analysis Methods
3.1. Nuclear Magnetic Resonance Gas–Water Injection Simulation Experiment
The simulation experiment of tight sandstone gas–water injections was completed in the Key Laboratory of Natural Gas Accumulation and Development of China National Petroleum Corporation. The equipment used was a high-temperature and high-pressure natural gas migration and accumulation visualization dynamic simulation system based on nuclear magnetic resonance (Macro MR12 150H-HTHP-I). The main frequency of the nuclear magnetic resonance analyzer was 12 MHz, and the dedicated core holder had a temperature resistance of 150 °C and a pressure resistance of 70 MPa. Before conducting the nuclear magnetic resonance gas–water injection simulation experiment, it was necessary to prepare a tight reservoir plunger sample with a diameter of 25 mm and a length of 4.5 mm. In order to conduct a unified comparison, taking into account the properties and geological characteristics of tight sandstone samples, the experimental testing conditions were set to a constant temperature of 26 °C, a vacuum pressure of 35 MPa, a saturated water pressure, a confining pressure of 35 MPa, a maximum gas drive pressure of 25 MPa, a magnetic field waveform of FID square wave, and a calibrated center frequency of 555,434.37 Hz.
The experimental steps are as follows: first, the sample was dried in a blast drying oven until it reached a constant weight, the dry weight of the sample was tested, and the T2 spectral signal of the sample substrate was measured. The sample was then placed in a vacuum water holding device and subjected to pressurized saturated water treatment at 35 MPa for 24 h to ensure complete saturation of the sample with water at 35 MPa. The mass and volume of the saturated water sample were tested, and the T2 spectral signal of the saturated water sample was measured. The pressurized saturated sample was filled into the nuclear magnetic displacement gripper with a facility confining pressure of 35 MPa, and pressure was gradually applied according to a pressure gradient of 1 MPa. Multiple tests were repeated at each pressure point until there was no change in the T2 spectrum, and the final mass of the sample was recorded. The breakthrough pressure of the tight sandstone with water and gas content based on T2 spectrum data under different gas drive pressures was recorded.
3.2. Reservoir Characteristics Experiment
The mineral composition analysis testing used a TTR III multifunctional X-ray diffractometer to emit X-rays to the sample, and then the X-ray diffraction pattern reflected by the sample was measured to determine the types and relative contents of minerals present in the whole rock sample and to understand the composition and structure of the rock. The high-pressure mercury intrusion test used the AutoPore IV9505 instrument (Suzhou Neway Analytical Instrument Co., Ltd., Suzhou, China), and its experimental process included drying the rock sample at 105 °C for 24 h to remove moisture and volatile organic compounds inside the sample so that the sample reached a relatively stable state. The porosity and permeability density parameters of the rock sample were measured, and the sample was sequentially placed in the low-pressure station and high-pressure station for mercury intrusion experiments. The low-temperature nitrogen adsorption test used the Quantachrome instrument, and the adsorbate was nitrogen with a purity greater than 99.99%. According to the principle of static adsorption volume, the nitrogen adsorption capacity of dense sandstone samples at different equilibrium pressures was measured at a subcritical temperature of −196.15 °C.
3.3. Nuclear Magnetic Resonance Analysis Model for Natural Gas Injection
In this study, the pore radius distribution of the measured sample was obtained through the corresponding relationship between T
2 and pore radius r (1) [
5,
8].
In Equation (1), T2 is the transverse relaxation time of the pore fluid, ms; ρ2 is the transverse surface relaxation strength of the rock, T/cm2; S is the surface area of the pore, cm2; V is the pore volume, cm3; and r is the pore radius, µm.
The calculation process of the T2 cut-off value is based on the T2 spectrum of the core under the maximum gas flooding pressure, and the cumulative porosity is calculated. Then, a point is found on the T2 spectrum of the fully saturated water core so that the cumulative porosity on the left side is equal to the total cumulative porosity under the maximum gas flooding pressure condition. The T2 value corresponding to this point is the T2 cut-off value.
Using an NMR single-fractal model and multifractal model to analyze the heterogeneity of unconventional oil and gas reservoirs, describing the influence of pore structure and mineral composition on gas–water injection in tight reservoirs in the northwest–central Sichuan region, characterizing the complexity of pore structure geometry and distribution, and predicting fluid flow, diffusion, and other processes are all performed.
In Equations (2) and (3), Vp represents the cumulative pore volume (amplitude) percentage corresponding to the T2 spectrum in a saturated water state; T2max is the maximum transverse relaxation time, ms; Dw is the NMR fractal dimension value in the saturated water state; Q is the order of the statistical moment (dimensionless); Pi(ε) is the mass probability; N(ε) is the gas adsorption capacity inside a certain box; and ε is the size of the box.
4. Natural Gas Injection Rules
4.1. Reservoir Water Content Characteristics
The T
2 relaxation time can be used to characterize the pore size of core samples, which is positively correlated with the coefficient and surface relaxation rate (Formula (1)). In this study, the surface relaxation rate of different rock samples was calculated by combining high-pressure mercury intrusion experiments and nuclear magnetic resonance saturation T
2 spectra, and the pore diameter was calculated accordingly. The area enclosed between the core nuclear magnetic resonance T
2 spectrum curve and the relaxation time (T
2) horizontal axis can represent the pore space where water exists in the core. In a fully saturated water state, the water saturation is 100%. As the gas drive pressure increases, the water content in the core gradually decreases, showing a downward trend, and the displacement efficiency changes repeatedly (
Figure 6).
To highlight the breakthrough pressure in the simulation process of tight sandstone gas–water injection, this study only retained data on the initial saturation state, important inflection points of displacement efficiency changes during the injection period, and the maximum injection pressure point (
Figure 7). Due to the fracture of samples YQ7-13, QL22-17, and QL22-1 during the gas–water injection simulation, data interference from the three samples was excluded in this study.
According to
Figure 7, one of the reasons is that there are significant differences in the characteristics of water saturation changes in the samples. The majority of samples exhibit a bimodal characteristic in the fully saturated state curve, and the water content in small-sized pores is significantly higher than that in large-sized pores. The second reason is that the water contribution of samples from the Qiulin area is significantly higher in the pore size range of 0.05–0.5 μm compared to samples from the Yongqian area, and YQ-36 and QL22-13 are the samples with the highest water content in the Yongqian and Qiulin areas, respectively. The third point is that in the saturated state, the water saturation of the YQ samples is mainly provided by 0.1–10 μm pores, while QL samples are provided by 0.01–1 μm pores. As the gas charging pressure increases, the pores that provide the main water saturation gradually decrease. When the minimum water saturation is reached, the samples in both regions are mainly provided by 0.01–0.1 μm pores.
The experimental data of six key samples of tight sandstone were analyzed and characterized according to the above steps (
Table 3). The T
2 cut-off value of the samples ranged from 1.25 to 5.35, with an average value of 2.89. There was no significant linear relationship between the numerical changes and the burial depth of the samples.
4.2. Characteristics of Gas–Water Changes in Reservoirs
Analyzing the dynamic changes in the gas content of the nuclear magnetic resonance gas–water injection simulation experiment sample (
Figure 8), there are two stages of gas–water injection between pores of different sizes [
30,
31]; in the first stage, gas is injected into large and small pores simultaneously, and pores larger than 1 μ m are preferentially filled by the gas phase. In the second stage, the gas content in the macropores increases to its maximum value, mainly providing a gradual decrease in the pore size containing gas, which is manifested on the curve as a leftward shift in peak values.
There are certain differences between the samples from the two regions during the gas–water charging process [
32,
33]. The pore size is divided into six nodes, namely 0.001 μm, 0.01 μm, 0.1 μm, 1 μm, 10 μm, and 100 μm, and divided into seven pore size sets; the gas content of different pore sizes is accumulated to obtain
Figure 9. The samples in the Yongqian area mainly form a bimodal form. When the gas drive pressure is 8–12 MPa, pores larger than 1 μm are completely filled with gas and reach saturation. Then, pores of 0.01–1 μm enter the gas synchronously until the shale gas saturation reaches its peak. In the gas saturation state, the main gas contribution is provided by pores of 0.1–10 μm. The samples in the Qiulin area mainly exhibit a unimodal form, with pores larger than 1 μm completely filled with gas and reaching saturation. The gas drive pressure is generally close to 3.5 MPa. When the gas drive pressure increases to between 5.5 and 7 MPa, pores smaller than 0.01 μm in the sample are completely filled with gas. Subsequently, pores smaller than 0.1 μm are filled with gas until saturation is reached. In the gas saturation state, the main gas contribution is provided by pores between 0.01 and 1 μm.
Based on the above nuclear magnetic resonance gas–water injection simulation experiment data, the gas–water changes in tight sandstone can be obtained. The gas–water injection ratio is characterized by the percentage of water present in the rock reservoir to the total pore volume under the maximum gas drive pressure, which is used to characterize the gas–water injection characteristics and the gas-containing pore ratio between different samples (
Table 3). See Formula (4).
In Equation (4), I represents the maximum gas drive ratio in the gas–water injection simulation; represents the area enclosed by the gas-containing curve and the x-axis at the maximum gas driving pressure; and represents the area enclosed by the water content curve of the sample after saturation with water and the x-axis.
According to the above calculation data, the overall index I ranges from 0.46 to 0.69, with an average of 0.60. The following understanding has been reached: firstly, the larger the T
2 cut-off value within the same research area, the smaller the ratio I of gas-containing pores. Secondly, the porosity of the samples in the Yongqian area is significantly higher than that in the Qiulin area, as shown in
Figure 6. The saturation water curve of the nuclear magnetic resonance of the samples in the Yongqian area is significantly to the right compared to the samples in the Qiulin area, and there is no significant correlation between the porosity of the tight sandstone samples and the gas–water charging characteristics. Thirdly, the displacement efficiency is highly similar to the value I that characterizes the gas–water injection characteristics, and there is a coupling between the two.
4.3. Main Control Factors for Natural Gas Injection
4.3.1. Analysis of Nuclear Magnetic Resonance Single-Fractal Model
Mainly using an NMR singlet fractal to characterize the heterogeneity characteristics of pores, T
2 cut-off values are divided into different stages, and the total pore D
(total pore) and singlet fractal dimension D
(I) containing pores of tight sandstone are calculated (
Figure 10,
Table 4) to characterize their heterogeneity characteristics. The fractal dimension values are generally between two and three, and the closer the value is to three, the stronger the pore heterogeneity, and the closer it is to two, the weaker the pore heterogeneity [
34,
35,
36].
Overall, the total pore heterogeneity of the sample is relatively weak, with a fitting calculation D
(total pore) ranging from 1.93966 to 2.9129 and an average correlation R
2 of 0.5361, indicating a weak correlation. The heterogeneity of gas-containing pores is strong, with a fractal dimension D
(I) ranging from 2.8677 to 2.9615. D
(total pore) and D
(I) are positively correlated with the burial depth of the sample, with correlation R
2 values of 0.9524 and 0.7238, respectively (
Figure 10). This indicates that as the depth increases, the pore heterogeneity becomes stronger, and the correlation between D
(total pore) and the burial depth of the sample is higher than that of D
(I). The endogeneity of the pores containing air can represent the endogeneity of the total pore, and the stronger the endogeneity of the pores containing air, the stronger the overall pore endogeneity.
There is no coupling relationship between the total pore volume heterogeneity and mineral composition content. The gas-containing pore heterogeneity is influenced by quartz and feldspar and is positively correlated with the total pore volume (
Figure 11). This is manifested in the following aspects: firstly, the correlation between D
(total pore) and mineral composition content is poor. Secondly, there is a positive correlation between D
(total pore) and D
(I). Thirdly, as the quartz content increases, D
(I) increases and the heterogeneity of gas-containing pores increases, while the feldspar content increases, D
(I) decreases, and the heterogeneity of gas-containing pores weakens. Among the other parameters, D
(total pore) is only negatively correlated with sample porosity, with a correlation R
2 of 0.7595. D
(I) is coupled with NMR displacement efficiency, sample porosity, and bound water proportion, showing a negative correlation with the first two and a positive correlation with the latter, with correlation R
2 values of 0.796, 0.7627, and 0.7627, respectively.
As the burial depth of the rock increases, the quartz content increases and the feldspar content decreases, the permeability of the rock shows a decreasing trend, and the proportion of bound water in the rock shows an increasing trend. The water in the pores is not easily driven out of the rock reservoir, which is not conducive to the migration and accumulation of natural gas. This phenomenon indicates that quartz can serve as a skeleton to support pores and form intergranular pores, as well as block existing pores and fill them, resulting in a decrease in rock permeability (
Figure 11).
4.3.2. Occurrence Characteristics of Gas and Water in Pores
Through the multifractal singular spectrum of the typical sample singular spectrum function (a) and singular spectrum intensity a (
Figure 12), it can be seen that the singular spectrum distribution is left-hooked, indicating that high-porosity pores control the heterogeneity of the pore structure. In this study, the size of high-porosity pores in the sample was mainly distributed between 0.1 and 10 μm, and it also indicates that providing gas-containing pores controls the heterogeneity of the pore structure.
Based on the typical sample singular spectrum function f(a) and singular spectrum intensity a, the multifractal singular spectrum (
Figure 12) can be used to calculate the H and ∆ a parameters. H represents pore connectivity, and the closer it is to one, the better its pore connectivity. ∆a is the width of the singular spectrum, reflecting the degree of heterogeneity in pore size and distribution. The higher the value, the stronger the heterogeneity in the pore structure. The calculated H and singular spectrum width ∆a are shown in
Table 4.
The sample H in the Yongqian area is generally distributed between 0.84 and 0.86, and ∆a is greater than 7.37, indicating that the pore size and distribution heterogeneity of the tight sandstone reservoir are strong, the pore connectivity is good, and there are good natural gas migration channels. The values of H and ∆a in the samples from the Qiulin area have a large range of variation, with only the QL22-4 sample showing characteristic values approaching those of the samples from the Qiulin area. Analyzing the influence of reservoir characteristic parameters on H and ∆a (
Figure 13, it was found that they are only coupled with reservoir burial depth, and the R
2 is between 0.5 and 0.55. The overall trend is that as the burial depth increases, H shows an upward trend and ∆a shows a downward trend. This is manifested as the pore connectivity of tight sandstone samples first improves and then deteriorates, and the heterogeneity of the pore size and distribution becomes stronger.
5. Conclusions
This article takes nine tight reservoir rock samples from the Xujiahe Formation in the northwest–central Sichuan Basin as the research object. Through nuclear magnetic resonance natural gas injection experiments, the characteristics and influencing factors of gas–water changes in their pores were explored.
We have found the following conclusions that are helpful for the exploration and development of tight sandstone in the Xujiahe Formation: Firstly, there are similarities in the process of natural gas filling. With the increase in filling pressure difference, the gas saturation provided by 0.01–10 μm pores gradually increases and finally reaches the maximum gas saturation. Secondly, there are regional differences in the size of gas-bearing pores, which need to be specifically described in the process of exploration and development. The gas saturation of the YQ sample is mainly provided by 0.1–10 μm pores, and that of the QL sample is 0.01–1 μm pores. Thirdly, the larger the pore volume, the higher the gas saturation, which is more conducive to the occurrence and migration of natural gas in tight sandstone reservoirs. Finally, the secondary enlargement and fragmentation of quartz and the swelling of clay minerals will block the pore space, and feldspar may be the dominant mineral for gas accumulation in tight sandstone reservoirs.
The remaining findings are as follows:
The charging pressure of 15 MPa can meet the gas saturation pressure of most tight sandstone samples. In the process of natural gas charging, pores larger than 1 μm are saturated first, and the saturation pressure fluctuates with the geological conditions of the samples, ranging from 8 to 12 MPa for samples in the Yongqian area and 3.5 MPa for samples in the Qiulin area.
Mineral composition, pore type, structural characteristics, and physical properties cooperatively control the natural gas charging characteristics, and porosity and permeability are the main controlling factors. The quartz content of tight sandstone in the Xujiahe Formation in the Sichuan Basin is between 39.8 and 68.9%, with an average of 58.2%, and the clay content is between 12.8 and 19.3%, with an average of 16.1%. With the increase in burial depth, the quartz content increases, the feldspar content decreases, the rock permeability decreases, and the proportion of bound water increases, which is not conducive to natural gas migration. The pore volume of 2–100 nm small-sized pores in the sample is mainly provided by 3–5 nm pores, and the pore types are mainly parallel plate-shaped cracks and ink bottle-shaped pores with good pore connectivity, which is beneficial to natural gas migration. The types of throats are mainly sheet throats and tubular throats, with a small number of throats with reduced pores or constricted throats, some of them being oval or long, and the overall pore size is small, which is a good natural gas reservoir.
The gas-bearing pore heterogeneity of tight sandstone in the Xujiahe Formation in the Sichuan Basin is strong (gas-bearing fractal dimension is between 2.8677 and 2.9615), which can represent the total pore heterogeneity of the sample. With the deepening of burial depth, the pore heterogeneity of tight sandstone shows an upward trend, which is not conducive to natural gas migration.
Author Contributions
Conceptualization, J.G. and S.H.; methodology, Z.X. and J.L.; investigation, Y.R.; data curation, R.Y. and D.G.; writing—original draft, Y.R.; writing—review and editing, S.H.; project administration, Z.X. and J.G. All authors have read and agreed to the published version of the manuscript.
Funding
This research was supported by the PetroChina Science and Technology Project (2021DJ06) and Supported by the Key Laboratory of Natural Gas Accumulation and Development (2023-KFKT-07).
Data Availability Statement
The original contributions presented in the study are included in the article, further inquiries can be directed to the corresponding author.
Acknowledgments
The editors and anonymous reviewers are gratefully acknowledged.
Conflicts of Interest
Authors Zengye Xie, Jianying Guo and Jian Li were employed by the Research Institute of Petroleum Exploration and Development and Key Laboratory of Gas Reservoir Formation and Development, China National Petroleum Corporation (CNPC). Author Rongjun Yang was employed by the PetroChina Research Institute of Petroleum Exploration and Development-Northwest and Research Center of Sichuan Basin, PetroChina Research Institute of Petroleum Exploration and Development. The remaining authors declare that the research was conducted in the absence of any commercial or financial relationships that could be construed as a potential conflict of interest. The China National Petroleum Corporation had no role in the design of the study; in the collection, analyses, or interpretation of data; in the writing of the manuscript, or in the decision to publish the results.
References
- Zeng, F.H.; Zhang, Y.X.; Zhang, Z.Z.; Qiao, J.; Wang, M.; Chen, D.; Yao, J.; Ding, J.; Xiong, L.; Liu, Y.; et al. Main controlling factors and distribution patterns of complex gas water relationships in tight sandstone gas reservoirs. Pet. Nat. Gas Geol. 2023, 44, 1067–1083. [Google Scholar]
- Law, B.E.; Dicknson, W.W. Conceptual model for origin of abnormally pressured gas accumulations in low-permeability reservoirs. AAPG Bull. 1985, 69, 1295–1304. [Google Scholar]
- Yao, P.; Zhang, J.; Lv, D.; Vandeginste, V.; Chang, X.; Zhang, X.; Wang, D.; Han, S.; Liu, Y. Effect of water occurrence in coal reservoirs on the production capacity of coalbed methane by using NMR simulation technology and production capacity simulation. Geoenergy Sci. Eng. 2024, 243, 213353. [Google Scholar] [CrossRef]
- Wang, T. China Deep Basin Gas Field; Petroleum Industry Press: Beijing, China, 2002. [Google Scholar]
- Law, B.E. Basin-centered gas systems. AAPG Bull. 2002, 86, 1891–1919. [Google Scholar]
- Xie, Z.Y.; Yang, C.L.; Li, J.; Jin, H.; Wang, X.; Hao, C.; Zhang, L.; Guo, J.; Hao, A. Charging simulation experiment and characteristics of tight sandstone gas reservoirs, A case study of the Upper Triassic Xujiahe Formation sandstone gas reservoir in the central Sichuan Basin. Nat. Gas Ind. 2020, 40, 31–40. [Google Scholar]
- Zheng, H.R.; Liu, Z.R.; Xu, S.L.; Liu, Z.; Liu, J.; Huang, Z.; Huang, Y.; Shi, Z.; Wu, Q.; Fan, L.; et al. Progress and research directions in the exploration and development of tight sandstone gas in the Xujiahe Formation of Sinopec Exploration Area in Sichuan Basin. Pet. Nat. Gas Geol. 2021, 42, 765–783. [Google Scholar]
- Tang, Y.J.; Xu, W.C.; Wang, X.J.; Pang, X.; Chen, S.; Zhang, X.; Sun, P. Hydrochemical characteristics and genesis of the Xujiahe Formation in Jianyang, central Sichuan Province, evidence from hydrochemistry and strontium isotopes. Block Oil Gas Field 2024, 31, 444–452. [Google Scholar]
- Li, A.F.; Ren, X.X.; Wang, G.J.; Wang, Y. Characterization of pore structure of low permeability reservoirs using a nuclear magnetic resonance method. J. China Univ. Pet. Ed. Nat. Sci. 2015, 39, 92–98. [Google Scholar]
- Zhou, X.; Jiang, Y.; Chen, L.; Lei, X.; Xiong, Z.; Yang, B. Study on Water Production Mechanism and Seepage Law of Susi Tight Sandstone Gas Reservoir. Petrochem. Appl. 2016, 35, 76–83. [Google Scholar]
- Li, W.; Zou, C.N.; Yang, J.L.; Kun, W.; Yang, J.J.; Wu, Y.Y.; Gao, X.H. Types of Gas Reservoirs and Main Controlling Factors for Enrichment and High Yield in the Xujiahe Formation of the Upper Triassic in the Sichuan Basin. J. Sedimentol. 2010, 28, 1037–1045. [Google Scholar]
- Liang, H.; Wen, L.; Ran, Q.; Han, S.; Liu, R.; Chen, K.; Di, G.; Chen, X.; Pei, Y. Structural evolution characteristics and oil and gas geological significance of the northern section of Longmen Mountain in Sichuan Basin. Pet. Explor. Dev. 2022, 49, 478–490. [Google Scholar]
- Zheng, M.; Jia, C.Z.; Wang, W.G.; Li, P.; Li, J.; Wu, X.; Zhang, Y. Relationship between structural evolution of marine superimposed basins and late stage oil fracturing and gas accumulation. Nat. Gas Geosci. 2015, 26, 277–291. [Google Scholar]
- Li, W.; Yi, H.Y.; Hu, W.S.; Wen, Z.; Li, Y. The Relationship between the Evolution of the Caledonian Uplift Structure and Oil and Gas Accumulation in the Sichuan Basin. Nat. Gas Ind. 2014, 34, 8–15. [Google Scholar]
- Mei, Q.H.; He, D.G.; Wen, Z.; Li, Y.; Li, J. Geological structure and tectonic evolution of the Leshan Longnusi ancient uplift in the Sichuan Basin. Acta Pet. Sin. 2014, 35, 11–25. [Google Scholar]
- Su, N.; Yang, W.; Dai, X.; Wang, X.D.; Wu, S.J.; Ma, S.Y.; Xie, W.R.; Zhang, G.R.; Pei, Y.W. Characteristics and Formation Mechanisms of Tensionally Twisted Faults in the Himalayan Period of the Sichuan Basin. Earth Sci. 2021, 46, 2362–2378. [Google Scholar]
- Guo, T.L.; Xiong, L.; Yang, Y.T.; Ye, S. Exploration from Reservoir, Source Rock to Conductor—Taking tight sandstone gas of Xujiahe Formation in Sichuan Basin as an example. Acta Pet. Sin. 2024, 45, 1078–1091. [Google Scholar]
- Zhang, W.K.; Shi, Z.J.; Tian, Y.M.; Wang, Y.; Hu, X.; Li, W. Pore types and genesis of tight sandstone in the Silurian Xiaoheba Formation in southeastern Sichuan. Lithol. Oil Gas Reserv. 2021, 33, 10–19. [Google Scholar]
- Guo, T.G.; Xiong, L.; Yang, Y.T.; Ye, S. Exploration of reservoirs, source rocks, and transmission lines, A case study of tight sandstone gas in the Xujiahe Formation of the Sichuan Basin. Acta Petrocnica Sin. 2024, 45, 1078–1091. [Google Scholar]
- Qiu, Y.C.; Xu, Q.; Li, Y.B.; Deng, W.; Zheng, C.; Zhao, Z.; Jin, Z.; Tan, X. Characterization of sand bodies and prediction of favorable reservoirs in the fourth member of the Upper Triassic Xujiahe Formation in the Tianfu area of the Sichuan Basin. Spec. Oil Gas Reserv. 2024, 31, 18–26. [Google Scholar]
- Thommes, M.; Kaneko, K.; Neimark, A.V.; Olivier, J.P.; Rodriguez-Reinoso, F.; Rouquerol, J.; Sing, K.S. Physisorption of gases, with special reference to the evaluation of surface area and pore size distribution (IUPAC Technical Report). Pure Appl. Chem. 2015, 87, 1051–1069. [Google Scholar] [CrossRef]
- Rouquerol, F.; Rouquerol, J.; Sing, K.S.W.; Llewellyn, P.; Maurin, G.; Denoyel, R.; Coulet, M.V.; Beurroies, I. Adsorption by Powders and Porous Solids, Principles, Methodology and Applications; Academic Press: Cambridge, MA, USA, 2013. [Google Scholar]
- Zhang, Y. Characteristics and main controlling factors of water vapor adsorption in marine shale in the Sichuan Basin, a case study of the Lower Silurian Longmaxi Formation shale in southern Sichuan. Pet. Nat. Gas Geol. 2022, 43, 1431–1444. [Google Scholar]
- Rouquerol, F.; Rouquerol, J.; Sing, K. Adsorption by Powders and Porous Solids; Elsevier: Amsterdam, The Netherlands, 2014. [Google Scholar]
- Everett, D.H.; Powl, J.C. Adsorption in slit-like and cylindrical micropores in the henry’s law region. A model for the microporosity of carbons. J. Chem. Soc. Faraday Trans. 1 F 1976, 72, 619–636. [Google Scholar] [CrossRef]
- Mahajan, O.P.; Walker, P.L. Water adsorption on coals. Fuel 1971, 50, 308–317. [Google Scholar] [CrossRef]
- Charriere, D.; Behra, P. Water sorption on coals. J. Colloid. Interface Sci. 2010, 344, 460–467. [Google Scholar] [CrossRef]
- Mccutcheon, A.L. Kinetics of water adsorption/desorption on bituminous coals. Energy Fuels 2001, 43, 233. [Google Scholar] [CrossRef]
- Mccutcheon, A.L.; Barton, W.A. Contribution of Mineral Matter to Water Associated with Bituminous Coals. Energy Fuels 1999, 13, 160–165. [Google Scholar] [CrossRef]
- Xiong, L.; Long, K.; Cao, Q.M.; Zhang, S.H. Reservoir-forming conditions and key technologies of exploration and development of multi-layer gas fields in western Sichuan Basin. Acta Pet. Sin. 2024, 45, 595–614. [Google Scholar]
- Qiao, J.C.; Zeng, F.H.; Xia, Y.X.; Cai, J.; Chen, D.; Jiang, S.; Han, G.; Cao, Z.; Feng, X.; Feng, S. Three dimensional visualization physical simulation of natural gas injection in micro nano pore networks. Pet. Explor. Dev. 2022, 49, 306–318. [Google Scholar] [CrossRef]
- Feng, D.; Li, X.; Wang, X.; Li, J.; Sun, F.; Sun, Z.; Zhang, T.; Li, P.; Chen, Y.; Zhang, X. Water adsorption and its impact on the pore structure characteristics of shale clay. Appl. Clay Sci. 2018, 155, 126–138. [Google Scholar] [CrossRef]
- Kim, C.; Devegowda, D. Molecular dynamics study of fluid-fluid and solid-fluid interactions in mixed-wet shale pores. Fuel 2022, 319, 123587. [Google Scholar] [CrossRef]
- Song, Z.Z.; Lv, M.Y.; Zhao, L.B.; Zhang, Y.; He, Y.; Jiang, F.; Yang, Z.; Chen, W.; Huo, L.; Wang, R.; et al. A permeability prediction model for tight sandstone based on fractal theory. J. Sedimentol. 2023, 41, 1847–1858. [Google Scholar]
- Dong, X.X.; Meng, X.Z.; Pu, R.H. Understanding of the occurrence characteristics of movable fluids based on fractal theory of pore throat systems in tight sandstone reservoirs. Nat. Gas Ind. 2023, 43, 78–90. [Google Scholar]
- Hu, J.H.; Ren, Q.F.; Yang, D.J.; Ma, S.W.; Shang, J.L.; Ding, X.T.; Luo, Z.Q. Cross scale characteristics of charging materials based on nuclear magnetic resonance and fractal theory. Trans. Nonferrous Met. Soc. China 2020, 30, 1347–1363. [Google Scholar] [CrossRef]
Figure 1.
A sedimentary overview and the studied stratigraphic distribution of the Xujia Formation in the Sichuan Basin (bar chart C modified according to [
3]).
Figure 1.
A sedimentary overview and the studied stratigraphic distribution of the Xujia Formation in the Sichuan Basin (bar chart C modified according to [
3]).
Figure 2.
Mineral composition of tight sandstone samples in the northwest–central Sichuan region. (a) Mineral composition; (b) Triangle diagram of rock mineral composition).
Figure 2.
Mineral composition of tight sandstone samples in the northwest–central Sichuan region. (a) Mineral composition; (b) Triangle diagram of rock mineral composition).
Figure 3.
Thin-section photos of tight sandstone samples in the northwest–central Sichuan region are required. (a,b) YQ regional sample; (c,d) QL regional sample.
Figure 3.
Thin-section photos of tight sandstone samples in the northwest–central Sichuan region are required. (a,b) YQ regional sample; (c,d) QL regional sample.
Figure 4.
Scanning electron microscopy photos of tight sandstone samples in the northwest–central Sichuan region are required.
Figure 4.
Scanning electron microscopy photos of tight sandstone samples in the northwest–central Sichuan region are required.
Figure 5.
Experimental results of high-pressure mercury injections (a,b,d,e) and low-temperature nitrogen adsorption (c,f,g,h) on tight sandstone samples in the northwest–central Sichuan region.
Figure 5.
Experimental results of high-pressure mercury injections (a,b,d,e) and low-temperature nitrogen adsorption (c,f,g,h) on tight sandstone samples in the northwest–central Sichuan region.
Figure 6.
The trend in displacement efficiency of tight sandstone samples in the northwest–central Sichuan region.
Figure 6.
The trend in displacement efficiency of tight sandstone samples in the northwest–central Sichuan region.
Figure 7.
The trend in water content variation in tight sandstone samples in the northwest–central Sichuan region.
Figure 7.
The trend in water content variation in tight sandstone samples in the northwest–central Sichuan region.
Figure 8.
The gas–water charging trend in tight sandstone samples in the northwest–central Sichuan region.
Figure 8.
The gas–water charging trend in tight sandstone samples in the northwest–central Sichuan region.
Figure 9.
Pore gas content ratio under different pressures.
Figure 9.
Pore gas content ratio under different pressures.
Figure 10.
Single-fractal calculations of tight sandstone samples in the northwest–central Sichuan region.
Figure 10.
Single-fractal calculations of tight sandstone samples in the northwest–central Sichuan region.
Figure 11.
Single-fractal correlation analysis of tight sandstone samples in the northwest–central Sichuan region.
Figure 11.
Single-fractal correlation analysis of tight sandstone samples in the northwest–central Sichuan region.
Figure 12.
Multifractal calculations of tight sandstone samples in the northwest and central Sichuan regions.
Figure 12.
Multifractal calculations of tight sandstone samples in the northwest and central Sichuan regions.
Figure 13.
A multifractal correlation analysis of tight sandstone samples in the northwest–central Sichuan region.
Figure 13.
A multifractal correlation analysis of tight sandstone samples in the northwest–central Sichuan region.
Table 1.
Low-temperature nitrogen adsorption information of tight sandstone samples in the northwest–central Sichuan region.
Table 1.
Low-temperature nitrogen adsorption information of tight sandstone samples in the northwest–central Sichuan region.
| Sample Number | Depth (m) | Pore Throat Radius (μm) | Skewness | Permeability
(10−3 μm2) | Porosity (%) | Mercury Withdrawal
Efficiency
(%) | Displacement
Pressure (MPa) |
|---|
Maximum
Value | Average
Value | Median |
|---|
| YQ7-8 | 2892.16 | 1.092 | 0.265 | 0.120 | 0.240 | 0.402 | 8.977 | 56.140 | 0.673 |
| YQ7-13 | 2896.43 | 1.092 | 0.262 | 0.125 | 0.260 | 0.358 | 8.148 | 47.807 | 0.673 |
| YQ7-26 | 2907.56 | 1.091 | 0.282 | 0.149 | 0.309 | 0.389 | 7.606 | 46.014 | 0.674 |
| YQ7-36 | 2911.22 | 1.091 | 0.207 | 0.032 | −0.209 | 0.201 | 9.211 | 62.761 | 0.674 |
| QL22-1 | 4252.34 | 0.268 | 0.066 | 0.009 | −0.574 | 0.007 | 3.448 | 68.656 | 2.746 |
| QL22-4 | 4255.40 | 1.091 | 0.151 | 0.022 | −0.302 | 0.056 | 6.499 | 65.310 | 0.674 |
| QL22-9 | 4260.35 | 1.089 | 0.193 | 0.095 | 0.188 | 0.144 | 6.912 | 51.486 | 0.675 |
| QL22-13 | 4264.67 | 0.357 | 0.114 | 0.099 | 0.445 | 0.055 | 6.766 | 46.690 | 2.057 |
| QL22-17 | 4268.54 | 0.358 | 0.065 | 0.013 | −0.438 | 0.014 | 8.736 | 75.073 | 2.054 |
Table 2.
High-pressure mercury injection information of tight sandstone samples in the northwest–central Sichuan region.
Table 2.
High-pressure mercury injection information of tight sandstone samples in the northwest–central Sichuan region.
| Sample Number | Depth
(m) | JBH | DFT | Mean Pore Size (nm) |
|---|
| Specific Surface Area (cm2/g) | Total Pore Volume (cc/g) | Specific
Surface Area (cm2/g) | Total Pore Volume (cc/g) | Mean Pore Size (nm) |
|---|
| YQ7-8 | 2892.16 | 2.044 | 0.00476 | 0.004 | 1.07 | 3.79 | 14.6559 |
| YQ7-13 | 2896.43 | 1.975 | 0.00354 | 0.004 | 1.20 | 3.79 | 12.8237 |
| YQ7-26 | 2907.56 | 2.416 | 0.00436 | 0.003 | 0.94 | 3.79 | 10.9926 |
| YQ7-36 | 2911.22 | 2.007 | 0.004032 | 0.004 | 1.47 | 3.79 | 9.8502 |
| QL22-1 | 4252.34 | 1.817 | 0.003784 | 0.003 | 1.11 | 4.15 | 10.1101 |
| QL22-4 | 4255.40 | 2.004 | 0.004508 | 0.003 | 1.11 | 3.97 | 11.9335 |
| QL22-9 | 4260.35 | 1.955 | 0.004311 | 0.003 | 1.03 | 4.15 | 12.0994 |
| QL22-13 | 4264.67 | 2.044 | 0.00476 | 0.003 | 1.15 | 3.79 | 13.171 |
| QL22-17 | 4268.54 | 1.975 | 0.00354 | 0.004 | 1.23 | 3.97 | 11.5731 |
Table 3.
Gas–water injection simulation data of tight sandstone samples in the northwest–central Sichuan region.
Table 3.
Gas–water injection simulation data of tight sandstone samples in the northwest–central Sichuan region.
| Sample Number | Saturated Water Signal Amount | Saturated Water Content (mL) | Nuclear Magnetic Porosity (%) | T2 Cut-Off Value (ms) | Displacement
Efficiency (%) | I |
|---|
| YQ7-8 | 56,201.33 | 1.4 | 8.52 | 3.4 | 61.68 | 0.62 |
| YQ7-26 | 54,608.09 | 1.3 | 7.49 | 3.62 | 59.81 | 0.60 |
| YQ7-36 | 52,580.22 | 1.3 | 7.85 | 2.19 | 68.87 | 0.69 |
| QL22-4 | 43,274.05 | 1.1 | 4.44 | 2.76 | 46.13 | 0.46 |
| QL22-9 | 58,368.74 | 1.5 | 6.05 | 1.55 | 63.78 | 0.64 |
| QL22-13 | 54,544.84 | 1.4 | 5.60 | 1.25 | 59.36 | 0.62 |
Table 4.
Gas fractal analysis data of tight sandstone samples in the northwest–central Sichuan region.
Table 4.
Gas fractal analysis data of tight sandstone samples in the northwest–central Sichuan region.
| Sample Number | D(I) | R2 | D(total pore) | R2 | H | ∆a |
|---|
| YQ7-8 | 2.8772 | 0.815 | 1.9328 | 0.5609 | 0.8445 | 7.378068 |
| YQ7-26 | 2.8847 | 0.82 | 1.9396 | 0.5572 | 0.85912 | 7.381416 |
| YQ7-36 | 2.8677 | 0.7875 | 1.9415 | 0.5561 | 0.85176 | 7.396439 |
| QL22-4 | 2.9346 | 0.7585 | 2.0005 | 0.5211 | 0.85504 | 7.01895 |
| QL22-9 | 2.8976 | 1.55 | 2.8976 | 0.7666 | 1.9874 | 0.5282 |
| QL22-13 | 2.9129 | 1.25 | 2.9129 | 0.6954 | 2.0097 | 0.5138 |
| Disclaimer/Publisher’s Note: The statements, opinions and data contained in all publications are solely those of the individual author(s) and contributor(s) and not of MDPI and/or the editor(s). MDPI and/or the editor(s) disclaim responsibility for any injury to people or property resulting from any ideas, methods, instructions or products referred to in the content. |
© 2024 by the authors. Licensee MDPI, Basel, Switzerland. This article is an open access article distributed under the terms and conditions of the Creative Commons Attribution (CC BY) license (https://creativecommons.org/licenses/by/4.0/).


 ,
, 


