Article

Multiscale Qualitative–Quantitative Characterization of the Pore Structure in Coal-Bearing Reservoirs of the Yan’an Formation in the Longdong Area, Ordos Basin

1
College of Earth Science and Engineering, Xi’an Shiyou University, Xi’an 710065, China
2
Shaanxi Key Laboratory of Hydrocarbon Accumulation Geology, Xi’an Shiyou University, Xi’an 710065, China
3
Chongqing Institute of Unconventional Oil and Gas, Chongqing University of Science and Technology, Chongqing 401331, China
4
PetroChina Research Institute of Petroleum Exploration and Development, Langfang 065077, China
5
Third Gas Production Plant of PetroChina Changqing Oilfield Co., PetroChina Changqing Oilfield Company, No. 3 Gas Production Plant, Ordos 150600, China
*
Author to whom correspondence should be addressed.
Processes 2024, 12(12), 2787; https://doi.org/10.3390/pr12122787
Submission received: 12 October 2024 / Revised: 1 December 2024 / Accepted: 4 December 2024 / Published: 6 December 2024

Abstract

:
Accurate characterization of coal reservoir micro- and nanopores is crucial in evaluating coalbed methane storage and gas production capacity. In this work, 12 coal-bearing rock samples from the Jurassic Yan’an Formation, Longdong area, Ordos Basin were taken as research objects, and micro- and nanopore structures were characterized via scanning electron microscopy, high-pressure mercury pressure, low-temperature N2 adsorption and low-pressure CO2 adsorption experiments. The main factors controlling coal pore structure development and the influence of pore development on the gas content were studied by combining the reflectivity of specular samples from the research area, the pore microscopic composition and the pore gas content determined through industrial analyses and isothermal absorption experiments. The results show that the coal strata of the Yan’an coal mine are a very important gas source, and that the coal strata of the Yan’an Formation in the study area exhibit remarkable organic and clay mineral pore development accompanied by clear microfractures and clay mineral interlayer joints, which together optimize the coal gas storage conditions and form efficient microseepage pathways for gas. Coalstone, carbonaceous mudstone and mudstone show differential distributions in pore volume and specific surface area. The general trend is that coal rock is the best, carbonaceous mudstone is the second best, and mudstone is the weakest. The coal samples’ microporous properties are positively correlated with the coal sample composition for the specular group, whereas there is no clear correlation for the inert group. An increase in the moisture content of the air-dried matrix promotes adsorption pore development, leading to increases in the microporous volume and specific surface area. CH4 adsorption in coal rock increases with increasing pressure, and the average maximum adsorption is approximately 8.13 m3/t. The limit of the amount of methane adsorbed by the coal samples, VL, is positively correlated with the pore volume and specific surface area, indicating that the larger the pore volume is, the greater the amount of gas that can be adsorbed by the coal samples, and the larger the specific surface area is, the greater the amount of methane that can be adsorbed by the coal samples. The PL value, pore volume and specific surface area are not correlated, indicating that there is no direct mathematical relationship between them.

1. Introduction

The Ordos Basin of China is rich in coal resources, which are widely distributed over geological ages. In the Paleozoic strata, coal is concentrated mainly in the Benxi Formation of the Carboniferous strata and the Taiyuan and Shanxi Formations of the Permian strata. In the Mesozoic strata, coal is distributed mainly in the Yan’an Formation of the Jurassic strata [1,2]. The coal seams of the Jurassic Yan’an Formation are widely distributed in the basin, especially in Inner Mongolia, Shaanxi, Ningxia and Longdong, where the resource reserves are particularly rich. These coal seams are roughly centered on the sedimentation center of the basin and show a ring-ribbon spatial distribution pattern, which closely fits with the overall depression pattern of the basin; thus, these seams have developed widely and in an orderly manner within the basin [3,4]. The development of the pore structure of rocks in different geological periods is influenced by various factors. For example, in Carboniferous clay rock, hydrogeological conditions significantly affect the formation of cracks and fissures, which in turn affects rock structure changes and permeability [5]. At the basin eastern edge area, the middle-rank coal is the most important, and significant production benefits have been achieved through the exploration and development of middle-rank coalbed methane (CBM), whereas the relatively limited knowledge of the gas production capacity of low-rank coal has long constrained the in-depth exploration and development of low-rank CBM resources in the basin. Coals of different ranks are affected by various factors, and coal rank increases with coalization degree. Low-rank coal has higher moisture content and lower volatile matter content [6]. Higher-rank coals are characterized by a lower moisture content, lower fixed carbon content, and higher volatile matter content and have higher gas content [7,8]. Furthermore, the microporosity of coals of higher ranks is more developed, and the medium and large pores are fewer, thereby favoring gas adsorption and storage [9,10]. Since the new century, China has attached great importance to the exploration and development of low-rank coalbed methane, and this strategic adjustment has helped achieve breakthroughs in high production in many areas of the southern edge of the Ordos Basin, indicating a huge potential for the exploration and development of coalbed methane resources in the basin. [11].
Coal is essentially a porous material with an intricate internal pore structure and a wide range of pore sizes from millimeters to nanometers, indicating a high degree of nonuniformity [12,13]. The adsorption, desorption, diffusion and seepage behavior of CBM in coalbeds are finely regulated by pores of different scales. The multiscale characteristics of these pores profoundly influence the storage and transport of CBM [14]. In view of this, in-depth analysis of the multiscale characteristics of the pore structure in coalbeds is of great scientific value and practical importance for accurately assessing the potential of CBM resources and guiding the formulation of exploration and development strategies. In recent decades, domestic and foreign researchers have made a series of important advances and achievements in the field of coalbed pore structure characterization and have developed three core methodologies based on microscopic imaging, fluid injection and nondestructive physical technologies [15,16,17,18]. Advanced image analysis methods, such as X-ray diffraction, scanning electron microscopy and computed tomography (CT), can intuitively reveal the geometric features, morphological diversity and connectivity of coal rock pore structures. However, although these methods have significant advantages in visualization, they are limited in providing pore size distribution data that have mathematical and statistical representativeness, which makes directly realizing high-precision quantitative assessment and analysis difficult [19,20,21,22]. The results of such studies are summarized in the following table. Fluid injection experiments, such as gas adsorption and piezometric mercury tests, have been widely performed and occupy an important position in the study of the pore structure because of their wide measurement range and high accuracy. However, these techniques are limited by their respective test principles, which result in significant differences in the pore scale range measured by each experimental method, and each technique can only effectively characterize the pore distribution within a specific scale range, making realization of a comprehensive and accurate portrayal of the overall pore structure of coal difficult [16,23,24,25]. With the help of nondestructive physical analysis techniques, the pore distribution within a specific scale range can be characterized, and the crystal architecture, pore network structure, pore morphology and porosity of coal can be studied without compromising the integrity of the samples. These techniques not only ensure the reusability of the samples after testing but also provide high-precision and high-resolution data, which enables comprehensive multidimensional and multiparameter characterization of the microscopic features of coal samples. However, these techniques are also limited by the imaging range, are limited to describing the distribution of pores in coal rock at a particular scale and cannot comprehensively show the overall features and complexity of the pore structure of coal rock [17,26,27,28]. In view of the above analysis, to determine the pore distribution of coal, the pore structure of coal must be analyzed. Thus, to achieve a more comprehensive and accurate quantitative description of the coal pore structure, the comprehensive application strategy of multiple methods must be explored and practiced to achieve more in-depth research results in the field of pore structure characterization.
The Jurassic Yan’an Formation in the Ordos Basin is rich in coal resources, which is the resource base of many important coal development and utilization bases in China. After decades of exploration, development and research, abundant coal and rock data have been accumulated, and related research mainly focuses on coal petrology and geochemical characterization of coal elements [4]. However, the multi-scale qualitative and quantitative study on the pore structure of coal-bearing rock series is still lacking. Among them, the pore distribution characteristics of coal rock and mud shale are different, the pores of different sizes of mud shale are relatively developed, and the pores of coal rock are mainly small holes [29]. There is a lack of systematic research on reservoir fractures, matrix physical properties, pore characteristics and their causes in Yan’an Formation coal measures in Longdong area of the Ordos Basin, which restricts the understanding of coalbed methane occurrence characteristics and the optimization of reservoir reconstruction technology. In this paper, samples from the Jurassic Yan’an Formation in Longdong area of the Great Ordos Basin are taken as the research object. According to the difference in the determination effects of different test methods on coal and rock pores, argon ion polishing–high-resolution field emission scanning electron microscopy (FE-SEM), low-pressure CO2 adsorption, low-temperature N2 adsorption and high-pressure mercury injection test methods were adopted. The pore structure characteristics of coal measures reservoir in the Yan’an Formation in the eastern Longdong region were systematically studied. At the same time, the vitrinite reflectance (Ro,max), maceral components and proximate analysis results for the supporting samples were measured, with an emphasis on the maturity of pore development at different scales, the influence of maceral components, moisture and ash yield were studied, and the pore structure characteristics of the Jurassic Yan’an Formation coal measures reservoir in the eastern Longdong region and its influence on gas content were discussed. The aim was to provide a reference and guidance for the exploration and development of coalbed methane in the Yan’an Formation in the Longdong area of the Ordos Basin.

2. Sample Collection and Methods

2.1. Sample Collection

The 12 samples examined in this study are from the Jurassic Yan’an Formation in the Longdong area of the Ordos Basin and include 9 coal samples, 1 carbonaceous mudstone sample and 2 mudstone samples (Figure 1). The geographic boundaries of the Yan’an Formation are roughly defined into south of Hongde, north of Hesheng, east of Sanqiao and west of Zhangqiao, and the area spans the two tectonic units of the Tianhuan Depression and Yishang Slope in the inner part of the basin. The Yan’an Formation is an important layer in petroleum exploration and development in the Mesozoic strata of the Ordos Basin [30] and was deposited mainly in the fluvial and lacustrine phases, with the bottom part of the formation being filled with sedimentary medium- and fine-grained quartz sandstones and the upper part of the formation containing medium- and fine-grained sandstones and dark mudstones sandwiched by coal seams. The sedimentary evolution process underwent three phases: the river sedimentary system of Yan 10, the river–lake delta sedimentary system of Yan 9–Yan 6 and the reticulated river–residual lake sedimentary system of Yan 4 + 5 [30]. The Yan’an Formation is divided into four sections and ten reservoir groups according to the lithology, rotation and logging curve characteristics.

2.2. Experimental Methods

First, the basic physicochemical properties of the collected samples were comprehensively evaluated through specular reflectance measurements, maceral composition and proximate analysis. To accurately analyze the multiscale distribution of the pore structures in the samples, HPMP, low-temperature N2 adsorption and low-pressure CO2 adsorption tests were comprehensively applied to examine the pores of the coal samples at different scales. In addition, the morphology and structural characteristics of the microscopic pores were further visualized via SEM. Finally, a high-pressure methane isothermal adsorption test was used to examine the gas content of the samples and effectively measure and quantify the methane gas adsorption capacity of the samples. The bulk rock samples were crushed and finely screened to produce samples of different particle size classes. Suitable bulk samples were selected for high-pressure mercury compression testing. Samples with particle sizes between 180 and 250 µm were allocated for gas adsorption capacity assessment, specular reflectance measurements and detailed maceral composition analysis. Samples with particle sizes down to 75 µm were selected for the proximate analysis. The specular reflectance measurements, maceral composition analysis and proximate analysis were performed in strict compliance with the relevant national standards (GB/T 6948-2008 [31], GB/T 8899-2013 [32] and GB/T 30732-2014 [33]). The series of experiments were completed at the Key Laboratory of Unconventional Oil and Gas of China National Petroleum Corporation (CNPC), which ensured the accuracy, reliability and standardization of the experimental data.
In this study, a 1 cm × 1 cm × 1 cm standard rock sample block was obtained via precision cutting and preparation, and it was sprayed with gold to enhance the electrical conductivity. Then, the sample was scanned with high precision at multiple magnifications via SEM technology to obtain detailed micromorphological images. For high-pressure mercury compression experiments, an AutoPore V fully automated mercury compression pore size analyzer from Mack was utilized to analyze the pore size distribution via the Washburn equation over a wide pressure range of 20~413 MPa, with a focus on the information of pores >50 nm to circumvent the inaccuracy of the high-pressure mercury compression method in the analysis of micropores and mesopores. Low-temperature liquid nitrogen adsorption experiments were carried out via an AutosorbiQ-MP analyzer of the Kantar Company, and based on the national standard GB/T 21650.2-2008 [34], the specific surface area, pore volume, pore size distribution and pore size distribution in the pore size range of 1.06~78 nm were calculated based on the nonlocal density functional theory (NLDFT) model according to the physical adsorption behavior of nitrogen on the sample surface. Low-pressure carbon dioxide adsorption experiments were also performed by using the AutosorbiQ-MP analyzer, following the national standard GB/T 21650.3-2011 [35], and the pore characteristics in the range of 0.3~1.5 nm were resolved by measuring the gas adsorption under different relative pressures and applying the NLDFT model. To evaluate the methane adsorption capacity of the coal samples, high-pressure methane isothermal adsorption experiments were carried out by using a Gravimetric Isotherm Rig 3 gravimetric isothermal adsorbent apparatus under strict compliance with the GB/T 19560-2008 [36] specification standards at a test temperature of 60°C and a maximum test pressure of 25 MPa, and accurate measurements of the methane adsorption characteristics were obtained. This comprehensive series of experiments provides solid data supporting an in-depth understanding of the pore structure of coal rock samples and their gas adsorption mechanism.

3. Results

3.1. Sample Basic Parameters

As an important index for evaluating the coal maturity and quality, the specular reflectance is often positively correlated with the degree of coalification. The results of the specular reflectance measurements, maceral composition analysis and proximate analysis of the samples from the study area are shown in Table 1. The specular reflectance of the coal samples of the Yan’an Group in the study area ranged from 0.49% to 0.97%, and most of the samples belonged to middle-low-rank coal. In terms of the maceral composition, vitrinite occupied a dominant position, with contents ranging from 35.5% to 70.8%, followed by inertinite, with contents ranging from 21.4% to 48.8%, and the exinite and minerals were more limited, with contents ranging from 0.4% to 6.9% and 3.8% to 25.5%, respectively, where clay minerals occupied a significant dominant position in the total mineral content and were accompanied by iron sulfide, carbonate and silicon oxide minerals dominating the total amount of minerals. The moisture content of the Yan’an Formation coal rocks in the study area ranged from 0.9% to 7.94% on an air-dried basis, with an average value of 4.55%, indicating that the moisture content was relatively low; the ash yields on an air-dried basis ranged from 4.55% to 23.03%, with an average value of 9.00%, which was considered a relatively low ash yield for the coal samples. The volatile matter yield on an air-dried basis ranged from 25.86% to 36.88%, with an average value of 31.21%. The volatile fraction yield of the coal samples was high, indicating that they have good combustion performance. The fixed carbon content of the air-dried samples ranged from 47.2% to 63.51%, with an average value of 55.24%, indicating that the fixed carbon content of the coal samples was high, and that the samples had a high calorific value, which is an important indicator of high-quality coal. The microscopic composition of the carbonaceous mudstone was dominated by minerals, with contents as high as 70.1%, and the contents of the specular, inert and crustal groups accounted for 17.5%, 8.0% and 4.4%, respectively. According to the industrial analysis results, the carbonaceous mudstone had a low air-dried basis moisture content of 1.04%, high ash and volatile matter yields of 55.06% and 18.78%, respectively, and a low fixed carbon content of 25.12%.

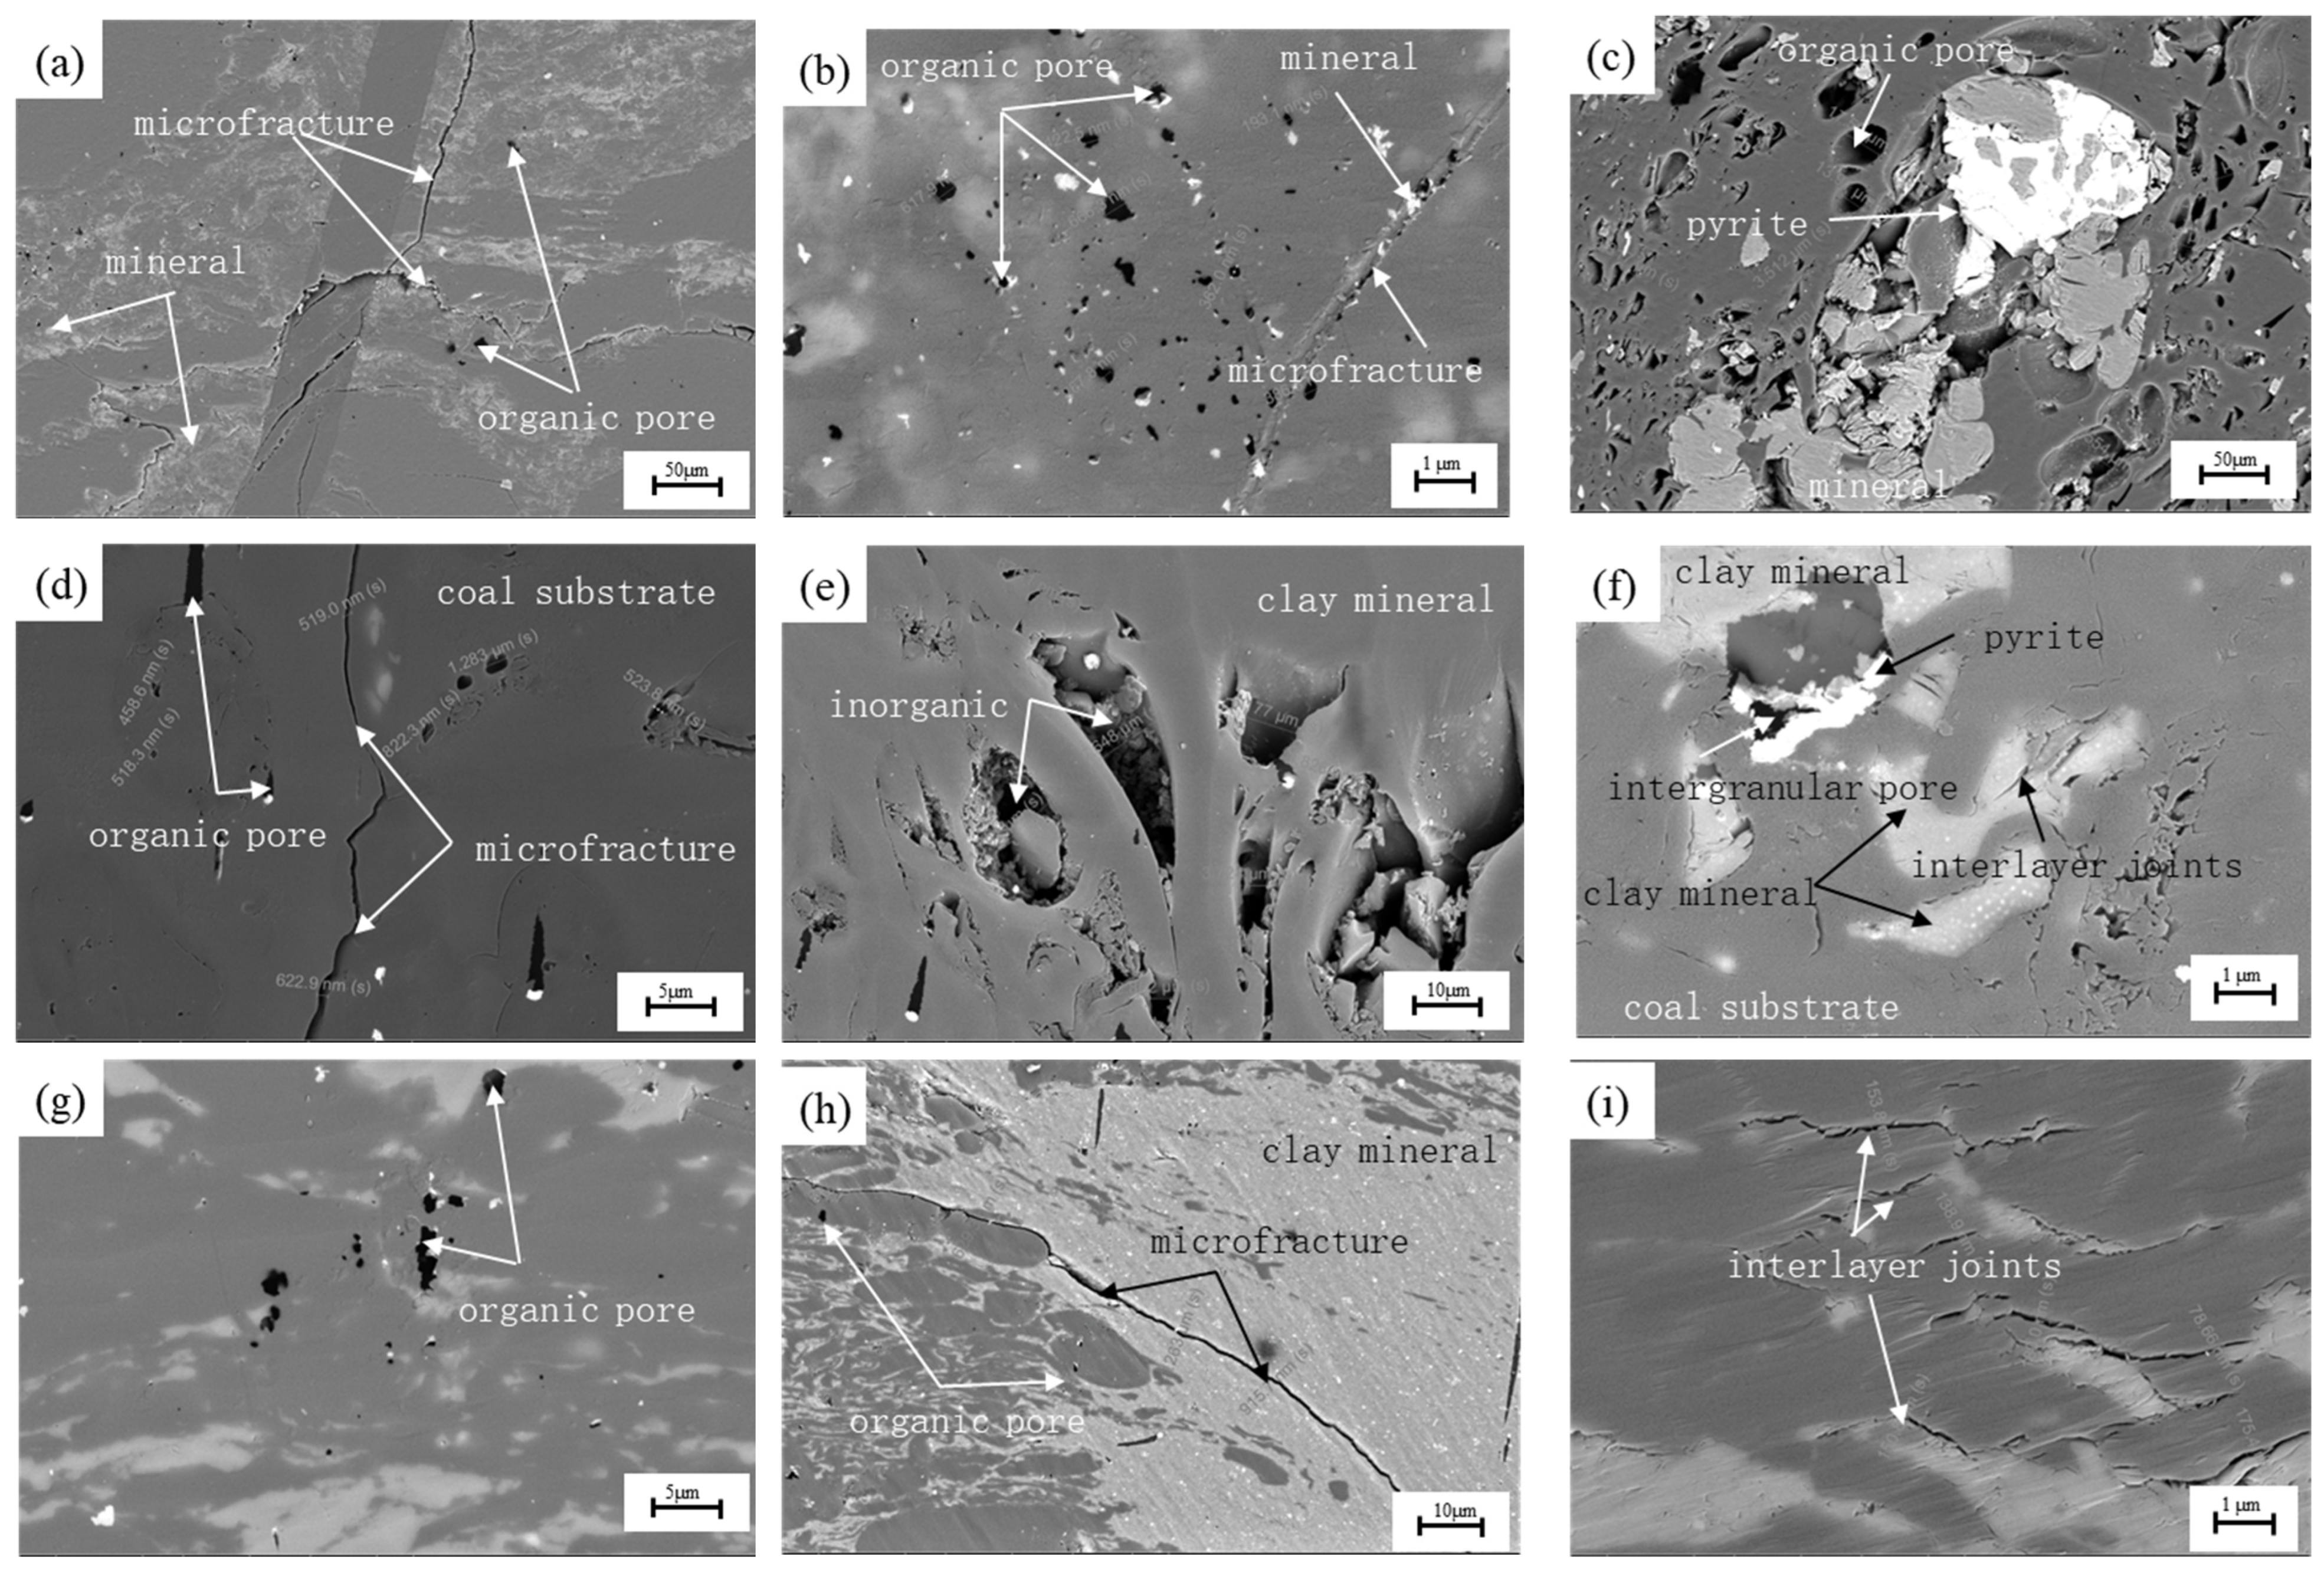
3.2. Qualitative–Semiquantitative Observation of the Pore Morphology

The pore development characteristics of the coal-bearing rocks of the Yan’an Formation in the study area are shown in Figure 2. According to the SEM experimental results, the development of organic matter in the samples from the study area was remarkable, which was characterized mainly by dipping and irregular distributions, and the development of organic matter in the coal rocks was significantly better than that in the mudstones (Figure 2a–i). Inside the organic matter of the coal rock, organic pore development was observed (Figure 2a–d), and nanoscale pores could be observed in local areas (Figure 2b,d), mostly pits, honeycombs, irregularities, etc., with a pore size distribution ranging from 193.1 nm to 17.59 µm. Some organic pores were filled with pyrite and clay minerals (Figure 2c). Pyrite was developed in the clay minerals, and wedge-like and elongated clay mineral interlayer joints could be observed (Figure 2e,f). In the mudstone, there were a few irregular organic pores, pyrite (Figure 2g), a few clay mineral pores and obvious wedge-like, wavy and elongated clay mineral interlayer joints (Figure 2i), with the spacing between joints ranging from 78.66 nm to 180 nm. In view of the remarkable adsorption capacity of organic matter, the widely distributed pore and fracture system in the organic matter constituted key gas storage sites in the coal system. In addition, the rich development of clay minerals not only expanded the gas storage capacity of the coal but also resulted in channels for effective seepage and transport of gas at the microscopic scale. In addition to the significant pore development, microfracture development was also widely observed in the samples, and microfractures were commonly found in the interior of the grains (Figure 2a,b,h) and organic matter (Figure 2d). These microfractures morphologically showed jagged and irregular curved shapes, and the cracks were sufficiently extensible and showed good connectivity. The widths of the fractures in the coal rock ranged from 519 nm to 622.9 nm, and the widths of the fractures in the mudstone ranged from 629.3 nm to 1.263 µm, with the lengths of the fractures being on the micrometer scale. The fissures in the coal rock were filled with minerals (Figure 2b), whereas the fissures in the mudstone were not filled (Figure 2h). Microfractures played crucial roles as seepage paths in the coal gas system, and they were not only the link between microfractures and macrofractures but also key parameters for assessing reservoir quality. Detailed SEM observations revealed that the cracks in the samples exhibited diverse morphological characteristics, and although their extension lengths usually did not span the entire observed section, these extensively developed microfractures significantly improved the fracturability of the reservoir and contributed to the formation of a complex fracture network system. This fracture network not only increased the natural gas storage capacity but also significantly enhanced the permeability of the reservoir, which had a positive effect on the overall reservoir recovery efficiency.

3.3. Quantitative Characterization of Pores

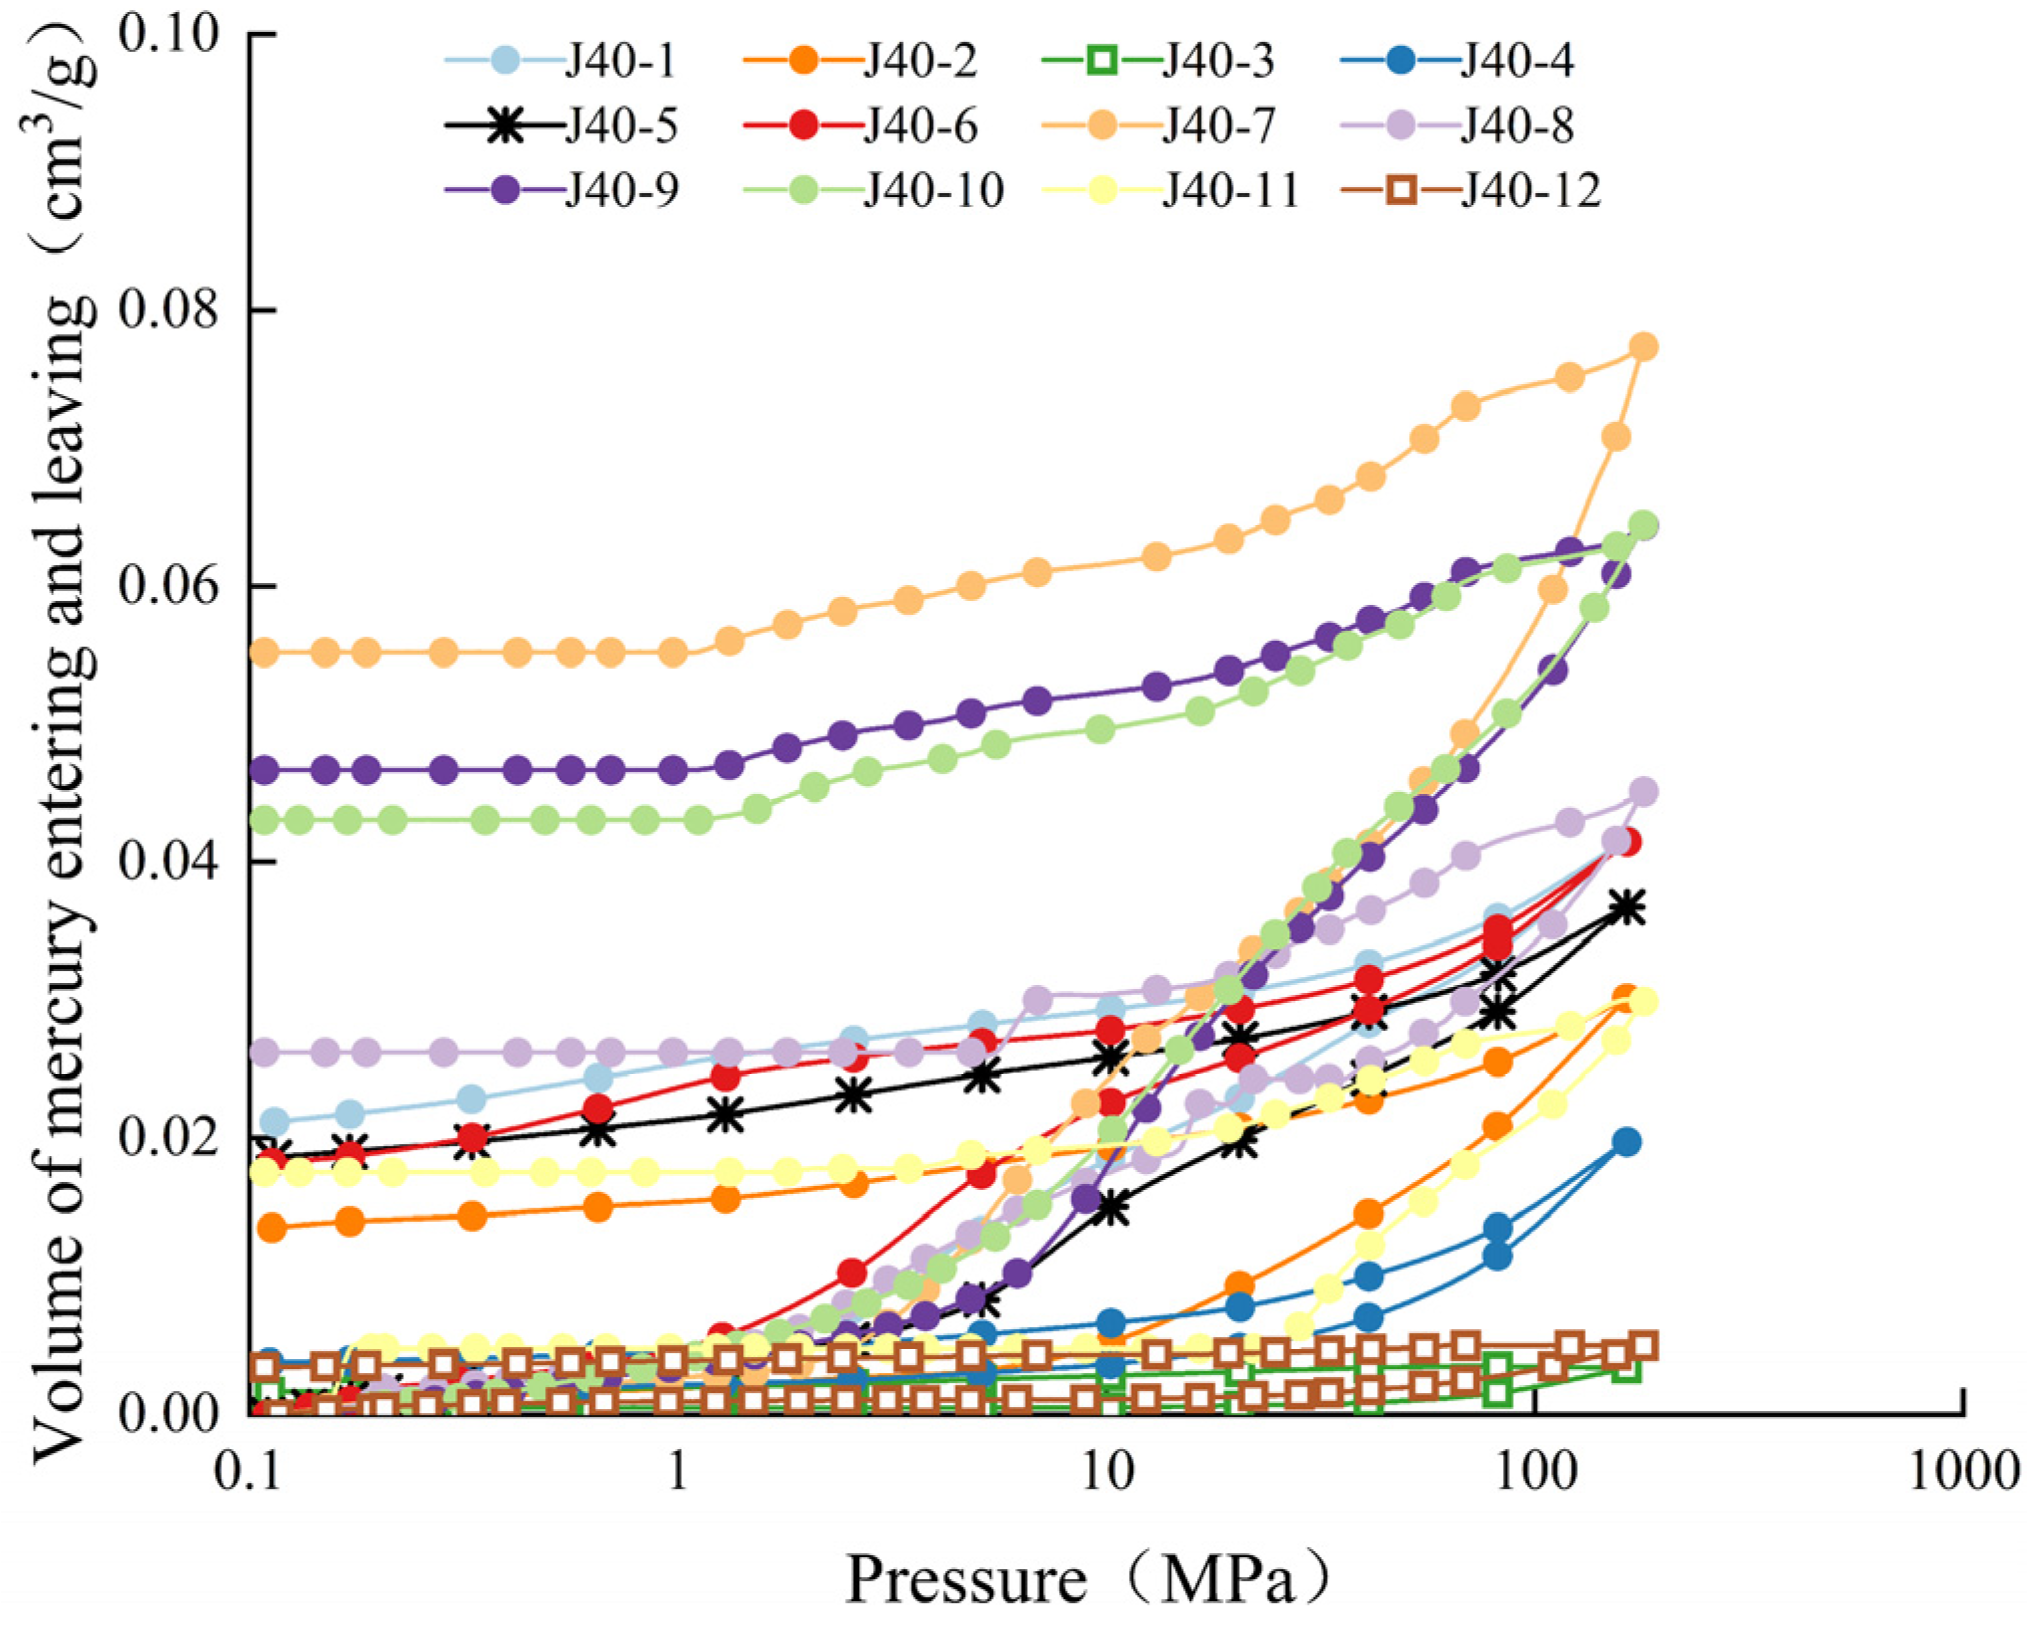
3.3.1. HPMP Experiments

The morphological characteristics of the curves obtained from the high-pressure mercury compression experiments effectively revealed the development state of the pore structure of each pore throat section and its connectivity characteristics. As shown in Figure 3, the Hg intrusion/Hg withdrawal curves of different coal-bearing rock samples from the Jurassic Yan’an Formation in the Longdong area of the Ordos Basin demonstrated hysteresis. The width of the hysteresis loop and the characteristics of the Hg intrusion/Hg withdrawal curves show that the hysteresis effects of different coal samples greatly varied, and the morphological characteristics of the Hg intrusion curves had a complex form involving the superposition of an approximate “S” shape and a reverse “S” shape. In the low-pressure range of 0.1–1 MPa, the samples exhibited a slow Hg intrusion process, which was related mainly to the development of pores with pore sizes ranging from 7 to 400 nm, which indirectly reveals that a small number of pores of this scale were present in the samples. When the pressure level approached and exceeded 1 MPa, the rate of Hg intrusion significantly accelerated until the peak of intrusion was reached under the maximum applied pressure conditions, indicating that macropores with sizes greater than 400 nm were widely present in the coal samples. The Hg withdrawal behavior of all the coal samples generally showed a significant decrease and then gradual stabilization, reflecting a medium efficiency of Hg withdrawal, which reveals that there were relatively open pore structures and a considerable proportion of semiclosed pores in the coal samples. The hysteresis loop width of carbonaceous mudstone was relatively small, and the characteristics of the Hg intrusion curve were similar to those of coal rock, with a gradual decrease in the Hg withdrawal curve. In the low-pressure stage, the Hg intrusion rate for carbonaceous mudstone was slow, and when the pressure reached 1 MPa, the Hg intrusion rate increased, which indicates that most macropores were larger than 4 µm in carbonaceous mudstone and that the pores were mainly semiopen pores. The Hg intrusion curve of the mudstone samples was flat for a long time until the pressure increased to 10 MPa, and the Hg withdrawal curve almost coincided with the Hg intrusion curve, suggesting that open pores larger than 6 µm had mainly developed in the mudstone samples.
As shown in Figure 4, the pore volume and pore specific surface area distribution curves were obtained via HPMP experiments. The pore size distribution of the coal samples shows an approximately bimodal configuration, with the peaks mainly distributed at 6~15 nm and 55–300 nm, indicating that the intermediate pores and macropores of the coal samples from the Yan’an Formation in the study area were significantly developed. The specific surface area of the coal samples was characterized mainly by a single peak, and the pore densities were densely distributed in the range of 1–14 nm, which suggests that the specific surface area of the Jurassic Yan’an Formation coal samples from the study area was supplied mainly by mesopores with pore diameters ranging from 7 to 14 nm. The pore size distribution of the carbonaceous mudstone of the Yan’an Formation showed a bimodal phenomenon, mainly around 7 nm and 122 nm, indicating that the carbonaceous mudstone had developed mesopores and macropores. The specific surface area of the carbonaceous mudstone shows an obvious single peak, and the pore size is distributed mainly in the range of 7–30 nm, which suggests that the specific surface area of the carbonaceous mudstone in the study area was provided mainly by mesopores in the range of 7–30 nm. The pore sizes of the mudstone samples are mainly distributed around 7 nm, and mudstone is believed to mainly contain mesopores, which can be seen from the distribution curve of the specific surface area of the mudstone indicating that its specific surface area was mainly provided by mesopores of approximately 7 nm.
By applying the Washburn equation, the pore structure parameters of each coal, carbonaceous mudstone and mudstone sample were systematically calculated, as shown in Table 2. Based on the piezometric mercury test data, the total pore volume of the coal rock was calculated to range from 0.020 to 0.078 cm3/g, with an average value of 0.046 cm3/g, and the total specific surface area ranged from 3.934 to 14.017 m2/g, with an average value of 7.18 m2/g. The carbonaceous mudstone had a total pore volume of 0.037 cm3/g and a total specific surface area of 4.289 m2/g. The total pore volume of the mudstone ranged from 0.003 to 0.005 cm3/g, with an average value of 0.004 cm3/g, and the total specific surface area ranged from 0.772 to 1.148 m2/g, with an average value of 0.96 m2/g.

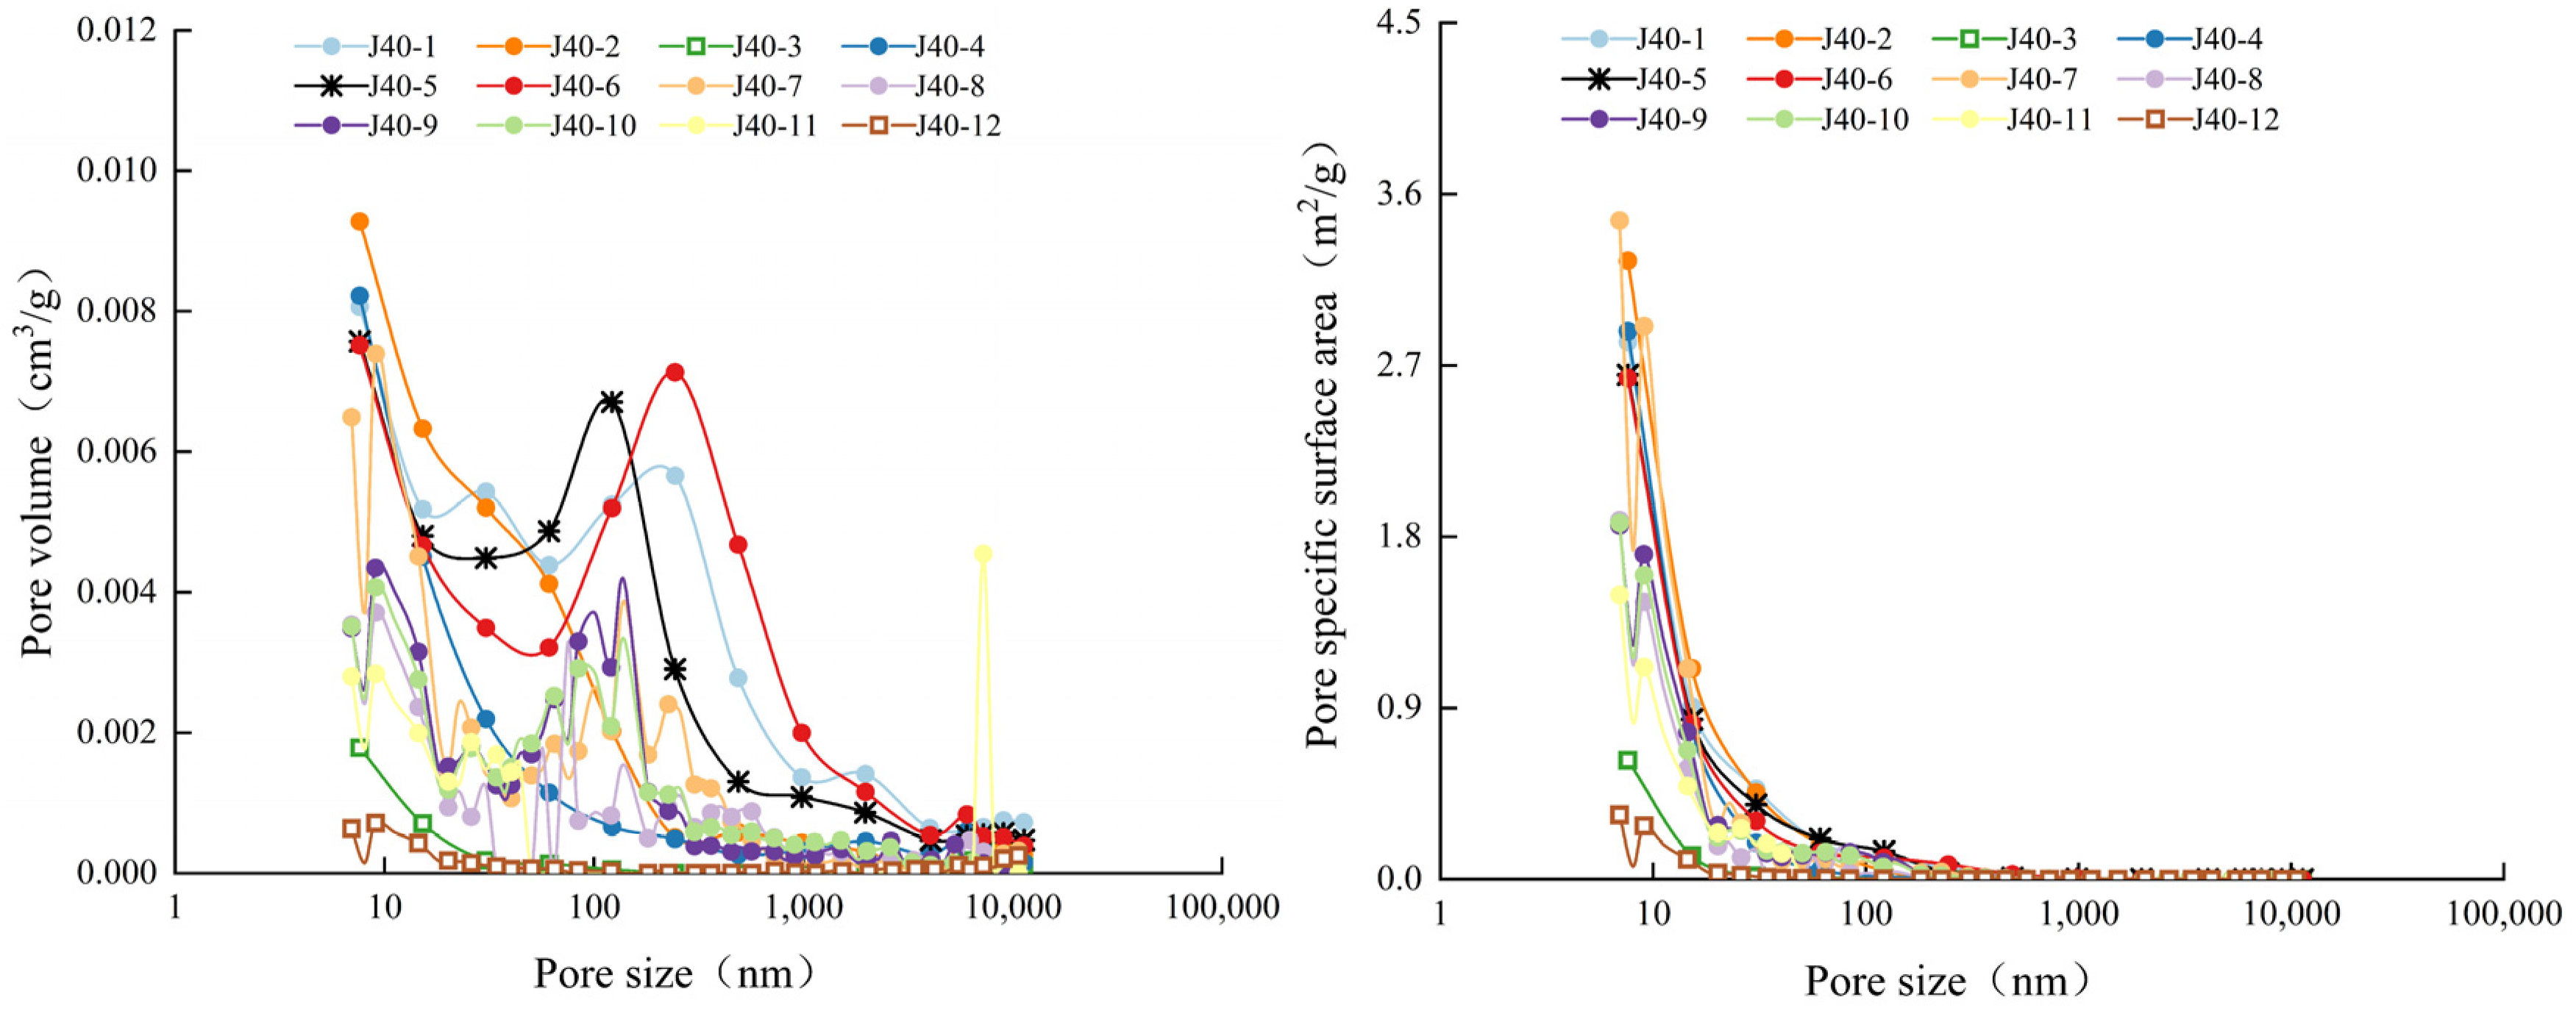
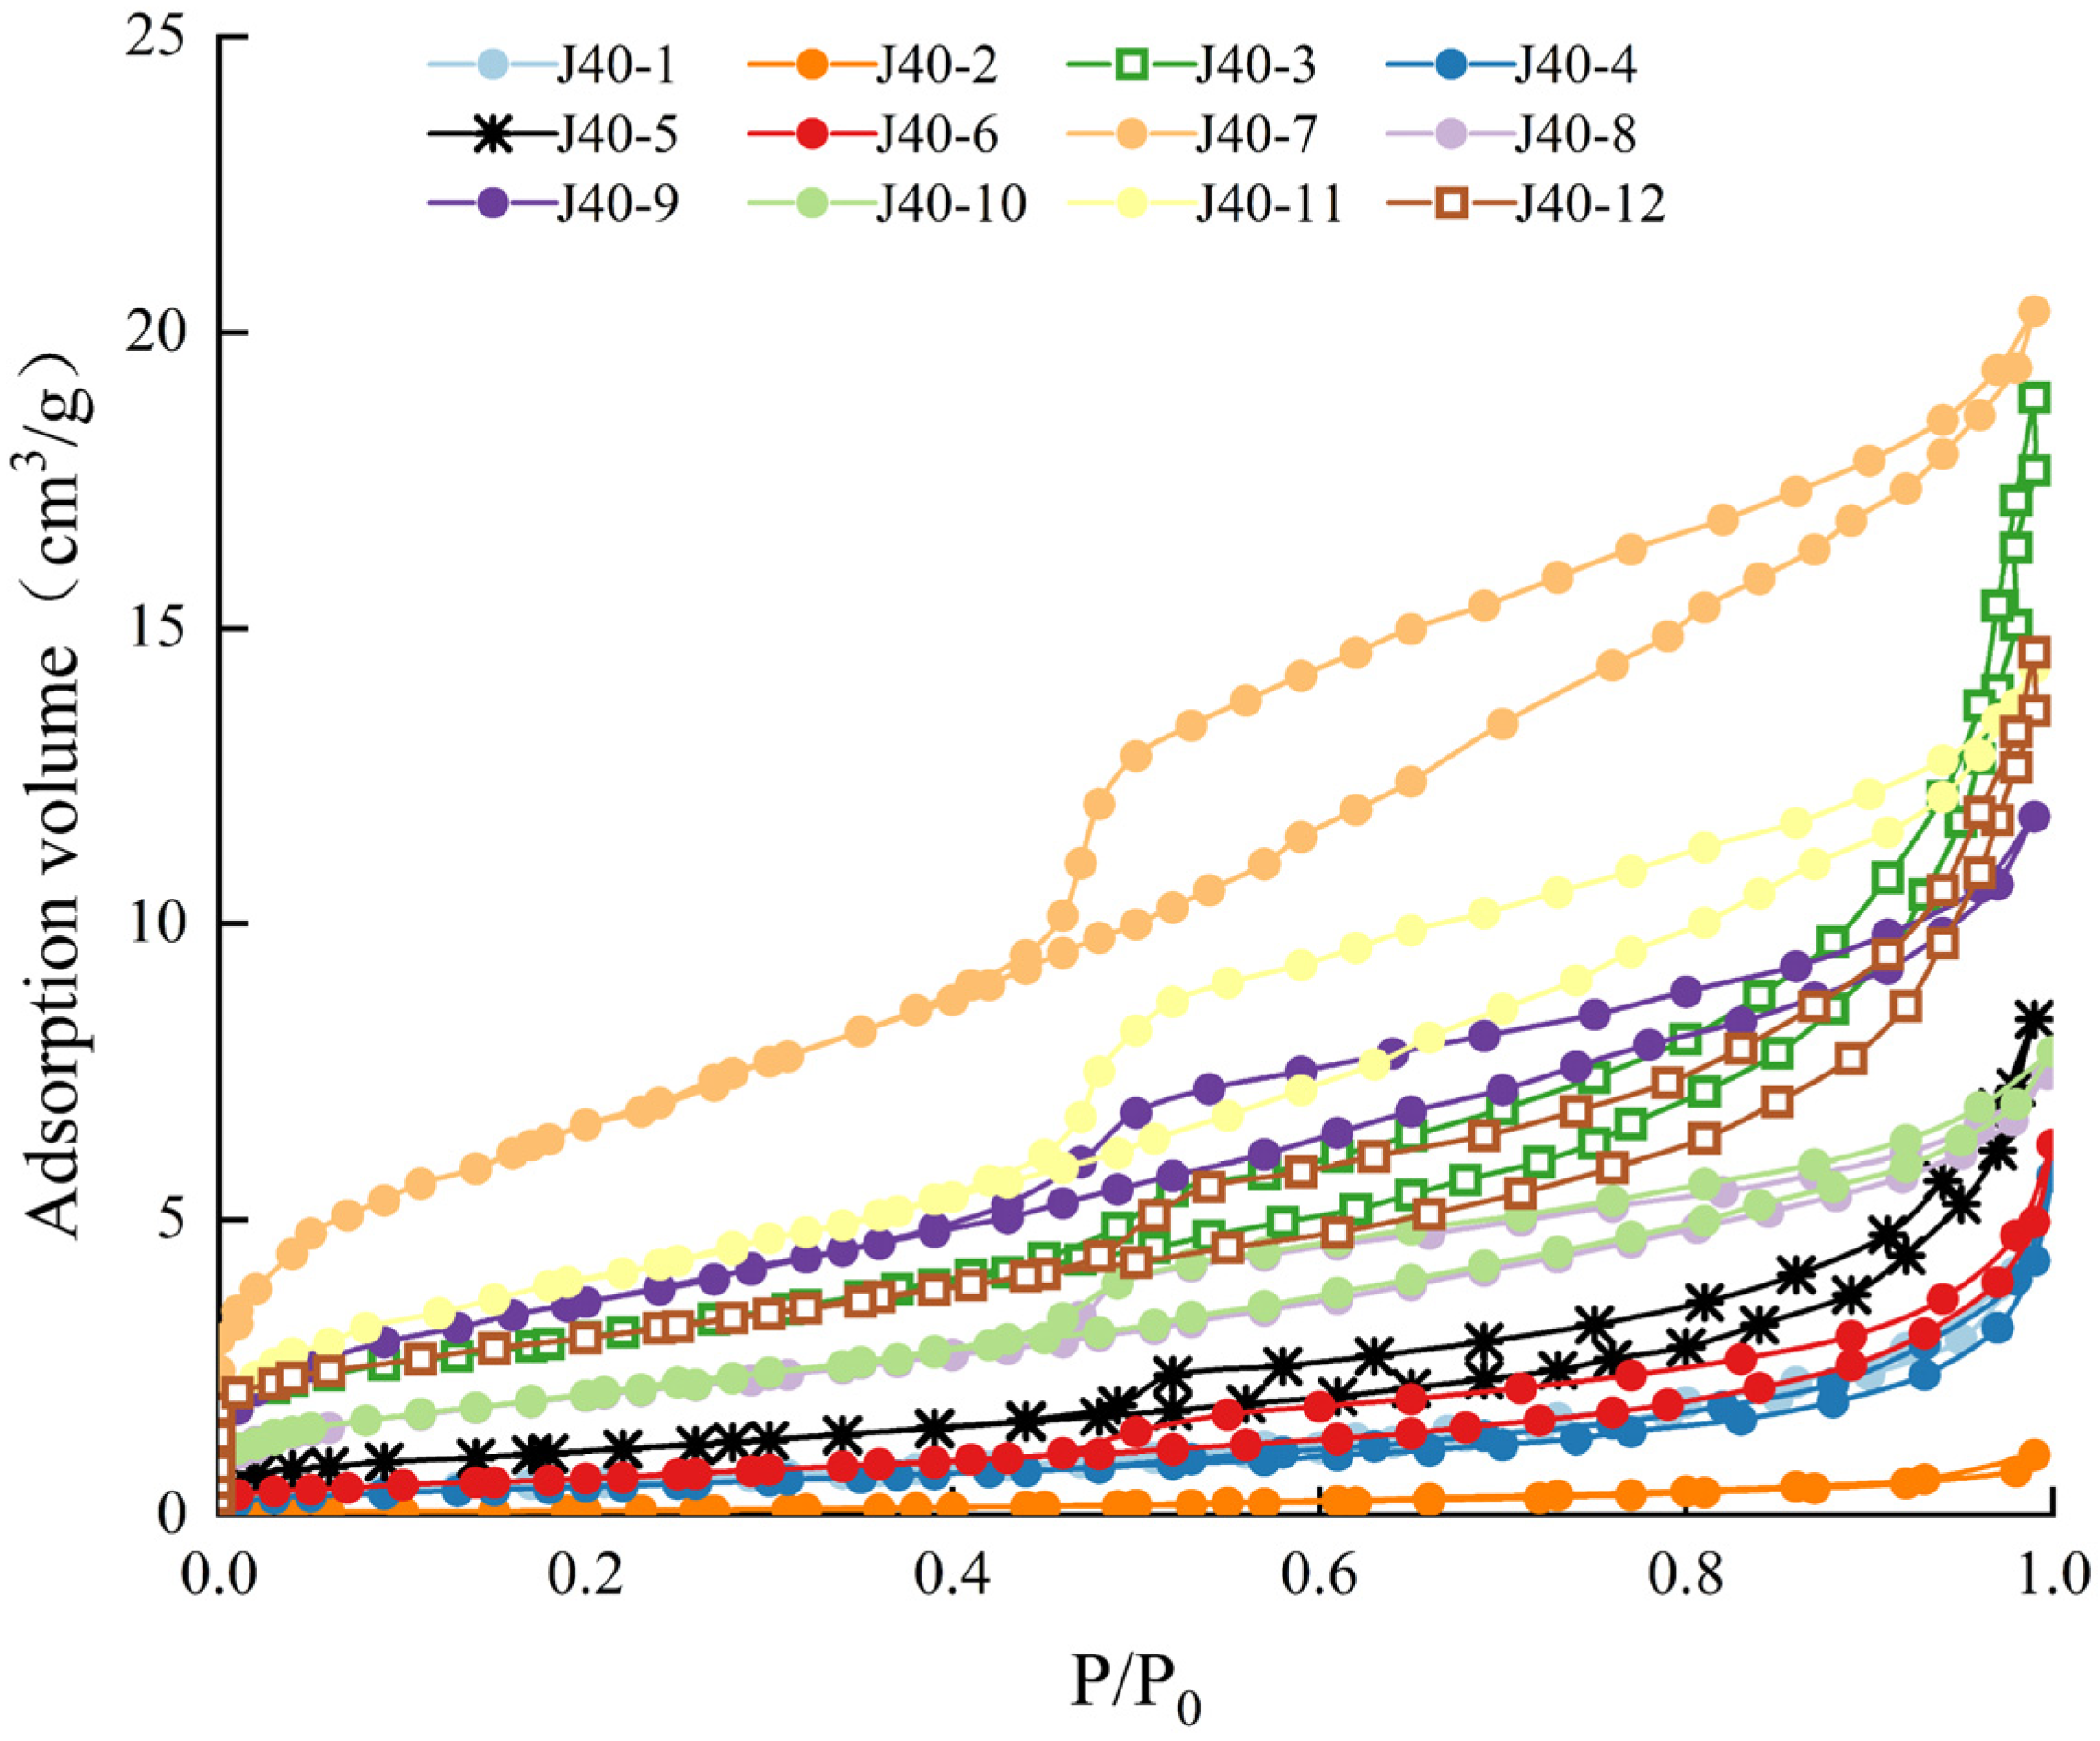
3.3.2. Low-Temperature N2 Adsorption Experiments

Owing to the limitations of the measurement range of the HPMP technique, it is insufficient for accurately characterizing the pore structure of coal samples with mesopores. Therefore, low-temperature N2 adsorption experiments were used to exhaustively characterize the development of mesopores in the coal samples. As shown in Figure 5, by analyzing the low-temperature N2 adsorption–desorption isotherms of coal-bearing rock samples from the Jurassic Yan’an Formation in the Longdong area of the Ordos Basin, the nitrogen adsorption amounts of the coal samples from the study area were found to range from 1.02 to 20.36 cm3/g. The adsorption curves as a whole exhibited a nearly inverted S shape, and the adsorption curves of the coal samples from this study area are classified as type II according to the IUPAC classification. Due to the strong interaction between the adsorbent and the surface, the adsorption amount immediately showed a significant upward trend, and the isotherm showed an upward convex pattern at P/P0 < 0.05, which is the turning point of the isotherm. After the turning point of the isotherm, as the relative pressure continued to increase, the adsorption curve gradually increased, which indicates that the N2 molecules gradually transitioned from monolayer adsorption mode to the multilayer adsorption state [37,38]. The adsorption curve then gently increased. When P/P0 approached 1, the curve sharply increased, implying that the number of adsorbed layers tended to be infinite, but the sample still had not reached saturation adsorption, which reveals the occurrence of capillary pore condensation during the adsorption process, indicating that the sample contained a certain proportion of large pores. For the desorption process, when P/P0 > 0.5, the desorption branch was clearly located above the adsorption branch, forming a hysteresis loop. When P/P0 ≈ 0.5, the desorption curve rapidly decreased, and after this turning point, the adsorption and desorption curves nearly coincided, indicating that the desorption process significantly changed near this point, from multilayer adsorption to monolayer or fewer layer adsorption. The nitrogen adsorption capacity of the carbonaceous mudstone of the Yan’an Formation in the study area was approximately 8.38 cm3/g, and its N2 adsorption–desorption isotherm exhibited typical type II characteristics according to the IUPAC classification standards. The curve showed a slightly upward convex trend in the early stage, indicating the transition from monomolecular layer to multimolecular layer adsorption; the middle section smoothly increased, clearly indicating the dominance of multimolecular layer adsorption. The end section sharply increased, especially when the relative pressure approached 1. The curve sharply increased due to the significant effect of the capillary condensation effect, and the equilibrium state of adsorption saturation was not observed, which reveals that a significant macroporous structure existed in the samples. During the desorption process, when P/P0 > 0.5, the desorption branch was obviously located above the adsorption branch, forming a hysteresis loop, and when P/P0 reached the critical point of approximately 0.52, the desorption curve rapidly decreased and then basically coincided with the adsorption curve. The nitrogen adsorption of the mudstone samples from the study area ranged from 14.59 to 18.59 cm3/g; the adsorption curve first sharply increased and then steadily increased, and the curve sharply increased when P/P0 reached 1. Based on the IUPAC classification system, the N2 adsorption–desorption isotherm of this type of mudstone can also be categorized as type II. The desorption curve of the mudstone always remained above the adsorption curve at P/P0 > 0.5, and when P/P0 reached approximately 0.53, the curve rapidly decreased and eventually nearly coincided with the adsorption curve.
Hysteresis loops are important phenomena in adsorption isotherms, reflecting the incomplete reversibility of the capillary condensation and evaporation processes of adsorbates within pore channels. Previous studies have suggested that the capillary condensation effect is the key factor driving the generation of hysteresis loops in open pores, whereas the formation of such hysteresis loops cannot be observed in semiopen pores. For the specific morphologies of ink-bottle-shaped pores, which also exhibit the ability to generate hysteresis loops, the curve shows a steep decrease during the desorption process; the inflection point clearly indicates the unique desorption behavior characteristics of ink-bottle pores [39,40,41,42]. Important information about the structural properties of the pores can be obtained by observing and analyzing the shape and position of the hysteresis loops. According to the IUPAC standard classification, the hysteresis loops of the coal samples from the study area were nearly H3-type and partly nearly H4-type, indicating complex pore superposition characteristics. When P/P0 < 0.5, the adsorption and desorption curves nearly coincided, indicating that the pore types were dominated by wedge-, plate- and cone-shaped semiopen pores; when P/P0 was relatively large, the hysteresis loop phenomenon was significant, and the desorption curves of all the coal samples turned within the relative pressure range from 0.5 to 0.6, implying that the ink-bottle pore structure widely existed in the coal samples. The hysteresis loop characteristics of the carbonaceous mudstone of the Yan’an Formation were similar to those of the H3-type loop, and the adsorption and desorption curves almost overlapped when the relative pressure was low. When the relative pressure was high, a hysteresis loop was present, and the desorption curve began to rapidly decrease at P/P0 = 0.52, suggesting that various types of pores, such as cylindrical, conical, parallel-plate-shaped and ink-bottle pores, existed in the carbonaceous mudstone. The hysteresis loop of the mudstone in the study area was characterized as H3-type, which also indicates a superposition of a variety of pores. When P/P0 < 0.45, the adsorption and desorption curves showed a high degree of overlap, and the pore type was dominated by semiopen pores; when P/P0 > 0.45, there was an obvious hysteresis loop and an obvious inflection point at a relative pressure of 0.54, which suggests that there were ink-bottle pores in the mudstone.
The pore structure parameters and pore diameter distribution characteristics of the samples from the study area were calculated via the NLDFT model, as shown in Figure 6, to obtain the pore volume and pore specific surface area distribution curves of the samples from the coal-bearing rock system measured via the low-temperature N2 adsorption method. Based on the N2 adsorption data, the DFT pore volume of the coal samples ranged from 0.006 to 0.029 cm3/g, with an average value of 0.013 cm3/g, and the average pore diameter ranged from 19.540 to 20.505 nm, corresponding to mesopore sizes. The DFT specific surface area of the coal samples ranged from 1.751 to 18.98 m2/g, with an average value of 6.78 m2/g. The DFT pore volume of the carbonaceous mudstones in the study area ranged from 0.001–0.005 cm/g, with an average value of 6.78 m/g. The DFT pore volume of the mudstone in the Yan’an Formation was 0.011 cm3/g, with an average pore diameter of 20.505 nm, and the DFT specific surface area was 3.481 m2/g. The mudstone of the Yan’an Formation had a DFT pore volume of 0.02–0.025 cm3/g, with an average value of 0.023 cm3/g, and an average pore diameter of 19.54 nm, all of which correspond to mesopore sizes. The DFT specific surface area of the mudstone was 10.749~11.315 m2/g, with an average value of 11.032 m2/g.

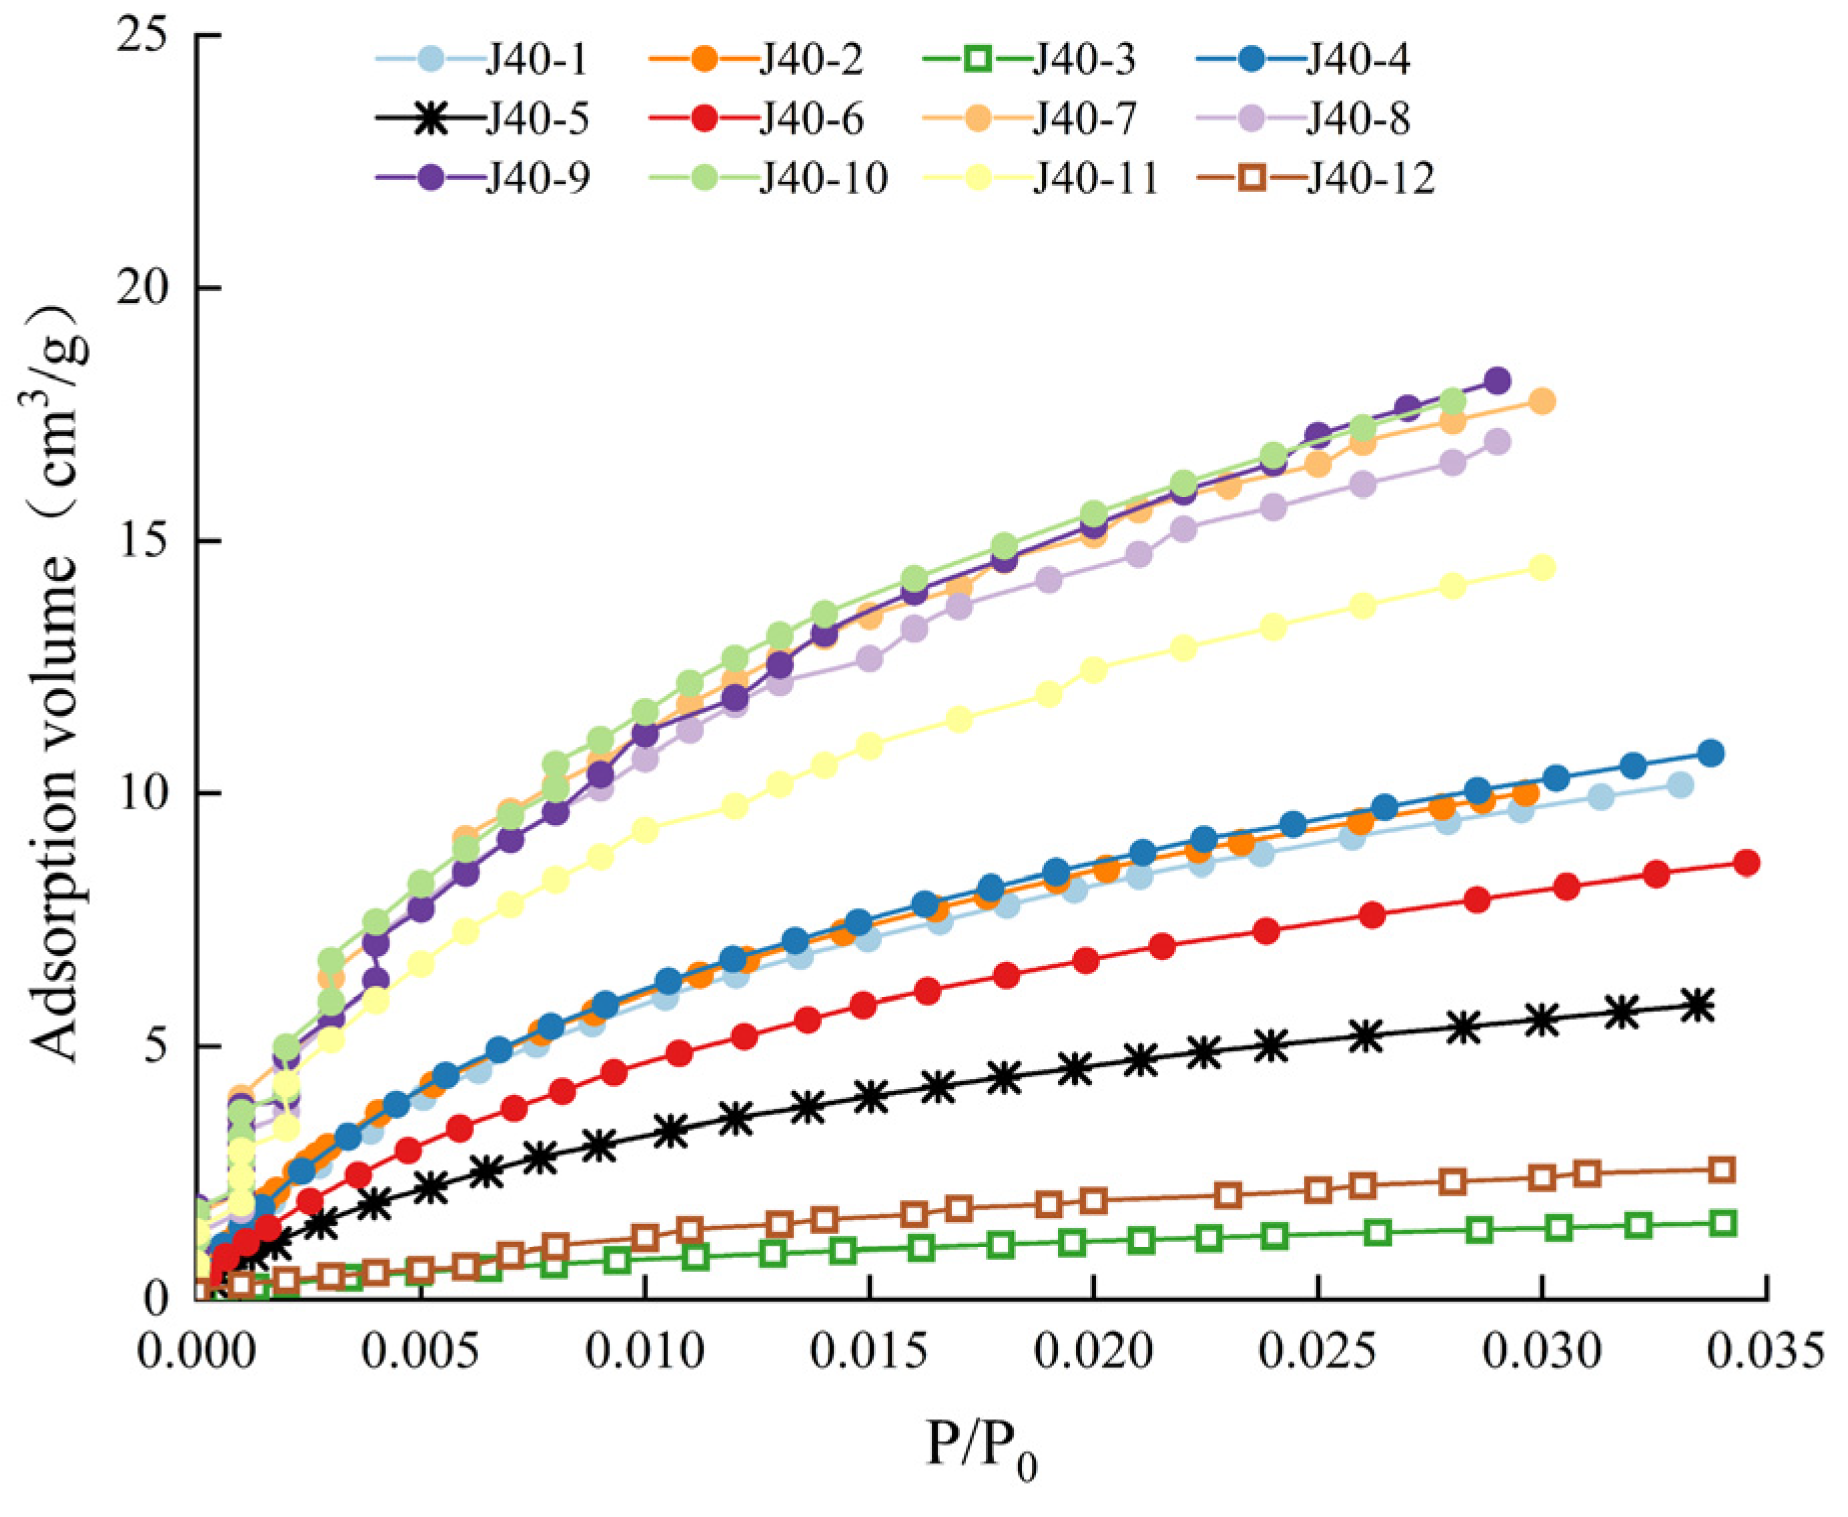
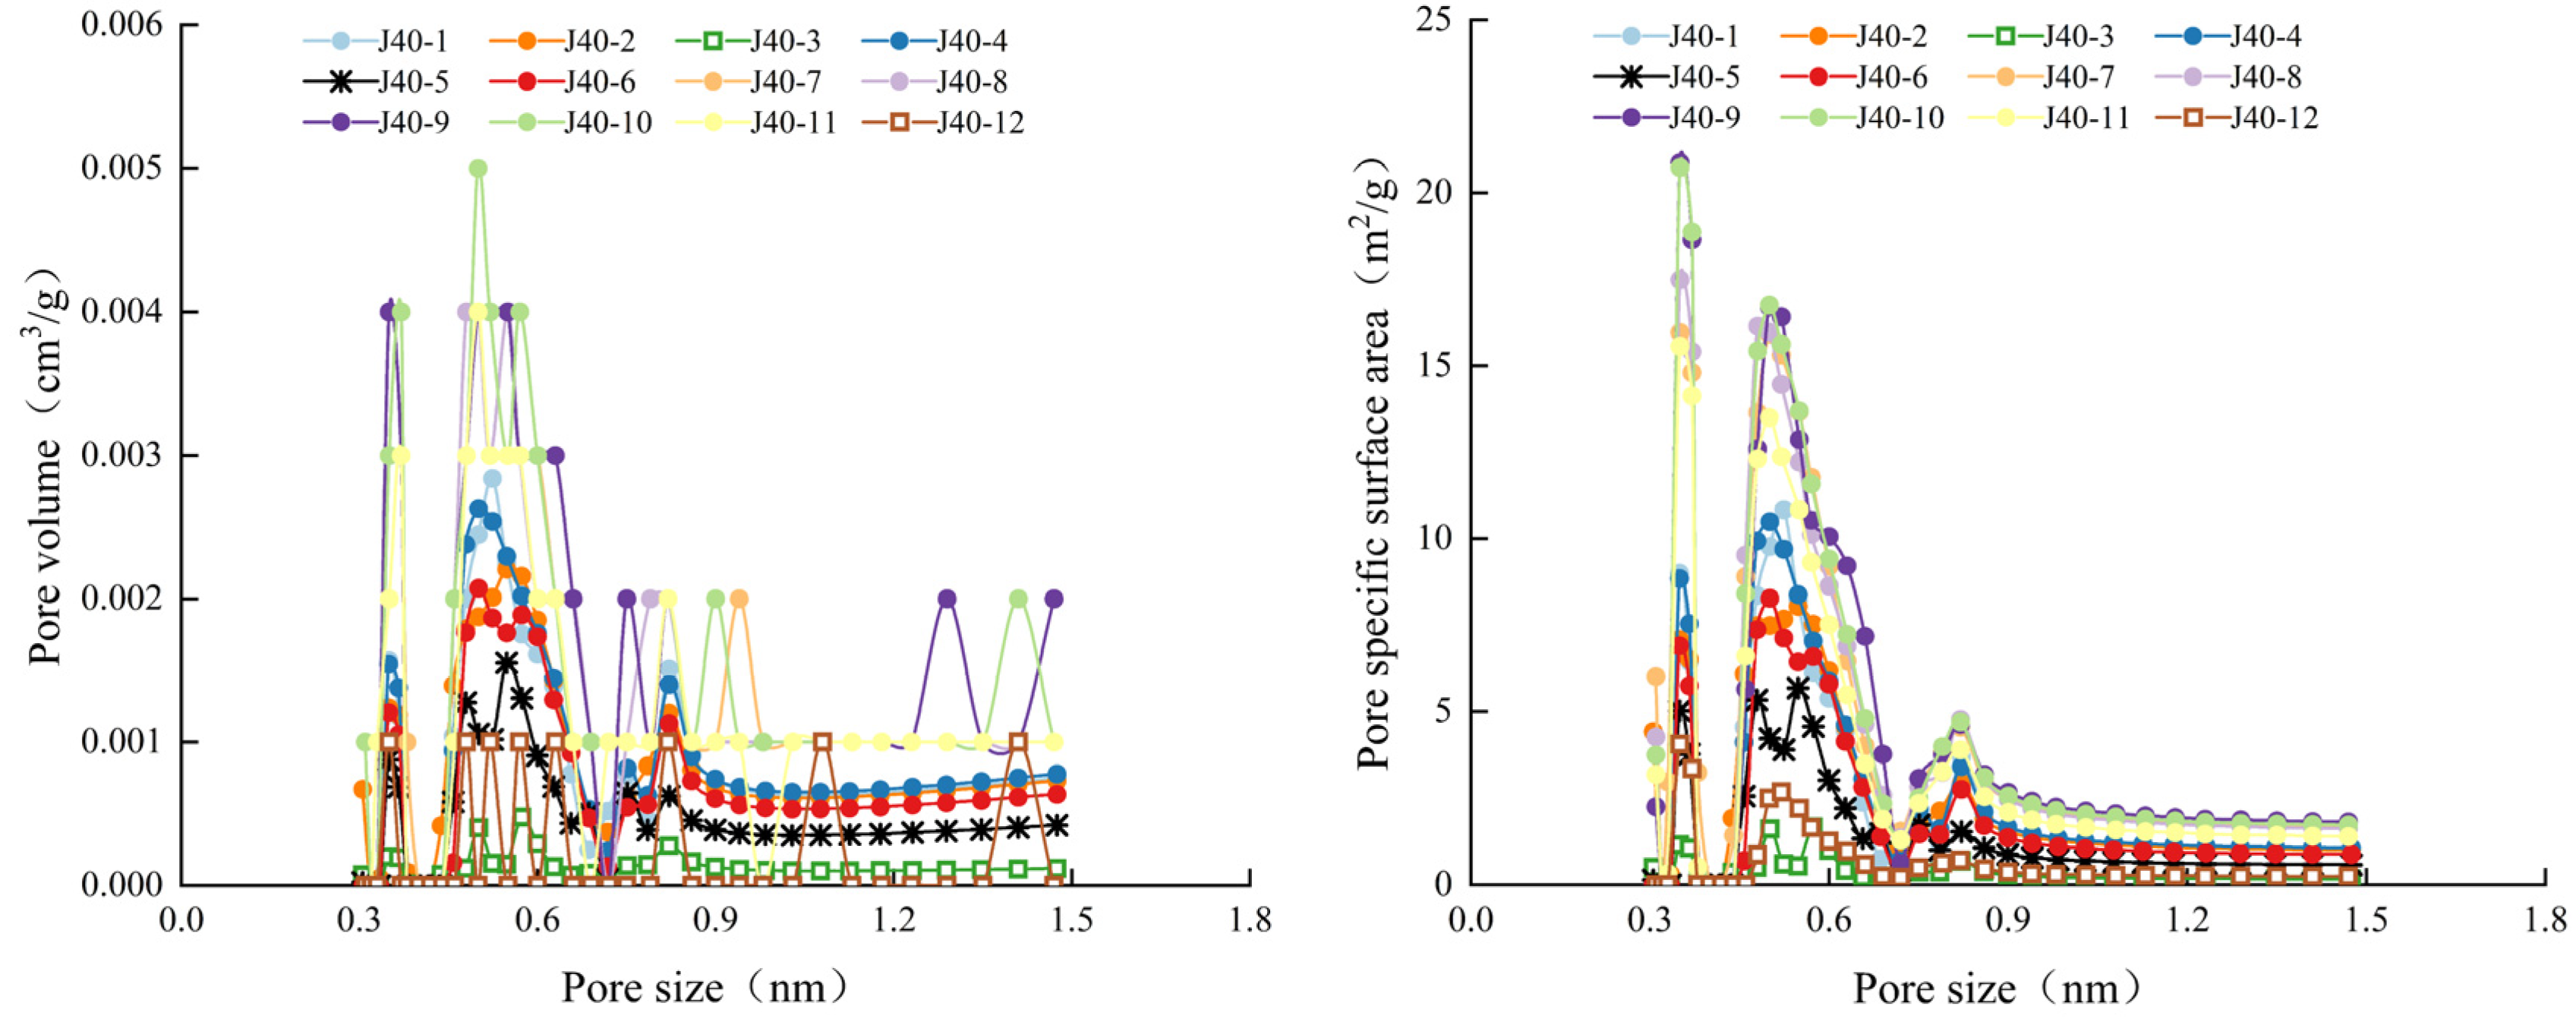
3.3.3. Low-Pressure CO2 Adsorption Experiments

Given that CO2 molecules exhibit high-energy properties and the advantage of rapidly reaching equilibrium at 273 K, they can effectively penetrate into finer pore structures, especially microporous regions with diameters of less than 2 nm, which become the main contributors to the adsorbed gas storage capacity, providing significant storage space. Figure 7 presents the CO2 adsorption isotherms of the 12 samples from the study area obtained under low-pressure conditions, and each curve demonstrates a common trend: CO2 adsorption steadily increased with an increasing pressure gradient. These isotherms were categorized as having typical type-I curves according to the IUPAC classification criteria. Further analysis revealed that the coal samples had the highest CO2 adsorption capacity, with adsorption amounts ranging from 8.62 to 18.16 cm3/g, followed closely by carbonaceous mudstone, with the adsorption amount stabilizing at approximately 5.81 cm3/g, and mudstone had the lowest adsorption level, with adsorption amounts ranging from only 1.49 to 2.56 cm3/g. These results indirectly suggest that the microporosity of the coal rock samples from the study area was the highest among the samples of the Jurassic Yan’an Formation, and that the adsorption amounts of the coal rock samples from the study area are the highest. These findings also indirectly indicate that among the samples from the Jurassic Yan’an Formation in the study area, the coal samples had the most micropores, whereas the mudstone samples had the fewest micropores.
The pore parameters of all the samples from the study area were calculated via the NLDFT method based on the low-pressure CO2 adsorption data to obtain the pore volume and pore specific surface area distribution curves, as shown in Figure 8. The DFT pore volume of the coal rock ranged from 0.026 to 0.057 cm3/g, with an average value of 0.043 cm3/g, and the DFT specific surface area ranged from 83.049 to 188 m2/g, with an average value of 141.866 m2/g. The DFT pore volume of the carbonaceous mudstone was 0.018 cm3/g, and the DFT specific surface area was 56.54 m2/g. The DFT pore volume of the mudstone ranged from 0.005~0.008 cm3/g, with an average value of 0.007 cm3/g, and the DFT specific surface area ranged from 14.52 to 26.12 m2/g, with an average value of 20.32 m2/g. The pore volume and pore specific surface area of the coal rock and carbonaceous mudstone determined based on the low-pressure CO2 adsorption method were much greater than those determined based on the low-temperature N2 adsorption method, which indicates that the proportion of micropores in the coal rock and carbonaceous mudstone in the study area was much greater than that of mesopores. In terms of the pore size distribution, the microporous development of the coal-bearing samples from the Yan’an Formation in the study area was characterized by multiple peaks, with the main peaks mainly distributed at 0.33–0.38 nm, 0.48–0.63 nm and 0.75–0.94 nm, reflecting the wide distribution range of the micropores in the coal-bearing samples.

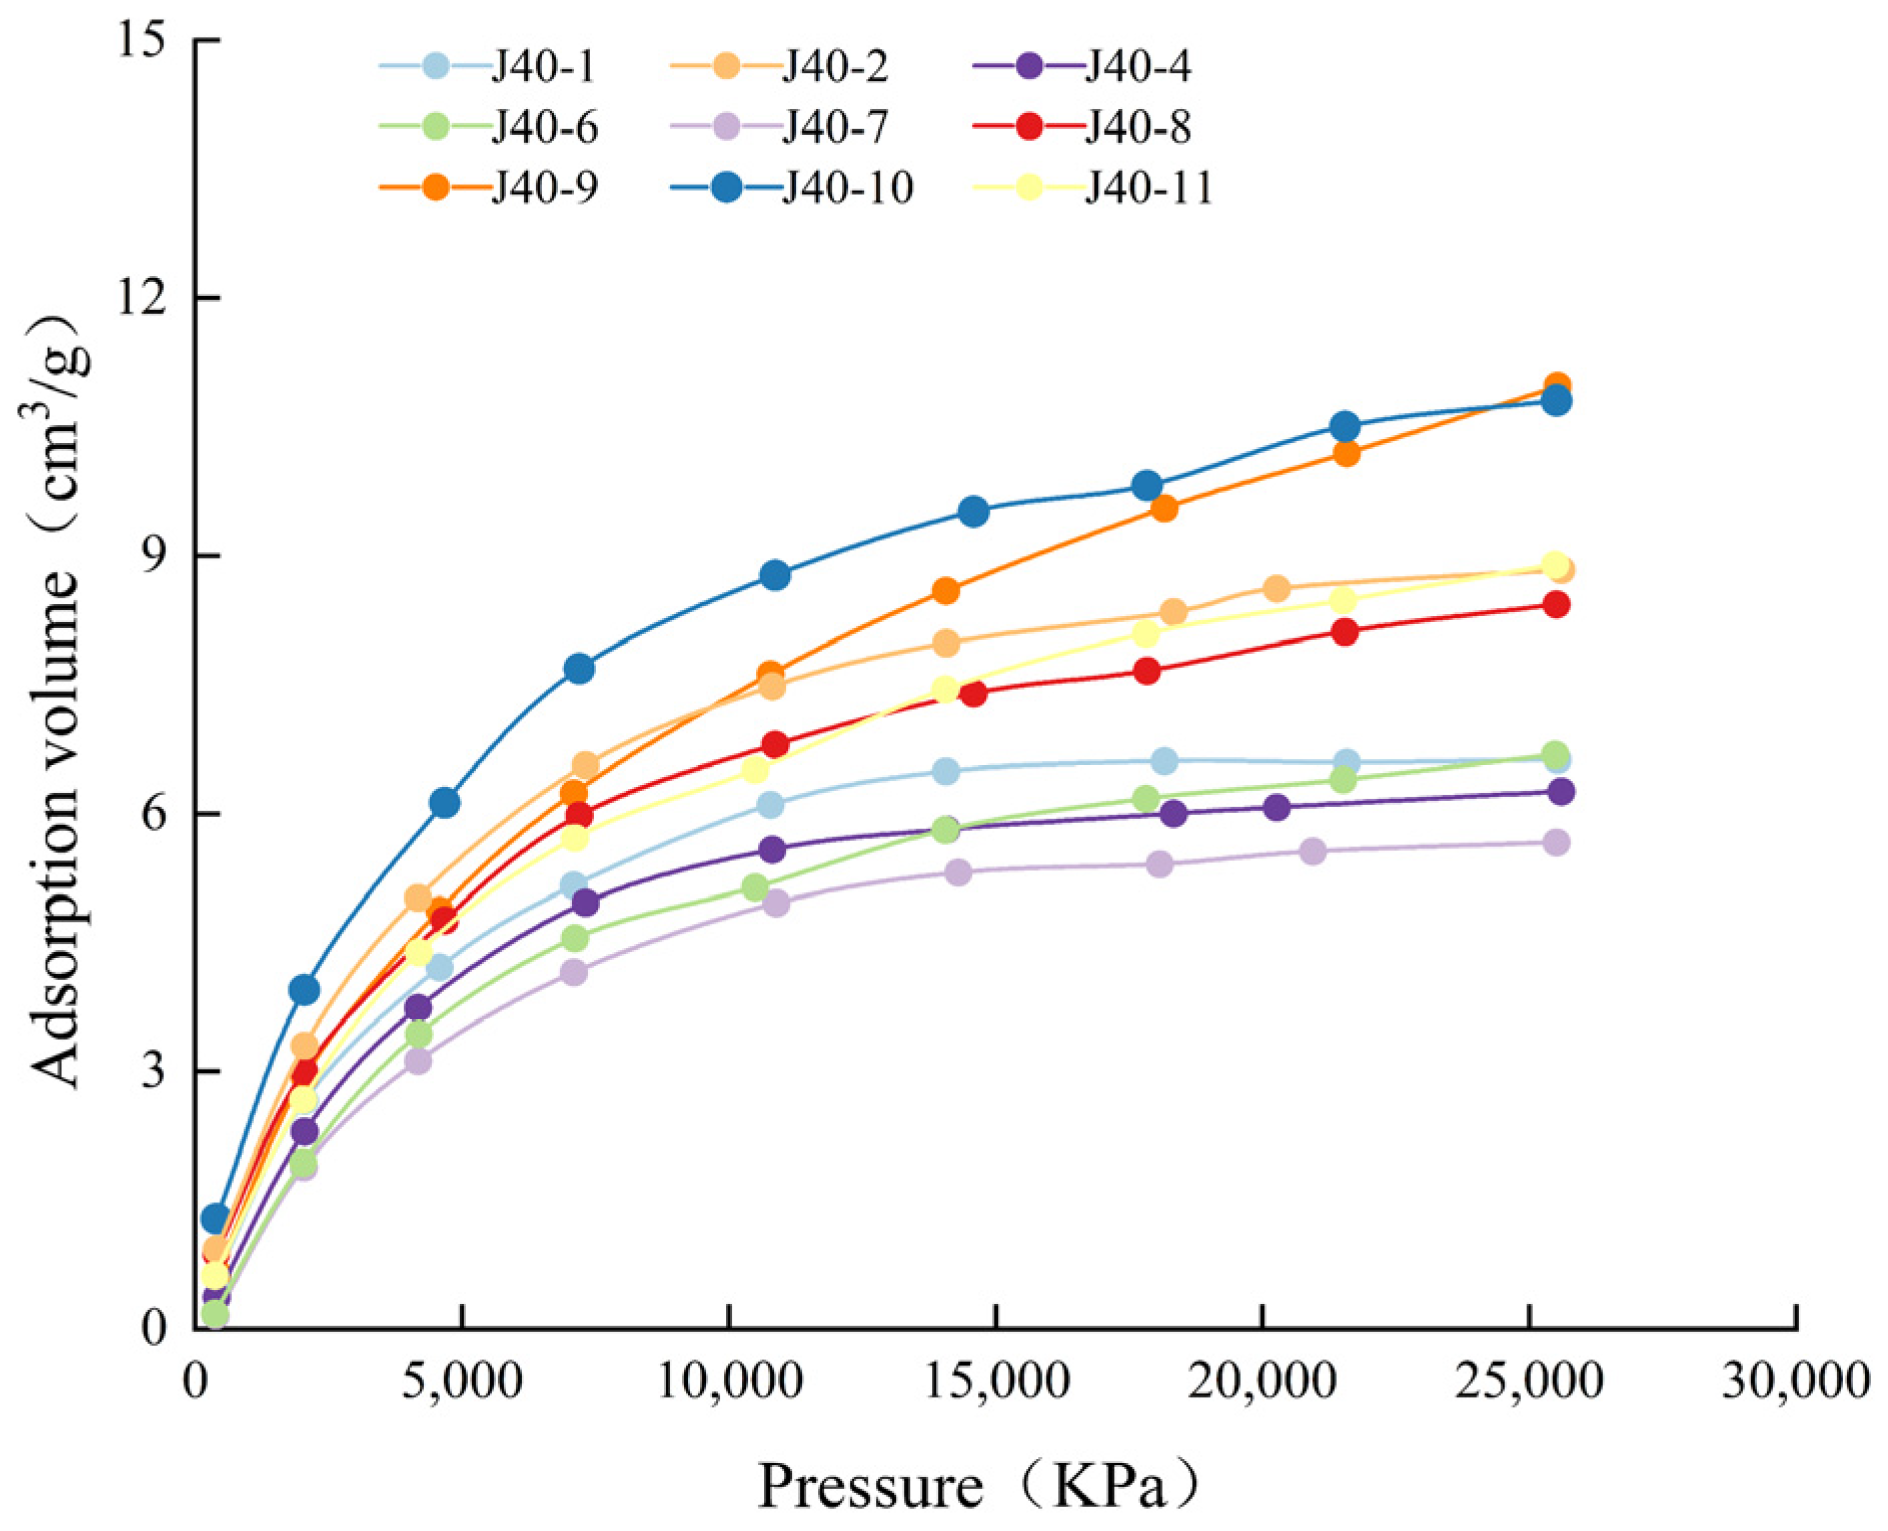
3.4. High-Pressure Methane Isothermal Adsorption Experiments

High-pressure methane isothermal adsorption experiments were conducted to determine the amount of methane gas adsorbed at different pressures to study the adsorption capacity of coal in the study area. Since the actual coal reservoir experiences water intrusion, water molecules occupy the adsorption sites and decrease the amount of gas adsorbed, so the equilibrium water test was first performed on the coal samples. The high-pressure isothermal adsorption curves of the coal rock samples from the study area are shown in Figure 9. The statistics of methane isothermal adsorption data of coal rock samples in the study area are shown in Table 3. The observed results show that the adsorption capacity of coal rock for CH4 significantly increased with increasing pressure, and its adsorption isotherm showed typical type-I characteristics. In the pressure interval from 0 to 10 MPa, the adsorption curve steeply increased, indicating that the adsorption rate of CH4 by coal rock rapidly increased; when the pressure exceeded 10 MPa, the adsorption curve tended to flatten out, and the adsorption capacity growth rate clearly slowed. Notably, under constant conditions (25 MPa and 60°C), there was significant variability among the maximum CH4 adsorption values exhibited by the coal samples from the Yan’an Formation in the study area, with the maximum adsorption values of the coal rock samples being in the range of 5.662 cm3/g~10.972 cm3/g and the average maximum adsorption value being 8.131 cm3/g, and the adsorption values for the samples decreased in the order of J40-9, J40-10, J40-9 and J40-10, with the smallest adsorption amount being observed for sample J40-7.

4. Discussions

4.1. Full-Scale Pore Structure Characterization

Based on comprehensive consideration of the test mechanisms and computational modeling, each of the above three techniques demonstrates significant advantages within a specific pore size range and can accurately depict the pore structure characteristics of the corresponding pore size segments. In view of this, the advantageous pore size segments for each method were taken as the starting point for data fusion and coherent analysis. Based on the previous in-depth discussion, low-pressure CO2 gas, as an ideal medium for micropore probing, can accurately depict the microporous structural characteristics of pores with sizes smaller than 2 nm through the adsorption test implemented at 273 K. Comparatively, the low-temperature N2 adsorption method has excellent measurement accuracy in the mesopore range (2~50 nm) but is slightly less effective in the characterization of micro- and macroporous segments. In contrast, the HPMP technique excels in the detailed analysis of macropores (pore sizes larger than 50 nm).
To construct a comprehensive pore structure, the measured data from each technique within its optimal pore size range were selected for integration and analysis. The low-pressure CO2 adsorption experimental data were used to characterize the 0.3–2 nm pore size segment, the low-temperature N2 adsorption data were used to delineate the details of the 2–50 nm pore size segment, and for the macroporous information of pores larger than 50 nm, the data from HPMP experiments were used. Figure 10 visualizes the multiscale pore volume and specific surface area distribution characteristics obtained by combining these three techniques. The total pore volume of the coal samples ranged from 0.043 to 0.113 cm3/g, with an average value of 0.073 cm3/g, and the total specific surface area ranged from 85.488 to 203.242 m2/g, with an average value of up to 148.909 m2/g. The carbonaceous mudstones had a total pore volume of 0.044 cm3/g and a total specific surface area of 60.212 m2/g. The mudstones had a total pore volume of approximately 0.029 cm3/g, and the total specific surface area ranged from 22.670 to 33.486 m2/g, with an average value of 28.078 m2/g.
As shown in Figure 11, the distributions of the pore volume and specific surface area of the coal-bearing rock systems in the study area were obtained by combining the three methods, and the characteristics of the pore structure in terms of the full pore diameters are shown in Table 4. The pore volume of the coal samples was mainly afforded by micropores <2 nm, which accounted for 46.4%~76.7%, with an average value of 60.2%, while macropores >50 nm were the second most distributed pores, accounting for 7.8%~42.2%, with an average value of 24.1%. The percentage of mesopores measuring 2–50 nm in size was the lowest, accounting for 10.3% to 28.4%, with an average value of 15.7%. These results show that the distribution of the pore volumes or pore numbers in the coal samples from the study area had a pattern of micropores > macropores > mesopores. The pore volume of the carbonaceous mudstone samples from the study area was furnished by micropores and macropores, accounting for 39.6% and 38.2%, respectively, and mesopores also contributed to a certain extent, accounting for 22.2%. The pore volume of the mudstone of the Jurassic Yan’an Formation had the largest percentage of mesopores at up to 65.6% on average and the smallest percentage of macropores at 12.3% on average. According to the distribution of the specific surface area, the total pore volume was mainly provided by micropores: 95.8% was provided by micropores in the coal rocks, 93.9% by micropores in the carbonaceous mudstones and 71.9% by micropores in the mudstones. Both mesopores and macropores did not contribute much to the specific surface area, and the specific surface area of the samples of the coal-bearing rock systems in the study area was believed to be dominated by micropores. Through comprehensive analysis, the main gas adsorption and storage sites in the coalbeds in the study area were clearly identified as many micropores with large surface areas, which not only serve as key gas storage areas but also constitute efficient pathways for the initial migration and diffusion of gases after desorption.

4.2. Factors Influencing Pore Structure Development

Previous studies have thoroughly explored the mechanisms by which the pore structure of coal rock is regulated by a variety of factors, and the degree of coal metamorphism, coal rock components and tectonic deformation are generally accepted to be the dominant forces shaping the pore volume and specific surface area [20,39,43,44,45,46,47,48,49,50]. In addition, the combined effects of temperature and stress should not be ignored, as they effectively promote the formation and development of pore networks by increasing the degree of coal aromatization and inducing side-chain shrinkage and fracture [48,49,50]. However, when the maturity of coal reaches a high level (e.g., Ro > 2.5%), its hydrocarbon potential sharply decreases, extensive polymerization reactions under high-temperature and high-pressure conditions result in significant shrinkage of the original pores, and the generation of new pores becomes extremely limited. The coal rocks of the Jurassic Yan’an Formation in the Longdong area of the Ordos Basin experienced similar degrees of metamorphism, and the reflectivity of the specular bodies was low. Therefore, through a simplified variable control strategy, we focused on exploring the influence of the microcomponent composition of coal and the parameters obtained from the industrial analyses on the pore structure.

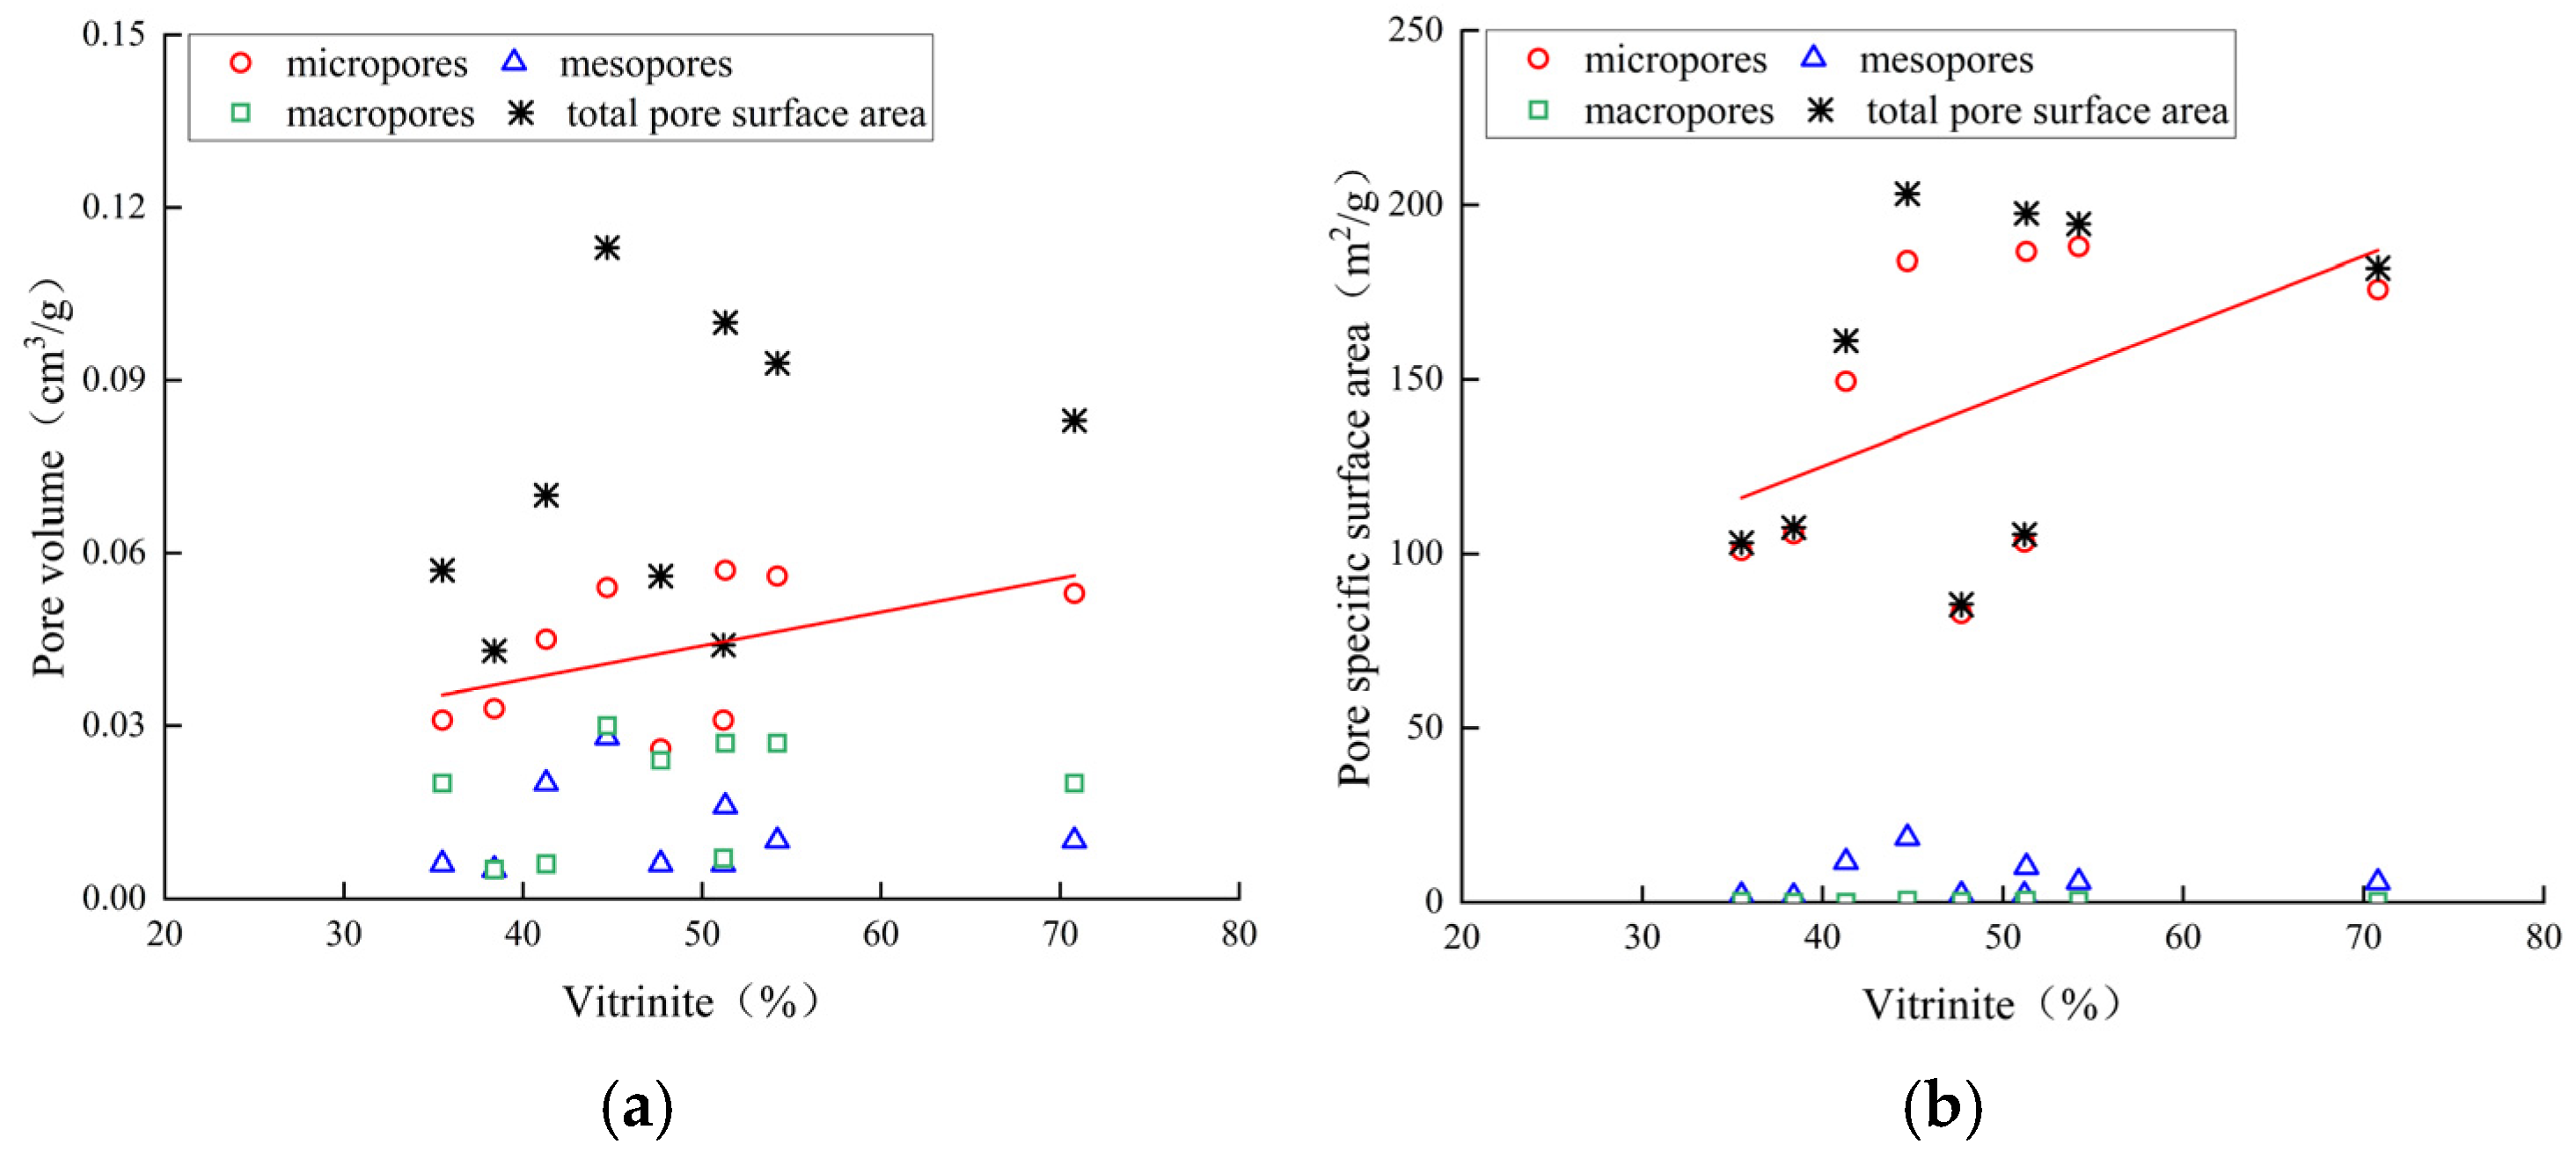
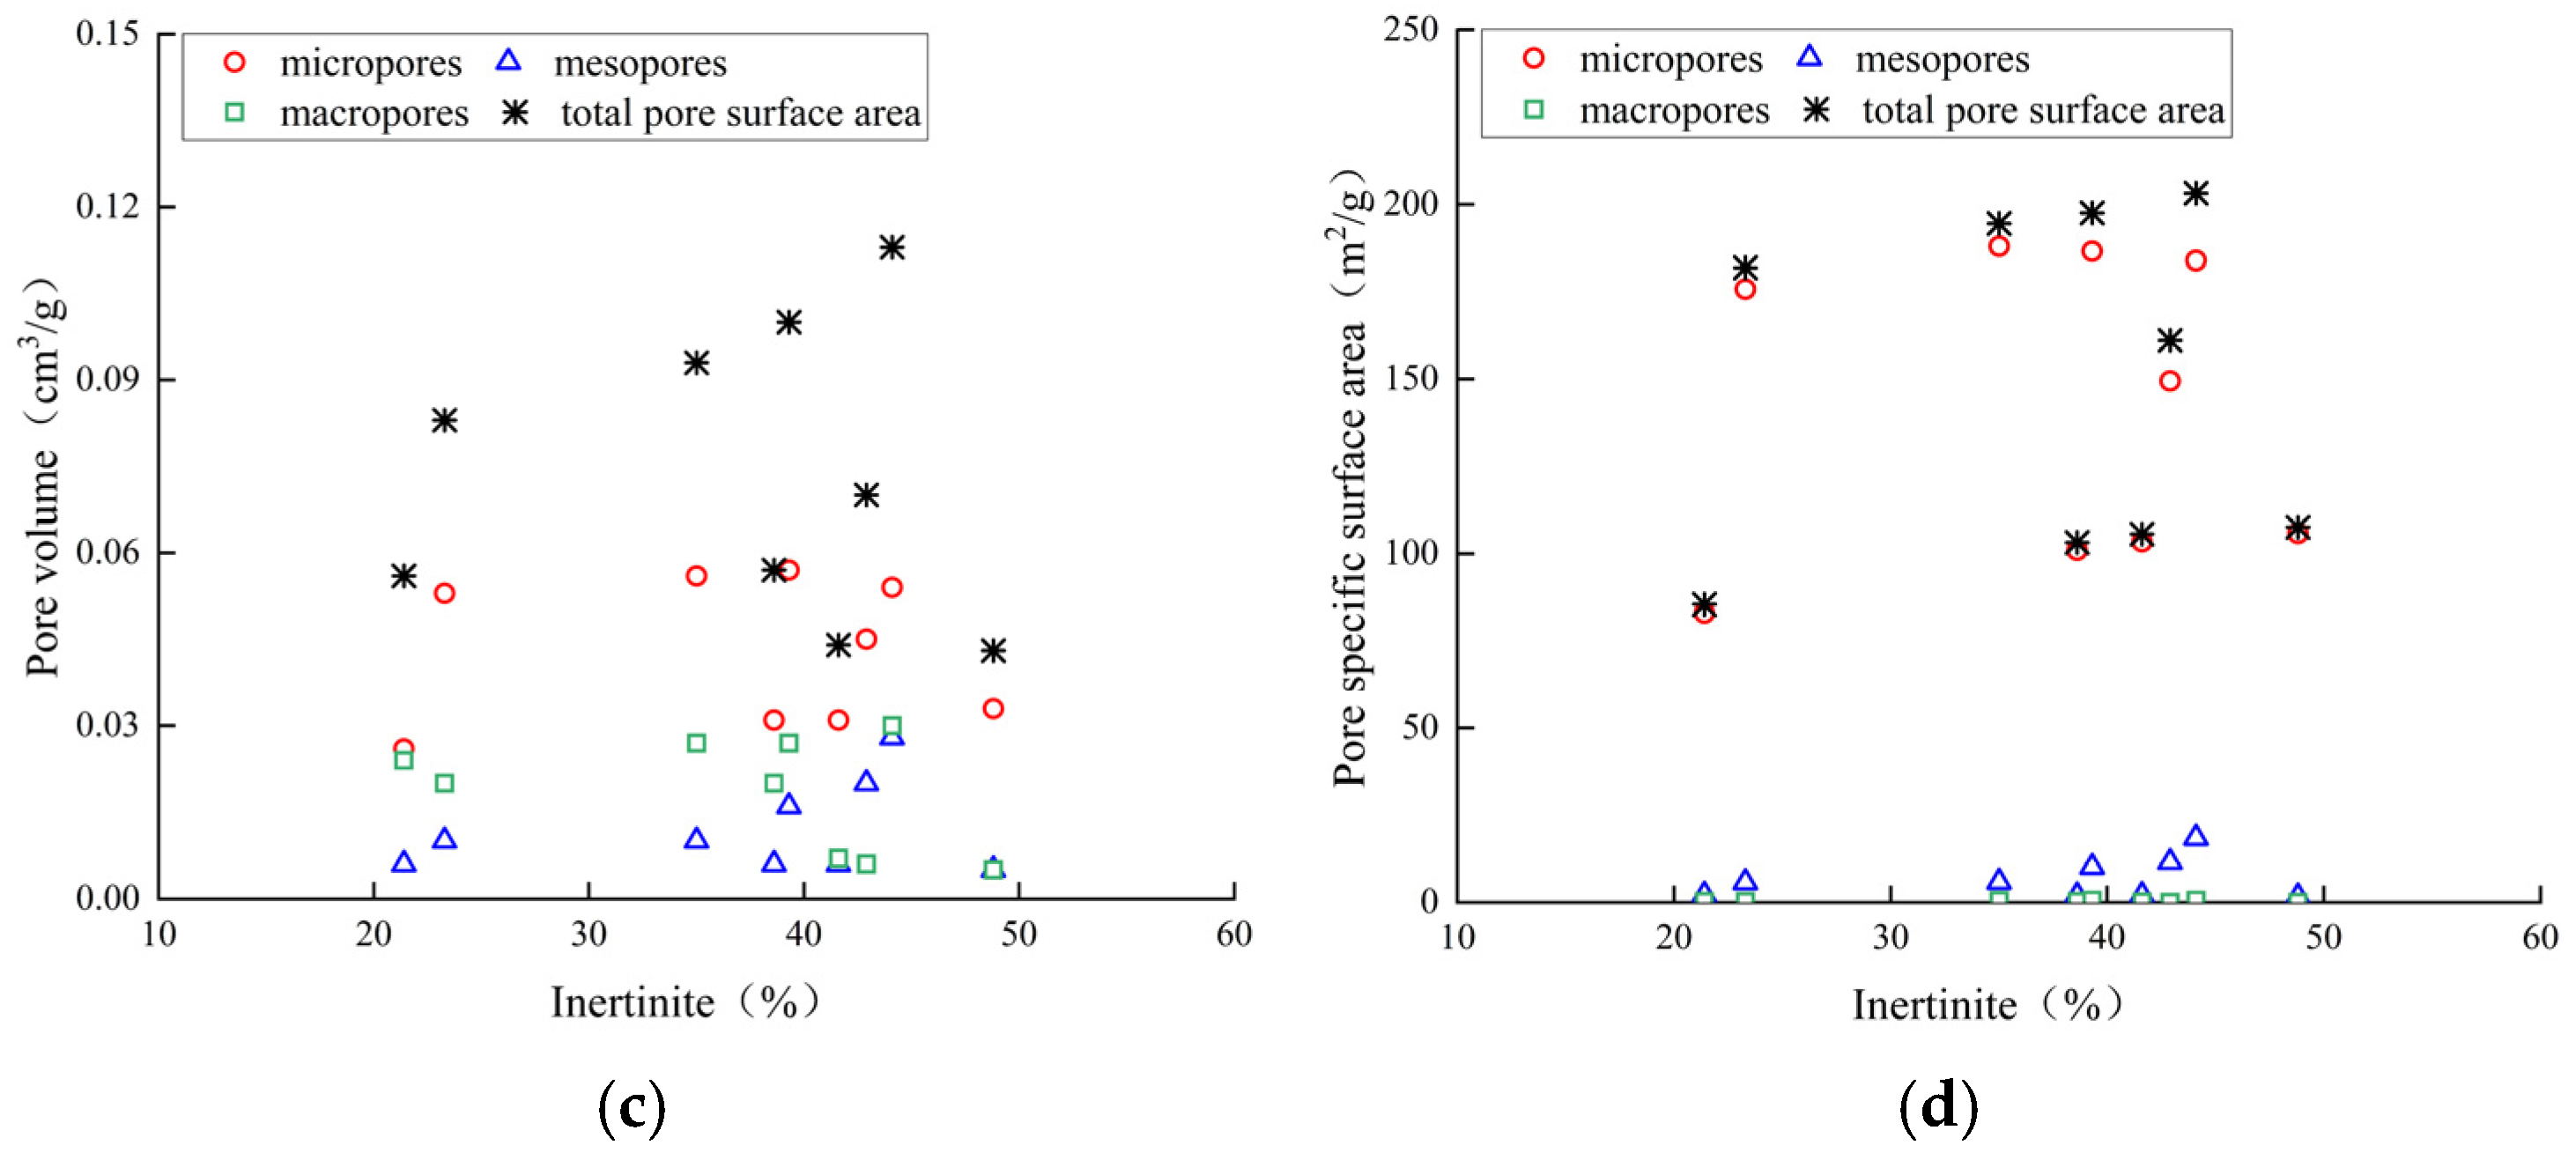
4.2.1. Effects of Maceral Composition on the Pore Structure

In the study area, the pore system of the coal samples mainly consisted of organic pores in the vitrinite and the inertinite. As shown in Figure 12, there is a certain correlation between the different scales of the pore volume and specific surface area of the coal rock samples and their maceral compositions. The analysis revealed that the microporous volume and specific surface area of the coal samples were significantly positively correlated with the composition of the vitrinite, but no clear correlation was observed with the composition of the inertinite. This result implies that the pore volume and specific surface area of coal samples with a relatively high degree of enrichment of the vitrinitecorrespondingly increase, which can be attributed to the variability in the hydrocarbon potential of different microcomponents in the coal mineralization process. An increase in the hydrocarbon potential is generally believed to promote the effective development of metamorphic pores. Given the unique thermoplasticity, brittleness and efficient gas production properties of vitrinite, it becomes the main driving force for the development of metamorphic pores. Therefore, vitrinite dominates the combined composition of primary and metamorphic pores, followed by inertinite (especially the filamentous component), which contributes to the total pore system mainly through the pores inherited from its plant tissues; in contrast, the contribution of the exinite to the pores was almost negligible. Given that micropores and mesopores constitute the major types of primary and metamorphic pores, changes in the content of vitrinite directly and significantly influence the distribution of micropores. This modulating effect leads to an increasing trend of the total pore volume with increasing vitrinite content, which reveals the intrinsic connection between the pore structures of coal samples and their maceral compositions.

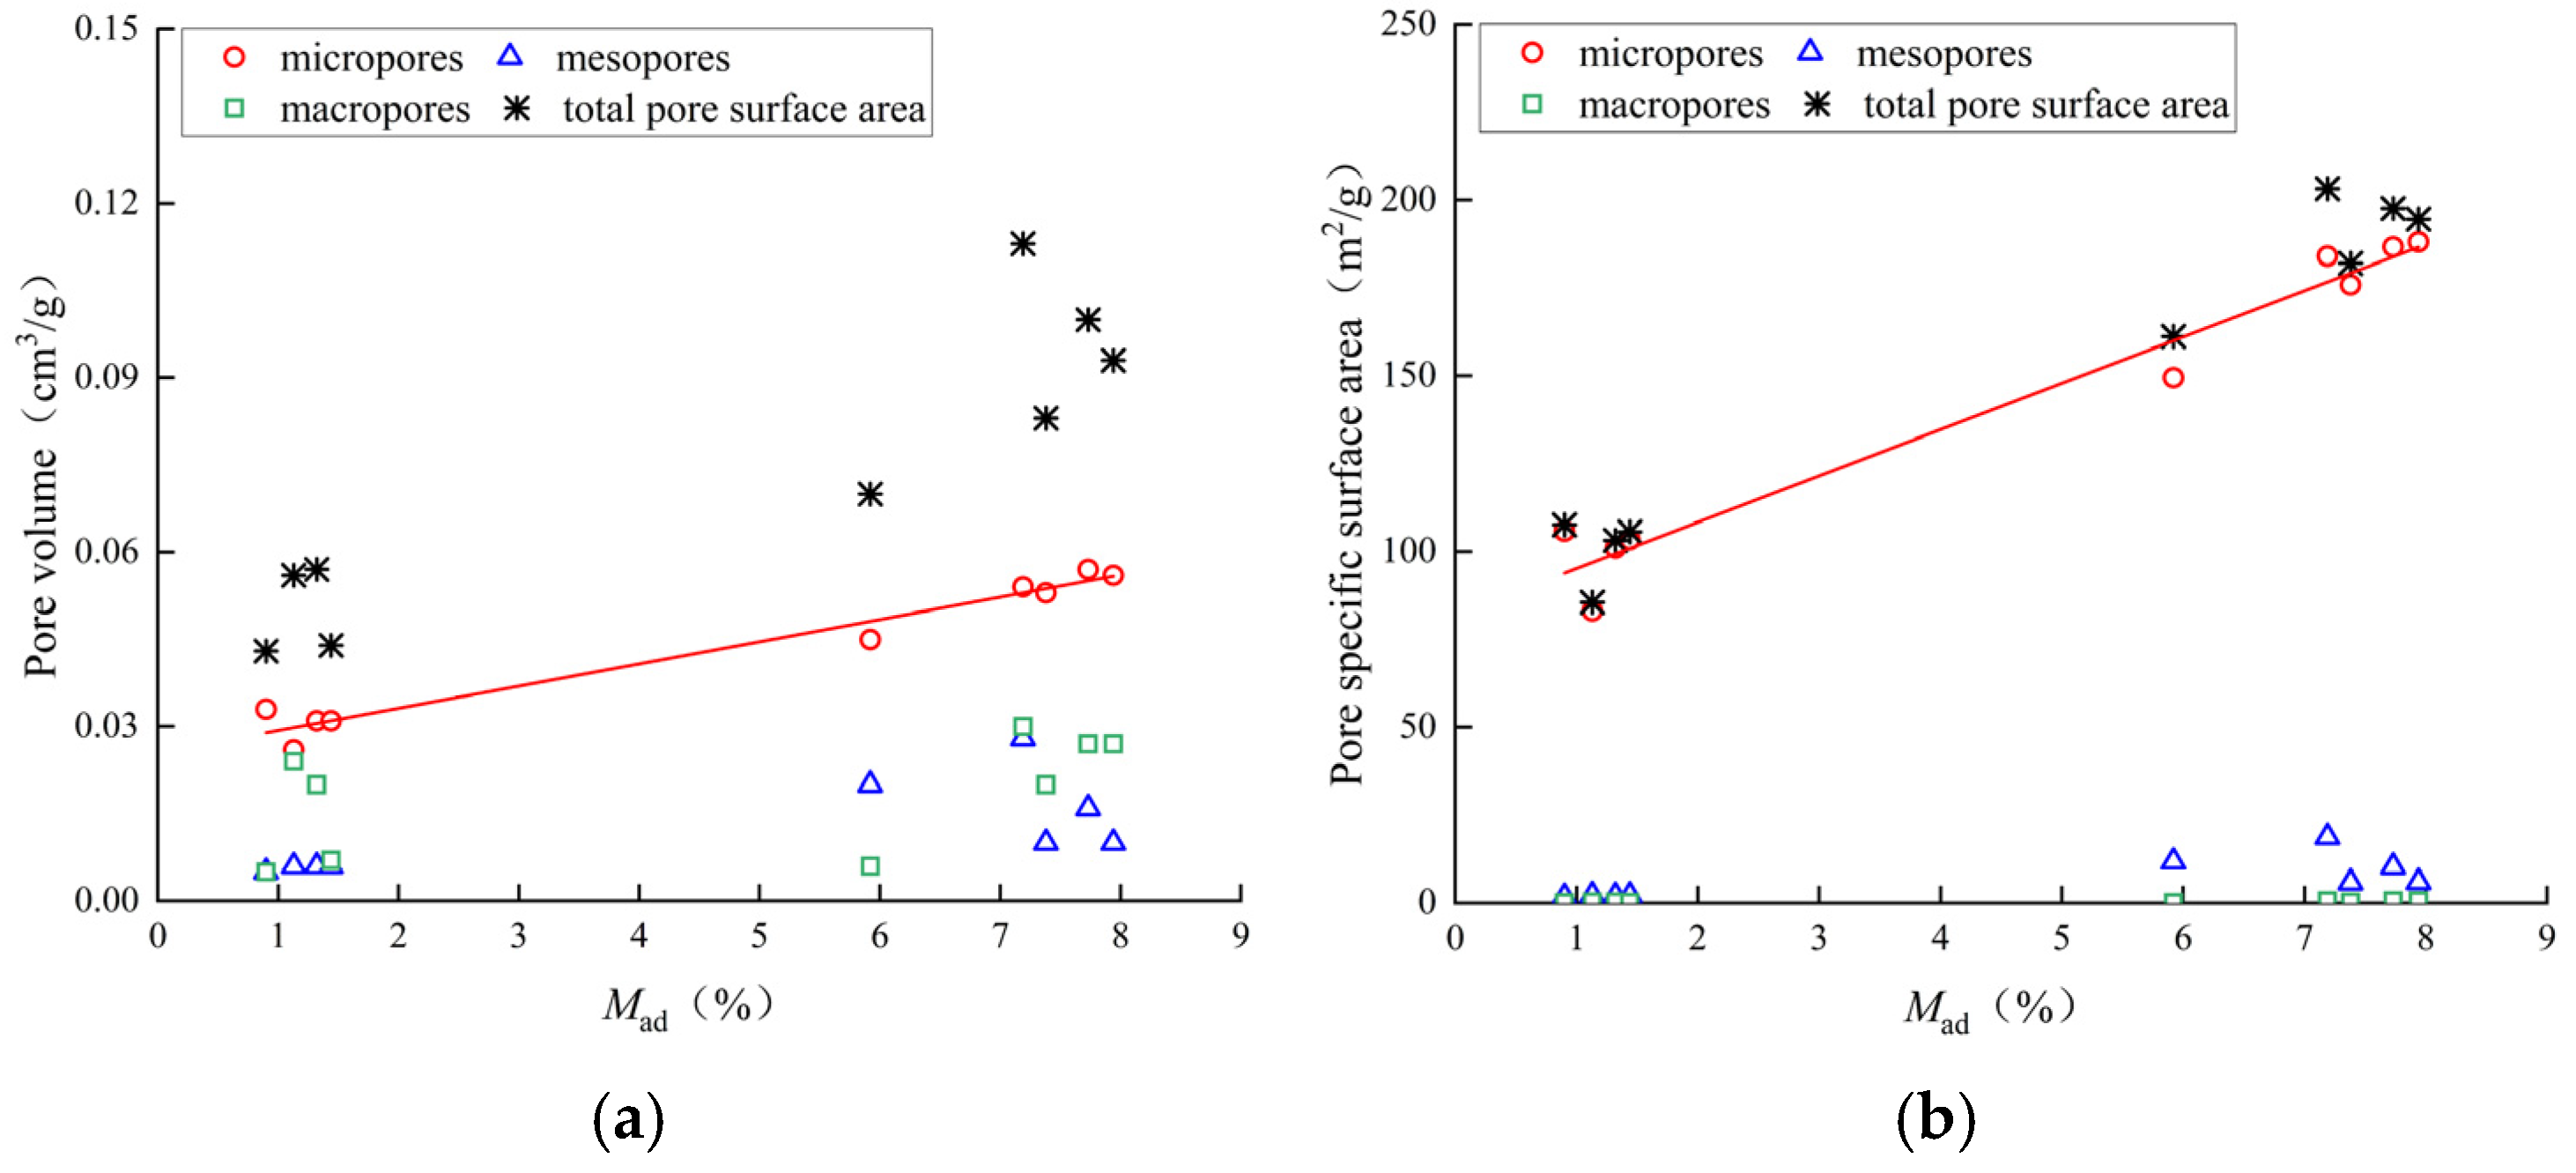
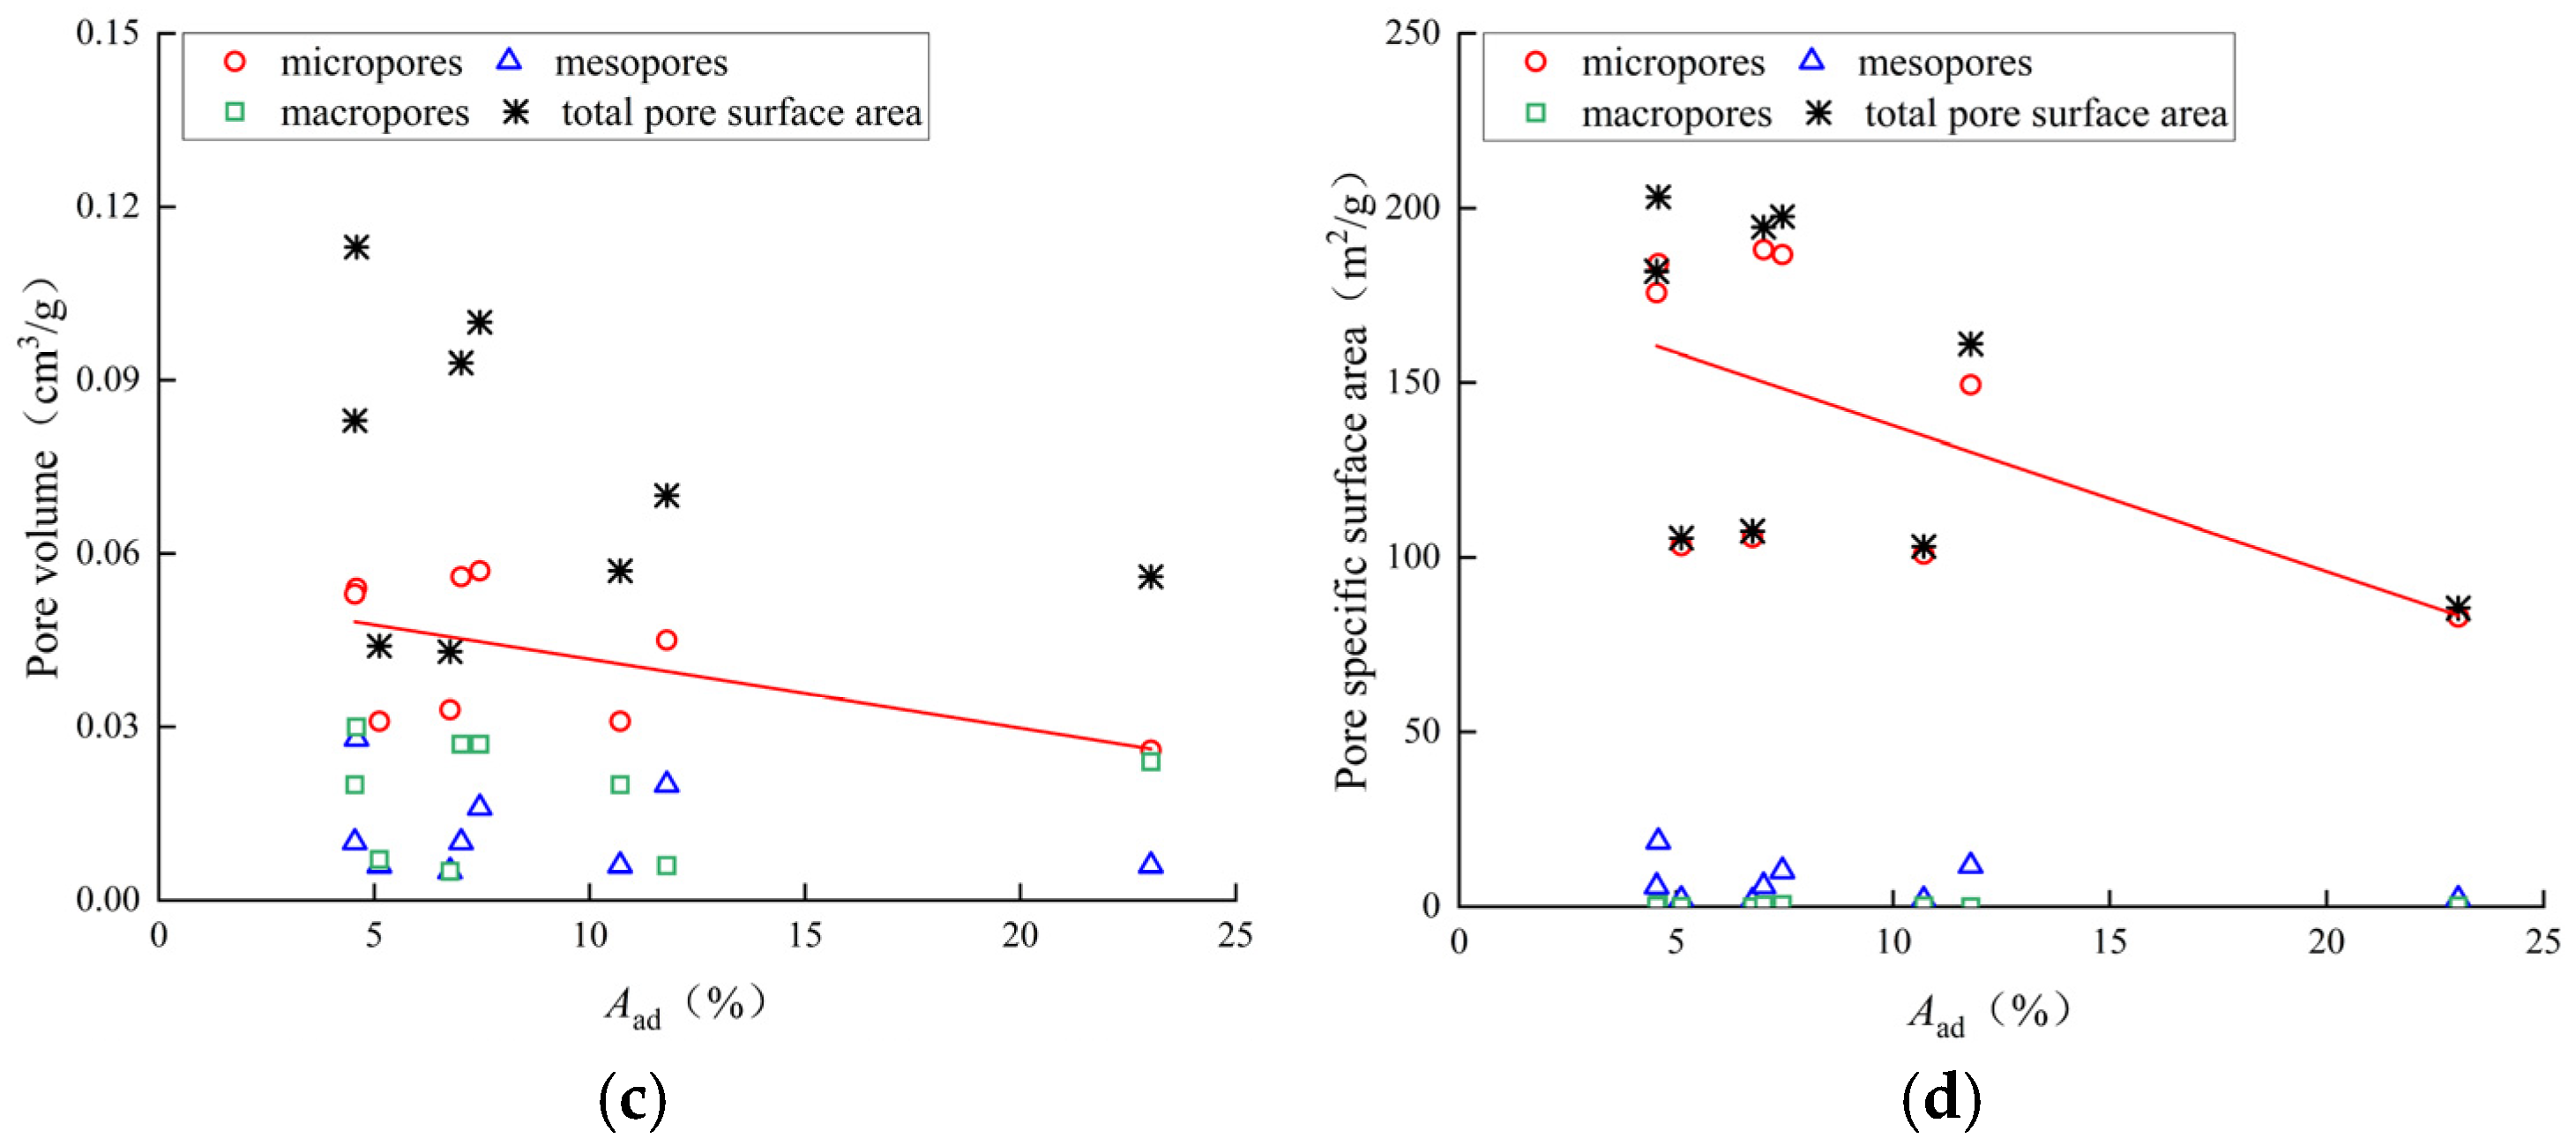
4.2.2. Effects of Moisture and Ash on the Coal Pore Structure

The relationships of the pore volume and specific surface area at different scales of the coal rock samples with the proximate analysis results are shown in Figure 13. The analysis indicates that there were clear positive correlations of the microporous pore volume and specific surface area with the Mad (air-dried basis moisture) content of the coal samples; similarly, the total volume and the total specific surface area increased with an increasing Mad content. However, for mesopores and macropores, the pore volume and specific surface area did not show significant correlations with the moisture content of the coal. This phenomenon can be attributed to the fact that Mad mainly characterizes water adsorbed in micropores, especially in pores with a diameter of less than 100 nm, and an increase in Mad is therefore a sign of an increase in micropore adsorption. In contrast, Aad (air-dried basis ash), as a derivative of the mineral components in coal, originates from complex decomposition and binding processes. According to the industrial analysis results, the pore volumes of the micropores and total pores in the coal samples were negatively correlated with the specific surface area and Aad yield. Given that Aad is one of the important indicators of the mineral content in coal, this negative correlation coincides with the effect of the mineral content on the pore structure. The development of pores in coal is not only limited by the organic matter content but also strongly affected by the mineral content, and an increase in the mineral content is often accompanied by an increase in the Aad yield. Therefore, when the minerals in coal fill or block part of the pore space, corresponding decreases in the pore volume and specific surface area of the coal samples occur.

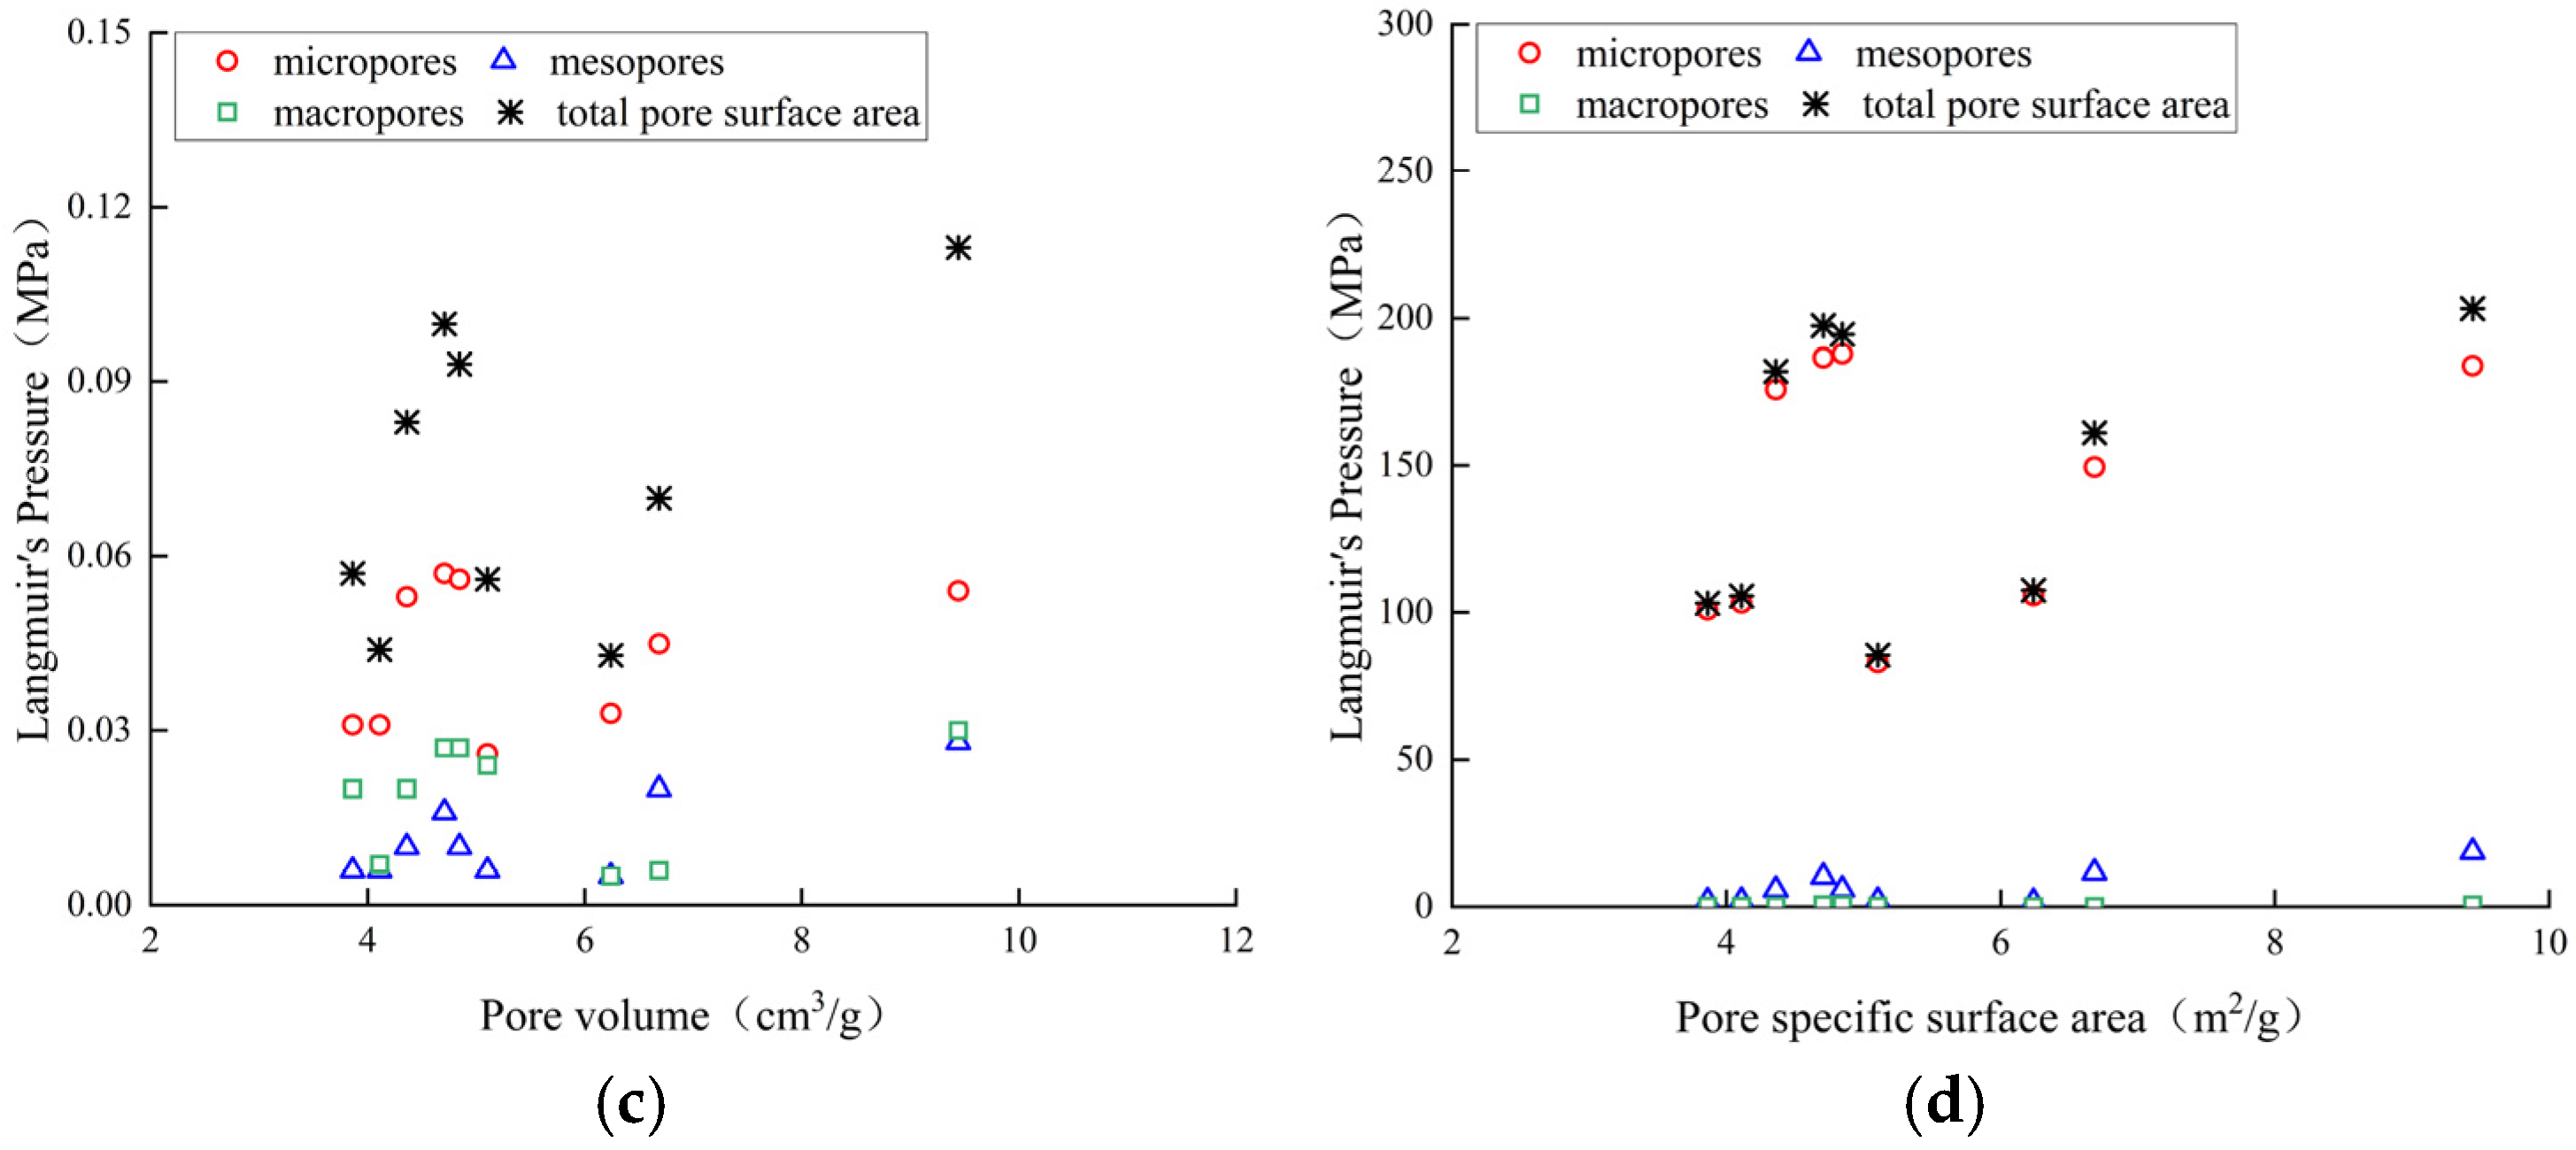
4.3. Influence of the Development of Different Pores in Coal Rock on the Gas Content

The relationships between the different pore structure characteristics of coal and the methane adsorption pattern were analyzed. The relationships of the pore volume and specific surface area with the VL (Langmuir volume) and PL (Langmuir pressure) of the coal rock samples are shown in Figure 14. The methane adsorption potential is mainly determined by the adsorption pore volume, whereas the specific surface area is an important index for measuring the abundance of adsorption sites on the surface of coal. For the coal rocks in the study area, there was a good positive correlation between the total pore volume, total specific surface area and VL, indicating that the larger the pore volume is, the greater the amount of gas that can be adsorbed by the coal samples, and the larger the specific surface area is, the greater the number of gas molecules that can be adsorbed on the surface. In addition, the pore volume of micropores, specific surface area of micropores and VL also show significant positive correlations, whereas mesopores and macropores did not show significant correlations with VL. This result occurred mainly because the pore volume and specific surface area of the coal rock samples were mainly supplied by micropores, and the micropores, although small in volume, constituted a large part of the entire surface area of the coal samples in terms of the specific surface area, providing more adsorption sites and favoring the adsorption of methane, further confirming the dominant role of micropores in the adsorption process of coal rocks in the study area. No correlation was observed between the adsorption volume, specific surface area and PL value, which indicates that there is no direct mathematical relationship between the pore volume, specific surface area and PL value.

5. Conclusions

(1)
In the samples from the coal system of the Yan’an Formation in the Longdong area, Ordos Basin, the development of organic pores and clay mineral pores was remarkable, and microfractures and clay mineral interlayer joints could be clearly observed. The organic pore development of coal rock was obviously better than that of mudstone. The abundant organic pore development in coal rock provides a good carrier for the occurrence of coalbed gas.
(2)
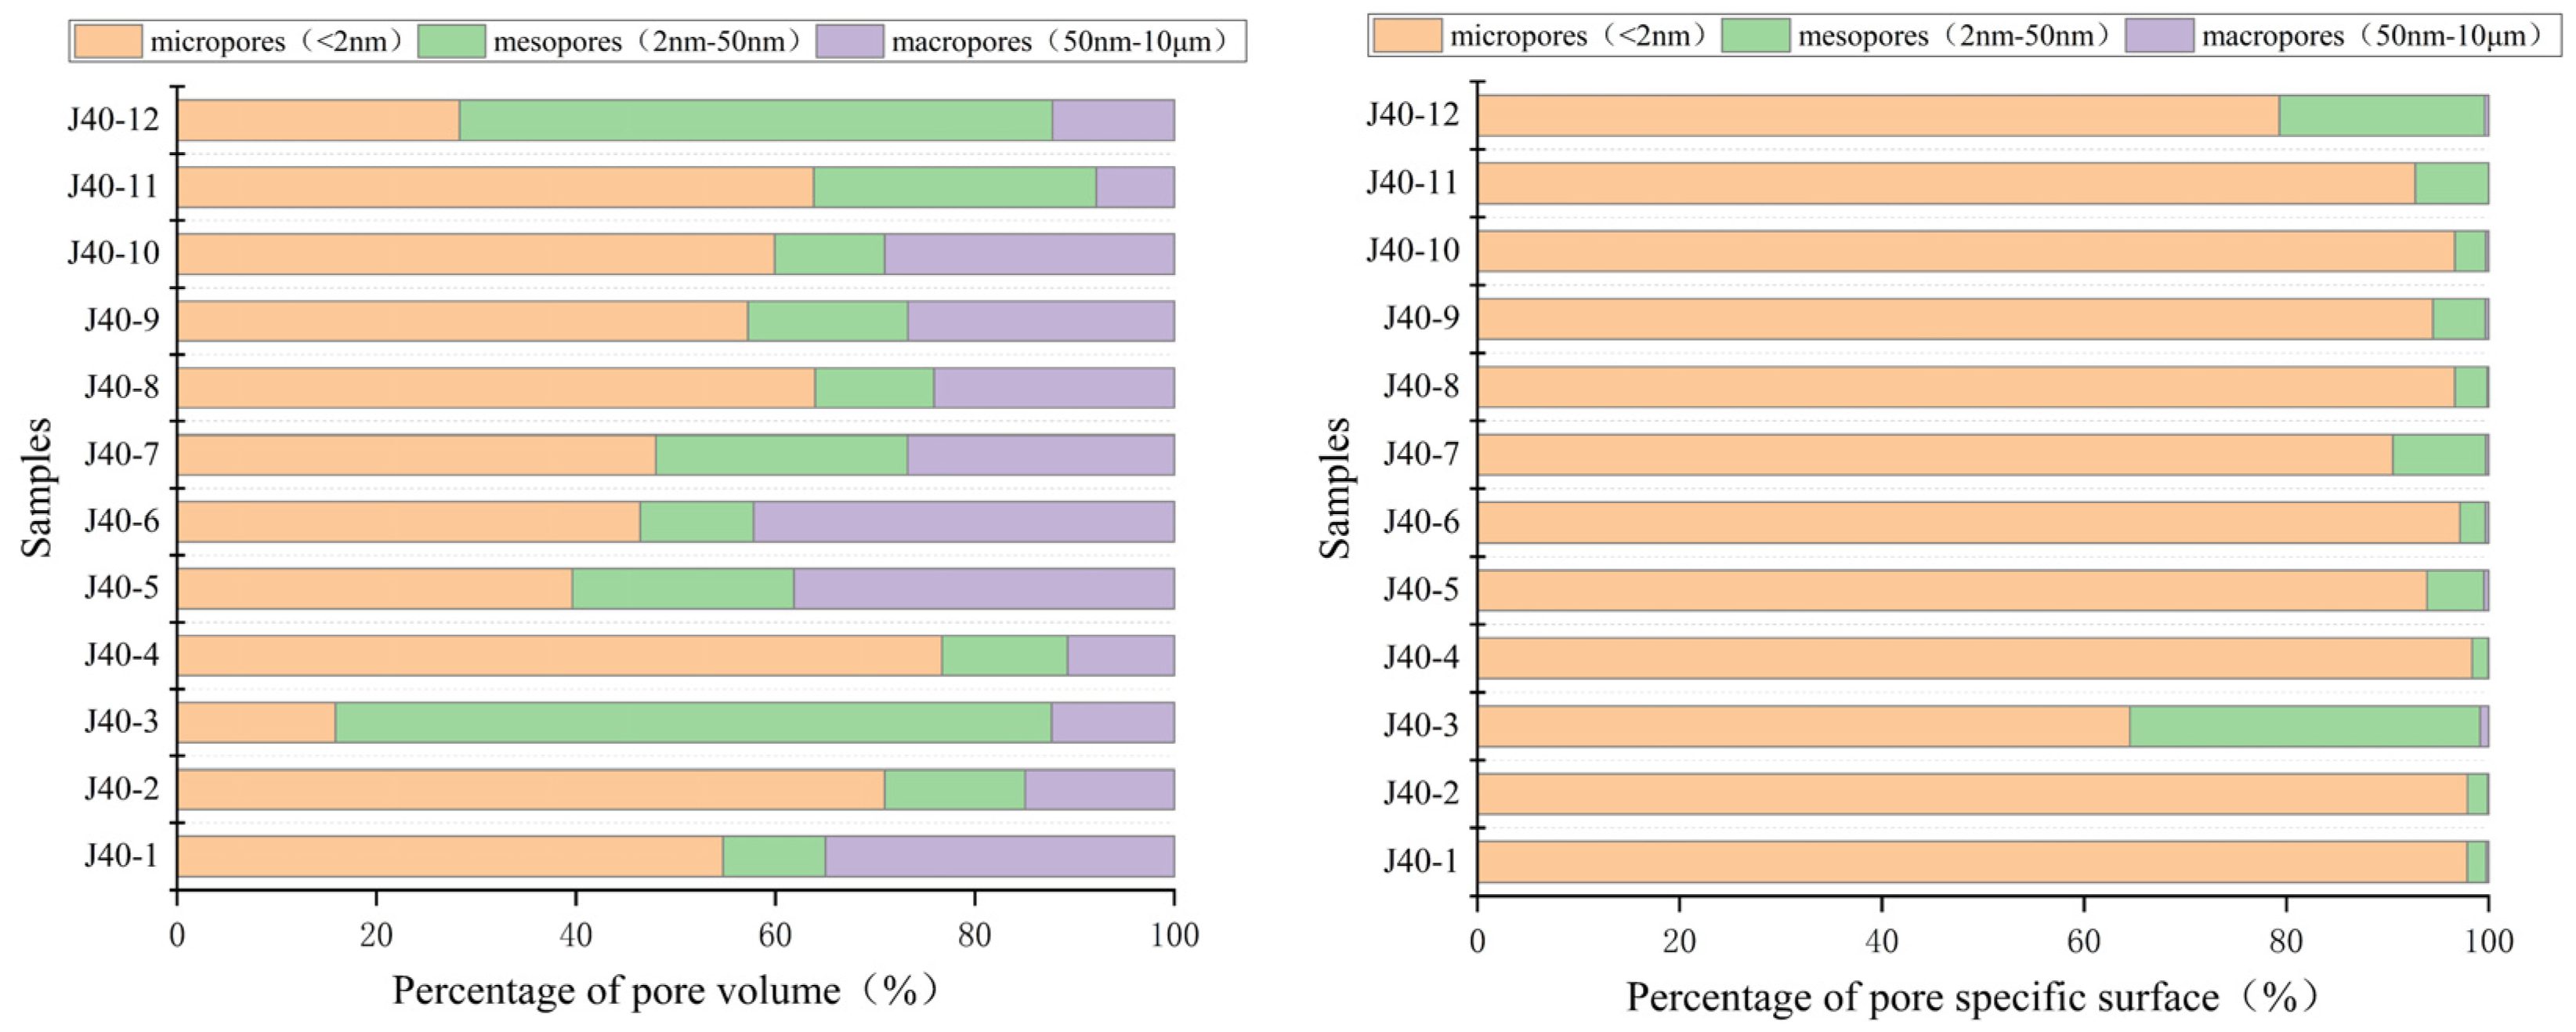
The pore size distribution of the sample showed a multi-modal state, the contribution of micropores was significant in the coal rocks, although micropores dominated, but macropores also existed, in the carbonaceous mudstones, and the mudstones were dominated by mesopores. In terms of the specific surface area, micropores contributed the most, especially in the coal rocks and the carbonaceous mudstones, and the contributions of the mesopores and macropores were negligible.
(3)
An increase in the vitrinite content favored the development of micropores, while an increase in Mad promoted the development of adsorption pores, resulting in increases in the microporous volume and specific surface area. The pore volume and specific surface area were negatively correlated with the ash yield, indicating that an increase in the ash yield leads to a decrease in the pore volume and specific surface area.
(4)
The specific surface areas of pores in coal affected the gas content primarily by influencing the amount of adsorbed gas. The specific surface areas of pores significantly impacted the storage capacity of adsorbed gas in coal.
The porosity of coal is highly heterogeneous, and the interplay between numerous influencing factors is intricate. Our research offers a significant advancement beyond traditional coal reservoir theory and the prevailing challenges in characterization techniques. Coal samples from the Jurassic Yan’an Formation, Longdong area, Ordos Basin, were taken as research objects, and the micro- and nanopore structures were characterized via scanning electron microscopy, HPMP, low-temperature N2 adsorption and low-pressure CO2 adsorption experiments. This approach is essential for accurately characterizing the pore structure of reservoirs as well as for gaining a deeper understanding of the mechanisms of CBM enrichment and flow in specific geological formations or regions. This study can offer a reference and guidance for the exploration and development of coalbed methane in the Yan’an Formation of the Longdong region within the Ordos Basin.

Author Contributions

Conceptualization, R.W.; methodology, T.W.; software, R.W.; validation, R.W. and B.L.; formal analysis, R.W.; investigation, resources and data curation, R.W., S.F., J.L. (Jiahao Lin) and J.L. (Jiahui Liu); writing—original draft preparation, R.W.; writing—review and editing, B.S. and T.W.; supervision, B.S. All authors have read and agreed to the published version of the manuscript.

Funding

This research was funded by National Science and Technology Major Program (2017ZX05039-001) and Xi’an Shiyou University Innovation and Practical Ability Cultivation Program (YCS23213067).

Data Availability Statement

The data presented in this study are available on request from the corresponding author. The data are not publicly available due to restrictions of privacy.

Conflicts of Interest

Author Tao Wang was employed by Chongqing University of Science and Technology. Author Jiahao Lin was employed by the Third Gas Production Plant of PetroChina Changqing Oilfield Co. The remaining authors declare that the research was conducted in the absence of any commercial or financial relationships that could be construed as a potential conflict of interest.

References

  1. Wang, S.M. Ordos Basin superposed evolution and structural controls of coal forming activities. Earth Sci. Front. 2017, 24, 54–63. [Google Scholar]
  2. Xu, F.; Hou, W.; Xiong, X.; Xu, B.; Wu, P.; Wang, H.; Feng, K.; Yun, J.; Li, S.; Zhang, L.; et al. The status and development strategy of coalbed methane industry in China. Pet. Explor. Dev. 2023, 50, 765–783. [Google Scholar] [CrossRef]
  3. Zou, C.; Yang, Z.; Huang, S.P.; Ma, F.; Sun, Q.P.; Li, F.H.; Pan, S.Q.; Tian, G.W. Resource types, formation, distribution and prospects of coal-measure gas. Pet. Explor. Dev. 2019, 46, 433–442. [Google Scholar]
  4. Jiang, W.; Zhang, P.; Li, D.; Li, Z.; Wang, J.; Duan, Y.; Wu, J.; Liu, N. Reservoir characteristics and gas production potential of deep coalbed methane: Insights from the no. 15 coal seam in shouyang block, Qinshui Basin, China. Unconv. Resour. 2022, 2, 12–20. [Google Scholar] [CrossRef]
  5. Skrzypkowski, K.; Zagórski, K.; Zagórska, A. Determination of the Extent of the Rock Destruction Zones around a Gasification Channel on the Basis of Strength Tests of Sandstone and Claystone Samples Heated at High Temperatures up to 1200 °C and Exposed to Water. Energies 2021, 14, 6464. [Google Scholar] [CrossRef]
  6. Wei, Q.; Li, X.; Hu, B.; Zhang, X.; Zhang, J.; He, Y.; Zhang, Y.; Zhu, W. Reservoir characteristics and coalbed methane resource evaluation of deep-buried coals: A case study of the No.13−1 coal seam from the Panji Deep Area in Huainan Coalfield, Southern North China. J. Petrol. Geol. 2019, 179, 867–884. [Google Scholar] [CrossRef]
  7. Dong, D.D.; Yang, J.S.; Hu, Q.J.; Cui, S.T.; Sun, F.J.; Zhang, J.D.; Cui, X.R. Pore structure characteristics of low-rank coal reservoirs with different ash yields and their implications for recoverability of coalbed methane-a case study from the Erlian Basin, northeastern China. Front. Earth Sci. 2023, 17, 18–29. [Google Scholar] [CrossRef]
  8. Li, W.; Li, J.; Hu, C.Q.; Xiao, Q.L. Research on Pore-Fracture Characteristics and Adsorption Performance of Main Coal Seams in Lvjiatuo Coal Mine. Processes 2023, 11, 1700. [Google Scholar] [CrossRef]
  9. Wang, D.X.; Hu, H.Y.; Wang, T.; Tang, T.; Li, W.P.; Zhu, G.G.; Chen, X.Y. Difference between of coal and shale pore structural characters based on gas adsorption experiment and multifractal analysis. Fuel 2024, 371, 132044. [Google Scholar] [CrossRef]
  10. Zhang, J.; Li, X.; Wei, Q.; Sun, K.; Zhang, G.; Wang, F. Characterization of Full-Sized Pore Structure and Fractal Characteristics of Marine–Continental Transitional Longtan Formation Shale of Sichuan Basin, South China. Energy Fuels 2017, 31, 10490–10504. [Google Scholar] [CrossRef]
  11. Wang, T.; Tian, F.; Deng, Z.; Hu, H. The Characteristic Development of Micropores in Deep Coal and Its Relationship with Adsorption Capacity on the Eastern Margin of the Ordos Basin, China. Minerals 2023, 13, 302. [Google Scholar] [CrossRef]
  12. Liu, S.; Sang, S.; Wang, G. FIB-SEM and X-ray CT characterization of interconnected pores in high-rank coal formed from regional metamorphism. J. Pet. Sci. Eng. 2017, 148, 21–31. [Google Scholar] [CrossRef]
  13. Yan, J.; Zhang, S.; Wang, J.; Hu, Q.; Wang, M.; Chao, J. Applying fractal theory to characterize the pore structure of lacustrine shale from the Zhanhua Depression in Bohai Bay Basin, Eastern China. Energy Fuels 2018, 32, 7539–7556. [Google Scholar] [CrossRef]
  14. Yang, R.; He, S.; Yi, J.; Hu, Q. Nano-scale pore structure and fractal dimension of organic-rich Wufeng-Longmaxi shale from Jiaoshiba area, Sichuan Basin: Investigations using FESEM, gas adsorption and helium pycnometry. Mar. Pet. Geol. 2016, 70, 27–45. [Google Scholar] [CrossRef]
  15. Wang, T.; Zhou, G.; Fan, L.; Zhang, D.; Shao, M.; Ding, R.; Li, Y.; Hu, H.; Deng, Z. Full-scale pore and microfracture characterization of deep coal reservoirs: A case study of the Benxi Formation coal in the Daning–Jixian block, China. Int. J. Energy Res. 2024, 2024, 5772264. [Google Scholar] [CrossRef]
  16. Xi, Z.; Tang, S.; Wang, J.; Yang, G.; Li, L. Formation and development of pore structure in marine continental transitional shale from northern China across a maturation gradient: Insights from gas adsorption and mercury intrusion. Int. J. Coal Geol. 2018, 200, 87–102. [Google Scholar] [CrossRef]
  17. Li, X.C.; Gao, J.X.; Zhang, S.; Li, Y.; Wang, M.Y.; Lu, W.D. Combined Characterization of Scanning Electron Microscopy, Pore and Crack Analysis System, and Gas Adsorption on Pore Structure of Coal with Different Volatilization. Earth Sci. 2022, 47, 1876–1889. [Google Scholar]
  18. Tang, X.; Li, J.H. Transmission Electron Microscopy: New Advances and Applications for Earth and Planetary Sciences. Earth Sci. 2021, 46, 1374–1415. [Google Scholar]
  19. Clarkson, C.R.; Haghshenas, B.; Ghanizadeh, A.; Qanbari, F.; Williams-Kovacs, J.D.; Riazi, N.; Debuhr, C.; Deglint, H.J. Nanopores to megafractures: Current challenges and methods, for shale gas reservoir and hydraulic fracture characterization. J. Nat. Gas Sci. Eng. 2016, 31, 612–657. [Google Scholar] [CrossRef]
  20. Meng, M.; Ge, H.; Shen, Y.; Ji, W. Fractal Characterization of Pore Structure and Its Influence on Salt Ion Diffusion Behavior in Marine Shale Reservoirs. Int. J. Hydrogen Energy 2020, 45, 28520–28530. [Google Scholar] [CrossRef]
  21. Hu, X.; Wu, C.W.; Yang, X.C.; Cheng, Q.H.; Zhu, W.T.; Ma, L.; Zhu, X.G.; Xu, B.R. Microscopic Pore Structure and Coalbed Methane Desorption Law in Low-Permeability Coal Seams. Spec. Oil Gas Reserv. 2024, 31, 129–135. [Google Scholar]
  22. Cui, X.; Bustin, R.M.; Dipple, G. Selective transport of CO2, CH4, and N2 in coals: Insights from modeling of experimental gas adsorption data. Fuel 2004, 83, 293–303. [Google Scholar] [CrossRef]
  23. Li, A.; Ding, W.; He, J.; Dai, P.; Yin, S.; Xie, F. Investigation of Pore Structure and Fractal Characteristics of Organic-Rich Shale Reservoirs: A Case Study of Lower Cambrian Qiongzhusi Formation in Malong Block of Eastern Yunnan Province, South China. Mar. Pet. Geol. 2016, 70, 46–57. [Google Scholar] [CrossRef]
  24. Adeyilola, A.; Nordeng, S.; Hu, Q.H. Porosity and Pore Networks in Tight Dolostone-Mudstone Reservoirs: Insights from the Devonian Three Forks Formation, Williston Basin, USA. J. Earth Sci. 2022, 33, 462–481. [Google Scholar] [CrossRef]
  25. Mahamud, M.M.; Menéndez, J.M.; Álvarez, A. Fractal Analysis of CO2 and N2 Adsorption Data to Assess Textural Changes during Char Gasification. Fuel Process. Technol. 2019, 189, 15–27. [Google Scholar] [CrossRef]
  26. Li, S.; Tang, D.; Xu, H.; Yang, Z. Advanced characterization of physical properties of coals with different coal structures by nuclear magnetic resonance and X-ray computed tomography. Comput. Geosci. 2012, 48, 220–227. [Google Scholar] [CrossRef]
  27. Xin, F.; Xu, H.; Tang, D.; Cao, L. An Improved Method to Determine Accurate Porosity of Low-Rank Coals by Nuclear Magnetic Resonance. Fuel Process. Technol. 2020, 205, 106435. [Google Scholar] [CrossRef]
  28. Zhao, Y.; Li, Y.; Wang, Z.; Huang, X. Quantitative study on coal and shale pore structure and surface roughness based on atomic force microscopy and image processing. Fuel 2019, 244, 78–90. [Google Scholar] [CrossRef]
  29. Rouquerol, J.; Avnir, D.; Fairbridge, C.W.; Everett, D.H.; Haynes, J.M.; Pernicone, N.; Ramsay, J.D.; Sing, K.S.W.; Unger, K.K. Recommendations for the characterization of porous solids (Technical Report). Pure Appl. Chem. 1994, 66, 1739–1758. [Google Scholar] [CrossRef]
  30. Hainbuchner, M.; Hinde, A.L.; Baron, M.; Rauch, H.; Radlinski, A.P.; Mastalerz, M.; Lin, J.S.; Fan, L.; Thiyagarajan, P. Application of SAXS and SANS in evaluation of porosity, pore size distribution and surface area of coal. Int. J. Coal Geol. 2004, 59, 245–271. [Google Scholar]
  31. GB/T 6948-2008; Method of Determining Microscopically the Reflectance of Vitrinite in Coal. Standardization Administration of China: Beijing, China, 2008.
  32. GB/T 8899-2013; Determination of Maceral Group Composition and Minerals in Coal. Standardization Administration of China: Beijing, China, 2013.
  33. GB/T 30732-2014; Proximate Analysis of Coal—Instrumental Method. Standardization Administration of China: Beijing, China, 2014.
  34. GB/T 21650.2-2008; Pore Size Distribution and Porosity of Solid Materials by Mercury Porosimetry and Gas Adsorption—Part 2: Analysis of Mesopores and Macropores by Gas Adsorption. Standardization Administration of China: Beijing, China, 2008.
  35. GB/T 21650.3-2011; Pore Size Distribution and Porosity of Solid Materials by Mercury Porosimetry and Gas Adsorption—Part 3: Analysis of Micropores by Gas Adsorption. Standardization Administration of China: Beijing, China, 2011.
  36. GB/T 19560-2008; Experimental Method of High-Pressure Isothermal Adsorption to Coal. Standardization Administration of China: Beijing, China, 2008.
  37. Zhao, D.; Guo, Y.; Mao, X.; Lu, C.; Li, M.; Qian, F. Micro-nanopore characteristics of anthracite based on mercury injection, nitrogen adsorption and FESEM. J. China Coal Soc. 2017, 42, 1517–1526. [Google Scholar]
  38. Li, Z.; Liu, D.; Cai, Y.; Wang, Y.; Teng, J. Adsorption Pore Structure and Its Fractal Characteristics of Coals by N2 Adsorption Desorption and FESEM Image Analyses. Fuel 2019, 257, 116031. [Google Scholar] [CrossRef]
  39. Yang, F.; Ning, Z.F.; Kong, D.T.; Liu, H.Q. Pore Structure of Shales from High Pressure Mercury Injection and Nitrogen Adsorption Method. Nat. Gas Geosci. 2013, 24, 450–455. [Google Scholar]
  40. Okolo, G.; Everson, R.; Neomagus, H.; Roberts, M.; Sakurovs, R. Comparing the porosity and surface areas of coal as measured by gas adsorption, mercury intrusion and SAXS techniques. Fuel 2015, 141, 293–304. [Google Scholar] [CrossRef]
  41. Wang, X.; Zhu, Y.; Wang, Y. Fractal Characteristics of Micro- and Mesopores in the Longmaxi Shale. Energies 2020, 13, 1349. [Google Scholar] [CrossRef]
  42. Pan, J.; Wang, K.; Hou, Q.; Niu, Q.; Wang, H.; Ji, Z. Micro-pores and fractures of coals analysed by field emission scanning electron microscopy and fractal theory. Fuel 2016, 164, 277–285. [Google Scholar] [CrossRef]
  43. Zhang, K.; Cheng, Y.; Li, W.; Hao, C.; Hu, B.; Jiang, J. Microcrystalline Characterization and Morphological Structure of Tectonic Anthracite Using XRD, Liquid Nitrogen Adsorption, Mercury Porosimetry, and Micro-CT. Energy Fuels 2019, 33, 10844–10851. [Google Scholar] [CrossRef]
  44. Lai, F.; Li, Z.; Zhang, W.; Dong, H.; Kong, F.; Jiang, Z. Investigation of pore characteristics and irreducible water saturation of tight reservoir using experimental and theoretical methods. Energy Fuels 2018, 32, 3368–3397. [Google Scholar] [CrossRef]
  45. Pan, J.; Zhu, H.; Hou, Q.; Wang, H.; Wang, S. Macromolecular and Pore Structures of Chinese Tectonically Deformed Coal Studied by Atomic Force Microscopy. Fuel 2015, 139, 94–101. [Google Scholar] [CrossRef]
  46. Yao, Y.; Liu, D.; Che, Y.; Tang, D.; Tang, S.; Huang, W. Petro-physical Characterization of Coals by Low-field Nuclear Magnetic Resonance (NMR). Fuel 2010, 89, 1371–1380. [Google Scholar] [CrossRef]
  47. Hu, H.; Hao, F.; Lin, J.; Lu, Y.; Ma, Y.; Li, Q. Organic matter hosted pore system in the Wufeng-Longmaxi (O3w-S11) shale, Jiaoshiba area, Eastern Sichuan Basin, China. Int. J. Coal Geol. 2017, 173, 40–50. [Google Scholar] [CrossRef]
  48. Zhang, S.S.; Wu, C.F.; Liu, H. Comprehensive characteristics of pore structure and factors influencing micropore development in the Laochang mining area, eastern Yunnan, China. J. Pet. Sci. Eng. 2020, 190, 107090. [Google Scholar] [CrossRef]
  49. Zhu, G.G.; Xie, Z.T.; Wang, T.; Hu, H.Y.; Wang, D.X. Microscopic pore structure characteristics of Shanxi Formation coal reservoir in Daning-Jixian Block. Saf. Coal Mines 2024, 55, 31–42. [Google Scholar]
  50. Mou, P.; Pan, J.; Niu, Q.; Wang, Z.; Li, Y.; Song, D. Coal Pores: Methods, Types and Characteristics. Energy Fuels 2021, 35, 7467–7484. [Google Scholar] [CrossRef]
Figure 1. Comprehensive histogram of the main Jurassic coal-bearing zones and strata in the Ordos Basin.
Processes 12 02787 g001
Figure 2. Pore development characteristics of coal-bearing rock systems of the Yan’an Formation (a) J40-1, two cracks crossing, development of organic pores and minerals; (b) J40-1, development of organic pores, cracks filled with minerals; (c) J40-1, development of organic pores, some organic pores filled with pyrite and clay minerals; (d) J40-6, development of organic matter and a crack, with pyrite being visible; (e) J40-6, development of clay mineral pores; (f) J40-6, development of clay mineral pores, clay mineral interlayer joints and pyrite in clay minerals; (g) J40-3, development of organic pores, with pyrite being visible; (h) J40-3, development of a fissure, with organic pores being visible; (i) J40-3, development of clay mineral pores and clay mineral interlayer joints.
Processes 12 02787 g002
Figure 3. Mercury intrusion and withdrawal curves for samples from coal-bearing rock systems.
Processes 12 02787 g003
Figure 4. Pore volume and pore specific surface area distribution curves based on high-pressure mercury compression tests.
Processes 12 02787 g004
Figure 5. Low-temperature N2 adsorption–desorption isotherms.
Processes 12 02787 g005
Figure 6. Pore volume and pore specific surface area distribution curves obtained via the low-temperature N2 adsorption method.
Processes 12 02787 g006
Figure 7. Low-pressure CO2 adsorption isotherms.
Processes 12 02787 g007
Figure 8. Pore volume and pore specific surface area distribution curves obtained based on low-pressure CO2 adsorption data.
Processes 12 02787 g008
Figure 9. Isothermal adsorption curves for the coal rock samples.
Processes 12 02787 g009
Figure 10. Characterization of the multiscale pore volume and specific surface area distributions based on the three combined methods.
Processes 12 02787 g010
Figure 11. Distributions of the pore volume and specific surface area as percentages of the full pore size.
Processes 12 02787 g011
Figure 12. Relationships of the pore volume and specific surface area with the microcomponent composition at different scales in coal rock samples. (a) Relationship between the vitrinite content and pore volume; (b) Relationship between the vitrinite content and specific surface area; (c) Relationship between the inertinite content and pore volume; (d) Relationship between the inertinite content and specific surface area.
Processes 12 02787 g012aProcesses 12 02787 g012b
Figure 13. Pore volume and specific surface area of coal rock samples at different scales in relation to the proximate analysis results. (a) Relationship between the Mad content and pore volume; (b) Relationship between the Mad content and specific surface area; (c) Relationship between the Aad content and pore volume; (d) Relationship between the Aad content and specific surface area.
Processes 12 02787 g013aProcesses 12 02787 g013b
Figure 14. Relationships of the pore volume and specific surface area with the VL and PL of the coal rock samples. (a) Relationship between the pore volume and Langmuir volume VL; (b) Relationship between the specific surface area and Langmuir volume VL; (c) Relationship between the pore volume and Langmuir pressure PL; (d) Relationship between the specific surface area and Langmuir pressure PL.
Processes 12 02787 g014aProcesses 12 02787 g014b
Table 1. Specular plasma reflectance of the samples, maceral composition analysis results and proximate analysis results.
SamplesStratum (Geology)LithologyRo
/%
Vitrinite/%Exinite /%Inertinite
/%
Minerals /%Mad
/%
Aad
/%
Vad
/%
FCad
/%
J40-1Yan’an Groupcoal0.9735.500.4038.6025.501.3210.7136.8851.09
J40-2Yan’an Groupcoal0.9651.203.5041.603.801.445.1230.7062.74
J40-3Yan’an Groupshale/ 1////1.8985.77//
J40-4Yan’an Groupcoal0.8838.406.7048.806.200.906.7628.8363.51
J40-5Yan’an Groupcarbonaceous mudstone (geology)0.7317.504.408.0070.101.0455.0618.7825.12
J40-6Yan’an Groupcoal0.8047.702.1021.4028.801.1323.0328.6447.20
J40-7Yan’an Groupcoal0.7144.703.4044.107.807.194.5925.8662.37
J40-8Yan’an Groupcoal0.5370.801.4023.304.507.384.5534.8153.27
J40-9Yan’an Groupcoal0.5451.303.0039.306.407.737.4530.6854.15
J40-10Yan’an Groupcoal0.4954.204.0035.006.807.947.0232.9852.07
J40-11Yan’an Groupcoal0.5741.306.9042.908.905.9211.7931.5350.76
J40-12Yan’an Groupshale/////1.9786.42//
1 Note: “/” means not tested.
Table 2. Pore structure parameters of samples from the study area.
SamplesHigh-Pressure Mercury CompressionLow-Temperature Nitrogen Adsorption (DFT)Low-Pressure Carbon Dioxide Adsorption (DFT)
Pore Volume
(cm3/g)
Specific Surface Area
(m2/g)
Pore Volume
(cm3/g)
Specific Surface Area
(m2/g)
Average Pore Diameter
(nm)
Pore Volume
(cm3/g)
Specific Surface Area
(m2/g)
Average Pore Diameter
(nm)
J40-10.0424.5960.0072.00020.5050.031100.9800.747
J40-20.0305.0490.0072.16920.5050.031103.3800.747
J40-30.0030.7720.02510.74919.5400.00514.5200.747
J40-40.0203.9340.0061.75120.5050.033105.8000.747
J40-50.0374.2890.0113.48120.5050.01856.5400.747
J40-60.0424.1220.0072.21420.5050.02683.0490.747
J40-70.07814.0170.02918.98019.5400.054183.7200.748
J40-80.0457.5080.0105.85419.5400.053175.8300.748
J40-90.0659.6930.01710.34519.5400.057186.6200.748
J40-100.0659.2170.0115.97919.5400.056188.0000.748
J40-110.0306.4530.02111.69619.5400.045149.4200.748
J40-120.0051.1480.02011.31519.5400.00826.1200.748
Table 3. Statistical methane isothermal adsorption data of coal rock samples from the study area.
SamplesLangstroth Pressure PL/(MPa)Langstroth Volume VL/(m3/t)
J40-13.8627.942
J40-24.1107.420
J40-46.2408.325
J40-65.1046.996
J40-79.44214.654
J40-84.36110.407
J40-94.70612.645
J40-104.8459.895
J40-116.68411.082
Table 4. Characterization of the full pore size pore structure of the samples from the study area.
SamplesPore Volume/(cm3/g)Specific Surface Area/(m2/g)
MicroporousMesoporousMacroporousTotal Hole VolumeMicroporousMesoporousMacroporousTotal Specific Surface Area (TSA)
J40-10.0310.0060.0200.057100.9801.9470.251103.178
J40-20.0310.0060.0070.044103.3802.0950.129105.604
J40-30.0050.0210.0040.02914.6227.8560.19122.670
J40-40.0330.0050.0050.043105.8001.6700.075107.574
J40-50.0180.0100.0170.04456.5403.3850.28660.212
J40-60.0260.0060.0240.05683.0492.1600.28085.488
J40-70.0540.0280.0300.113183.95118.6850.606203.242
J40-80.0530.0100.0200.083175.8305.8200.285181.936
J40-90.0570.0160.0270.100186.62010.2810.641197.542
J40-100.0560.0100.0270.093188.0005.9380.557194.495
J40-110.0450.0200.0060.070149.42011.6480.050161.118
J40-120.0080.0170.0040.02926.5556.7920.14033.486
Disclaimer/Publisher’s Note: The statements, opinions and data contained in all publications are solely those of the individual author(s) and contributor(s) and not of MDPI and/or the editor(s). MDPI and/or the editor(s) disclaim responsibility for any injury to people or property resulting from any ideas, methods, instructions or products referred to in the content.

