Article

The Impact of Solar Radiation at Different Colombian Thermal Floors on an Adsorption Refrigeration Cycle

by
Dario Serrano-Florez
1,*,
Aduar J. Camargo
1,
Gail Gutierrez
1,
Marlon Bastidas-Barranco
1,
Edwin Chica
2 and
Andres Colorado
3
1
Grupo Desarrollo de Estudios y Tecnologías Ambientales del Carbono (DESTACAR), Universidad de La Guajira, Riohacha 440003, Colombia
2
Grupo de Energía Alternativa (GEA), Facultad de Ingeniería, Universidad de Antioquia, Medellín 050010, Colombia
3
Grupo de Ciencia y Tecnología del Gas y Uso Eficiente y Racional de la Energía (GASURE), Facultad de Ingeniería, Universidad de Antioquia, Medellín 050010, Colombia
*
Author to whom correspondence should be addressed.
Processes 2023, 11(8), 2499; https://doi.org/10.3390/pr11082499
Submission received: 28 April 2023 / Revised: 6 June 2023 / Accepted: 14 June 2023 / Published: 19 August 2023
(This article belongs to the Section Energy Systems)

Abstract

:
The process of energy transition in Colombia has sparked an exploration into appropriate geographical areas for the utilization of solar energy. The country’s rugged terrain and significant climate variability pose challenges for implementing standardized technologies uniformly across all regions. Consequently, this study aims to develop and apply a mathematical model to characterize the performance of a solar adsorption cooling system under the environmental conditions found in six distinct Colombian cities, taking into account different thermal profiles and extreme weather periods such as the El Niño and La Niña phenomena. The selected mathematical model was simulated in these cities, considering ambient temperature and solar radiation variables over a twelve-month period during these extreme weather phenomena and an additional twelve-month period representative of a typical year with minimal influence from these phenomena. The results indicated that despite a lower coefficient of performance (COP) compared to the other cities, Riohacha demonstrated a greater number of ice production days owing to its high levels of solar radiation.

1. Introduction

Similar to other forms of renewable energy, solar energy exhibits intermittent behavior, resulting in an unpredictable energy flow. Consequently, any solar radiation harnessing design must consider the variable atmospheric conditions prevailing at the chosen sites [1,2,3]. The utilization of renewable energy sources largely depends on the local climatic conditions of the study areas. Understanding these conditions is essential in identifying suitable locations for power generation using solar, wind, biomass, and other energy sources. In some cases, it may be necessary to employ hybrid systems to optimize efficiency in harnessing renewable sources. For photovoltaic and solar thermal technologies, it is critical to consider the specific location or region of interest for system implementation. A comprehensive set of meteorological data or atmospheric conditions, including wind variables, cloudiness, and solar irradiation variations, should be taken into account. Understanding these variables is crucial for developing equipment with efficiencies tailored to the local atmospheric conditions [4,5].
Typically, investigations into climate variability rely on a representative year to demonstrate the energy potential with seasonal fluctuations over an extended duration, aiming to reduce uncertainty in the findings. Nevertheless, certain researchers contend that for evaluating the potentials of photovoltaic and thermal solar energy, a broader contextual framework is imperative, surpassing the limitations inherent in a conventional annual representation [6,7].
The effects of global warming are currently linked to the emission of greenhouse gases from fossil fuels, particularly due to the production of CO 2 . The present concentration of CO 2 in the atmosphere is approximately 417   p p m by volume and is increasing at an approximate rate of 2.07   p p m per year. Renewable energy resources, such as solar energy, present a viable solution to help mitigate the effects of climate change [8,9]. However, the phenomena associated with climate change, specifically extended periods of excessive drought known as “El Niño” and periods of intense rainfall known as “La Niña”, can significantly impact the harnessing of solar resources. Consequently, it is crucial to take these phenomena into account when evaluating energy potentials.
Similarly, in countries with diverse topography, it is crucial to take into account the thermal floors that exhibit distinct climatic characteristics due to the effects of altitude. Specifically, the impact of altitude on the evaluation of solar energy potential has not been extensively studied.
The work presented by Ospino [10] conducts a study on the solar energy potential in the Colombian Caribbean. It emphasizes that the geographical position and savanna conditions augment the feasibility of harnessing this type of energy. However, it does not discuss additional climatic aspects that could further enhance the potential in the area. La Guajira is located at the northernmost tip of South America in the northeastern region of Colombia, bordering the Caribbean Sea and Venezuela. It is important to note that insolation in La Guajira is higher than in other regions of Colombia, and it is also higher than in some countries in Europe and Central America [11].
La Guajira is currently recognized as an epicenter for solar generation in Colombia, prompting numerous studies on this territory to characterize solar radiation, generally via meteorological stations [11], or through satellite projections presented by organizations such as the National Aeronautics and Space Administration (NASA) [12] and the Colombian Institute of Hydrology, Meteorology, and Environmental Studies (IDEAM) [13]. While the data indicate exceptional potential for solar radiation and thus significant energy potential in the region, it remains crucial to analyze additional aspects, such as climate and temperature variability, to establish minimum radiation potentials for solar equipment design.
Typically, the analysis of solar radiation energy potential relies on information from meteorological or satellite stations. These data are then utilized to construct maps that guide decision making. This work seeks to make a complementary contribution specifically by applying solar adsorption cooling technology [14,15,16,17,18]. The coefficient of performance (COP) of this technology is modeled based on the ambient temperature and solar radiation conditions in six cities located at different altitudes: Riohacha, Medellin, Cali, Bucaramanga, Bogota, and Tunja. Importantly, this work also considers periods influenced by the El Niño/La Niña interannual climate variability phenomena as well as periods not influenced by these phenomena (referred to in this work as a typical period/year).
The goal of this study is to evaluate the COP of an intermittent ice-making solar adsorption system, considering the input conditions—ambient temperature and solar radiation—in six cities of varying altitudes and affected by the El Niño and La Niña interannual climate variability phenomena. This study aims to quantify the number of ice production days throughout the year.

2. Methodology

The methodological approach of this research is divided into three parts. The first part involves developing a theoretical model of a solar adsorption ice-maker, in which the operating variables are contingent upon the site’s ambient temperature and solar radiation. The second part entails an analysis of the radiation potential in various Colombian cities located at different altitudes, taking into account climate variations due to the El Niño and La Niña phenomena. The third part involves a numerical solution where parameters of interest such as the Coefficient of Performance (COP), the minimum solar radiation required for ice production (I G , m i n ) , and the cooling capacity (i.e., the energy transfer in the evaporator) (SCE) are determined. Further details on these methodological components are provided in the sections below [19,20].

2.1. Development of the Theoretical Model of a Solar Thermal System That Operates through an Adsorption Refrigeration Cycle

The proposed system is an adsorption intermittent ice-maker featuring four theoretical stages. The adsorbent–adsorbate system comprises activated carbon solid (CA) and methanol vapor ( m r , g ) . For a three-component absorption ice-maker, the configuration is depicted in Figure 1a, while the thermal process diagram is shown in Figure 1b.
The first stage occurs in the collector, where an initial maxima concentration of the x i = m r , g / C A is observed before sunrise (point A). As the sun intensifies, the system temperature increases at a constant concentration until the pressure reaches saturation (point B).
The second stage takes place at a constant pressure. Here, increased radiation encourages desorption until a minimum concentration is reached in the collector (point D), which is followed by a heat exchange process in which the collector has a net heat gain and the desorbed methanol transitions to the condenser.
The third stage begins at sunset with a minimum concentration of the x f = m r , g / C A constant. As the environment cools, the pressure reaches saturation (point F).
The fourth stage occurs as the temperature continues to drop at constant pressure during an adsorption process (point A). This stage is accompanied by an imminent heat exchange in the evaporator, where heat is extracted from the medium, and the methanol transitions to the collector [21,22].
Figure 1. Solar adsorption cooling system. (a) Equipment configuration, (b) Thermal process diagram [19,23,24].
Processes 11 02499 g001
Upon defining the process and thermal equipment for evaluating solar potential, a mathematical model is developed. This model governs the behavior of the variables involved in the mass and energy balances [25].
The ratio of methanol (working fluid) to activated carbon (the adsorbent) is derived from the difference between the maximum and minimum concentrations of methanol occurring in the collector. This balance leads to Equation (1).
m r , g / m a = x i x f
In the equation, m ( r , g ) represents the mass of the generated refrigerant, m a denotes the mass of the absorbent, x i is the initial concentration, and x f is the final concentration.
Taking into account the heat transfer between the system and its surroundings, we obtain the total heat balance equations for one operational day (one cycle), as shown in Equations (2)–(8) [25,26].
Q T + Q e Q A Q c = 0
Q T = Q I S O S + Q D E S
Q I S O S m a = C p a + C p r · x i T g 1 T i
Q D E S m a = C p a + C p r x i + x f 2 T f T g 1 + x i x f H a d s
Q e m a = S C E = L C p r T i T e x i x f
C O P = Q e / m a Q T / m a
I G , m i n = Q T / m a η C m a A C
In these equations, Q T is the heat gained in the collector–generator, Q e refers to the heat gained in the evaporator, Q A is the heat given up in the collector–generator, and Q c is the heat given up in the condenser. Q I S O S denotes the heat in the isosteric heating stage, and Q D E S is the heat in the desorption stage. Q I S O S / m a is the heat gain needed to execute the isochoric process per unit mass of C A , while Q D E S / m a is the heat gain required to conduct the isobaric desorption process per unit mass of C A . Q e / m a represents the balance in the evaporator per unit mass of CA. COP is the coefficient of performance, and I G , m i n is the minimum incident solar energy needed for one cycle during an operational day. C p a is the specific heat of the adsorbent, and C p r stands for the specific heat of the refrigerant. T g 1 is the unknown temperature at the beginning of desorption. T i is the initial temperature, T f is the final temperature, T E is the evaporator temperature related to P E , and T C is related to P C . H a d s is the constant heat adsorption for the methanol– C A working pair ( H a d s = 1400   k J / k g ). L is the latent heat of vaporization of methanol. η c is the collector efficiency, and A C is the collector area.
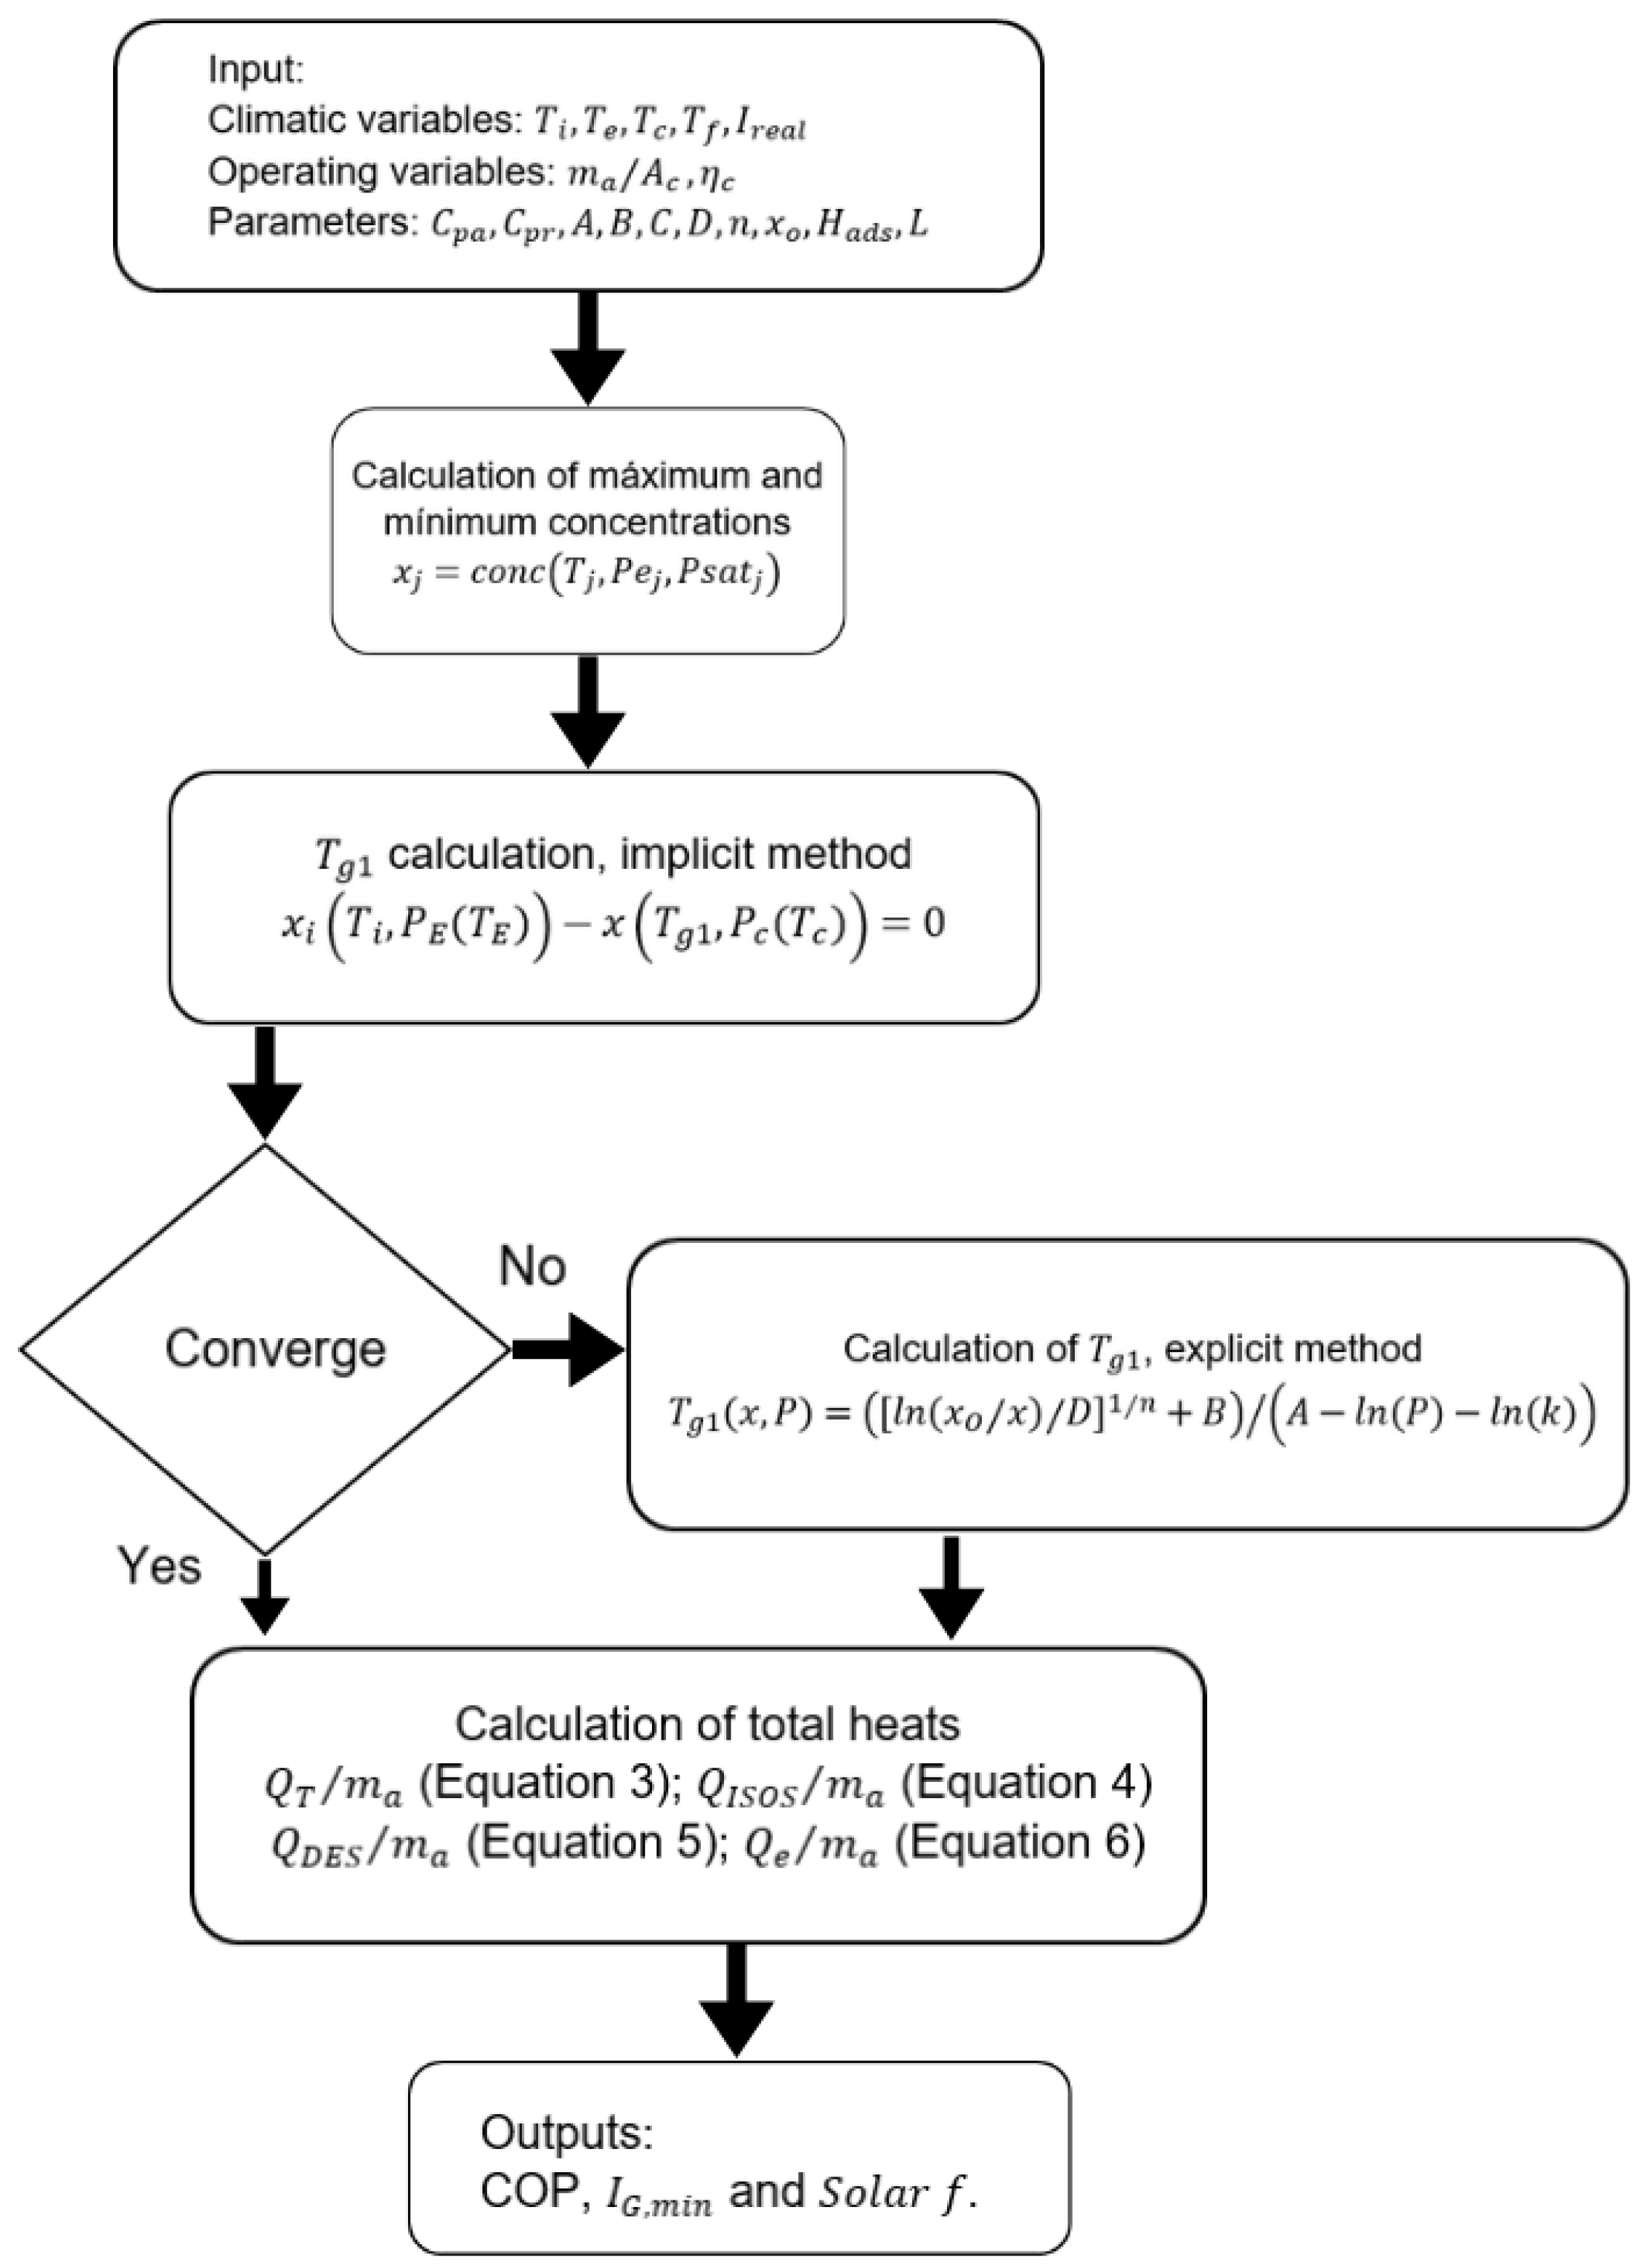
This research starts with a fixed evaporator temperature ( T e = 5   C ) . The model then calculates the uptake temperature T g 1 , which signifies the minimum temperature required for desorption to initiate and to ensure the refrigeration cycle. This calculation employs an implicit iterative method with a minimum error-stopping criterion, as shown in Equation (9), utilizing MATLAB. This equation is nonlinear and hinges on the bivariate Dubinin–Astakhov equilibrium concentration of an adsorbent–adsorbate working pair and methanol saturation state equation [25,27]. However, as the T f temperatures decrease, the implicit method may fail to derive logical results. Consequently, an explicit method, outlined in Equation (10), is applied. Although this method provides a good approximation to the real values, its error is typically larger than that obtained using the implicit method.
x i T i , P E T E x T g 1 , P c T c = 0
T g 1 x , P = ln x 0 / x / D 1 / n + B / A ln P ln k
An additional challenge presented by the proposed model involves determining the minimum solar radiation intensity required for ice production through mass and energy balances. In addressing this challenge, the results derived from Equation (8) are contrasted with the daily, real-time radiation data at each reference location. This approach enables the establishment of the climatic conditions necessary for ice production over extended periods of analysis.

2.2. Atmospheric Conditions as a Function of El Niño and La Niña Events at Different Altitudes

This analysis is fundamental to feed the mathematical model, for which six Colombian cities located at different altitudes (masl) were selected: (1) Riohacha (11.53 N, 72.92 W, 3 masl); (2) Bucaramanga (7.12 N, 73.18 W, 959 masl); (3) Cali (3.38 N, 76.53 W, 1018 masl); (4) Medellín (6.22 N, 75.59 W, 1495 masl); (5) Bogotá (4.79 N, 74.05 W, 2625 masl) and (6) Tunja (5.68 N, 72.97 W, 2782 masl), which are identified in Figure 2.
In each city, satellite georeferencing was employed to estimate the average daily solar radiation data for a year, including the respective maximum, minimum, and average ambient temperatures. The dataset consists of continuous records spanning a year dominated by the El Niño effect, another year dominated by La Niña, and a third year with minimal influence from both El Niño and La Niña. This comprehensive analysis incorporates over 20,000 data points, ensuring a robust evaluation of the solar energy potential in each location.
To assess the predominance of these phenomena, we considered the Oceanic Niño Index (ONI), which evaluates the interplay between the atmosphere and the ocean within the El Niño-Southern Oscillation (ENSO) system. The ONI is provided by the National Oceanic and Atmospheric Administration (NOAA) [28], and their portal serves as a key resource for understanding the interannual relations of extreme climate variability, such as heavy rainfall, droughts, and storms. The ONI index indicates the intensity and type of climatic variability. Negative values below 0.5 correspond to the La Niña phenomenon, indicating cold periods, while positive values above 0.5 indicate the presence of El Niño, signifying warm periods. Values between 0.5 and 0.5 are considered to have no significant influence from either phenomenon and are considered typical values.
According to the ONI criteria, twelve consecutive months were identified based on the highest frequency of negative values below 0.5 , indicating the presence of the La Niña phenomenon. Additionally, twelve months were selected based on the highest frequency of positive values exceeding 0.5 , representing the occurrence of El Niño. The chosen periods, comprising twelve consecutive months each for El Niño, La Niña, and a typical year, are presented in Table 1. This approach ensures a comprehensive analysis of the respective climatic phenomena and establishes a solid foundation for the study.
The data presented in Table 1 for each month are formed by an average that includes the value of the previous month, reference month, and month after the reference data. For example, J F M is the average data for February, which is obtained from the values of January, February, and March.
Table 1 displays the specific months selected for each phenomenon. For the La Niña phenomenon, the chosen months are from June to December 2010 and from January to May 2011. Regarding the El Niño phenomenon, the selected months are from May to December 2015 and from January to April 2016. For the year unaffected by these phenomena, all months of 2017 were considered. Meteorological data, including ambient temperature and solar radiation, were obtained from the IDEAM databases. In addition, NASA data were used to supplement the periods corresponding to each specific year of interest, as indicated by the geographical coordinates.

2.3. Numerical Solution

The information from the mathematical model and the climatic variables of analysis (ambient temperature and solar radiation) are integrated into the process shown in the diagram in Figure 3, following reference [25].

3. Results and Discussion

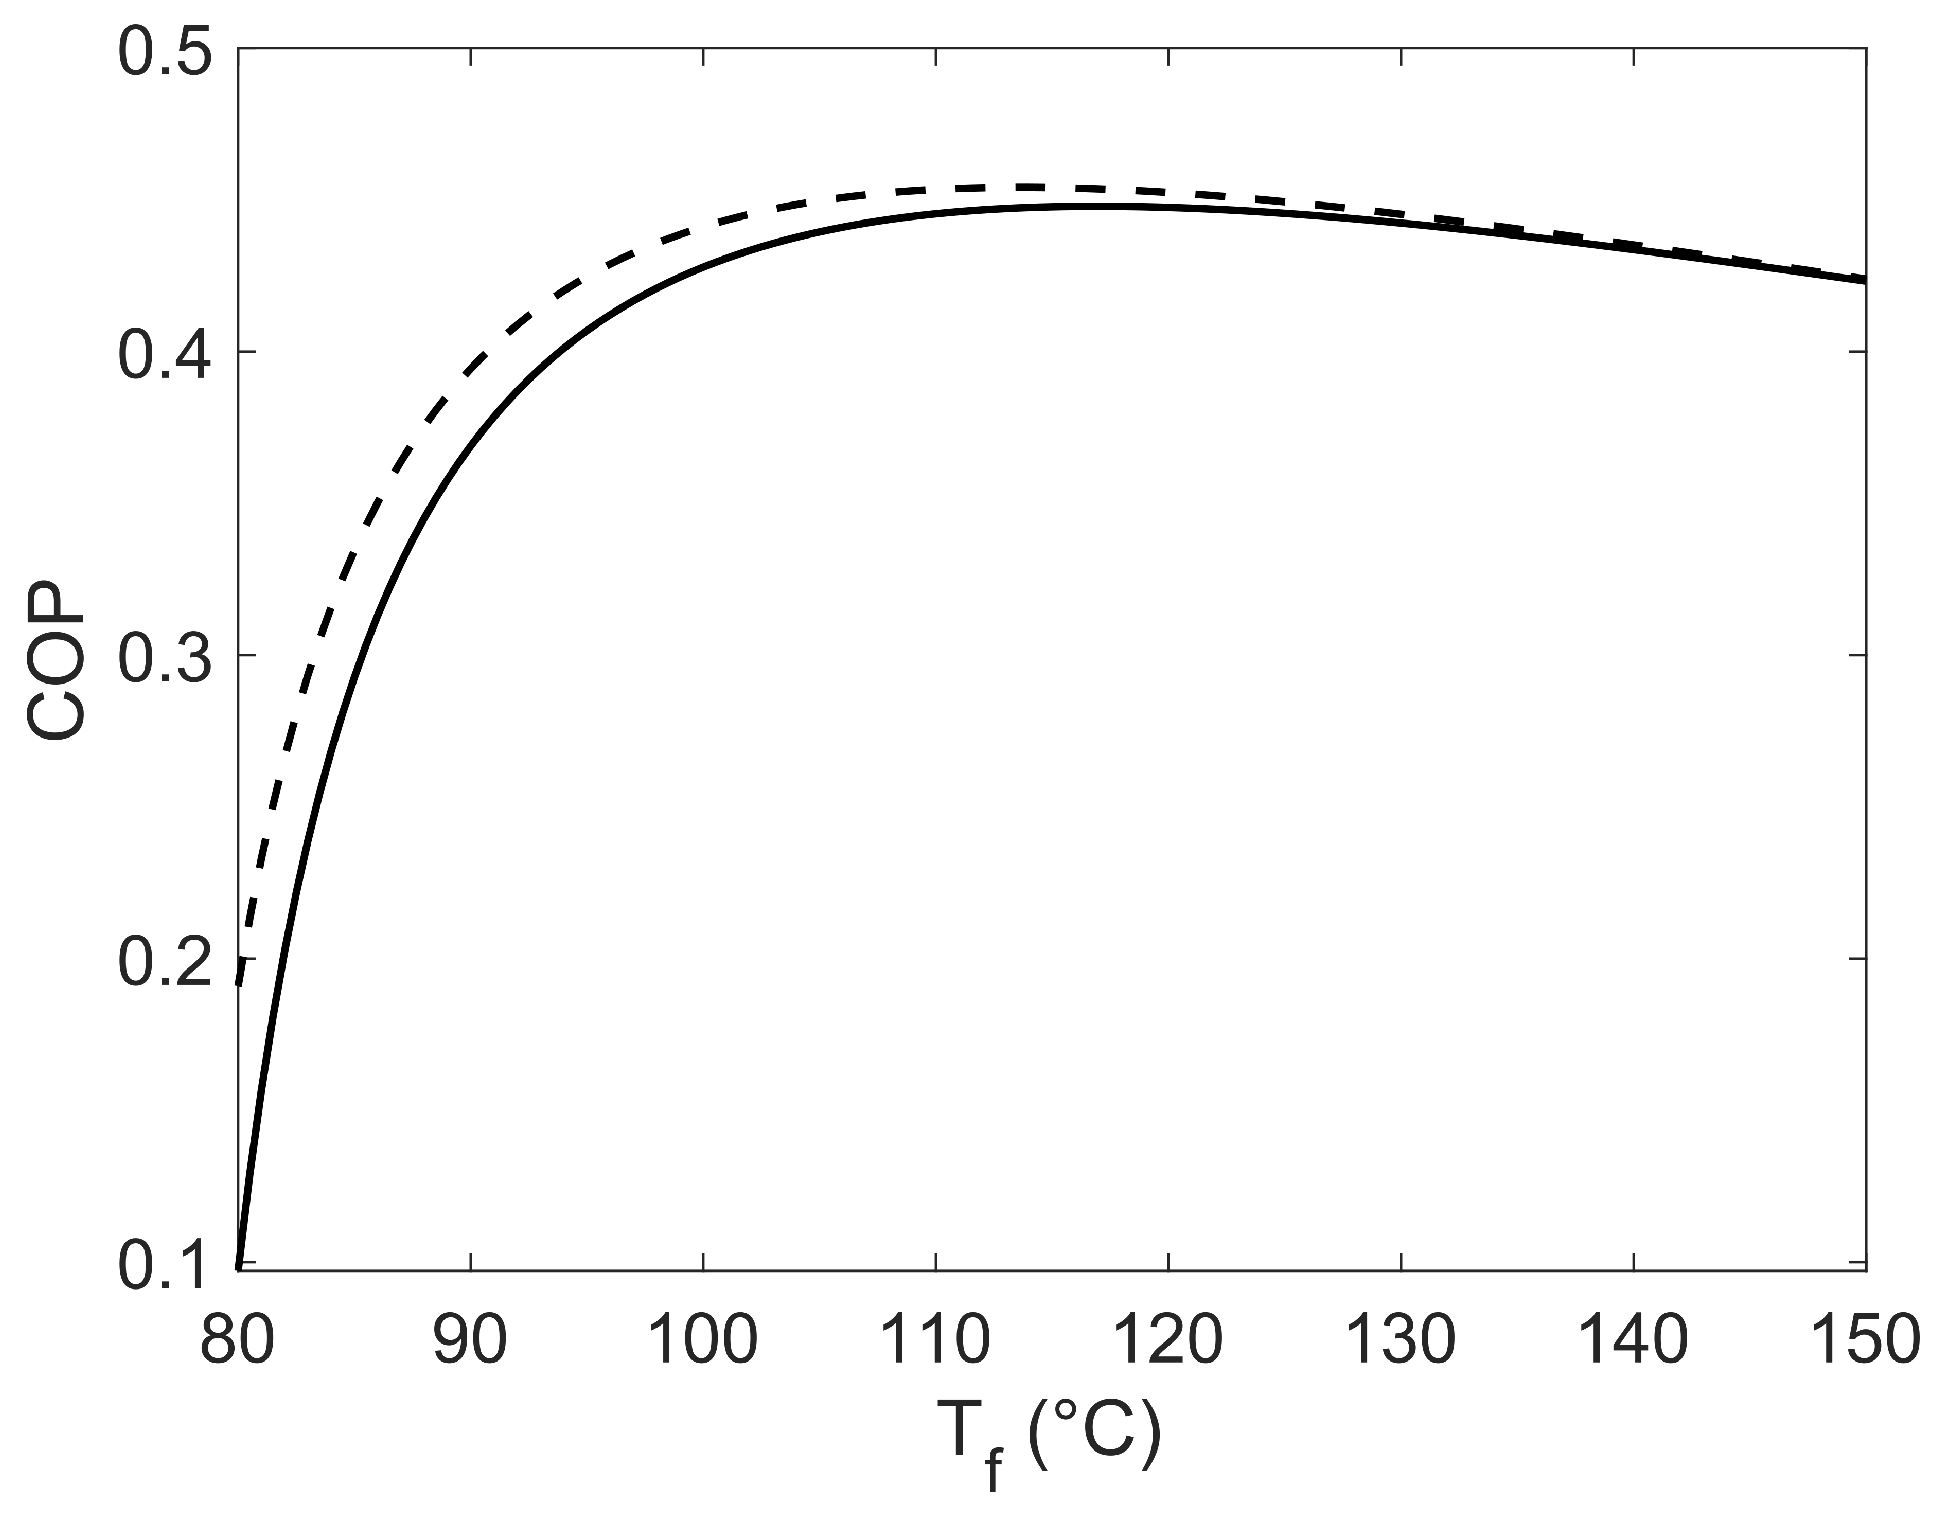
Coefficients of performance (COPs) were obtained by applying both the explicit and implicit convergent methods for a typical year in the city of Riohacha. When comparing these COPs, it was noted that for the lower temperatures, there is a 5% variation which decreases as temperature rises, as shown in Figure 4. This indicates that both methods can be used.
The initial temperature ( T i ) and the condenser temperature ( T C ) were taken from the atmospheric data and with values of 28.9   C and 38   C , respectively. In addition, the evaporator temperature ( T E ) was set at 5   C , resulting in an efficiency of the equipment of 30% and a mass ratio of the activated carbon of 20   k g / m 2 . It is observed that the maximum COP can be achieved at a temperature T f of 95   C , thereby transferring heat to the medium.
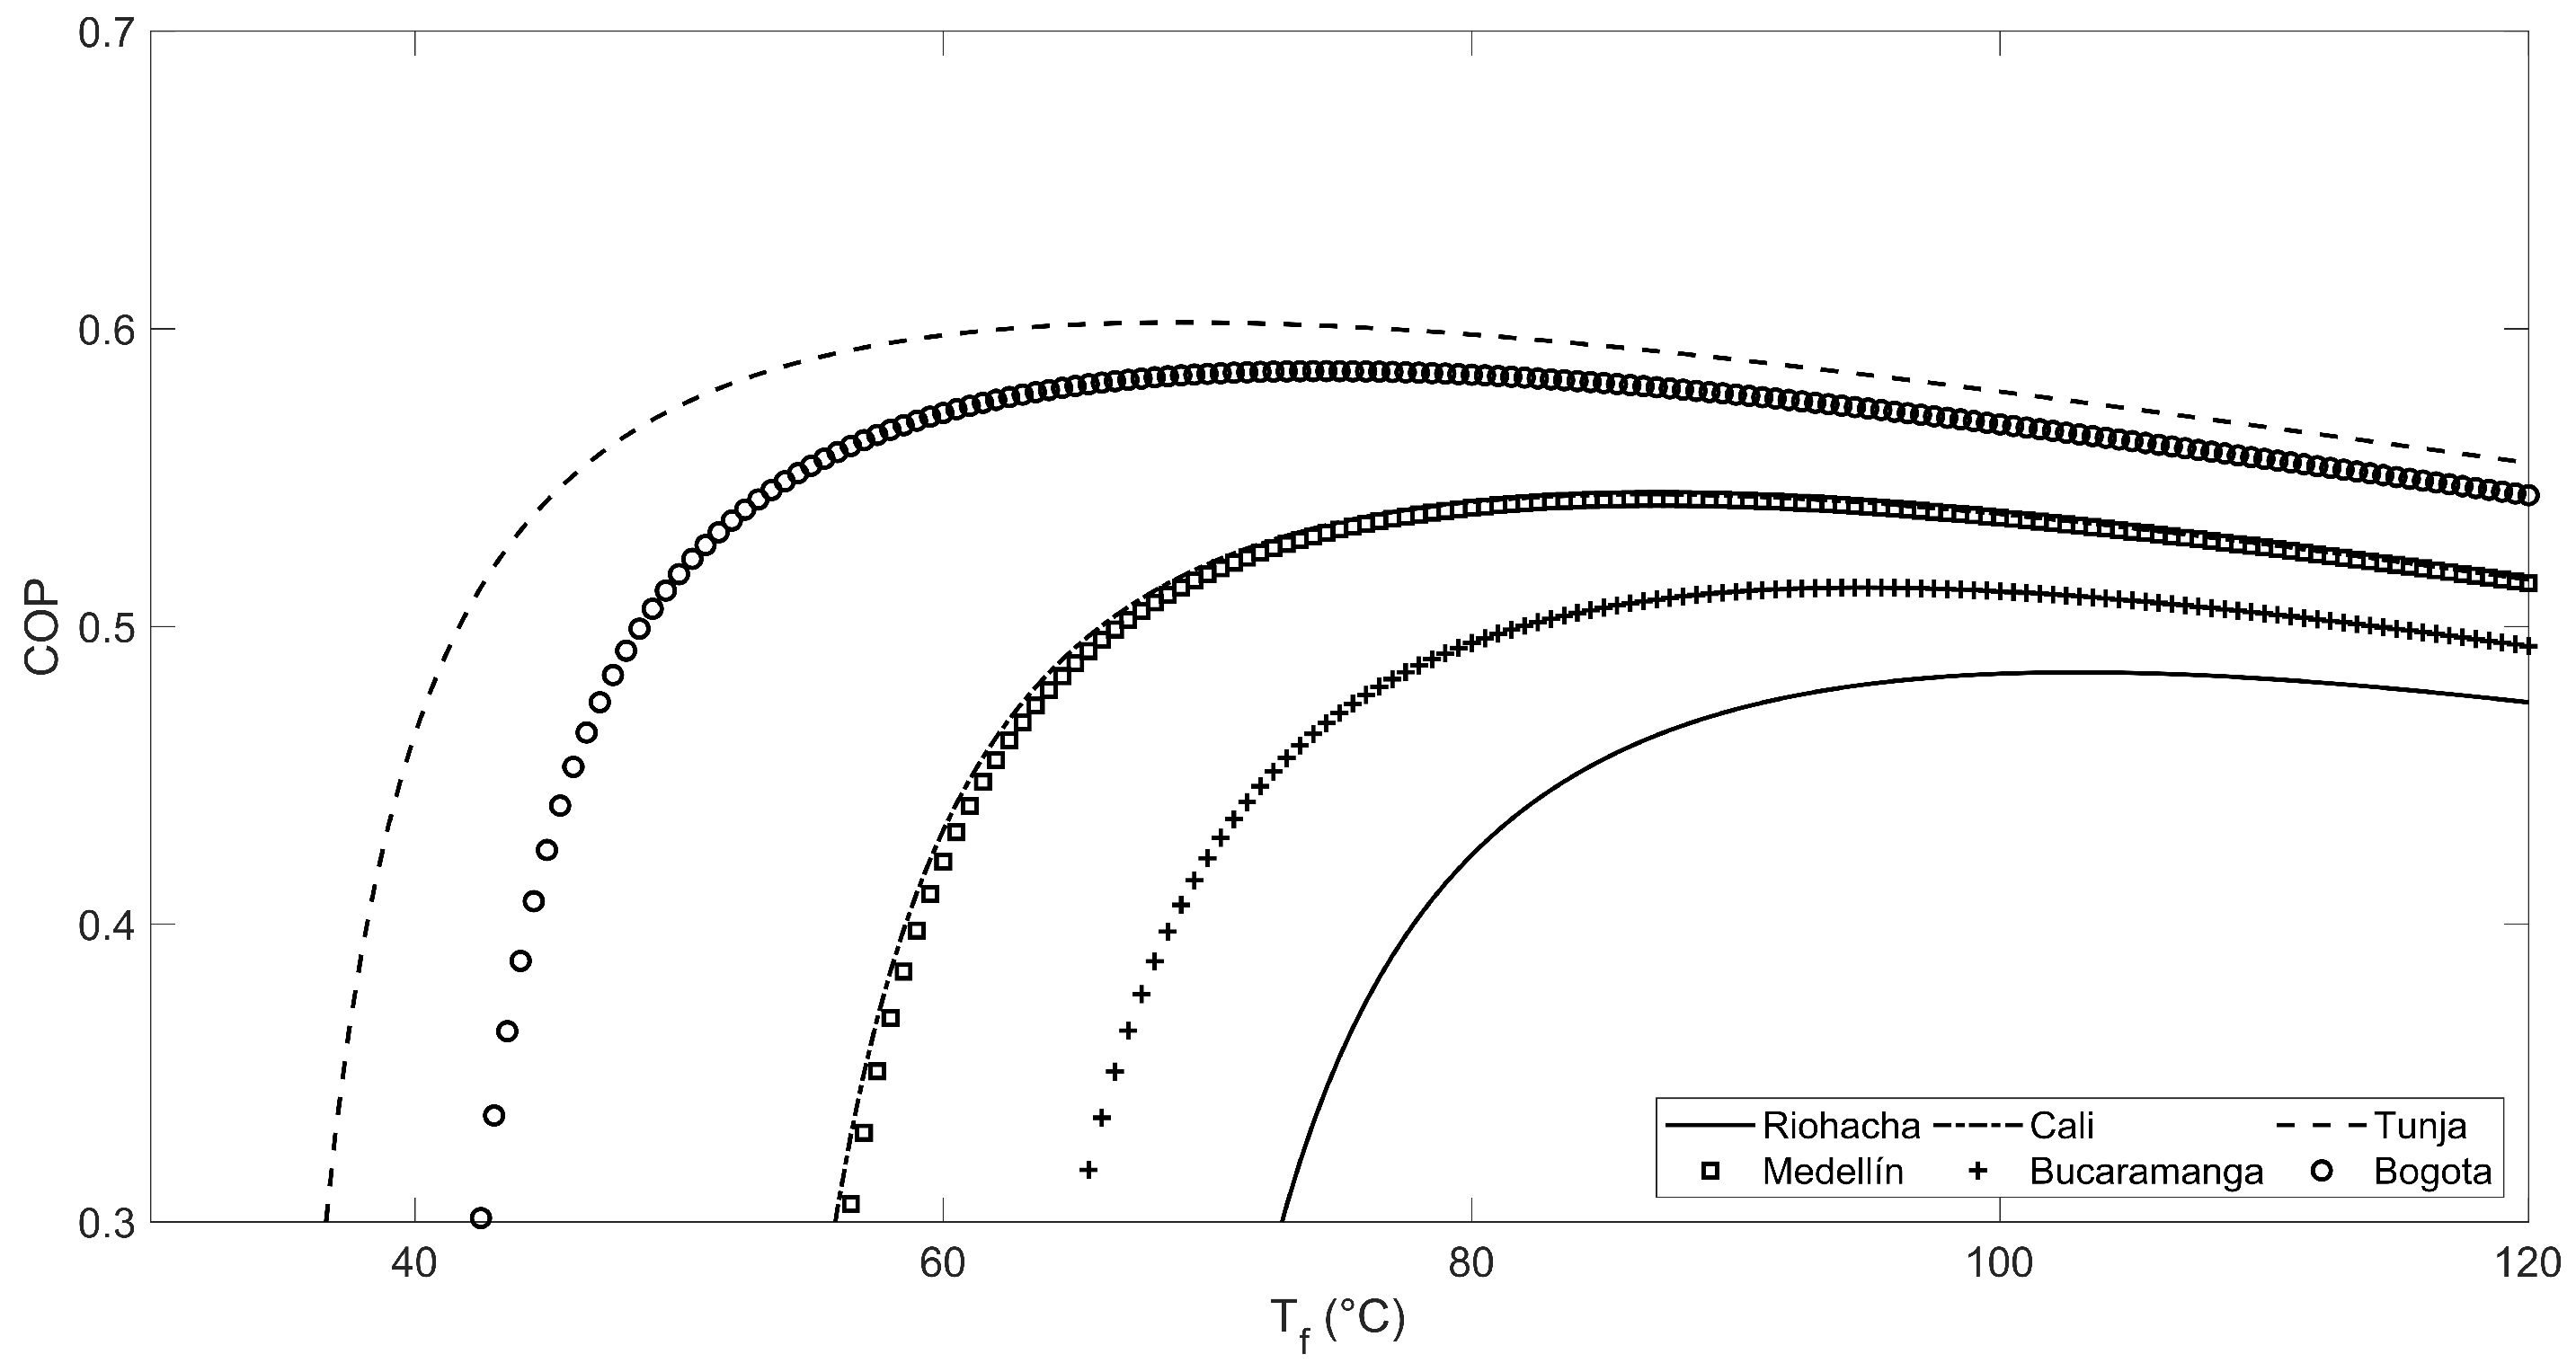
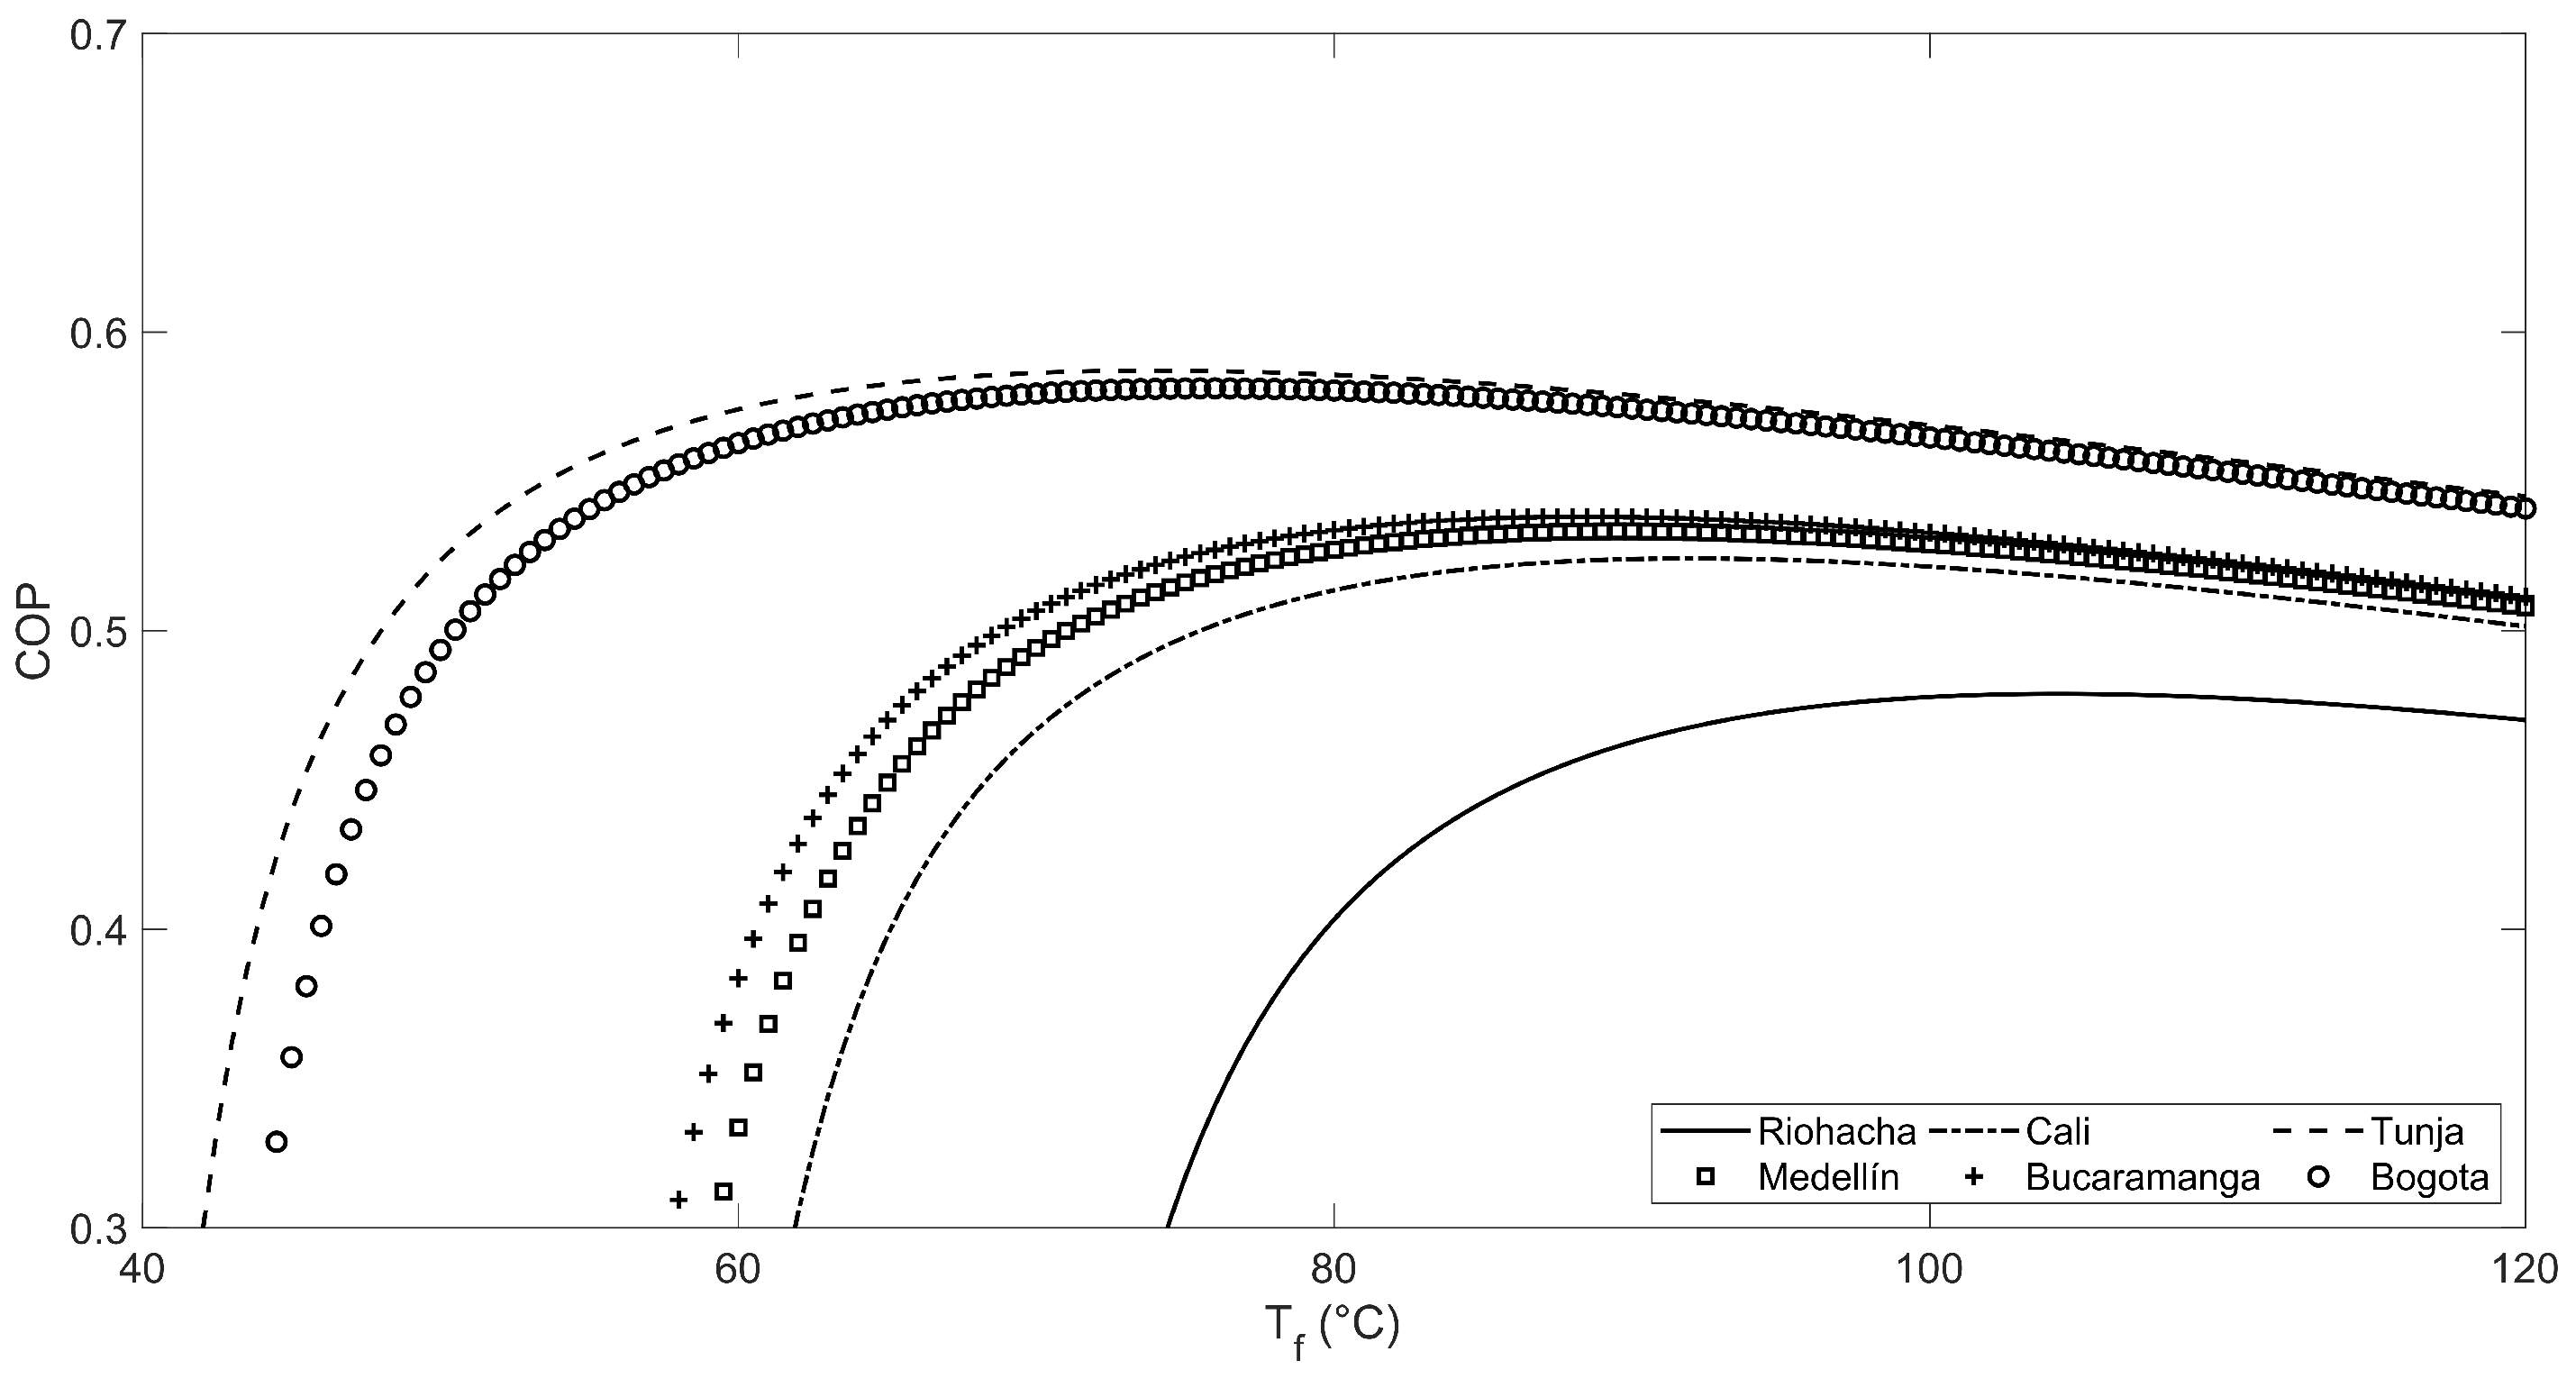
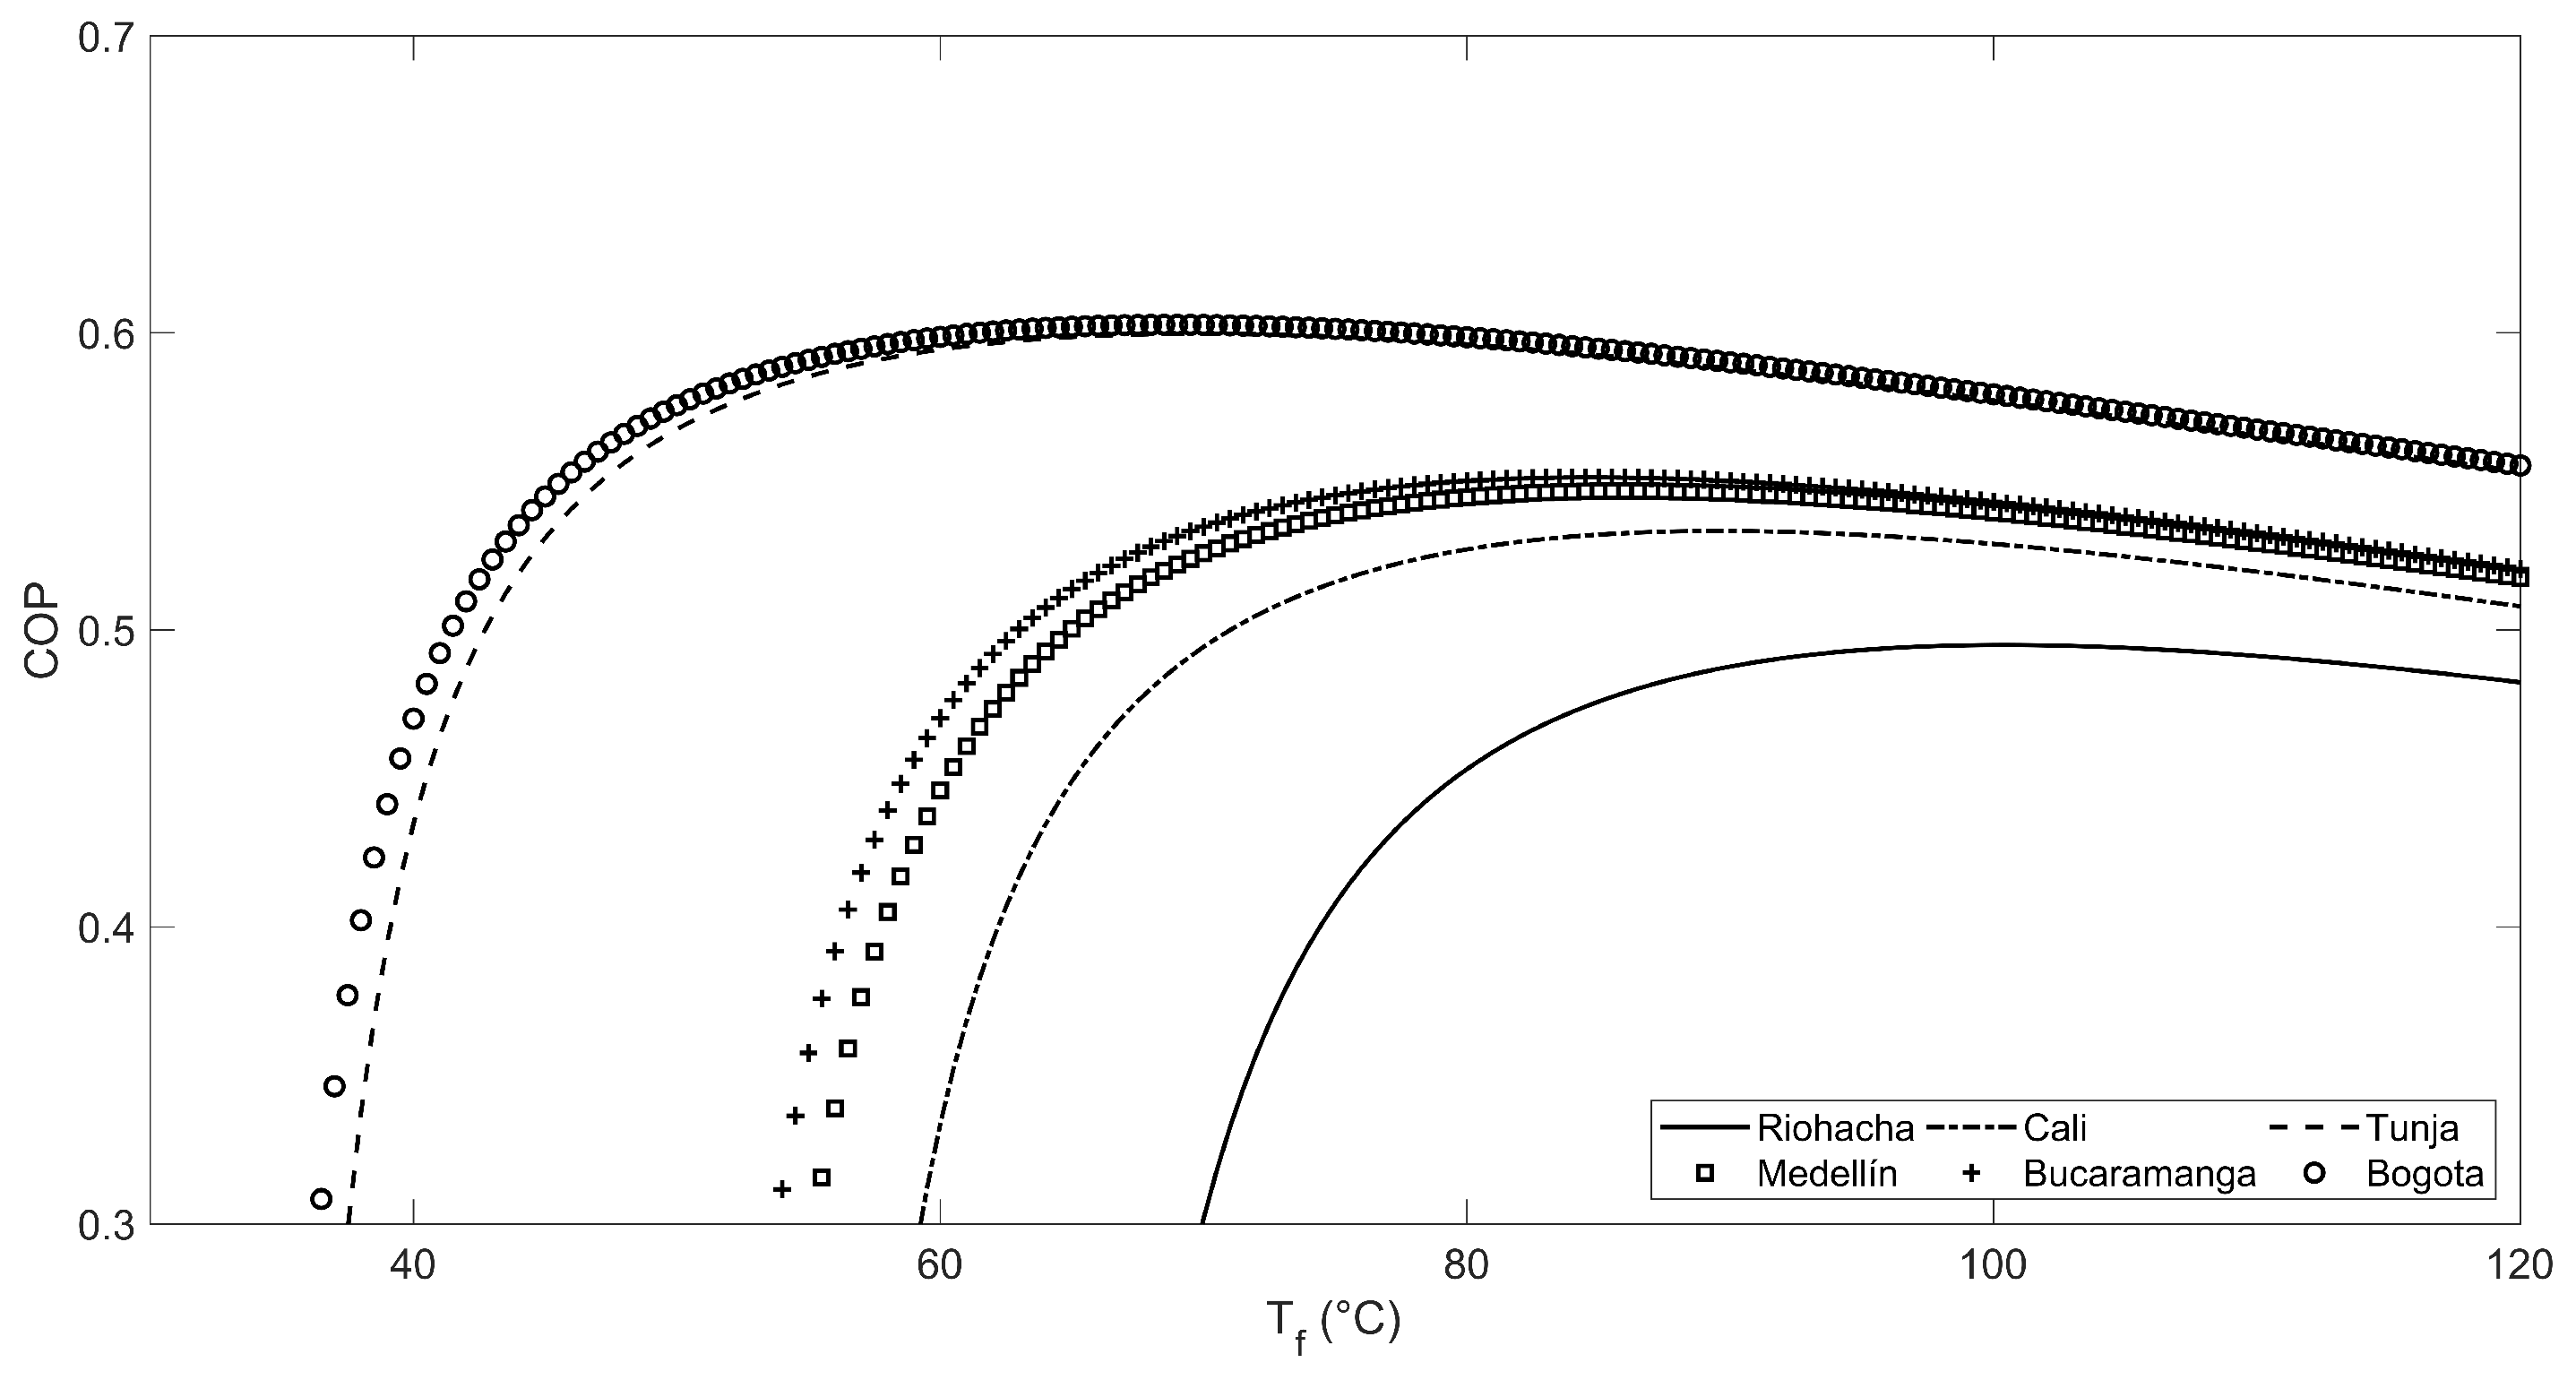
The approach to work with the set of almost 20,000 data points for the analysis consists of aggregating the variables reported for each phenomenon studied by calculating the monthly mean values. This organization is presented in Table A1, which provides an overview of the data for each city. Additionally, graphical representations can be generated for each phenomenon, considering the minimum, average, and maximum condenser temperatures ( T c ) , and accounting for the specific environmental conditions in each city. Figure 5, Figure 6 and Figure 7 present the relationship between the coefficient of performance (COP) and the final temperatures ( T f ) for the average condenser temperatures associated with each phenomenon.
In the figures, it is evidenced that the maximum COP follows a pattern based on the altitude of the cities, regardless of the phenomenon being studied. In this regard, Tunja, being the highest city, exhibits the highest maximum COP, which is followed by Bogotá, Medellín, Bucaramanga, Cali, and Riohacha. In Figure 5, during a typical year, the maximum COP for Tunja is 0.55 at a final temperature ( T f ) of 45   C with a condenser temperature ( T C ) of 14.2   C (room temperature). For the El Niño phenomenon (Figure 6), these values are 0.50, 50   C , and 6   C , respectively. Similarly, for the La Niña phenomenon (Figure 7), these values are 0.55, 47   C , and 14.6   C , respectively. A significant reduction in COP is observed when comparing these values with those obtained for the city of Riohacha, along with a considerable increase in T f at an ambient or condenser temperature of approximately 29   C .
In Figure 6 (El Niño) and Figure 7 (La Niña), it is observed that the COP does not correspond to the altitude of each city. For instance, during El Niño, the COP of Bucaramanga is higher than that of Medellin and Cali, even though Bucaramanga is at a lower altitude. Similar observations can be made for the COP during the La Niña phenomenon. These analyses were conducted using the explicit method, which presented a 5% deviation of the data initially, which was possibly due to the effects of El Niño and La Niña phenomena.
In general, the figures demonstrate that as altitude increases, the performance of an adsorption cooling system can be more effectively utilized due to lower ambient temperatures interacting with the condenser despite the decrease in radiation. However, in cities with high radiation at sea level, such as Riohacha, high tropical temperatures pose challenges for efficient heat exchange in cooling. Therefore, it is essential to consider adapting the environment to improve yields or exploring alternative approaches. However, relying solely on global monthly averages for each annual phenomenon is insufficient to define the detailed behavior of solar potential in solar adsorption cooling. Consequently, the maximum, average, and minimum temperatures of monthly atmospheric conditions are considered for the selected cities, and the COP, solar fraction, and cooling capacity are determined for each scenario.
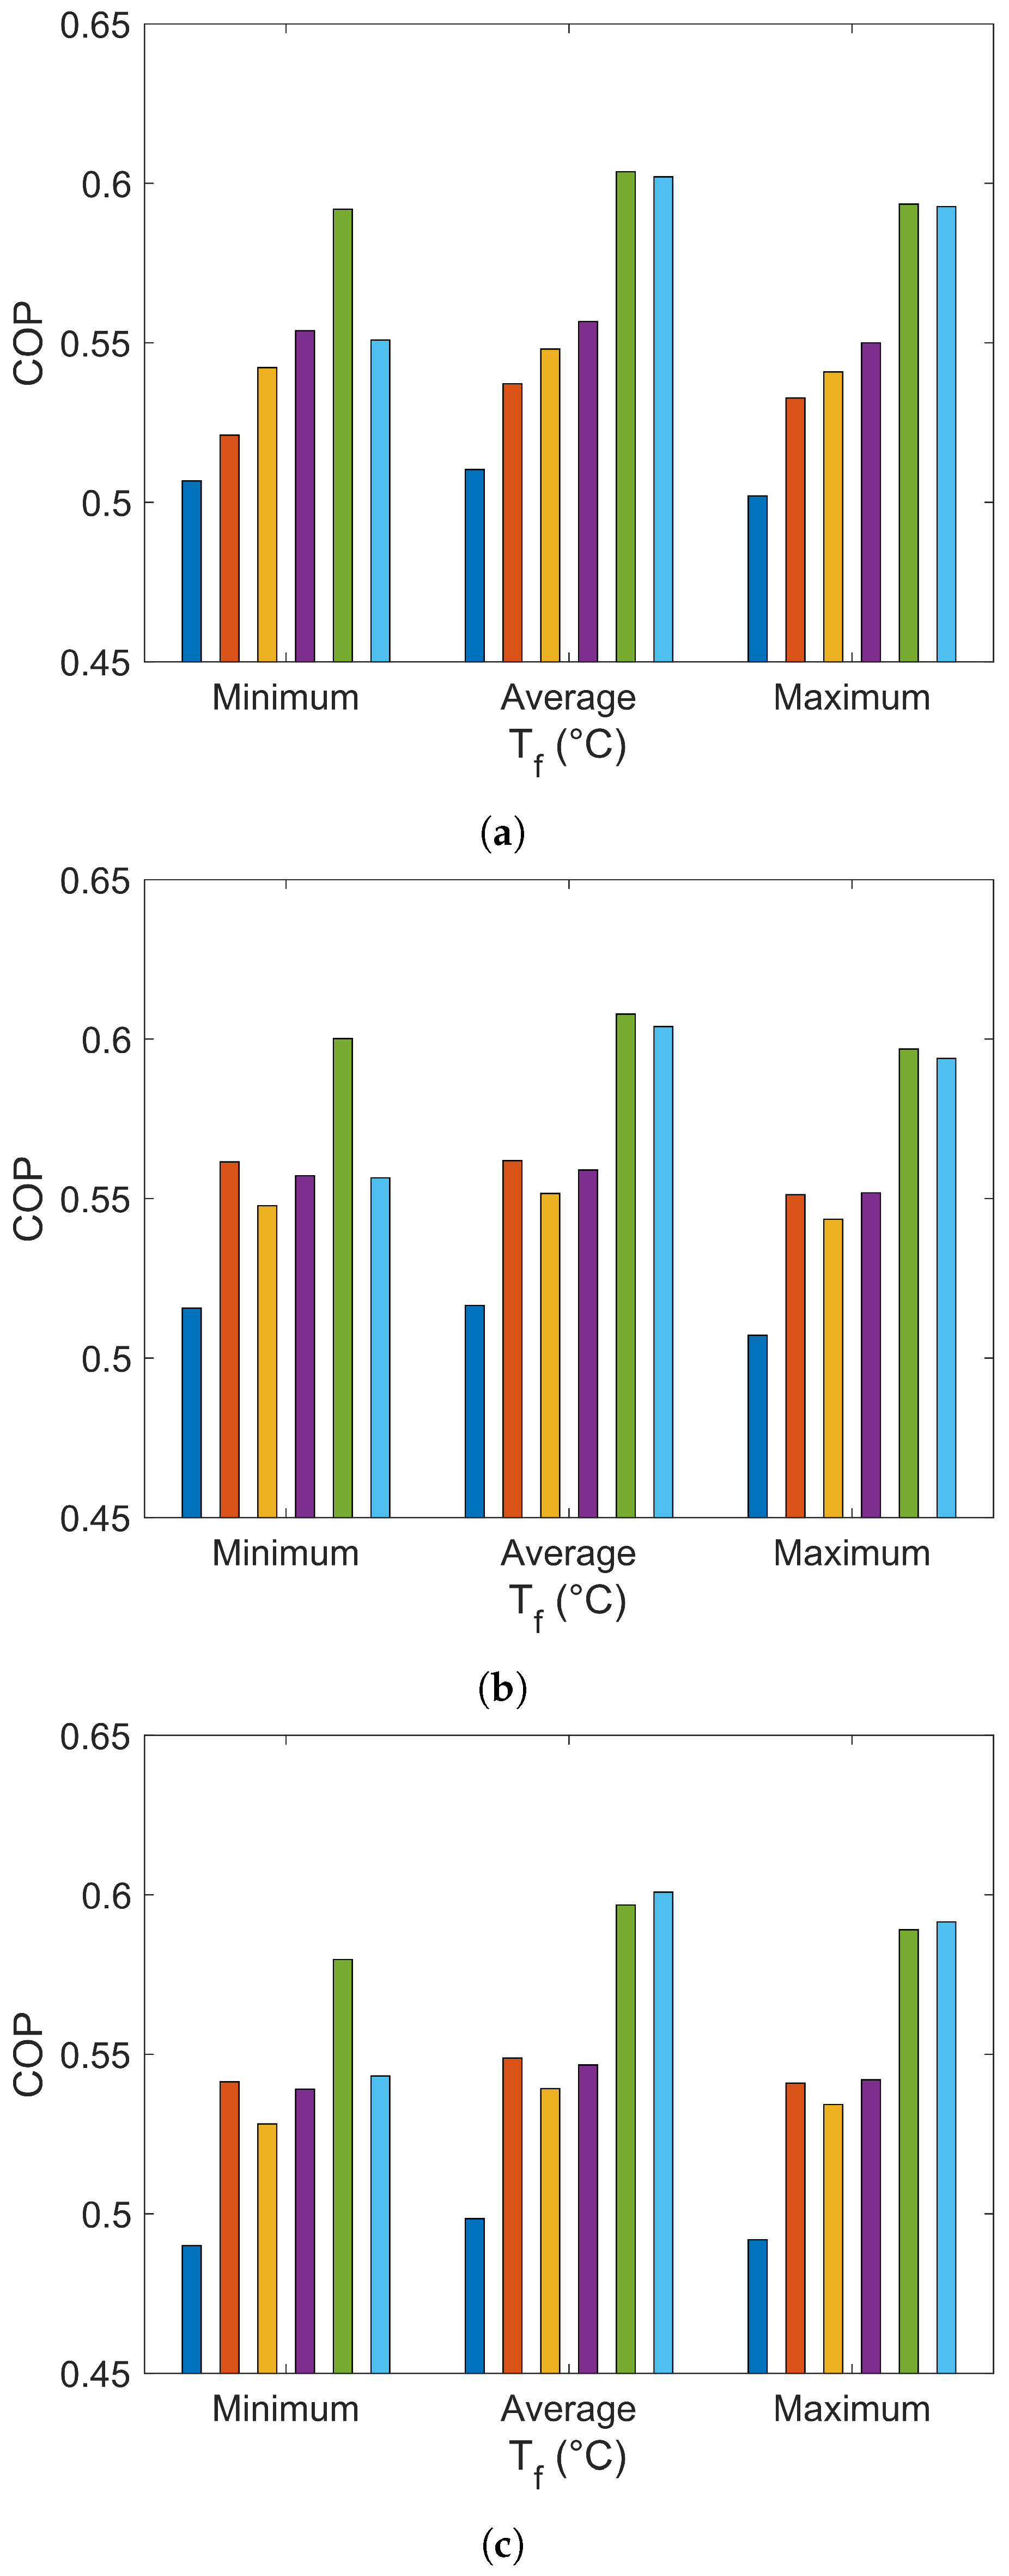
Figure 8 presents a comparison of different environmental temperatures (minimum, average, and maximum) under extreme conditions, including the month of March in a typical year, the month of November during a La Niña year, and the month of December during an El Niño year. Once again, the lower performance in Riohacha is consistently observed, despite higher radiation, due to cooling challenges resulting from the reasons mentioned above.
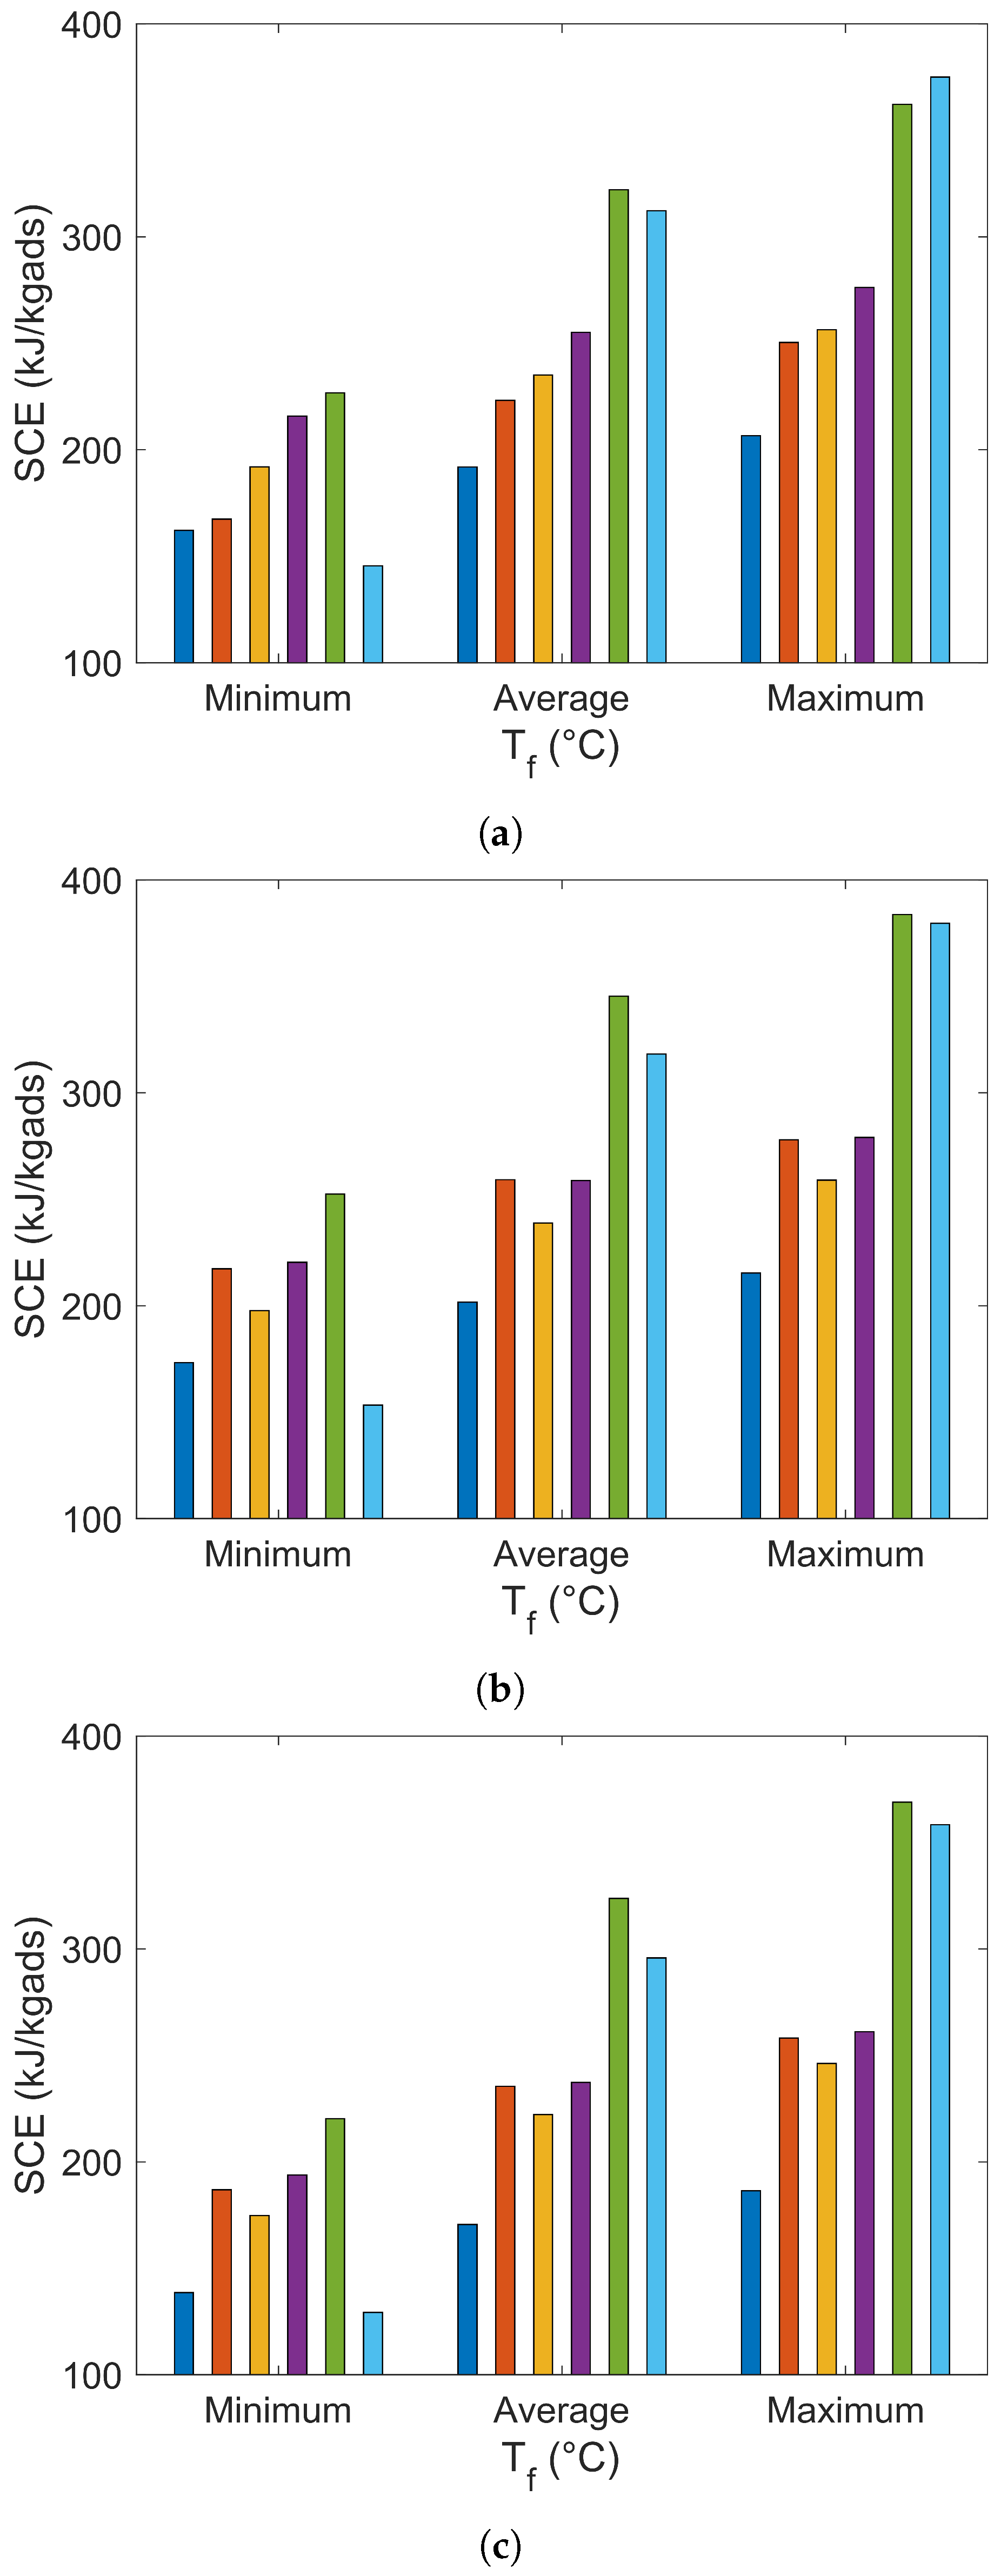
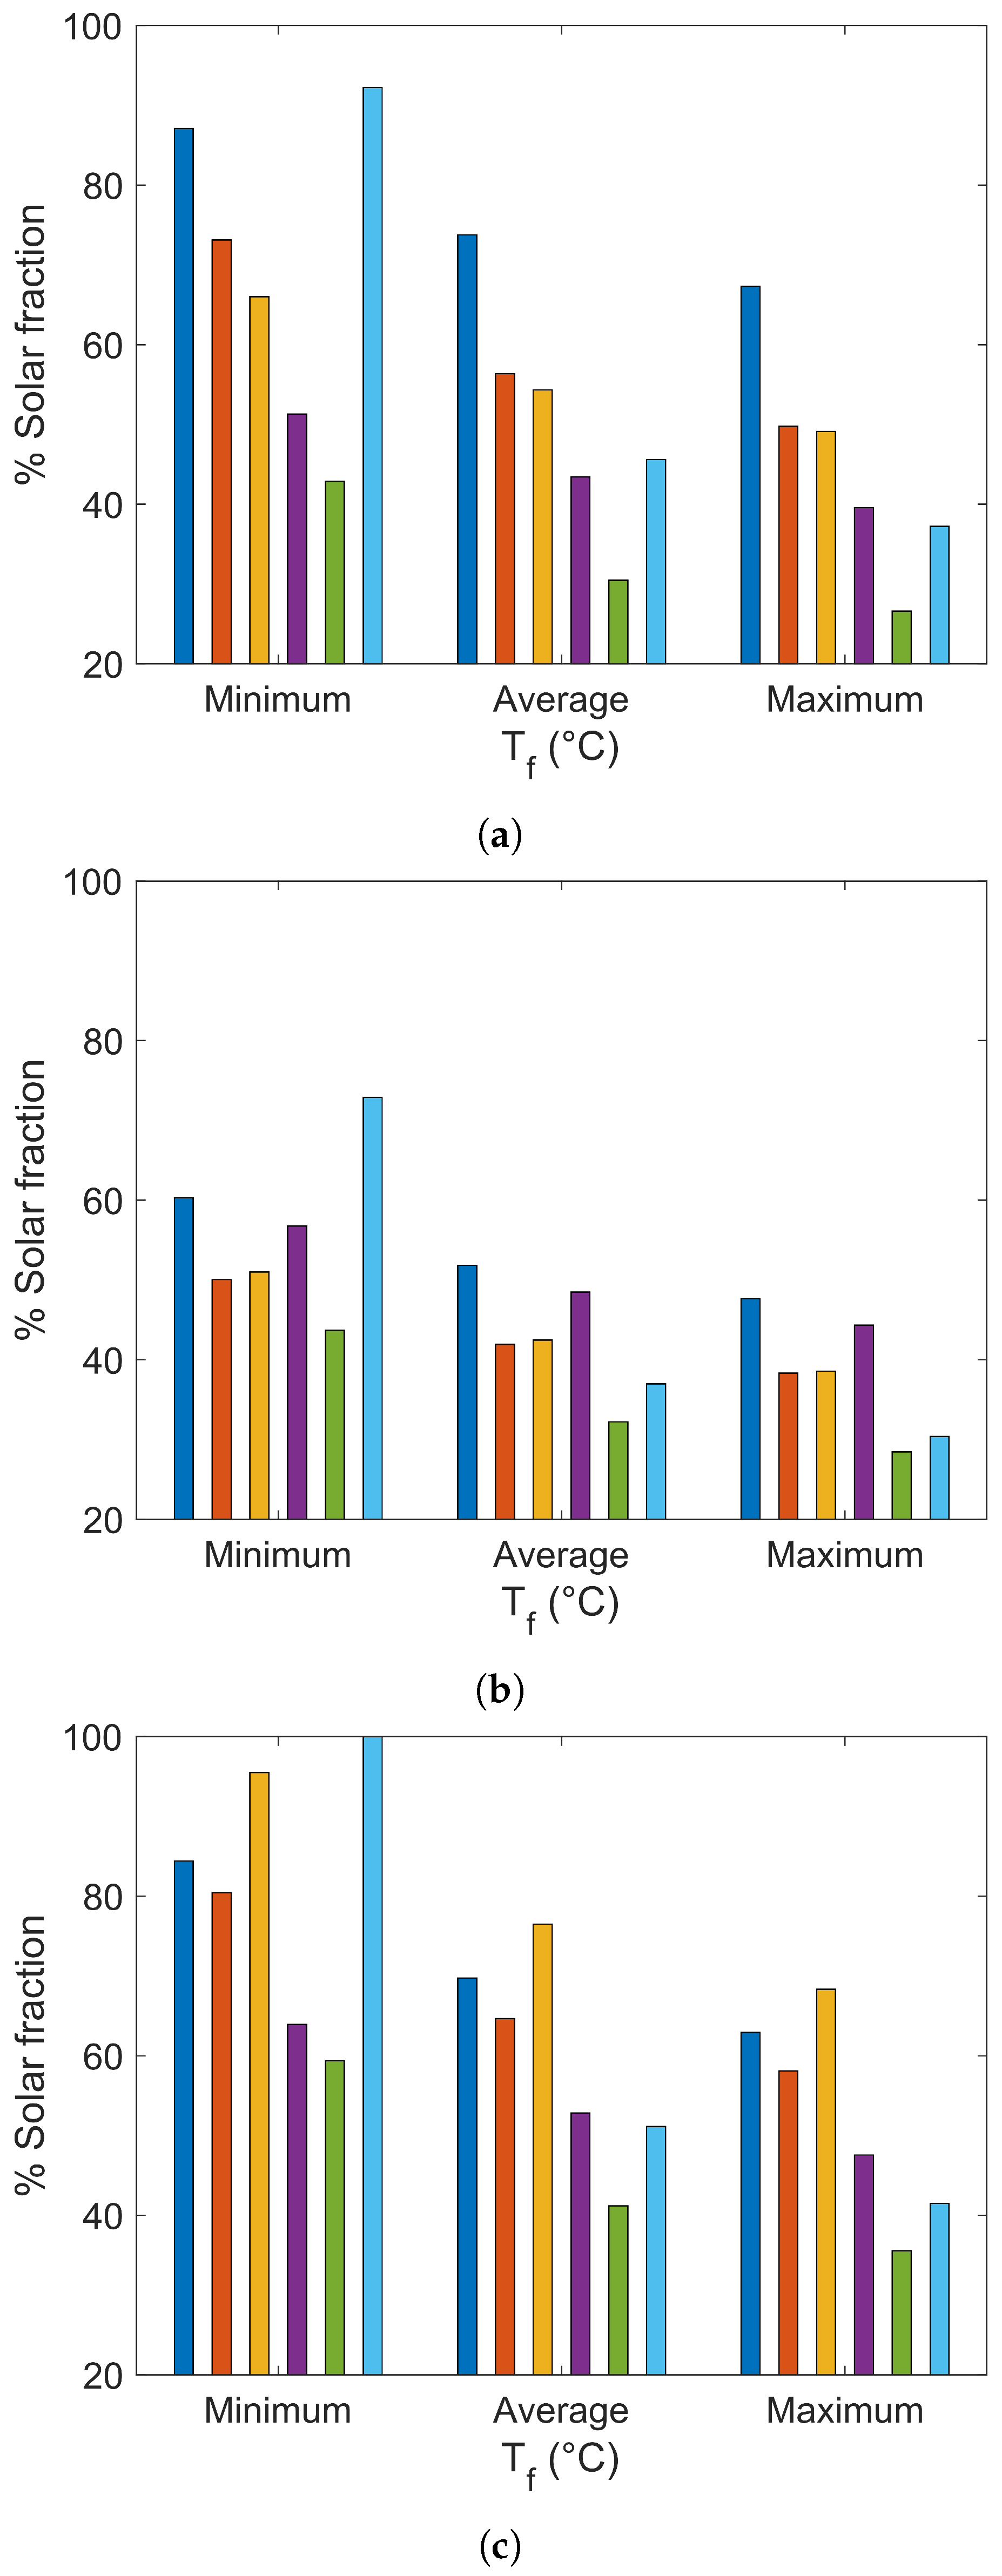
In Figure 8, Figure 9 and Figure 10, the dark blue bar represents Riohacha, the orange bar represents Bucaramanga, the yellow bar represents Cali, the purple bar represents Medellin, the green bar represents Bogota and the light blue bar represents Tunja.
On the other hand, the COP during the La Niña phenomenon is higher, particularly for average or minimum temperatures. This is due to the rainy climate during these seasons, resulting in lower environmental temperatures. However, this effect is not noticeable in the cities of Tunja and Bogotá, as they already experience low temperatures regardless of the phenomenon.
The Specific Cooling Energy (SCE) exhibits a similar behavior to COP with higher values during the La Niña phenomenon. However, within a specific phenomenon, SCE is higher for higher final temperatures ( T f ), which is contrary to the behavior of COP, as shown in Figure 9. There is a partially direct relationship between COP and SCE. Therefore, the ambient temperature, as well as the frequency of drought or rain, are not the sole determinants of SCE values. Radiation also plays a crucial role, making it an important indicator, but it is not sufficient to determine if temperatures close to 5   in the evaporator for ice production can be achieved. Hence, an additional complementary criterion called the Percentage of Solar Fraction (PFS) is needed. PFS can be defined as the relationship between the “real” radiation reported by IDEAM and NASA in each analyzed city and the theoretical radiation obtained from the model ( I real / I min ) .
Figure 10 presents the PFS for the studied phenomena at minimum, average, and maximum temperatures. It demonstrates that Riohacha has the highest PFS values, but high PFS values persist at low temperatures for all cities regardless of the presence of rainy or drought phenomena. During the El Niño phenomenon, the PFS values are high for Riohacha, Cali, and Tunja at low temperatures, indicating that solar radiation can be more effectively utilized during periods of drought in cool environments. This is why the PFS value in Riohacha is lower than in the other two cities mentioned for this particular case.
To complement the analysis and discussion, Table 2 summarizes the output data for each studied variable, including the number of days when temperatures below 0   C are reached (ice production days). The table shows that based on the conditions of the adsorption–cooling model, Riohacha can produce ice independently of the presented phenomena despite the high ambient temperatures and the relatively low COP values obtained. Similarly, Tunja can also produce ice independently of the phenomena, even though it has lower radiation values compared to Riohacha. The favorable factors in Tunja include its low ambient temperatures and periods of drought.

4. Conclusions

The mathematical model utilized for simulating the adsorption solar cooling system effectively evaluated the system’s performance in terms of the COP, the minimum solar radiation required for ice production, and the cooling capacity. Nevertheless, it is important to note that the COP alone is not the primary factor determining ice production. For example, in cities such as Riohacha, where the maximum system temperatures remain below 89.34   C , the system can produce ice for 91 days, whereas cities such as Tunja, despite having a higher COP, can produce ice for 55 days at temperatures below 44.43   C . Furthermore, the results indicate that the system is well-suited for ice production in cities located at sea level. However, in cities with altitudes higher than 900 masl, the system can be utilized as a heat pump for heating purposes. Lastly, in intermediate altitude cities such as Bucaramanga, Medellin, and Cali, the influence of El Niño and La Niña phenomena on the COP is notable.

Author Contributions

Conceptualization, G.G., M.B.-B. and A.J.C.; methodology, D.S.-F., G.G., M.B.-B. and A.J.C.; software, A.J.C., G.G. and D.S.-F.; validation, E.C., A.C., G.G. and D.S.-F.; formal analysis, M.B.-B., G.G., E.C. and D.S.-F.; investigation, G.G., M.B.-B., A.J.C. and D.S.-F.; resources, D.S.-F., E.C. and A.C.; data curation, D.S.-F. and E.C.; writing—original draft preparation, D.S.-F. and M.B.-B.; writing—review and editing, A.C., M.B.-B., G.G., D.S.-F. and E.C.; visualization, D.S.-F., G.G. and M.B.-B.; supervision, A.J.C., D.S.-F., A.C. and G.G.; project administration, D.S.-F. and M.B.-B. All authors have read and agreed to the published version of the manuscript.

Funding

This research received no external funding.

Institutional Review Board Statement

Not applicable.

Informed Consent Statement

Not applicable.

Data Availability Statement

Not applicable.

Acknowledgments

The authors gratefully acknowledge the financial support provided by the Colombia Scientific Program within the framework of the call Ecosistema Científico (Contract No. FP44842-218-2018). The authors also acknowledge Universidad de Antioquia-UdeA for the valuable economic contribution toward the development of this research through the “Sostenibilidad” program, as well as the support from Universidad de La Guajira in the development of this work.

Conflicts of Interest

The authors declare no conflict of interest.

Appendix A

Table A1. Summary of the average data taken from IDEAM for each phenomenon studied.
Month/CityPhenomenonRiohacha
(3 masl)
Bucaramanga
(959 masl)
Cali
(1018 masl)
Medellin
(1495 masl)
Bogotá
(2625 masl)
Tunja
(2782 masl)
T ave
C
T ave
kWh/m2/Day
T ave
C
T ave
kWh/m2/Day
T ave
C
T ave
kWh/m2/Day
T ave
C
T ave
kWh/m2/Day
T ave
C
T ave
kWh/m2/Day
T ave
C
T ave
kWh/m2/Day
JanuaryNiño26.95.021.83.524.44.522.54.913.15.913.55.1
Niña27.45.023.45.424.65.324.04.617.95.417.55.5
Typical26.94.526.64.823.74.422.44.314.54.114.04.7
FebruaryNiño26.85.421.95.024.24.022.84.813.73.514.14.4
Niña28.55.024.05.326.85.124.74.518.44.417.75.1
Typical27.65.526.95.524.54.923.65.114.64.913.75.6
MarchNiño26.85.521.55.223.84.222.34.913.63.814.44.0
Niña29.05.624.05.422.24.824.94.418.84.118.55.3
Typical27.75.126.64.324.14.322.13.714.73.015.44.4
AprilNiño28.05.621.85.224.04.021.94.414.53.415.63.8
Niña29.15.323.04.322.04.523.83.917.33.317.34.0
Typical29.85.526.55.024.74.822.94.015.53.814.44.8
MayNiño28.55.222.14.824.64.222.74.418.23.715.63.5
Niña30.65.422.95.625.34.423.85.216.63.917.74.6
Typical30.05.826.44.124.24.222.84.215.83.614.74.3
JuneNiño29.45.522.33.024.24.122.74.914.04.014.93.9
Niña32.06.423.25.225.54.423.95.318.84.016.34.1
Typical30.16.124.34.224.24.423.04.418.43.614.63.9
JulyNiño29.15.621.63.223.84.122.24.613.73.914.94.0
Niña31.46.023.25.625.64.324.05.019.14.215.84.3
Typical30.36.125.64.224.95.023.74.818.24.114.13.4
AugustNiño28.45.422.13.124.54.422.95.013.23.613.84.5
Niña29.56.423.45.526.24.623.94.916.64.215.94.1
Typical29.76.127.44.424.55.223.54.818.74.213.84.4
SeptemberNiño27.65.121.63.124.04.121.84.613.73.914.44.1
Niña30.06.023.55.526.74.624.35.016.54.115.54.4
Typical29.45.527.04.717.95.323.04.219.14.213.54.6
OctoberNiño28.15.021.73.823.94.222.44.714.04.014.84.3
Niña29.14.823.45.125.64.323.34.016.84.116.04.4
Typical28.95.026.34.724.04.222.43.917.33.814.04.5
NovemberNiño26.83.821.23.623.23.421.64.214.13.415.13.6
Niña28.54.322.54.624.84.723.03.916.53.815.84.1
Typical28.24.427.04.617.44.422.43.917.33.514.54.6
DecemberNiño26.74.121.03.023.43.621.94.213.44.114.44.2
Niña28.84.423.95.125.85.824.04.216.74.115.44.7
Typical28.04.726.85.117.64.322.44.316.93.913.65.1

References

  1. Ho, C.; Lee, H.W.; Gambatese, J.A. Application of Prevention through Design (PtD) to improve the safety of solar installations on small buildings. Saf. Sci. 2020, 125, 104633. [Google Scholar] [CrossRef]
  2. Rathore, P.K.S.; Chauhan, D.S.; Singh, R.P. Decentralized solar rooftop photovoltaic in India: On the path of sustainable energy security. Renew. Energy 2019, 131, 297–307. [Google Scholar] [CrossRef]
  3. Yang, J.; Yang, Z.; Duan, Y. Off-design performance of a supercritical CO2 Brayton cycle integrated with a solar power tower system. Energy 2020, 201, 117676. [Google Scholar] [CrossRef]
  4. Mohammadi, K.; Goudarzi, N. Study of inter-correlations of solar radiation, wind speed and precipitation under the influence of El Niño Southern Oscillation (ENSO) in California. Renew. Energy 2018, 120, 190–200. [Google Scholar] [CrossRef]
  5. Suhadah, N.; Fadzil, M.; Heng, P.; Rabitah, N.; Khalil, I.; Hidayah, N. Spatial and temporal variability of sea surface temperature during El-Niño Southern Oscillation and Indian Ocean Dipole in the Strait of Malacca and Andaman Sea. Reg. Stud. Mar. Sci. 2020, 39, 101402. [Google Scholar] [CrossRef]
  6. Laguarda, A.; Alonso-Suárez, R.; Terra, R. Solar irradiation regionalization in Uruguay: Understanding the interannual variability and its relation to El Niño climatic phenomena. Renew. Energy 2020, 158, 444–452. [Google Scholar] [CrossRef]
  7. Montealegre Bocanegra, J.E.; Pabon Caicedo, J.D. La variabilidad climatica interanual asociada al ciclo el Niño-La Niña–Oscilacion del sur y su efecto en el patron pluviometrico de Colombia. Meteorol. Colomb. 2000, 2, 7–21. [Google Scholar]
  8. Leggett, L.M.W.; Ball, D.A. The implication for climate change and peak fossil fuel of the continuation of the current trend in wind and solar energy production. Energy Policy 2012, 41, 610–617. [Google Scholar] [CrossRef]
  9. Oka, K.; Mizutani, W.; Ashina, S. Climate change impacts on potential solar energy production: A study case in Fukushima, Japan. Renew. Energy 2020, 153, 249–260. [Google Scholar] [CrossRef]
  10. Ospino Castro, A.J. Análisis del potencial energético solar en la Región Caribe para el diseño de un sistema fotovoltaico. Inge-Cuc 2010, 6, 85–94. [Google Scholar]
  11. Vanegas Chamorro, M.; Villicaña Ortíz, E.; Arrieta Viana, L. Cuantificación y caracterización de la radiación solar en el departamento de La Guajira-Colombia mediante el calculo de transmisibilidad atmosférica. Prospectiva 2015, 13, 54–63. [Google Scholar] [CrossRef]
  12. National Aeronautics and Space Administration-NASA. POWER Data Access Viewer. Available online: https://power.larc.nasa.gov/data-access-viewer/ (accessed on 24 November 2022).
  13. Instituto de Hidrología Meteorología y Estudios Ambientales—IDEAM. Datos Hidrológicos y Meteorológicos—DHIME. Available online: http://dhime.ideam.gov.co/webgis/home/ (accessed on 24 November 2022).
  14. Fernandes, M.; Brites, G.; Costa, J.; Gaspar, A.; Costa, V. Review and future trends of solar adsorption refrigeration systems. Renew. Sustain. Energy Rev. 2014, 39, 102–123. [Google Scholar] [CrossRef]
  15. Wang, L.W.; Wang, R.Z.; Oliveira, R.G. A review on adsorption working pairs for refrigeration. Renew. Sustain. Energy Rev. 2009, 13, 518–534. [Google Scholar] [CrossRef]
  16. Sarbu, I.; Sebarchievici, C. Review of solar refrigeration and cooling systems. Energy Build. 2013, 67, 286–297. [Google Scholar] [CrossRef]
  17. Wang, D.C.; Li, Y.H.; Li, D.; Xia, Y.Z.; Zhang, J.P. A review on adsorption refrigeration technology and adsorption deterioration in physical adsorption systems. Renew. Sustain. Energy Rev. 2010, 14, 344–353. [Google Scholar] [CrossRef]
  18. El-Sharkawy, I.I.; Hassan, M.; Saha, B.B.; Koyama, S.; Nasr, M.M. Study on adsorption of methanol onto carbon based adsorbents. Int. J. Refrig. 2009, 32, 1579–1586. [Google Scholar] [CrossRef]
  19. Ghafoor, A.; Munir, A. Worldwide overview of solar thermal cooling technologies. Renew. Sustain. Energy Rev. 2015, 43, 763–774. [Google Scholar] [CrossRef]
  20. Fong, K.F.; Chow, T.T.; Lee, C.K.; Lin, Z.; Chan, L.S. Comparative study of different solar cooling systems for buildings in subtropical city. Sol. Energy 2010, 84, 227–244. [Google Scholar] [CrossRef]
  21. Zhao, C.; Wang, Y.; Li, M.; Zhao, W.; Li, X.; Yu, Q.; Huang, M. Impact of three different enhancing mass transfer operating characteristics on a solar adsorption refrigeration system with compound parabolic concentrator. Renew. Energy 2020, 152, 1354–1366. [Google Scholar] [CrossRef]
  22. Zhao, C.; Wang, Y.; Li, M.; Zhao, W.; Li, X.; Du, W.; Yu, Q. Experimental study of a solar adsorption refrigeration system integrated with a compound parabolic concentrator based on an enhanced mass transfer cycle in Kunming, China. Sol. Energy 2020, 195, 37–46. [Google Scholar] [CrossRef]
  23. Wang, R.Z.; Oliveira, R.G. Adsorption refrigeration-An efficient way to make good use of waste heat and solar energy. Prog. Energy Combust. Sci. 2006, 32, 424–458. [Google Scholar] [CrossRef]
  24. Allouhi, A.; Kousksou, T.; Jamil, A.; Bruel, P.; Mourad, Y.; Zeraouli, Y. Solar driven cooling systems: An updated review. Renew. Sustain. Energy Rev. 2015, 44, 159–181. [Google Scholar] [CrossRef]
  25. Camargo, A.J.; Quintero, J.G.; Avila, L.A.; Gutierrez, G.A. Potencial Termodinámico de un Refrigerador Intermitente por Adsorción bajo las Condiciones Climáticas de Riohacha, en Colombia. Inf. Tecnol. 2019, 30, 139–146. [Google Scholar] [CrossRef]
  26. Li, Z.F.; Sumathy, K. A solar-powered ice-maker with the solid adsorption pair of activated carbon and methanol. Int. J. Energy Res. 1999, 23, 517–527. [Google Scholar] [CrossRef]
  27. Hassan, H.; Mohamad, A.; Alyousef, Y.; Al-ansary, H. A review on the equations of state for the working pairs used in adsorption cooling systems. Renew. Sustain. Energy Rev. 2015, 45, 600–609. [Google Scholar] [CrossRef]
  28. National Weather Service—NOAA. Climate Prediction Center. Available online: https://origin.cpc.ncep.noaa.gov/products/analysis_monitoring/ensostuff/ONI_v5.php (accessed on 2 February 2023).
Figure 2. Altitudes of reference cities.
Processes 11 02499 g002
Figure 3. Flowchart for evaluating solar potential model.
Processes 11 02499 g003
Figure 4. Comparison between the implicit (solid line) and explicit (dashed line) method for the coefficient of performance (COP) and final temperature ( T f ) for the city of Riohacha for the typical year.
Processes 11 02499 g004
Figure 5. Coefficient of performance (COP) vs. final temperature ( T f ) for each city studied for a typical year.
Processes 11 02499 g005
Figure 6. Coefficient of performance (COP) vs. the final temperature ( T f ) for each city studied for the El Niño phenomenon.
Processes 11 02499 g006
Figure 7. Coefficient of performance (COP) vs. the final temperature ( T f ) for each city studied for the La Niña phenomenon.
Processes 11 02499 g007
Figure 8. Coefficient of performance (COP) for the different cities studied versus the different final temperatures for (a) the extreme year of March of the typical year, (b) for the extreme year of November of the La Niña phenomenon and (c) for the extreme year of December of the El Niño phenomenon.
Processes 11 02499 g008
Figure 9. Cooling capacity (SCE) for the different cities studied vs. the different final temperatures for (a) the extreme year of March of the typical year, (b) for the extreme year of November of the La Niña phenomenon and (c) for the extreme year of December of the El Niño phenomenon.
Processes 11 02499 g009
Figure 10. Percentage of solar fraction for the different cities studied vs. the different final temperatures for (a) the extreme year of March of the typical year, (b) for the extreme year of November of the La Niña phenomenon and (c) for the extreme year of month December of the El Niño phenomenon.
Processes 11 02499 g010
Table 1. Years chosen by the ONI index to collect data on solar radiation in Niño, Niña phenomena, and year without Niño/Niña influence [28].
AñoDJFJFMFMAMAMAMJMJJJJAJASASOSONONDNDJ
2010 −0.6−1.0−1.4−1.6−1.7−1.7−1.6
2011−1.4−1.1−0.8−0.6−0.5
2015 1.01.21.51.82.12.42.52.6
20162.52.21.71.0
2017−0.3−0.10.10.30.40.40.2−0.1−0.4−0.7−0.9−1.0
Table 2. Summary of the output data for each variable studied.
CityFinal Temperatures
T f ( C)
La Niña PhenomenonEl Niño PhenomenonTypical Year
COPSCE (kJ/kgads)Solar f.Ice DaysCOPSCE (kJ/kgads)Solar f.Ice DaysCOPSCE (kJ/kgads)Solar f.Ice Days
Riohacha
(3 masl)
T m i n = 89.340.51167.090.86910.49140.341.031740.49147.521.00165
T a v e = 102.110.51197.130.73190.50173.530.84970.50179.590.8285
T m a x = 114.880.50211.870.6700.46201.500.6700.46206.280.650
Bucaramanga
(959 masl)
T m i n = 75.320.56211.960.5500.54182.440.83650.52173.110.7735
T a v e = 89.060.56254.920.4600.55231.850.6700.54228.330.590
T m a x = 102.790.55274.250.4200.54256.110.5900.53255.220.530
Cali
(1018 masl)
T m i n = 76.730.53180.880.6530.53172.770.79550.55215.940.6610
T a v e = 89.440.54226.090.5310.54220.570.6320.56256.090.550
T m a x = 102.160.54249.640.4700.53245.910.5600.55275.600.500
Medellín
(1495 masl)
T m i n = 76.520.55211.700.6640.54191.700.7090.55207.420.620
T a v e = 88.440.56251.570.5500.55235.190.5810.55248.470.520
T m a x = 100.370.55272.870.5000.54258.960.5200.55270.570.470
Bogotá
(2625 masl)
T m i n = 54.260.60253.790.5130.57191.620.68250.57184.540.6726
T a v e = 71.390.61346.640.3700.59298.440.4500.59288.380.430
T m a x = 88.510.60385.050.3300.58346.050.3800.59333.990.370
Tunja
(2782 masl)
T m i n = 44.430.56170.110.76550.52117.631.142140.57187.850.7859
T a v e = 66.540.61332.750.4100.60290.240.5000.61348.230.430
T m a x = 88.660.60392.680.3400.59357.690.4000.60406.640.360
Disclaimer/Publisher’s Note: The statements, opinions and data contained in all publications are solely those of the individual author(s) and contributor(s) and not of MDPI and/or the editor(s). MDPI and/or the editor(s) disclaim responsibility for any injury to people or property resulting from any ideas, methods, instructions or products referred to in the content.