Article

Application of AFM on Identifying Mechanical Properties of Individual Minerals and Surface Properties of Crack with High Resolution in Shale

National Key Laboratory of Petroleum Resources and Engineering, China University of Petroleum-Beijing, Beijing 102249, China
*
Author to whom correspondence should be addressed.
Processes 2023, 11(8), 2498; https://doi.org/10.3390/pr11082498
Submission received: 15 July 2023 / Revised: 14 August 2023 / Accepted: 16 August 2023 / Published: 19 August 2023

Abstract

:
Improving the resolution and accuracy of the mechanical properties of organic-rich shale is very important. The results can reveal the mechanical properties of shale from micro scale and serve as a guide for the design of hydraulic fracture optimization parameters. This study introduced an advanced technique to obtain the mechanical properties of shale with high resolution (58.6 nm/pixel) by combining SEM, EDS, and Atomic Force Microscopy (AFM). To locate the target area in SEM and AFM accurately, a positioning technique that uses special distributions of pyrite was established. AFM PeakForce QNM mode was selected due to its advantages at capturing topography and mechanical properties in material. Results illustrated the ability of AFM to obtain the mechanical properties (modulus) of individual mineral components in shale, the detailed topography of crack, and mechanical properties of minerals in a specific area. In particular, the mechanical properties of minerals around crack explained the layered distribution of minerals around the fractures, and the cracks developed in the clay mineral layer was detected. This article demonstrates the great potential application of AFM in shale.

1. Introduction

The prosperity of shale oil and gas reservoirs, known as unconventional reservoirs, have prompted changes in the world’s energy landscape. Hydraulic fracturing in shale reservoirs was considered effective and has been widely used. In order to improve the stimulation efficiency of hydraulic fracturing, many studies have focused on characterizing and quantifying mechanical behaviors of shale from the micro to the macro scale over the past few years [1,2,3,4,5,6,7]. As a fine-grained material with strong heterogeneity and poor porosity and permeability, shale is generally composed of quartz, organic matter, calcite, feldspar, pyrite, clay minerals, and so on. Abundant mineral compositions significantly effect shale mechanical behaviors. Several studies on shale mechanical behaviors from the macro perspective have been conducted, including uniaxial and triaxial compression tests; these are common methods used to acquire macro mechanical properties [8,9,10,11]. As technology developed, researchers began to focus on mechanical behaviors at the micro or nano-scale in order to improve the understanding of shale in detail.
When researchers conduct studies on nanopores [12], kerogen, and minerals in shale, the unique abilities of AFM are an ideal method as AFM can generate results continuously and down to the nano resolution [9,13]. Several AFM works have been developed in relation to surface topography measurement, organic matter and clay elastic properties measurement, and adhesion properties. The AFM technique with Prekforce QNM (Quantitative Nanomechanical Property Mapping) mode was used to map elastic mechanical properties of mineral components at the micro scale by Eliyahu et al. [14] Different components, including pyrite, quartz, clay minerals, and organic matter, could be distinguished. Li et al. [15] combined AFM (Dimension Icon, Bruker, Mannheim, Germany) with Prekforce QNM mode, SEM (Scanning Electron Microscopy, ZEISS Merlin, ZEISS, Jena, Germany), and EDS (Energy-dispersive X-ray Spectroscopy) to demonstrate the small range of Yang’s modulus in organic matter (2–6 GPa) of Bakken shale and the large range of the same in clay (7–20 GPa). The structures of organic matter and clays are identified as homogeneous and heterogeneous, respectively. The tip chosen was the type RTESPA-525 with a spring constant of 200 N/m according to the Young’s modulus range measured in this article. Furthermore, AFM-based infrared spectroscopy (AFM-IR) was first used by Jing Yang et al. [16] to simultaneously provide the in-situ geomechanical and geochemical properties of individual organic matter particles at nanoscale, which also reveals mechanical and compositional variations. In that study, the contact mode in AFM and a PR-EX-NIR2 tip with a spring constant ranging from 0.07 to 0.4 N/m were chosen. Based on a previous study, AFM was first coupled with optical and electron microscopy by Li et al. [17] in order to visualize and quantify the elastic characterization of organic matters in Bakken shales. Young’s modulus was detected in the range of 2.91 GPa to 11.77 GPa of organic matter. Tian et al. [18,19] combined SEM, EDX, and AFM to analyze the chemical bonds of samples and characterize the morphology and adhesion properties of organic matter and inorganic matter in continental and marine shale. The research aimed to explore the effect of chemical composition and bonds on the adhesion properties of shale. Recently, Yong Li et al. [20] detected elastic mechanical properties and surface roughness of coal using AFM. Combined with SEM, the pore structure distribution and morphology were also obtained. Preliminary studies based on the application of AFM to rocks have been developed. Most initial investigations were centered on the characterization of the mechanical properties pertaining to organic matter (modulus, adhesion, etc.), and rarely focused on the characterization of the morphology and mechanical properties of shale cracks. Other mineral components in shale are very important to the structure and fracture of shale. Characterization at micro scale of shale cracks can provide guidance on the revealing of hydraulic fracturing mechanism.
Aiming at the fine-grained sedimentary characteristic of shale, this paper systematically established an approach include the measurement of mechanical properties of individual mineral with high resolution, fracture detailed detection, and the elastic mechanical properties characterization of different mineral layers around fractures in Longmaxi downhole marine shale. The methodology presented in this article utilizes atomic force microscopy (AFM) to locate mineral clusters in shale, enabling the measurement of target minerals. The use of diamond probes in conjunction with PeakForce-QNM and contact modes facilitates the measurement of a wide range of minerals, ranging from hard to soft. The approach is based on the combination of SEM, EDS, and AFM, which allows continuous characterization of shale.

2. Materials and Methods

2.1. Sample Information and Preparation

Samples in this study were from the Changning block, Sichuan basin. The Cambrian and Silurian strata are exposed at the core of the Changning anticline, and the two wings are the Permian-Triassic strata. The shale reservoir in Changning block is the marine shale of the Lower Silurian Longmaxi Formation, with a thickness of 250–350 m. The formation mainly consists of quartz, clay minerals, calcite, feldspar, dolomite, pyrite etc. The measured TOC of the Longmaxi Formation is 2~4.5%, which is mainly distributed in the lower part of Longmaxi Formation (2502 m~2524 m). It shows that the hydrocarbon formation conditions in the Longmaxi Formation shale layer in Changning area are favorable. Another condition for shale gas accumulation is the maturity of shale. The Ro of the Longmaxi shale is around 2.9%, indicating that the Longmaxi shale has matured and is in a favorable maturity range (0.5~2.5%) that is conducive to the formation of shale gas reservoirs. The lithology of the Longmaxi Formation in Changning area is mainly gray-black shale with 50–65% brittle mineral content. Due to the high content of siliceous and calcium in black shale, it is brittle and hard, and it is prone to cracks during fracturing. The mineral contents of shale sample used in this article was shown in Table 1.
The sample was sectioned into cubical specimens measuring 10 mm in length, 5 mm in width, and 2 mm in height with an accuracy of ±0.005 mm. The cubical specimen was wrapped in epoxy resin to ensure sample integrity and subsequently cut to expose the shale. Initial polishing was performed on the upper surface using diamond sandpaper via Target Surfacing System (Leica EM TXP, Leica, Wetzlar, Germany) until a surface roughness of 0.5 μm was achieved. The surface was subsequently polished using an Ion Beam Milling System (Leica TIC 3X, Leica, Germany) for a continuous period of 2 h under vacuum conditions, achieving a roughness less than 100 nm.

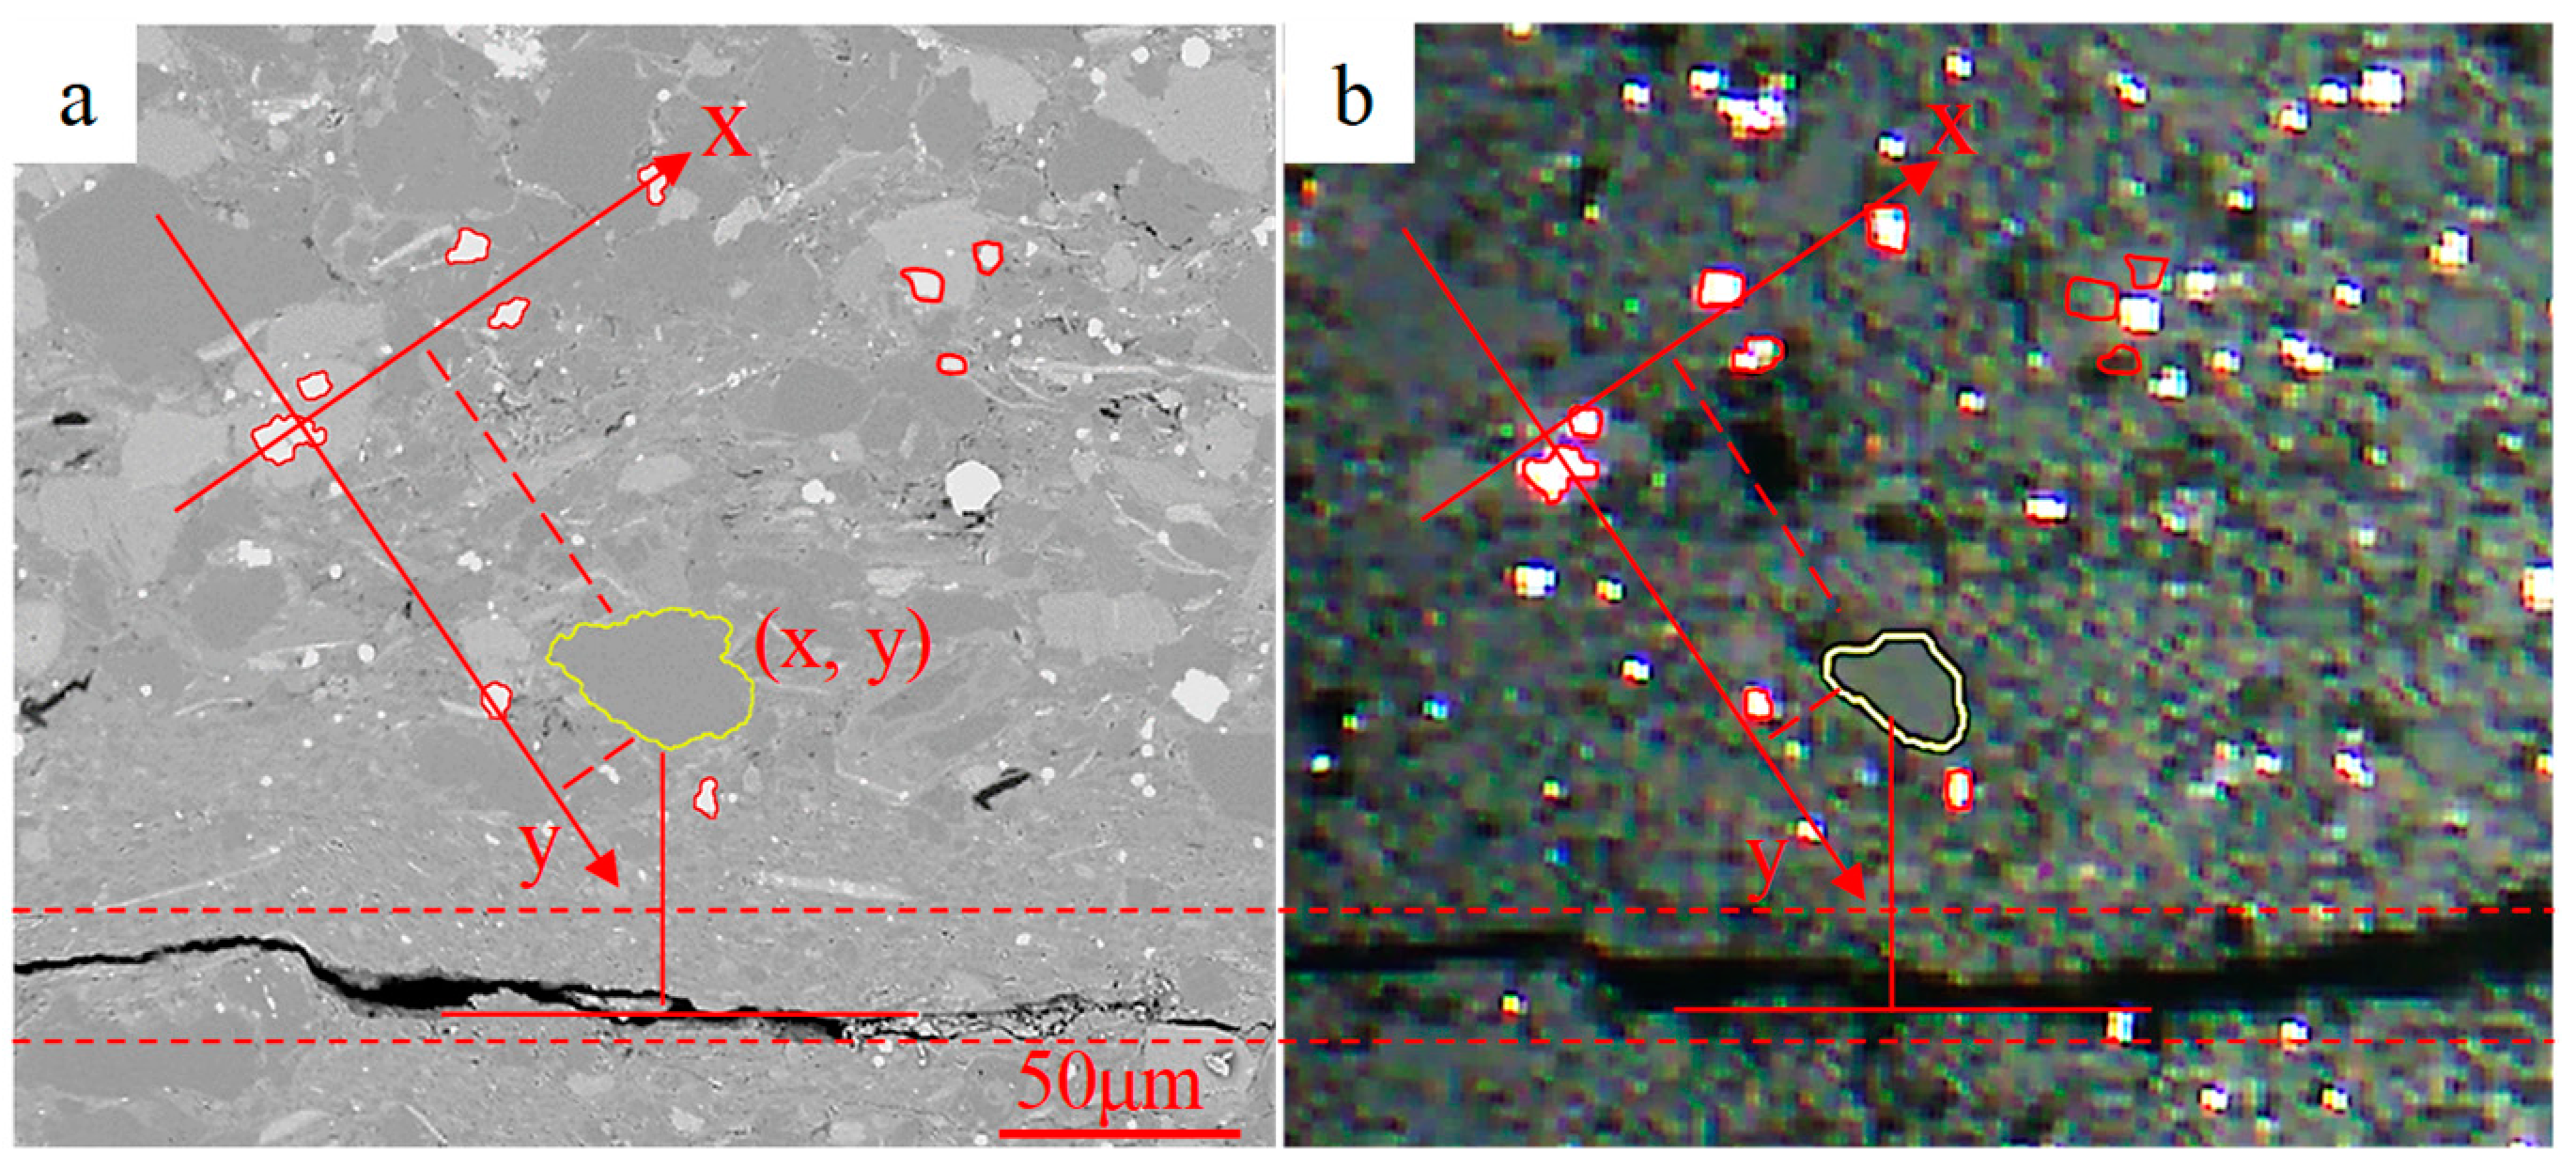
2.2. Experiment Positioning Method

This article presents an experimental approach for accurately positioning the SEM-selected area under the optical microscope of AFM. The image depicted in Figure 1a was obtained through SEM. Individual pyrite crystals exhibit an irregular polygonal shape when observed under SEM, while aggregated pyrite is present in the form of framboids [21]. The pyrites are circumscribed by red circles, which exhibit stronger brightness in the SEM image. By virtue of the distinctive morphology and spatial distribution of pyrites and fractures, a precise coordinate system can be established to accurately determine the target areas for AFM measurements based on their positional relationship with respect to the pyrite regions (Figure 1b). The discrepancy in the details between Figure 1a,b arises from the disparate imaging principles employed by SEM and optical microscopy and varying levels of resolution.

2.3. PeakForce QNM Mode and Contact Mode

A mineral mechanics measurement method is presented in detailed. This method combines the morphological description of SEM, elemental analysis of EDS, and high-resolution mechanical property testing of AFM. By observing the positional relationship of pyrite, the target area in the SEM can be matched to the experimental area of the AFM. AFM can obtain the surface height morphology, DMT modulus, and deformation of the test area.
A PeakForce QNM test and contact test were conducted using Atomic Force Microscopy (Dimension Icon, Bruker). The contact mode in AFM enables physical interaction between the probe tip and the sample surface, albeit at the expense of potential damage to the latter. The tapping mode facilitates the acquisition of surface topography by gently tapping the sample with an oscillating probe tip. In PeakForce Tapping mode, the probe tip interacts with samples at a force level of up to pN while periodically tapping the sample surface; this technology allows for the ongoing evaluation of nanomechanical characteristics, such as DMT modulus, adhesion force, etc. PeakForce QNM mode is developed from Tapping mode and PeakForce Tapping mode, which is a non-destructive technique on the surface of the sample.
As the Z piezo drives the cantilever towards the sample, it records the displacement of the probe (shown in Figure 2). At a certain setpoint, there is a vertical deflection. Once engaged with the sample, the cantilever undergoes deformation and experiences an increase in vertical deflection. The Z piezo then lifts the cantilever to bring it back to its original setpoint, marking one engagement round complete. During this process, laser reflection on photodetector captures force information for each pixel along time or displacement.
The calculation of the reduced modulus (E) can be derived from the force-displacement data using the Derjaguin–Muller–Toporov (DMT) model [22]:
F = 4 3 E * R x 3 + F a
E * = 1 1 v s 2 E s + 1 v t i p 2 E t i p ,
where F is force on tip, R is tip radius, x is surface deformation, and F a is adhesion force. ν and E are Poission’s ratio and Young’s modulus, respectively, and subscript s and tip correspond to the rock sample and diamond tip. In order to test the mechanical properties of shale, a diamond probe with a cube-shaped apex was employed, possessing a spring constant of 306.21 N/m.

3. Results and Discussions

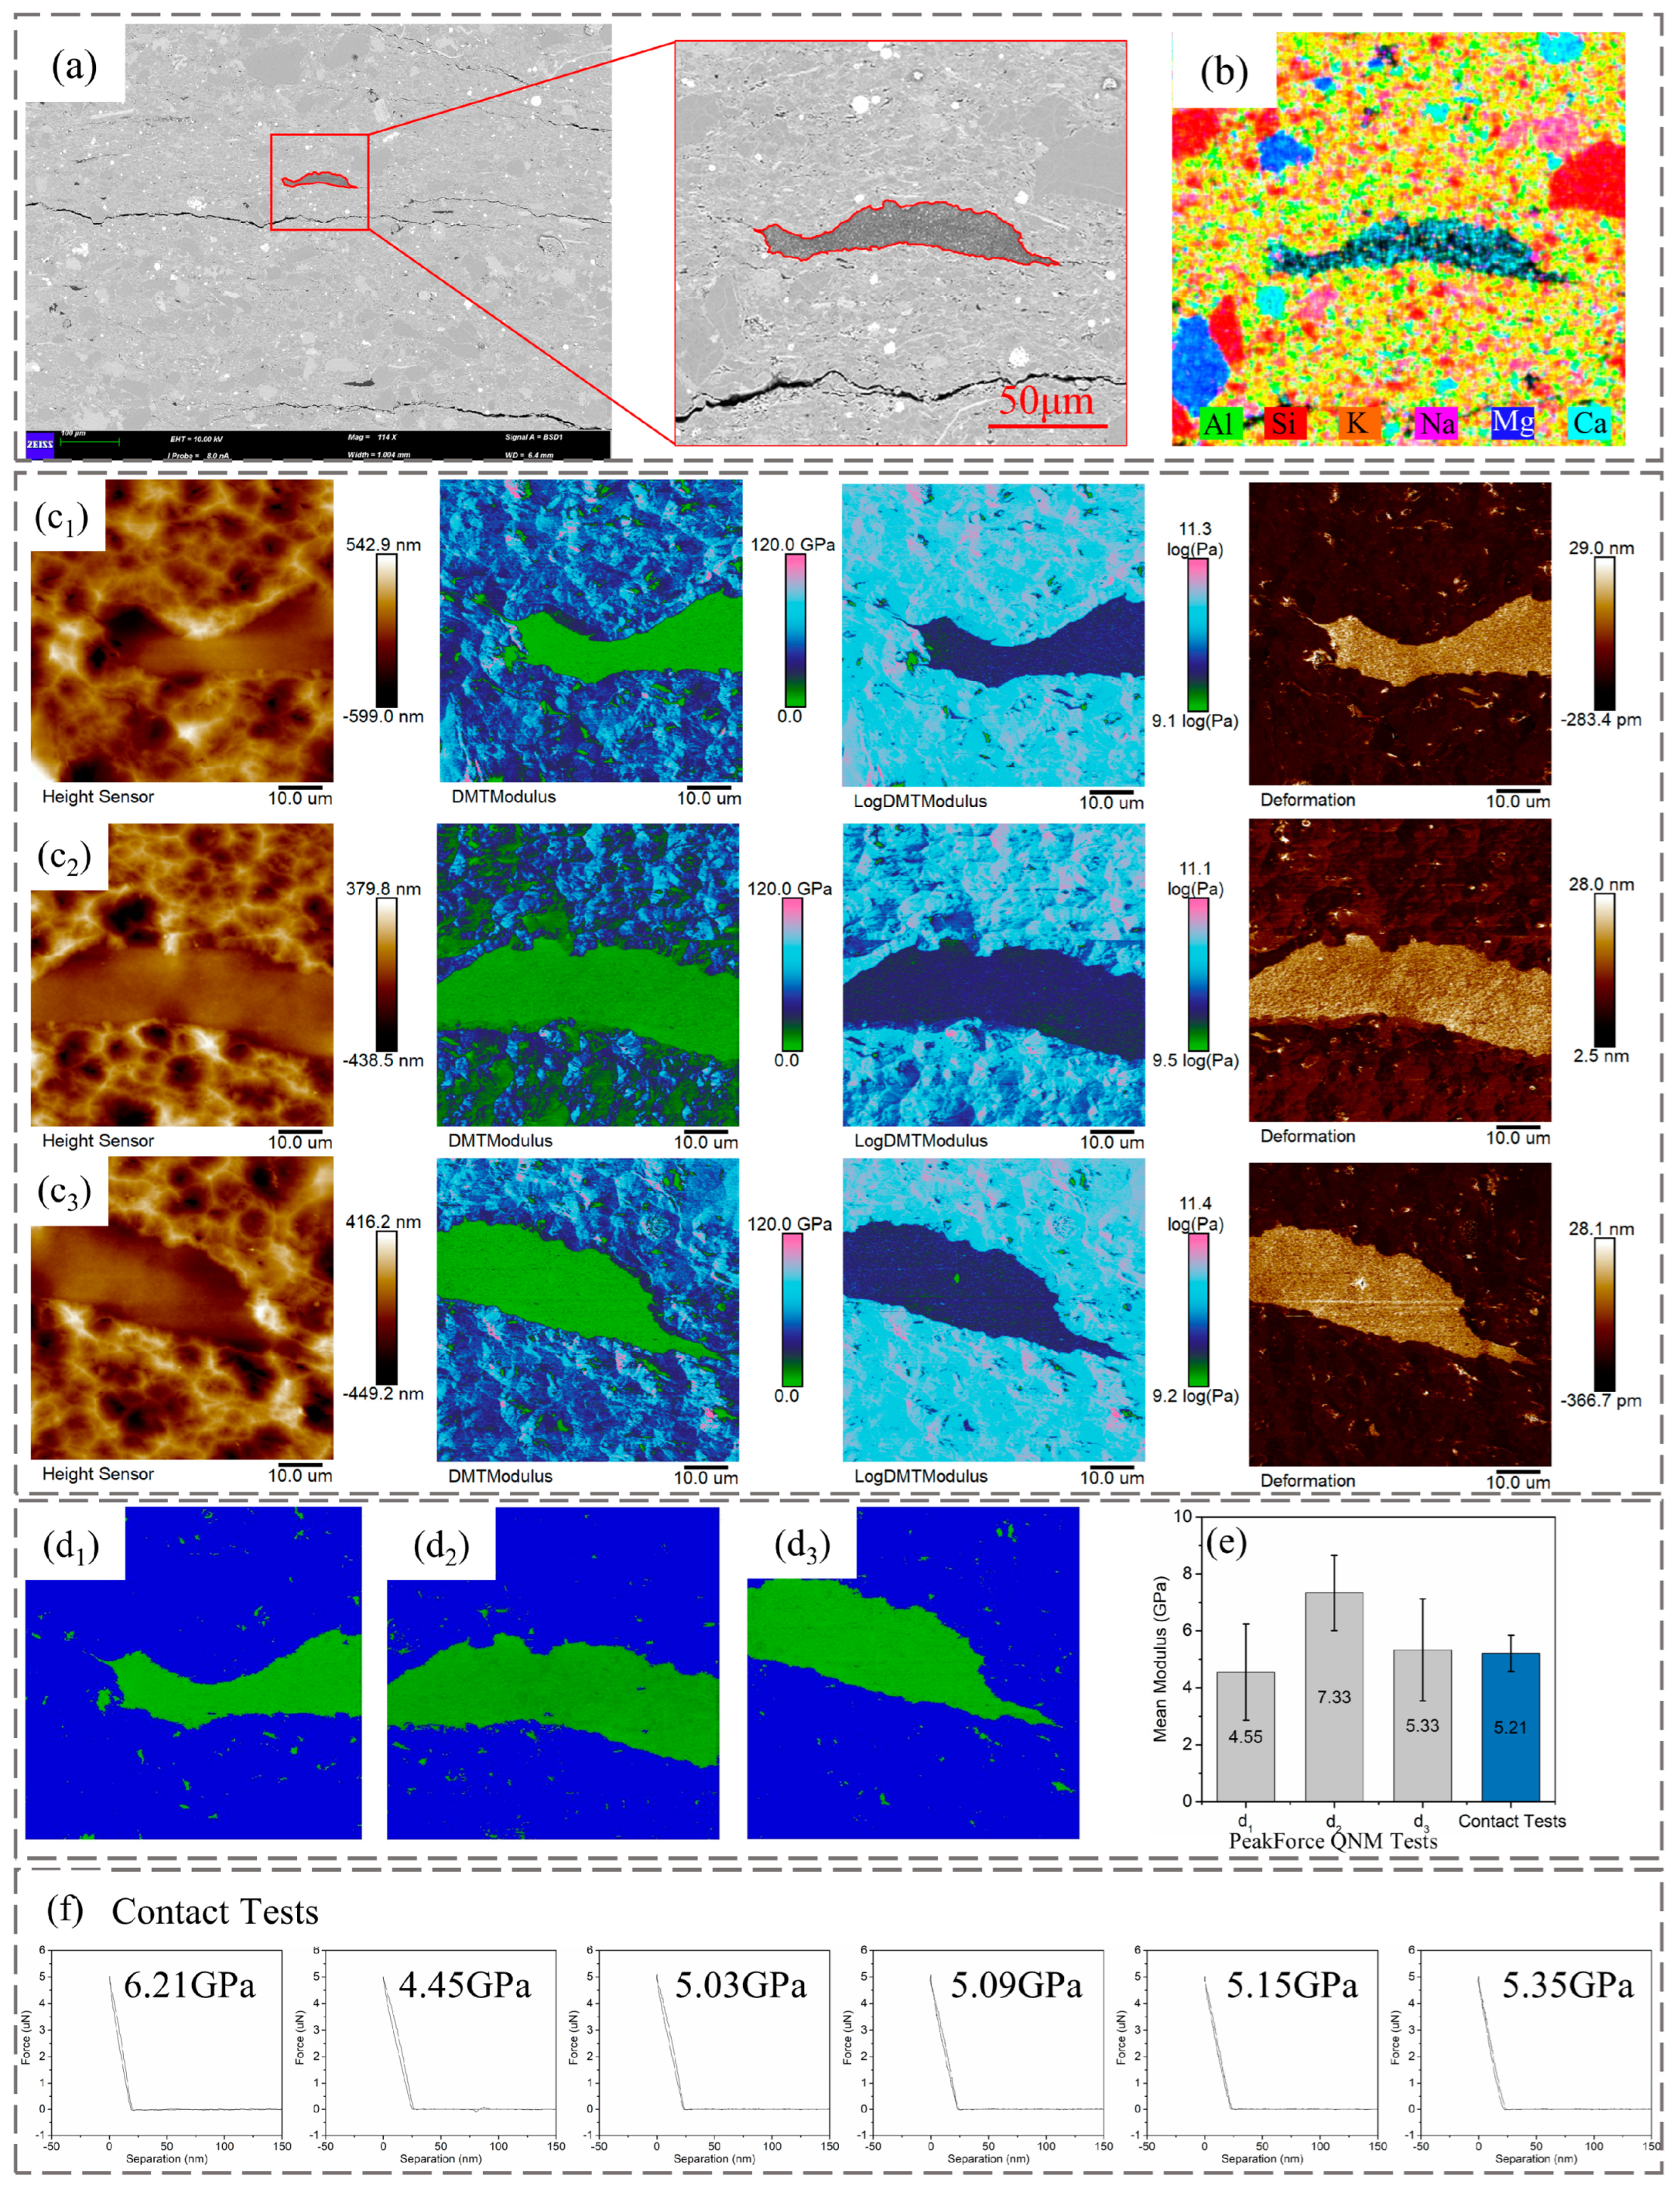
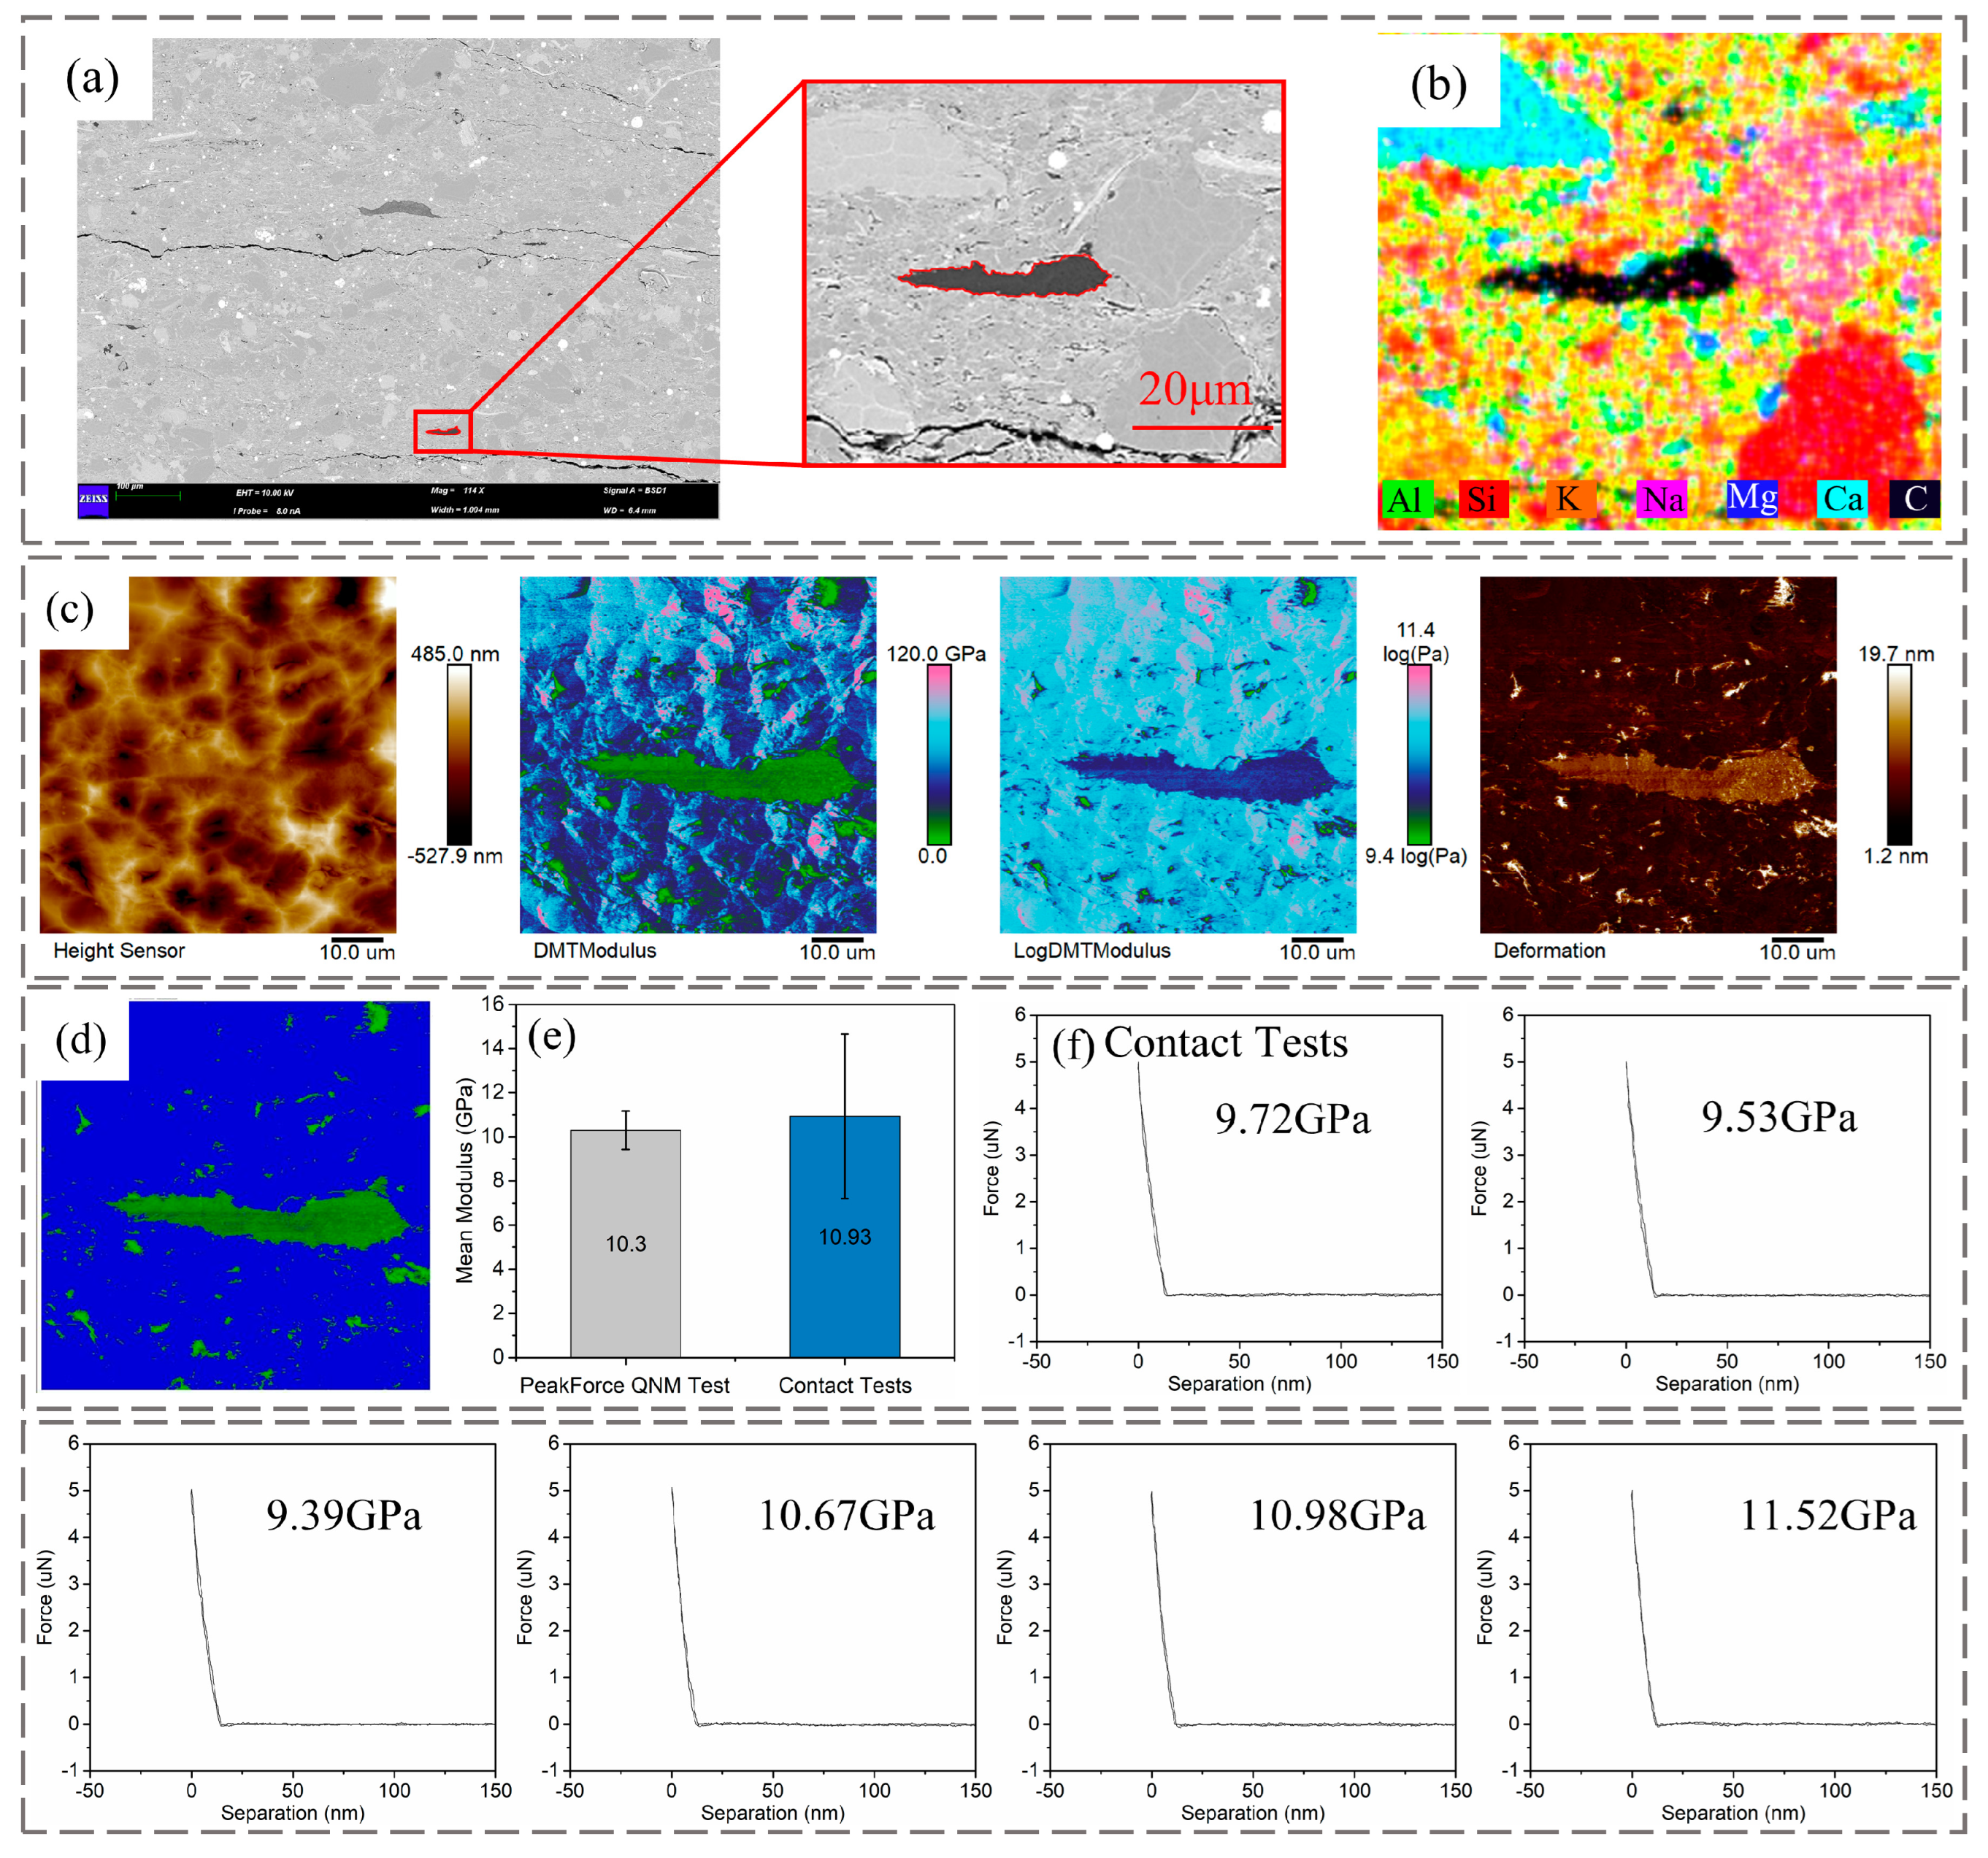
3.1. Identification of Mechanical Properties of Individual Minerals in Shale by AFM

Through the mineral location method introduced in Section 2.2, this paper achieves accurate targeting of minerals based on pyrite distribution characteristics. This approach optimizes target localization during experimentation and accurately correlates SEM imaging results with AFM experimental outcomes, thereby enhancing the efficiency of AFM utilization. The mechanical properties of individual minerals in shale are presented in Figure 3. The target mineral, identified as apatite through EDS analysis (Figure 3b), was scanned three times from Area C1 to C3 due to the limitation of scan size in AFM. In PeakForce QNM mode, surface topography could be detected in the target area, as shown in Height Sensor images. Roughness could be measured in the range from 75.3 nm to 94.4 nm. Modulus of individual mineral was calculated according to Derjaguin–Muller–Toporov (DMT) model and displayed in the form of 2-dimendional graph. Simultaneously, deformation of the sample surface can be measured due to the interacts between the tip and sample surface. Results show that the apatite has a smaller modulus and larger deformation than the surrounding matrix. The average modulus of the three regions of apatite are 4.55, 7.33, and 5.33 GPa, respectively, with standard deviation of 1.69 GPa, 1.32 GPa, and 1.79 GPa. Six contact tests were conducted randomly in the apatite area, as seen in Figure 3f. The modulus of the test point can be obtained from each force curve, and the average modulus value of the six curves is 5.21 GPa. The feasibility of the two methods can be verified according to the average modulus of the Force Curve tests and the modulus distribution data in the mineral region tested in the PeakForce QNM mode.
The results also show the application of AFM in measuring mechanical properties of organic matter in shale, as shown in Figure 4. The mean modulus of organic matter in Longmaxi shale is 10.3 GPa, with a standard deviation of 0.97 GPa through PeakForce QNM mode and 10.93 GPa wth standard deviation of 3.72 GPa through contact mode. The modulus of organic matter in Bakken shales has been detected in the range of 2.91 GPa to 11.77 GPa [15,17]. By comparing the modulus measurement of apatite and organic matter in Longmaxi shale through PeakForce QNM mode and contact mode, the results of the two modes matched precisely. This demonstrates the feasibility of AFM on modulus measurement of individual minerals in shale.

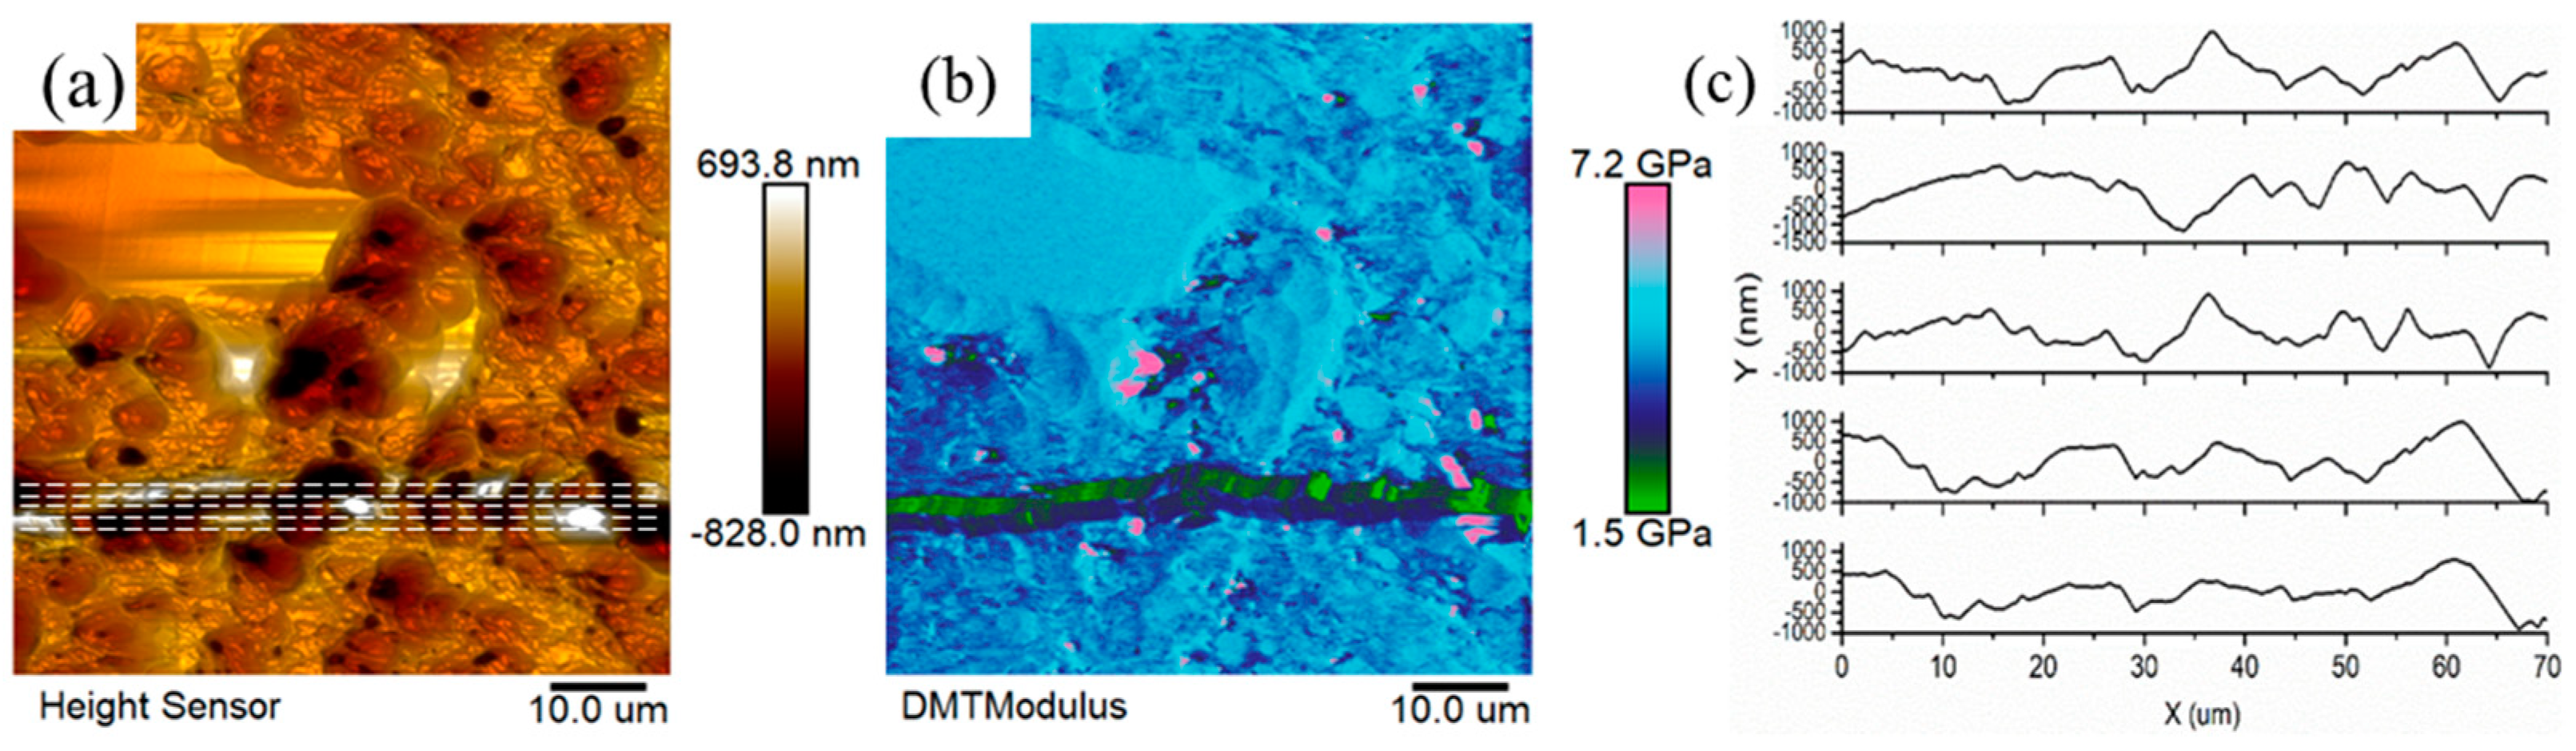
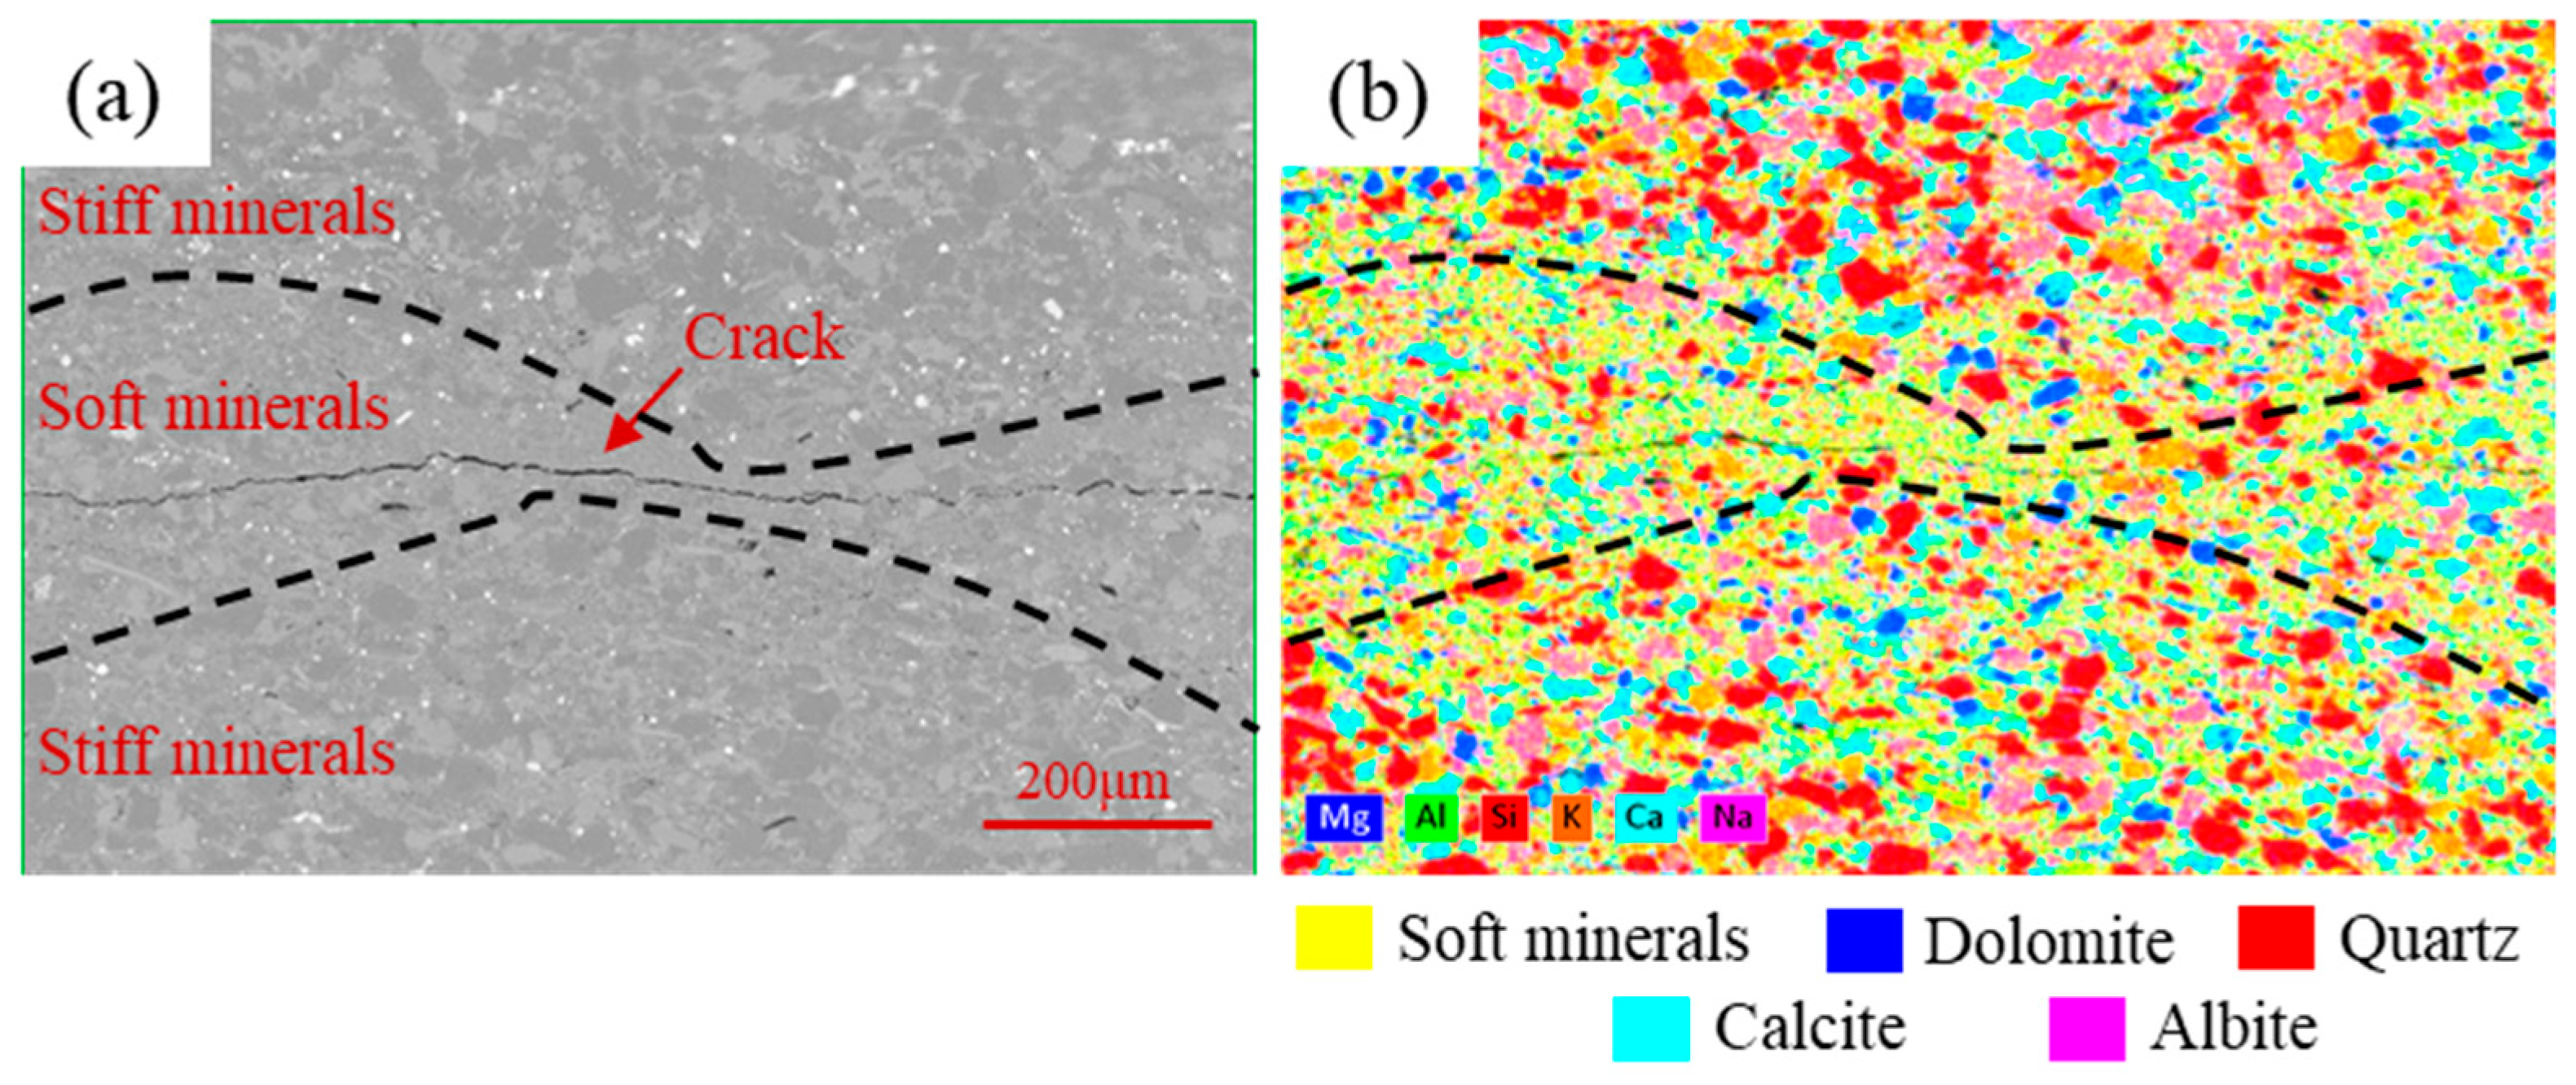
3.2. Crack Morphology Measurement

The AFM test on the crack and surrounding minerals can confirm the characteristics that the fine-grained mineral distributed around the crack. Figure 5a show topography of cracks detected. Due to the influence of minerals on the fracture wall surface on the probe, the measured modulus data in the crack is not zero. Furthermore, the modulus of minerals around the crack is relatively low, and the highest modulus value is displayed as 7.2 GPa. This also corresponds to the lower modulus around the cracks mentioned above. The average width of the crack measured in Figure 4a is 5.81 μm. The crack depth in each section chosen along the crack extension direction can be obtained (Figure 5c). AFM enables high-precision measurement of cracks.

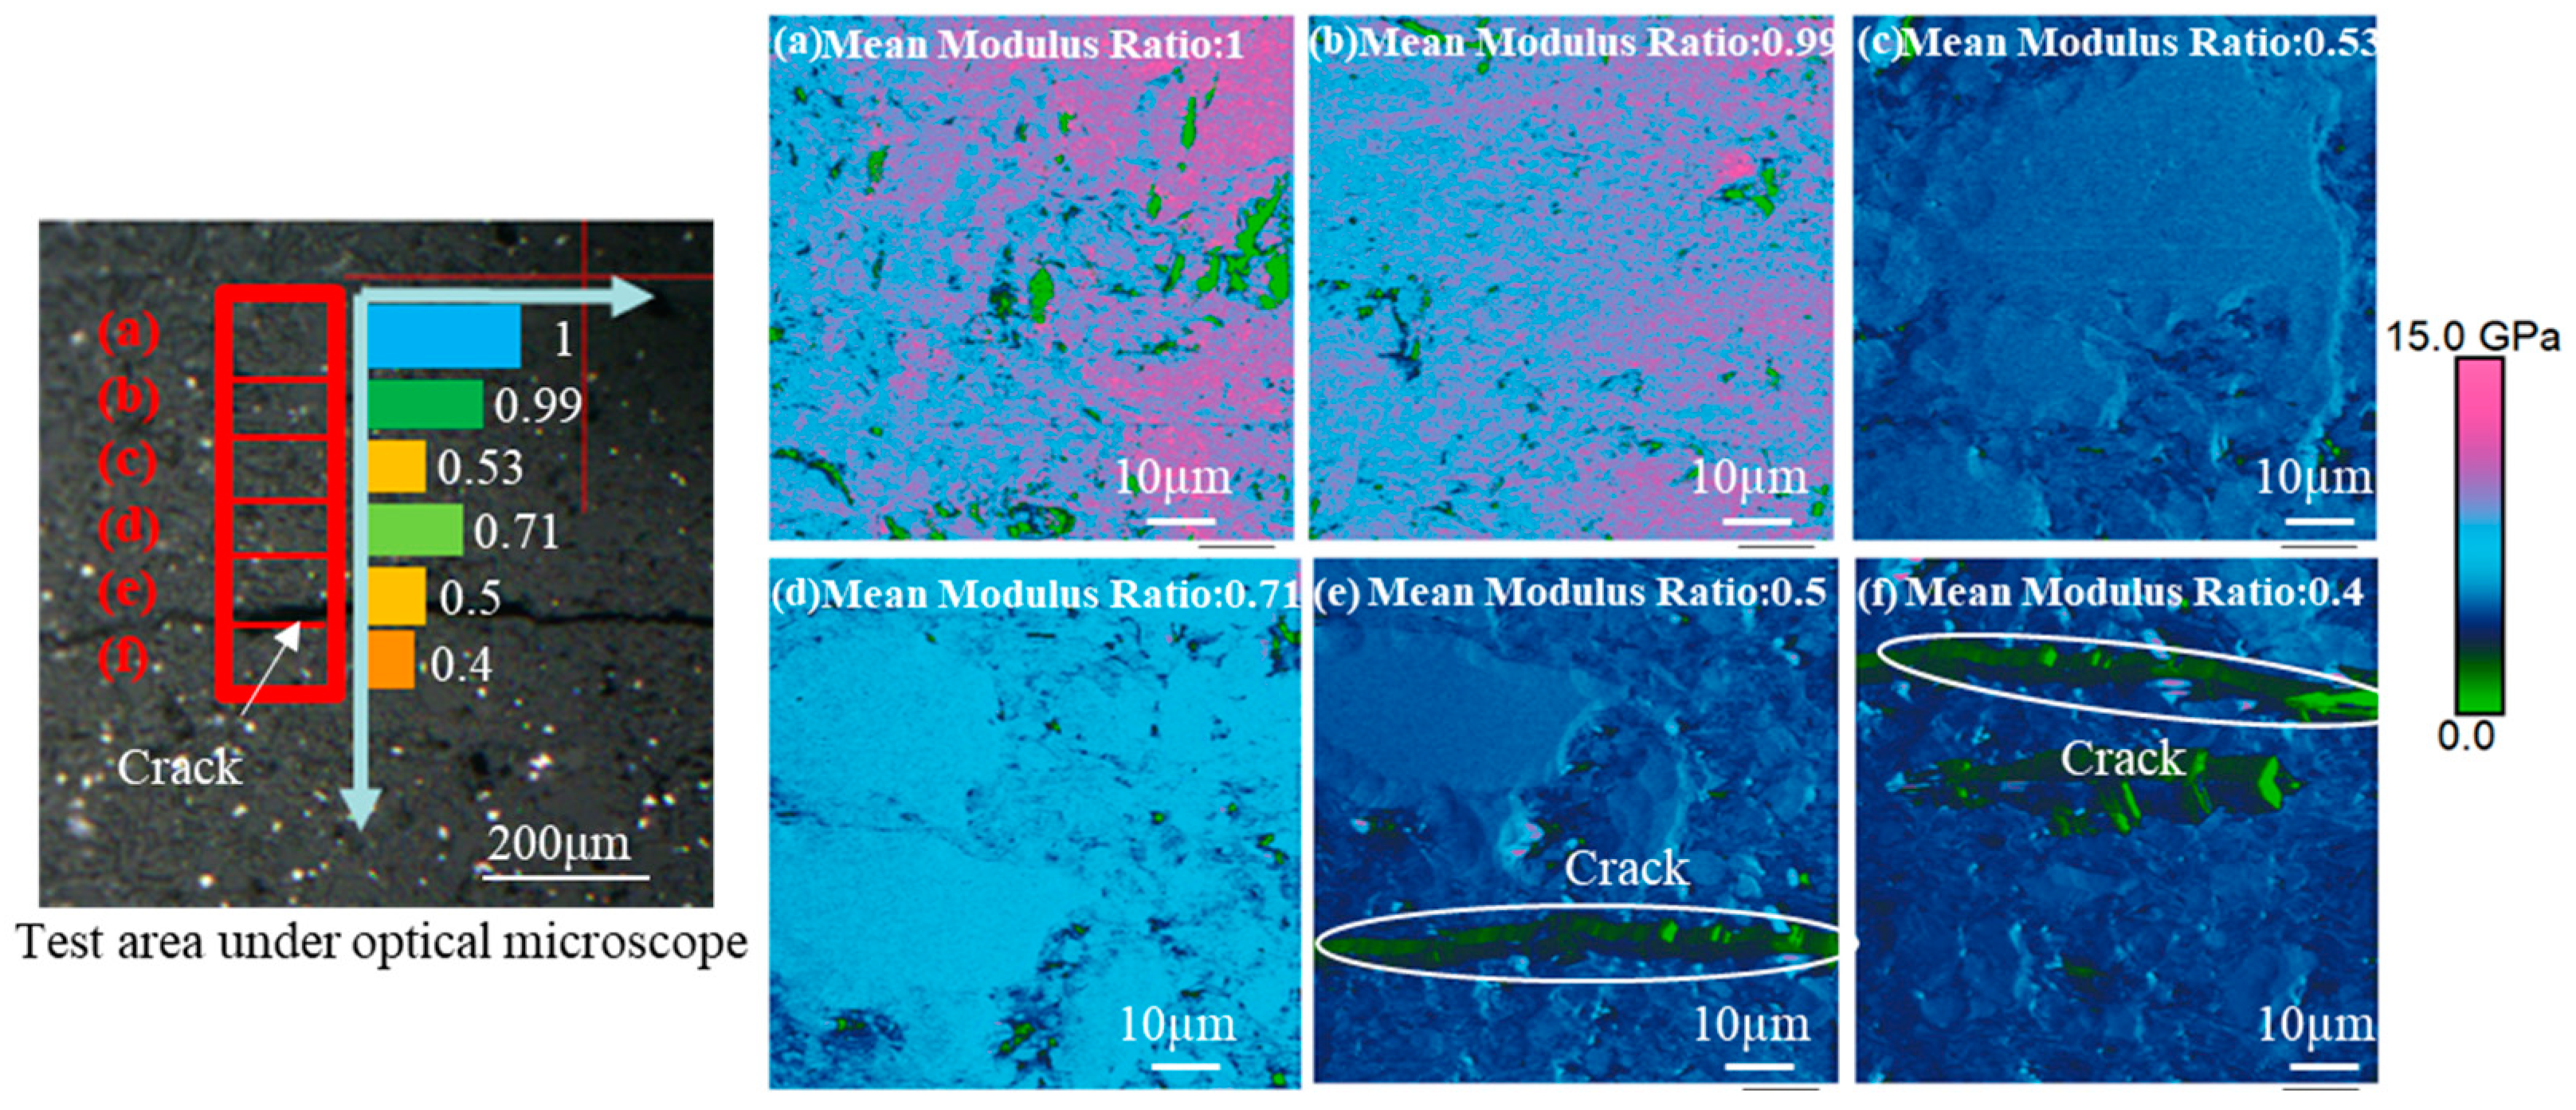
3.3. Elastic Mechanical Properties of Mineral Layers around Crack

Three distributions of minerals around fractures can be observed in the downhole-core samples. Figure 6a shows layered mineral distributions (stiff minerals–soft minerals–stiff minerals) around crack in shale sample. Stiff mineral layers in shale are usually composed of quartz, dolomite, calcite, albite, etc., while clay minerals are the main component in soft mineral layers. The mechanical properties of the different layers have been confirmed variably through nanoindentation test [23]. In this distribution, crack extended in soft mineral layer. Here, it remains uncertain whether the observed crack is of natural origin or if it occurred during the sample preparation process. Regardless how it formed, the cracks are generated in the weak layer under the effect of external force. The purpose is to measure the mechanical characteristics of the minerals around the fracture.
AFM test results are shown in Figure 7. It can be divided into a high modulus area and a low modulus area by comparing the modulus levels between selected areas around crack. The area with the highest modulus level was set as the reference, and the ratio of the average modulus of the other areas to the average modulus of this area was calculated and displayed in optical microscope graph. It can be concluded that the modulus around the fracture show a layered distribution (high modulus—low modulus—high modulus), as shown in SEM and EDS results, by combining the modulus ratio and modulus distribution.
The SEM and EDS results revealed a layered distribution of minerals surrounding the fractures, with the crack propagating through the argillaceous mineral layer. AFM analysis demonstrated the feasibility and precision of this technique in characterizing micron-scale crack morphology, while also confirming its high-resolution capabilities for detecting mechanical properties of shale’s microscopic mineral components.

4. Conclusions

An advanced technique, which combines SEM, EDS and AFM, has been established to measure the mechanical properties of individual minerals in Longmaxi downhole marine shale with high resolution and crack information. Additionally, it can determine the elastic mechanical properties of different mineral layers around fractures. A positioning technique is presented in this article, which utilizes the unique distribution characteristics of pyrite. This technique enables precise localization of the target test area in SEM and AFM, resulting in high-resolution and high-precision acquisition of mechanical properties and fracture morphology of shale mineral components. Specifically, the utilization of AFM for characterizing the layered mineral distribution surrounding the cracks has verified that the development of cracks in clay mineral layer is facile.

Author Contributions

Conceptualization, S.C. and M.S.; methodology, S.C.; software, S.C. and P.X.; validation, S.C. and M.S.; formal analysis, S.C. and P.X.; investigation, S.C.; data curation, S.C. and M.S.; writing—original draft preparation, S.C.; writing—review and editing, M.S.; visualization, S.C. and P.X.; supervision, M.S.; project administration, M.S.; funding acquisition, M.S. All authors have read and agreed to the published version of the manuscript.

Funding

This research was funded by National Natural Science Foundation of China, grant number 52074315.

Data Availability Statement

The data presented in this study are available upon request from the corresponding author.

Acknowledgments

We would like to express our gratitude to Quan Xu from China University of Petroleum-Beijing for his valuable suggestions, as well as researcher Yanru Zhang from State Key Laboratory of Petroleum Resources and Prospecting of China University of Petroleum-Beijing for her assistance in SEM testing.

Conflicts of Interest

The authors declare no conflict of interest.

References

  1. Papanastasiou, P. The influence of plasticity in hydraulic fracturing. Int. J. Fract. 1997, 84, 61–79. [Google Scholar] [CrossRef]
  2. Van Dam, D.; Papanastasiou, P.; De Pater, C. Impact of rock plasticity on hydraulic fracture propagation and closure. In Proceedings of the SPE Annual Technical Conference and Exhibition, Dallas, TX, USA, 1–4 October 2000. [Google Scholar]
  3. Constantinides, G.; Ravi Chandran, K.S.; Ulm, F.J.; Van Vliet, K.J. Grid indentation analysis of composite microstructure and mechanics: Principles and validation. Mater. Sci. Eng. A 2006, 430, 189–202. [Google Scholar] [CrossRef]
  4. Bobko, C.; Ulm, F.-J. The nano-mechanical morphology of shale. Mech. Mater. 2008, 40, 318–337. [Google Scholar] [CrossRef]
  5. Deirieh, A.; Ortega, J.A.; Ulm, F.J.; Abousleiman, Y. Nanochemomechanical assessment of shale: A coupled WDS-indentation analysis. Acta Geotech. 2012, 7, 271–295. [Google Scholar] [CrossRef]
  6. Li, C.; Ostadhassan, M.; Kong, L.; Bubach, B. Multi-scale assessment of mechanical properties of organic-rich shales: A coupled nanoindentation, deconvolution analysis, and homogenization method. J. Pet. Sci. Eng. 2019, 174, 80–91. [Google Scholar] [CrossRef]
  7. Xu, J.; Tang, X.; Wang, Z.; Feng, Y.; Bian, K. Investigating the softening of weak interlayers during landslides using nanoindentation experiments and simulations. Eng. Geol. 2020, 277, 105801. [Google Scholar] [CrossRef]
  8. Klein, E.; Baud, P.; Reuschlé, T.; Wong, T.F. Mechanical behaviour and failure mode of bentheim sandstone under triaxial compression. Phys. Chem. Earth Part A Solid Earth Geod. 2001, 26, 21–25. [Google Scholar] [CrossRef]
  9. Abousleiman, Y.N.; Tran, M.H.; Hoang, S.; Bobko, C.P.; Ortega, A.; Ulm, F.-J. Geomechanics Field and Laboratory Characterization of the Woodford Shale: The Next Gas Play. In Proceedings of the SPE Annual Technical Conference and Exhibition, Anaheim, CA, USA, 1 January 2007; p. 14. [Google Scholar]
  10. Wu, Y.; Li, X.; He, J.; Zheng, B. Mechanical Properties of Longmaxi Black Organic-Rich Shale Samples from South China under Uniaxial and Triaxial Compression States. Energies 2016, 9, 1088. [Google Scholar] [CrossRef]
  11. Wu, J.; Wong, H.S.; Yin, Q.; Ma, D. Effects of aggregate strength and mass fraction on mesoscopic fracture characteristics of cemented rockfill from gangue as recycled aggregate. Compos. Struct. 2023, 311, 116851. [Google Scholar] [CrossRef]
  12. Wu, J.; Jing, H.; Gao, Y.; Meng, Q.; Yin, Q.; Du, Y. Effects of carbon nanotube dosage and aggregate size distribution on mechanical property and microstructure of cemented rockfill. Cem. Concr. Compos. 2022, 127, 104408. [Google Scholar] [CrossRef]
  13. Javadpour, F.; Moravvej Farshi, M.; Amrein, M. Atomic-Force Microscopy: A New Tool for Gas-Shale Characterization. J. Can. Pet. Technol. 2012, 51, 236–243. [Google Scholar] [CrossRef]
  14. Eliyahu, M.; Emmanuel, S.; Day-Stirrat, R.J.; Macaulay, C.I. Mechanical properties of organic matter in shales mapped at the nanometer scale. Mar. Pet. Geol. 2015, 59, 294–304. [Google Scholar] [CrossRef]
  15. Li, C.; Ostadhassan, M.; Kong, L. Nanochemo-mechanical characterization of organic shale through AFM and EDS. In Proceedings of the SEG Technical Program Expanded Abstracts 2017, Houston, TX, USA, 28 September 2017; pp. 3837–3840. [Google Scholar]
  16. Yang, J.; Hatcherian, J.; Hackley, P.C.; Pomerantz, A.E. Nanoscale geochemical and geomechanical characterization of organic matter in shale. Nat. Commun. 2017, 8, 2179. [Google Scholar] [CrossRef] [PubMed]
  17. Li, C.; Ostadhassan, M.; Gentzis, T.; Kong, L.; Carvajal-Ortiz, H.; Bubach, B. Nanomechanical characterization of organic matter in the Bakken formation by microscopy-based method. Mar. Pet. Geol. 2018, 96, 128–138. [Google Scholar] [CrossRef]
  18. Tian, S.; Dong, X.; Wang, T.; Zhang, R.; Zhang, P.; Sheng, M.; Cheng, S.; Zhao, H.; Fei, L.; Street, J.; et al. Surface Properties of Organic Kerogen in Continental and Marine Shale. Langmuir 2018, 34, 13882–13887. [Google Scholar] [CrossRef] [PubMed]
  19. Tian, S.; Wang, T.; Li, G.; Sheng, M.; Zhang, P. Nanoscale Surface Properties of Organic Matter and Clay Minerals in Shale. Langmuir 2019, 35, 5711–5718. [Google Scholar] [CrossRef] [PubMed]
  20. Li, Y.; Yang, J.; Pan, Z.; Tong, W. Nanoscale pore structure and mechanical property analysis of coal: An insight combining AFM and SEM images. Fuel 2020, 260, 116352. [Google Scholar] [CrossRef]
  21. Chen, F.; Zheng, Q.; Ding, X.; Lu, S.; Zhao, H. Pore size distributions contributed by OM, clay and other minerals in over-mature marine shale: A case study of the Longmaxi shale from Southeast Chongqing, China. Mar. Pet. Geol. 2020, 122, 104679. [Google Scholar] [CrossRef]
  22. Derjaguin, B.V.; Muller, V.M.; Toporov, Y.P. Effect of contact deformations on the adhesion of particles. J. Colloid Interface Sci. 1975, 53, 314–326. [Google Scholar] [CrossRef]
  23. Cheng, S.; Sheng, M.; Chen, Z.; Tian, S.; Li, G. Identification of Shale Bedding Layers from Micromechanical Evaluation. In Proceedings of the SPE Annual Technical Conference and Exhibition 2021, ATCE 2021, Dubai, United Arab Emirates, 21–23 September 2021. [Google Scholar]
Figure 1. Positioning method combining SEM and AFM: (a) SEM image with pyrite (enclosed by red line) and target mineral (enclosed by yellow line) distributing clearly; (b) Corresponding area under the optical microscope in the AFM. A positioning technique that integrates SEM and AFM was employed in this study. (a) The SEM image clearly shows the distribution of pyrite (marked by a red line), the target mineral (marked by a yellow line) and surrounding fracture. (b) The corresponding area under the optical microscope through AFM.
Processes 11 02498 g001
Figure 2. Schematic representation of an Atomic Force Microscope.
Processes 11 02498 g002
Figure 3. Identification of mechanical properties of apatite in shale by AFM. (a) SEM topography image of target mineral; (b) EDX element distribution for target area; (c1c3) AFM results including height distribution, DMT modulus, log10(DMT modulus) and deformation; (d1d3) Target mineral area in AFM results; (e) Mean modulus and standard deviation for target mineral areas (d1d3) and contact tests. (f) Six force separation curves tested randomly in the target area through contact test.
Processes 11 02498 g003
Figure 4. Identification of mechanical characteristics of organic matter in shale by AFM. (a) SEM topography image of target mineral; (b) EDX element distribution for target area; (c) AFM results including height distribution, DMT modulus, log10(DMT modulus) and deformation; (d) Target mineral area in AFM results; (e) Mean modulus and standard deviation for target mineral areas d and contact tests. (f) Six force separation curves tested randomly in the target area through contact mode.
Processes 11 02498 g004
Figure 5. The topography and modulus around fracture from AFM test. (a) Topography graphs of fracture; (b) Modulus distribution graphs. (c) Crack depth information on sections along the crack extension direction.
Processes 11 02498 g005
Figure 6. SEM and EDS result of shale sample: (a) SEM morphology of shale sample where stiff and soft minerals distributed by layers and crack extended in soft mineral layer (b) Corresponding EDS images.
Processes 11 02498 g006
Figure 7. AFM test results. The image on the left is the test area under the optical microscope. The histogram shows the ratio of the average modulus in each test area to the average modulus value of area (a). (af) are the modulus results corresponding to each area.
Processes 11 02498 g007
Table 1. Mineral Contents of Shale Sample (%).
SampleQuartzFeldsparCalciteDolomitePyriteClayTOCDepth/m
Shale31.210.48.57.53.139.31.112502
Disclaimer/Publisher’s Note: The statements, opinions and data contained in all publications are solely those of the individual author(s) and contributor(s) and not of MDPI and/or the editor(s). MDPI and/or the editor(s) disclaim responsibility for any injury to people or property resulting from any ideas, methods, instructions or products referred to in the content.

