1. Introduction
The increasing share of greenhouse gases in the atmosphere and the associated global warming are forcing engineers in all areas to change the technologies used. The maritime industry is no exception, as ships usually burn fuels that emit much more air-polluting gases than conventional diesel used in road transport (in the case of sulfur oxides, the difference is more than a thousand times) [
1,
2]. This contributes not only to an increase in the share of greenhouse gases in the atmosphere, but also to a deterioration in the air quality of port cities. Auxiliary generators produce carbon dioxide (CO
2), nitrogen oxides (NOx), sulfur oxides (SOx), and particulate matter (PM) [
3,
4]. For example, in the Turkish port city of Samsun, the analyses resulted in a 12% share of NOx emissions and a 5% share of SO
2 emissions [
5]. More than half of these emissions were emitted during the mooring of ships [
5]. This is due to the fact that even when mooring, the ship consumes a significant amount of energy for the operation of pumps, control systems, ventilation, cooling, heating, etc. [
6]. Due to the increasingly stringent directives of the International Maritime Organization (IMO) [
7] and the EU [
8] aimed at reducing the emissions of sulfur oxides, ships are forced to solve these emissions. Shipowners basically have three options to meet their requirements. The first option is to change the fuels they use to power ports in ultra-low-sulfur fuels, such as Marine Gas Oil (MGO). The second option is to invest in scrubber systems that reduce the content of SOx and dust particles. The third option is shore connection. If moored ships are connected to the port city distribution network, emissions can be partially or completely eliminated. The overall rate of emission reductions depends on the energy mix of the area. The European Union has decided that its ports will have to provide the shore connection option by 2025 [
9]. However, already from 2005 there has existed a requirement that ships staying at EU ports for more than 2 h are required to use ultralow-sulfur fuel or achieve similar reductions via alternative technologies, including shore connection as an option [
9]. The situation in the USA is similar, where, for example, in California ports, the connection to the berth distribution network is already mandatory [
9]. In the US, the term “cold ironing” is used as an equivalent to the term shore connection [
10].
1.1. Shore Connection Stadardisation
One of the challenges that has prevented faster spread of shore connection technology is the diversity of electricity distribution networks around the world. Incompatibility with the port distribution network has discouraged investors from acquiring this technology. The primary distribution voltage on ships varies from 230 volts to 11 kilovolts [
11]. There is also a large variety of loads, and the frequency is sometimes 50 and sometimes 60 Hz [
12]. All of this is due to a lack of voltage standardization [
2]. The common work of IEC, IEEE, and ISO experts resulted in the development of standards that enable the building of shore connection systems. The HVSC (high-voltage shore connection) standard for vessels with generator power above 1 MVA (IEC/ISO/IEEE 80005-1) was first published in July 2012. The LVSC (low-voltage shore connection) standard for ships under 1 MVA (IEC/ISO/IEEE 80005-3) was first published in August 2014. These two standards enabled the implementation of new shore connection systems, which are consistent with global standards [
13]. It is important to mention that, according to the Standards of Training, Certification, and Watch-keeping for Seafarers (STCW) Code, in marine applications, the term high voltage refers to systems above 1 kV [
14]. It can be stated that naval HV networks and MV networks on land are synonyms [
15]. The second chapter of this paper focuses on shore connection system description according to the above-mentioned standards.
1.2. Frequency Conversion
In the beginning of the development of shore-to-ship power supply, the frequency conversion was provided by a synchronous motor/generator system [
16]. Later, the advantage of static frequency converters over rotating motor/generator systems for shore connection was proved [
17,
18]. These can be installed in the port substation, at the berth, or directly on the ship. A fast dynamic response is one of the most important requirements of frequency converters because it is crucial to prevent a voltage drop caused by large consumers on ship side. The best solution for high-voltage shore connection was then evaluated as a PWM frequency converter with an active front end [
19]. It was found that a centralized system with one or more frequency converters placed in a substation is a better solution than distributed topology with one frequency converter placed at each berth [
17,
19]. Conventional static frequency converters were not developed for large power outputs, which are needed to power large vessels, such as ferries or cruise ships. A new solution is needed, and this solution is described in following paragraphs.
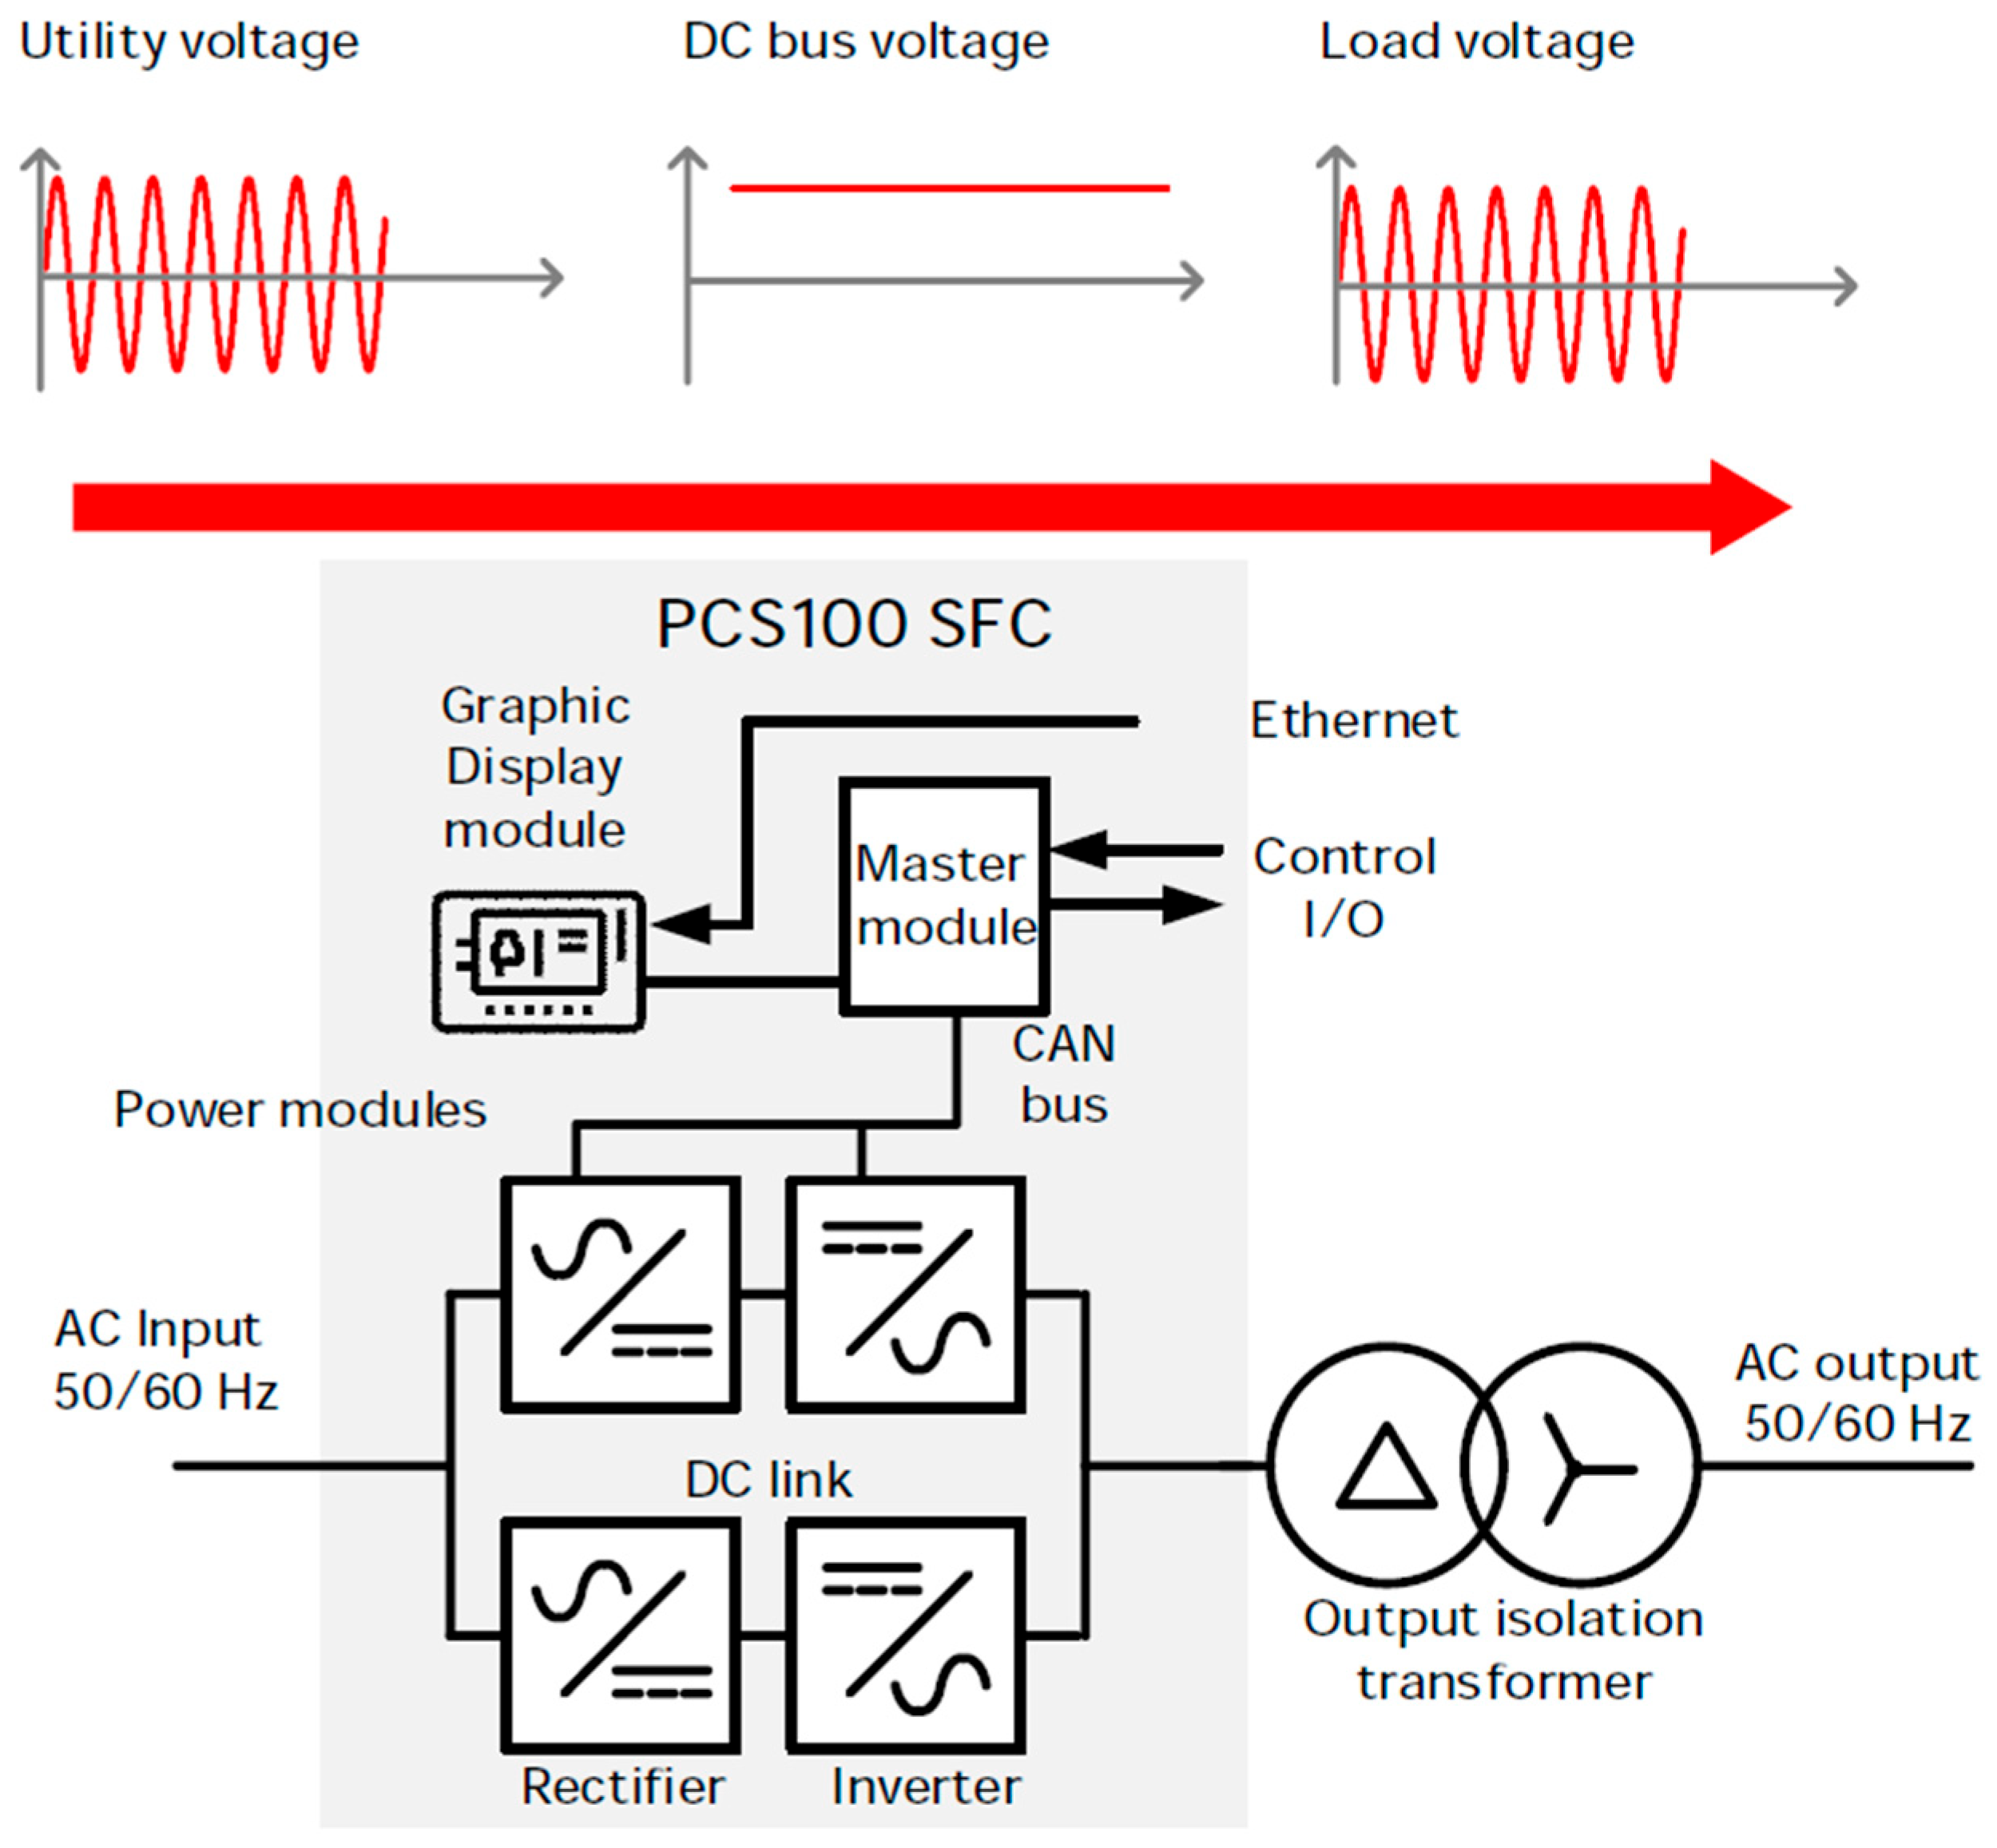
Based on ABB’s experience, for a power range between 120 kVA and 5 MVA, it is recommended to use insulated-gate bipolar transistor (IGBT)-based static frequency converters. These frequency converters are low voltage as standard. In combination with power transformers, they can also be used for ships with high-voltage distribution. Since the 2010s, PCS 100 SFC with a typical rated voltage output of 480 V has been used for shore connection applications. However, PCS 100 SFC could only be used for power outputs of up to 2 MVA. For larger outputs, a medium-voltage, integrated gate-commutated thyristor (IGCT)-based system is recommended. The IGCT represents state-of-the-art in high-power semiconductors and combines both the advantages of a common GTO and the IGBT, i.e., the low conducting losses and very fast transition, respectively. In the 2010s, ABB used PCS 6000, which was able to deliver up to 7 MVA. By parallel operation of PCS 6000 units, the total capacity of frequency converters could be even up to 120 MVA [
17,
20,
21].
However, all frequency converters from the PCS series were developed as static frequency converters, so they were expected to be used in simpler and smaller systems. For complex systems with larger outputs, a new option was found, namely off-grid modification of motor drive. It is a frequency converter developed for driving motors and has modified firmware for use as a static frequency converter. An example of such an ABB low-voltage frequency converter is the ACS880 SFC. This static frequency converter takes advantage of a more robust design that allows outputs of up to 5 MVA (air-cooled), while liquid-cooled units can have outputs up to 6.25 MVA. Moreover, these frequency converters have an accessible DC link to which batteries, supercapacitors, or other sources can be connected. This was not possible with the PCS series. In 2017, ABB presented the medium-voltage frequency converter ACS6080 SFC, which can deliver up to 24 MVA [
22,
23].
Recent research showed another option—the series connection of three 3.3 kV SiC MOSFETs. It has the potential to replace conventional Si IGBT-based converters for MV applications with improved power density and efficiency [
24].
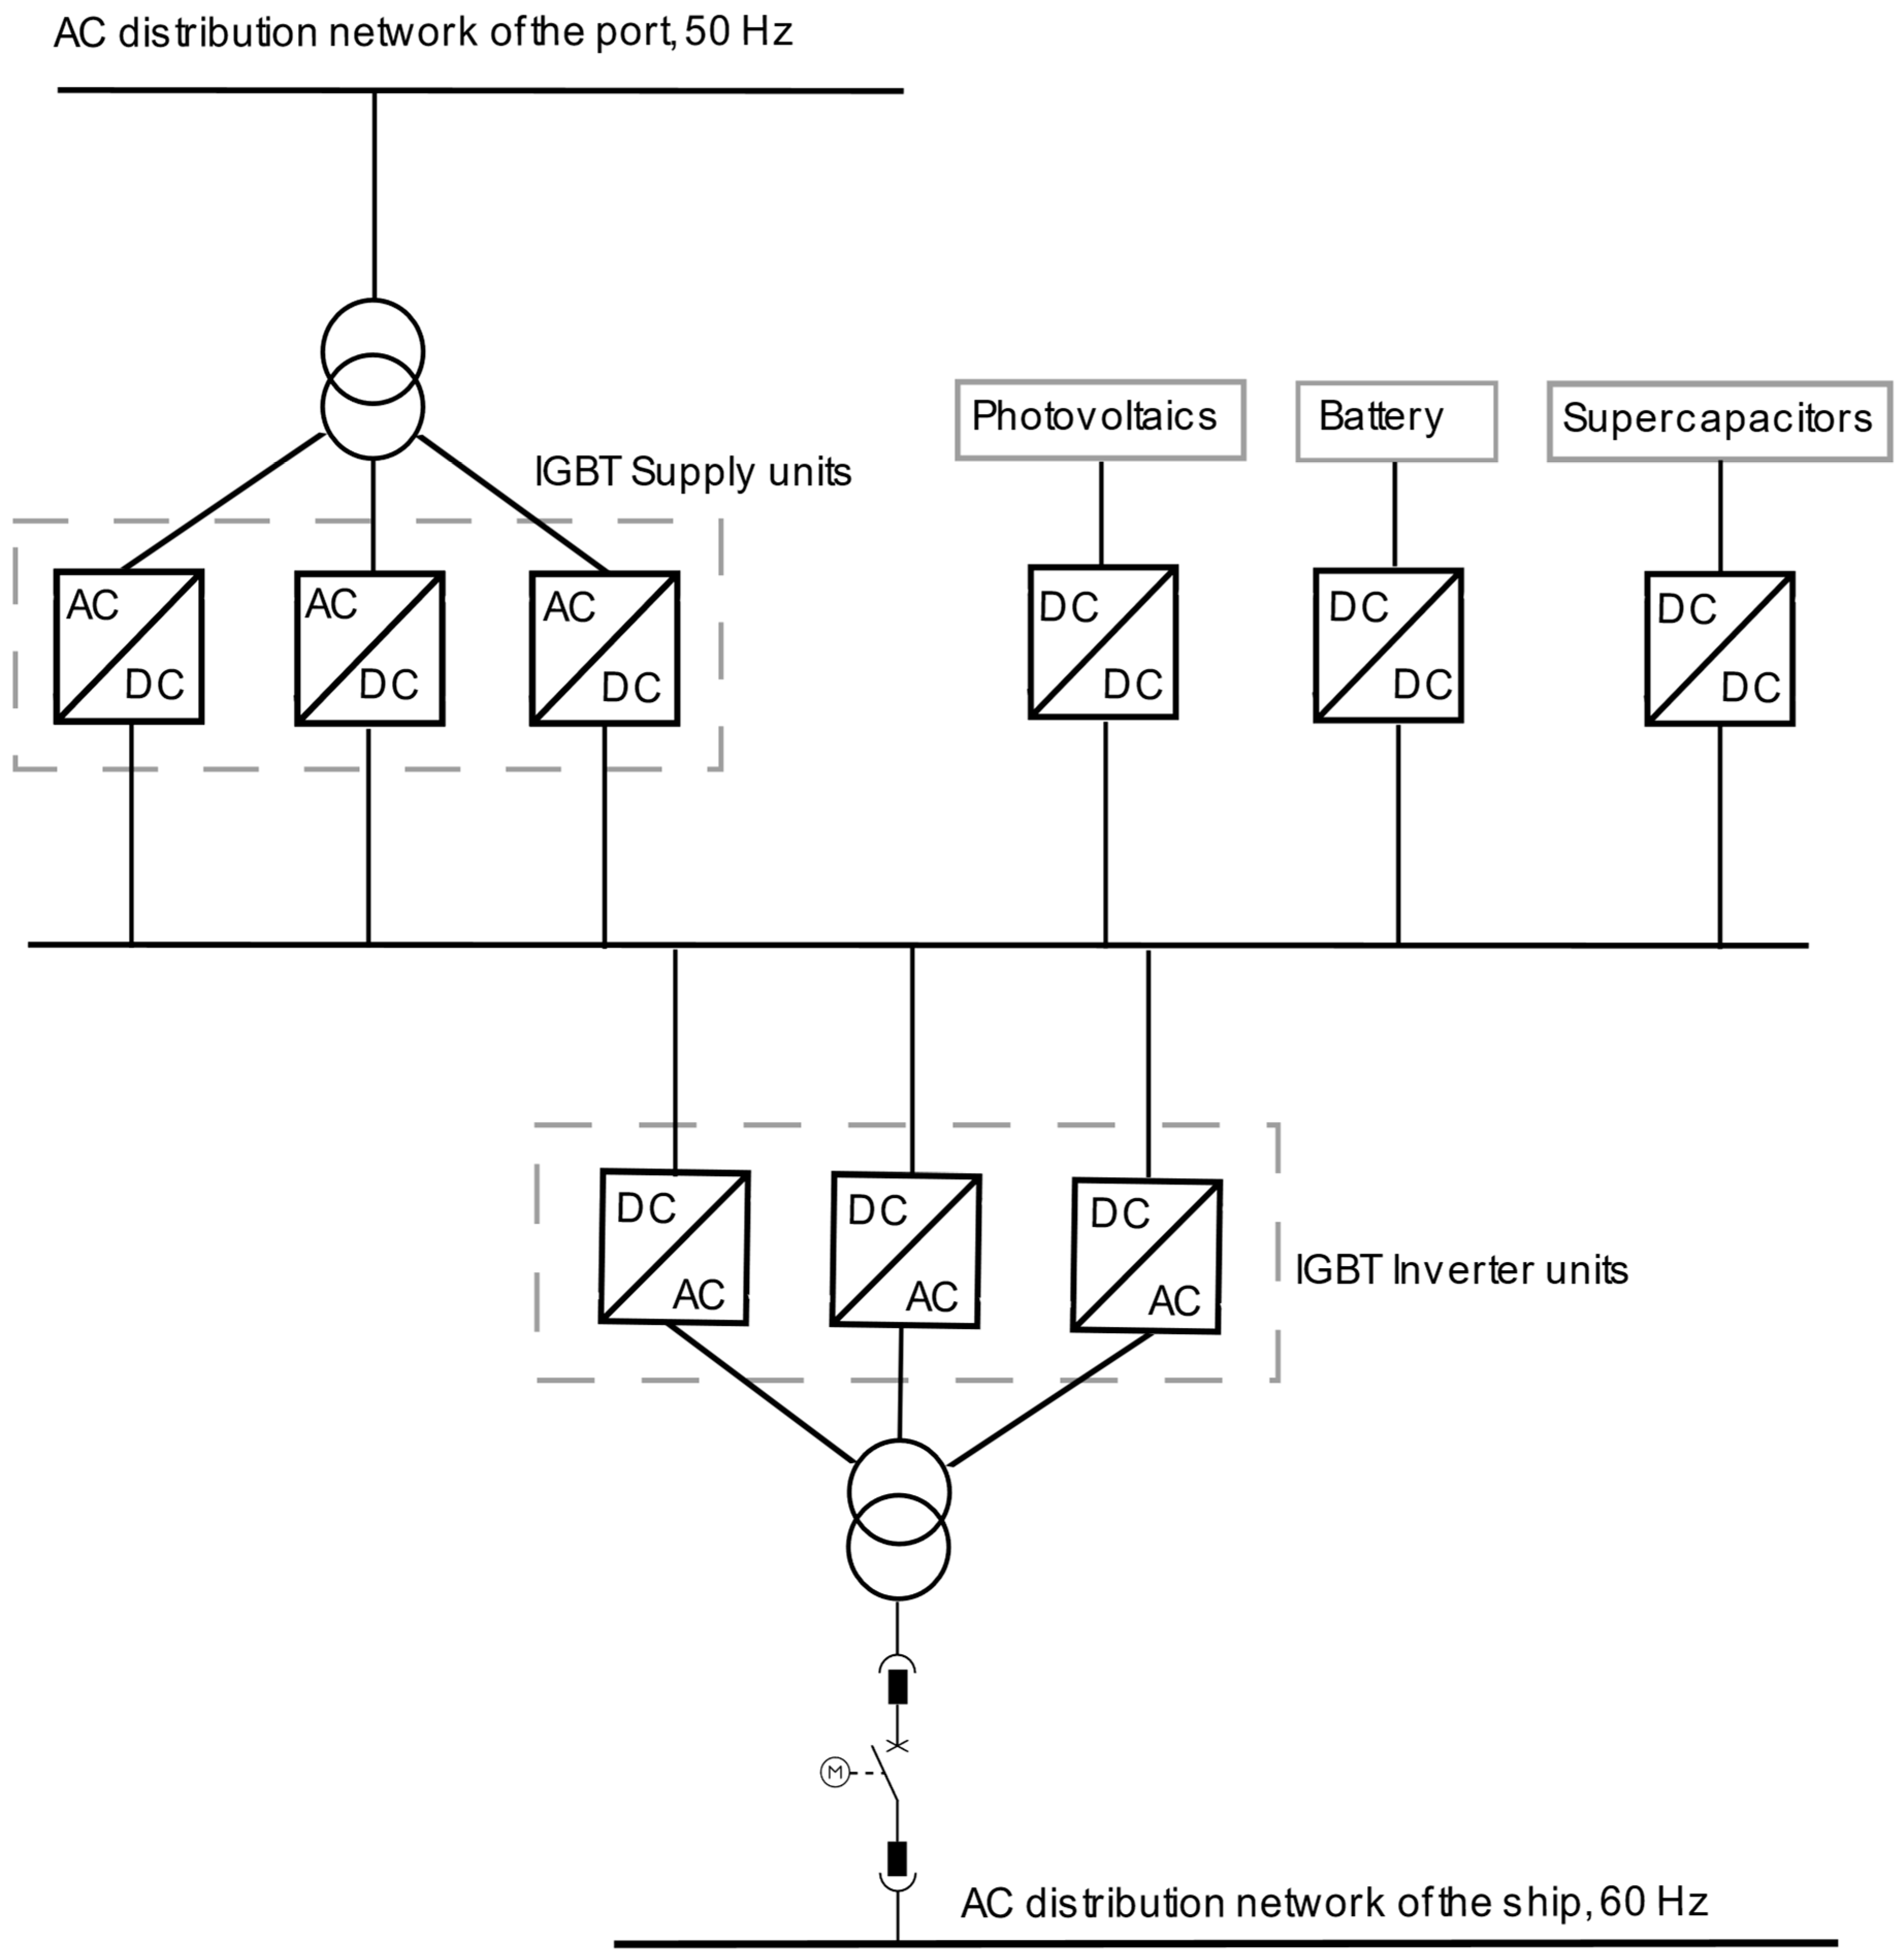
This article is focused on the use of droop-controlled grid-forming low-voltage IGBT frequency converters that are installed in the port substation. The simulation model was created specifically for the ACS880 SFC frequency converter.
Comparative analysis of conventional static frequency converters and the proposed solution was conducted (see
Table 1) for power outputs below 1 MVA and over 1 MVA [
20,
25].
1.3. Voltage Drop Evaluation
The literature related to droop control and voltage drop calculations during shore connection was studied. There exist only few papers on this topic. According to international standards and high-voltage shore supply quality requirements, the steady-state voltage drop shall not exceed −3.5% of nominal voltage [
26]. Important factors that influence voltage drop are power factor, cable length, cable size, and power load. Lower power factor, smaller cable size, larger cable length, and larger power load mean higher voltage drop. According to the measurement in the real port with a 11.4/6.6 kV transformer; 1200 kW load; 0.88 power factor; and cable length of 568 m, the average voltage drop during shore connection was approximately 1.2% [
27]. Calculations provided very similar results [
27]. Calculations were then made for power loads of up to 8000 kW, cable lengths of up to 2000 m, and a power factor of up to 0.45. The results show that there is a possibility of overcoming the allowed voltage drop in case of a high power load, a long cable length, and a low power factor [
27].
Reference [
28] describes shore connection control strategies based on an AC/DC/AC converter. Using rectification control with a double closed loop can effectively rectify the grid and keep the DC side voltage fluctuation small. Different control methods are used on the inverter side at different stages of the grid connection. Pre-synchronization control is applied before closing the circuit breaker to reduce the current surge during shore connection. The V/f control mode is switched to the sag control mode immediately after connection to the grid. After the onboard generator is decommissioned, the control mode is switched back to the V/f control mode. The proposed article shows results for frequency deviations, but no voltage deviation results are available.
The literature about shore connection is lacking articles about dynamic values of voltage drop during transients. Connecting ferries and cruise ships to the port represents a large load for the port. Connecting and disconnecting such a load to the frequency converter in the port can cause significant voltage deviation. Therefore, it is necessary to verify whether this voltage deviation does not exceed the allowed values for a transient or permanent state. The objective of this work is to make a simulation model of the harbor network and simulate three events: connection of the load to the frequency converters; connection of onboard generators with load transfer; and disconnection of the load from frequency converters. All three events are investigated for three types of ships: 11 kV ferry, 6.6 kV cruise ship, and 11 kV cruise ship.
2. Description of Shore Connection System without Frequency Converter
Large cargo and cruise ships (with power input >500 kW) use high voltage for electricity distribution (see
Table 2) [
11,
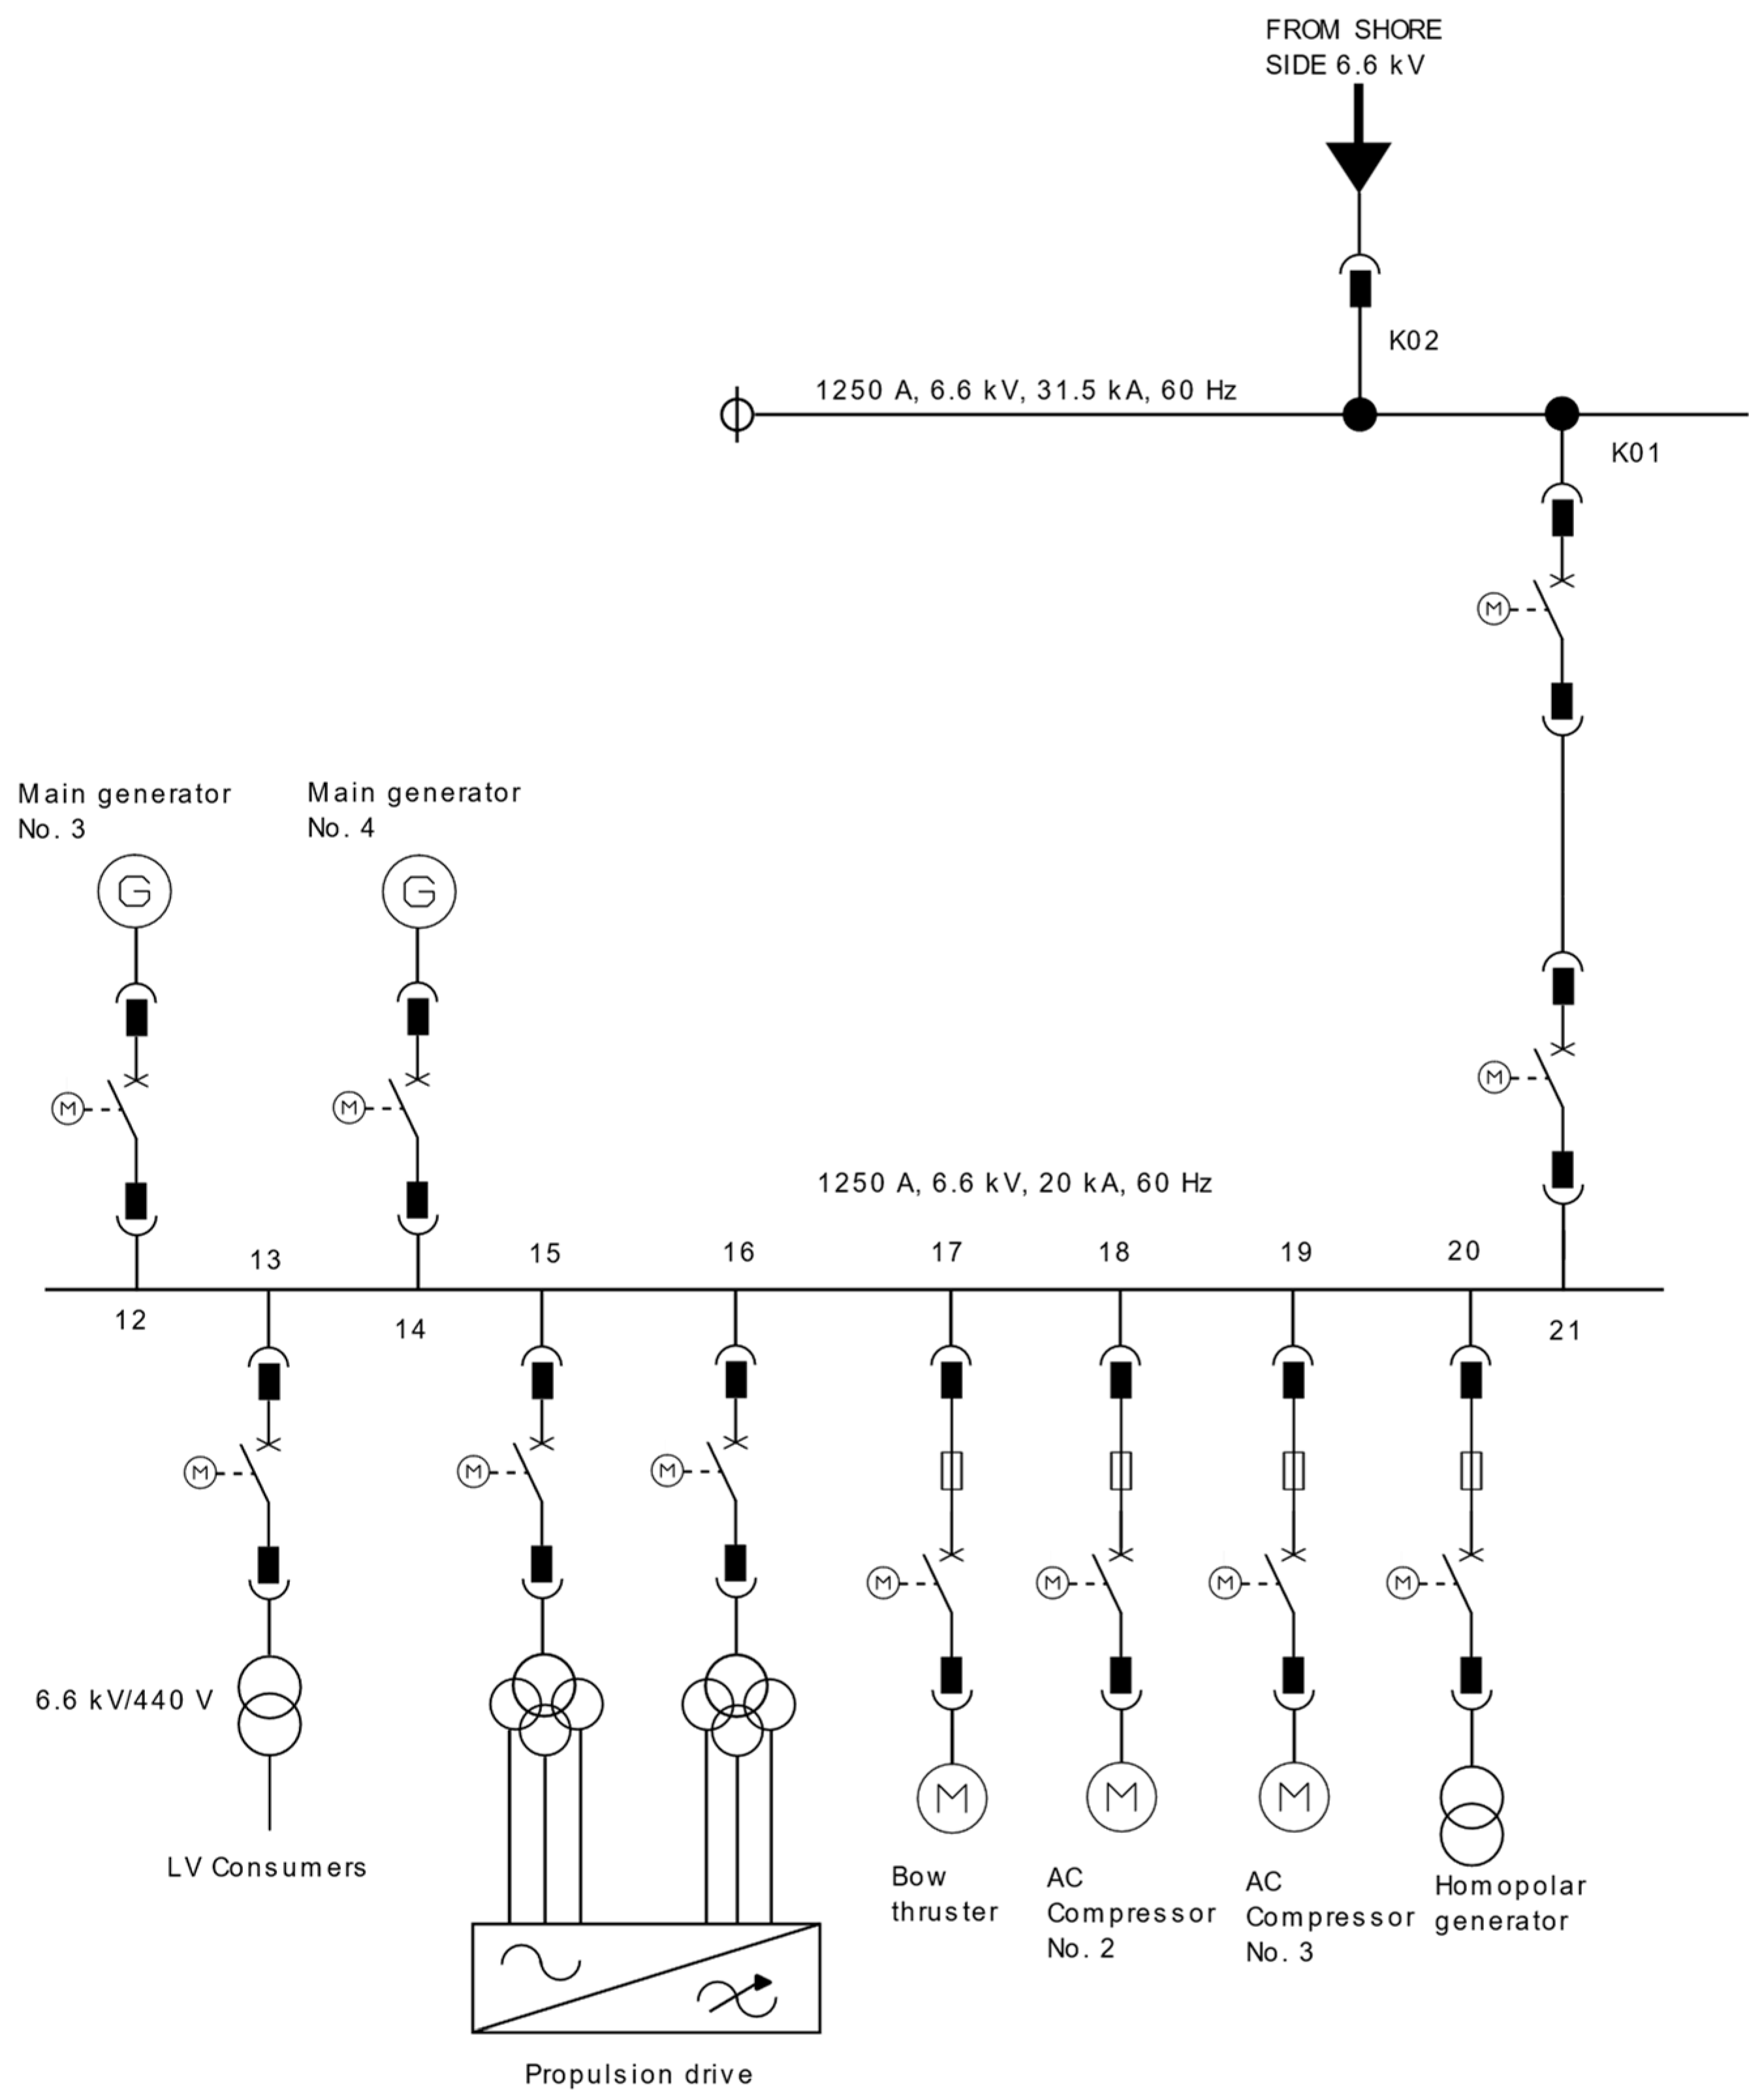
13]. The production of high-voltage electricity is most often provided by diesel-engine generators or gas-turbine generators. These generators are connected to the main switchboard, from which the compressors, bow thruster, low-voltage transformer, and propulsion transformers are supplied. The low-voltage transformer supplies low-voltage electrical consumers. The propulsion transformers supply the propulsion of the ship. In
Figure 1, the single line diagram of the main switchboard is shown, which has a total of 21 cubicles (only half of them are shown).
A total of 20 cubicles serve as feeders for the above-mentioned technologies. An additional cubicle must be added to this switchboard for shore connection (cubicle 21 in
Figure 1). This cubicle contains the circuit breaker “B”, which is one of the two circuit breakers between the ship’s main switchboard and the port.
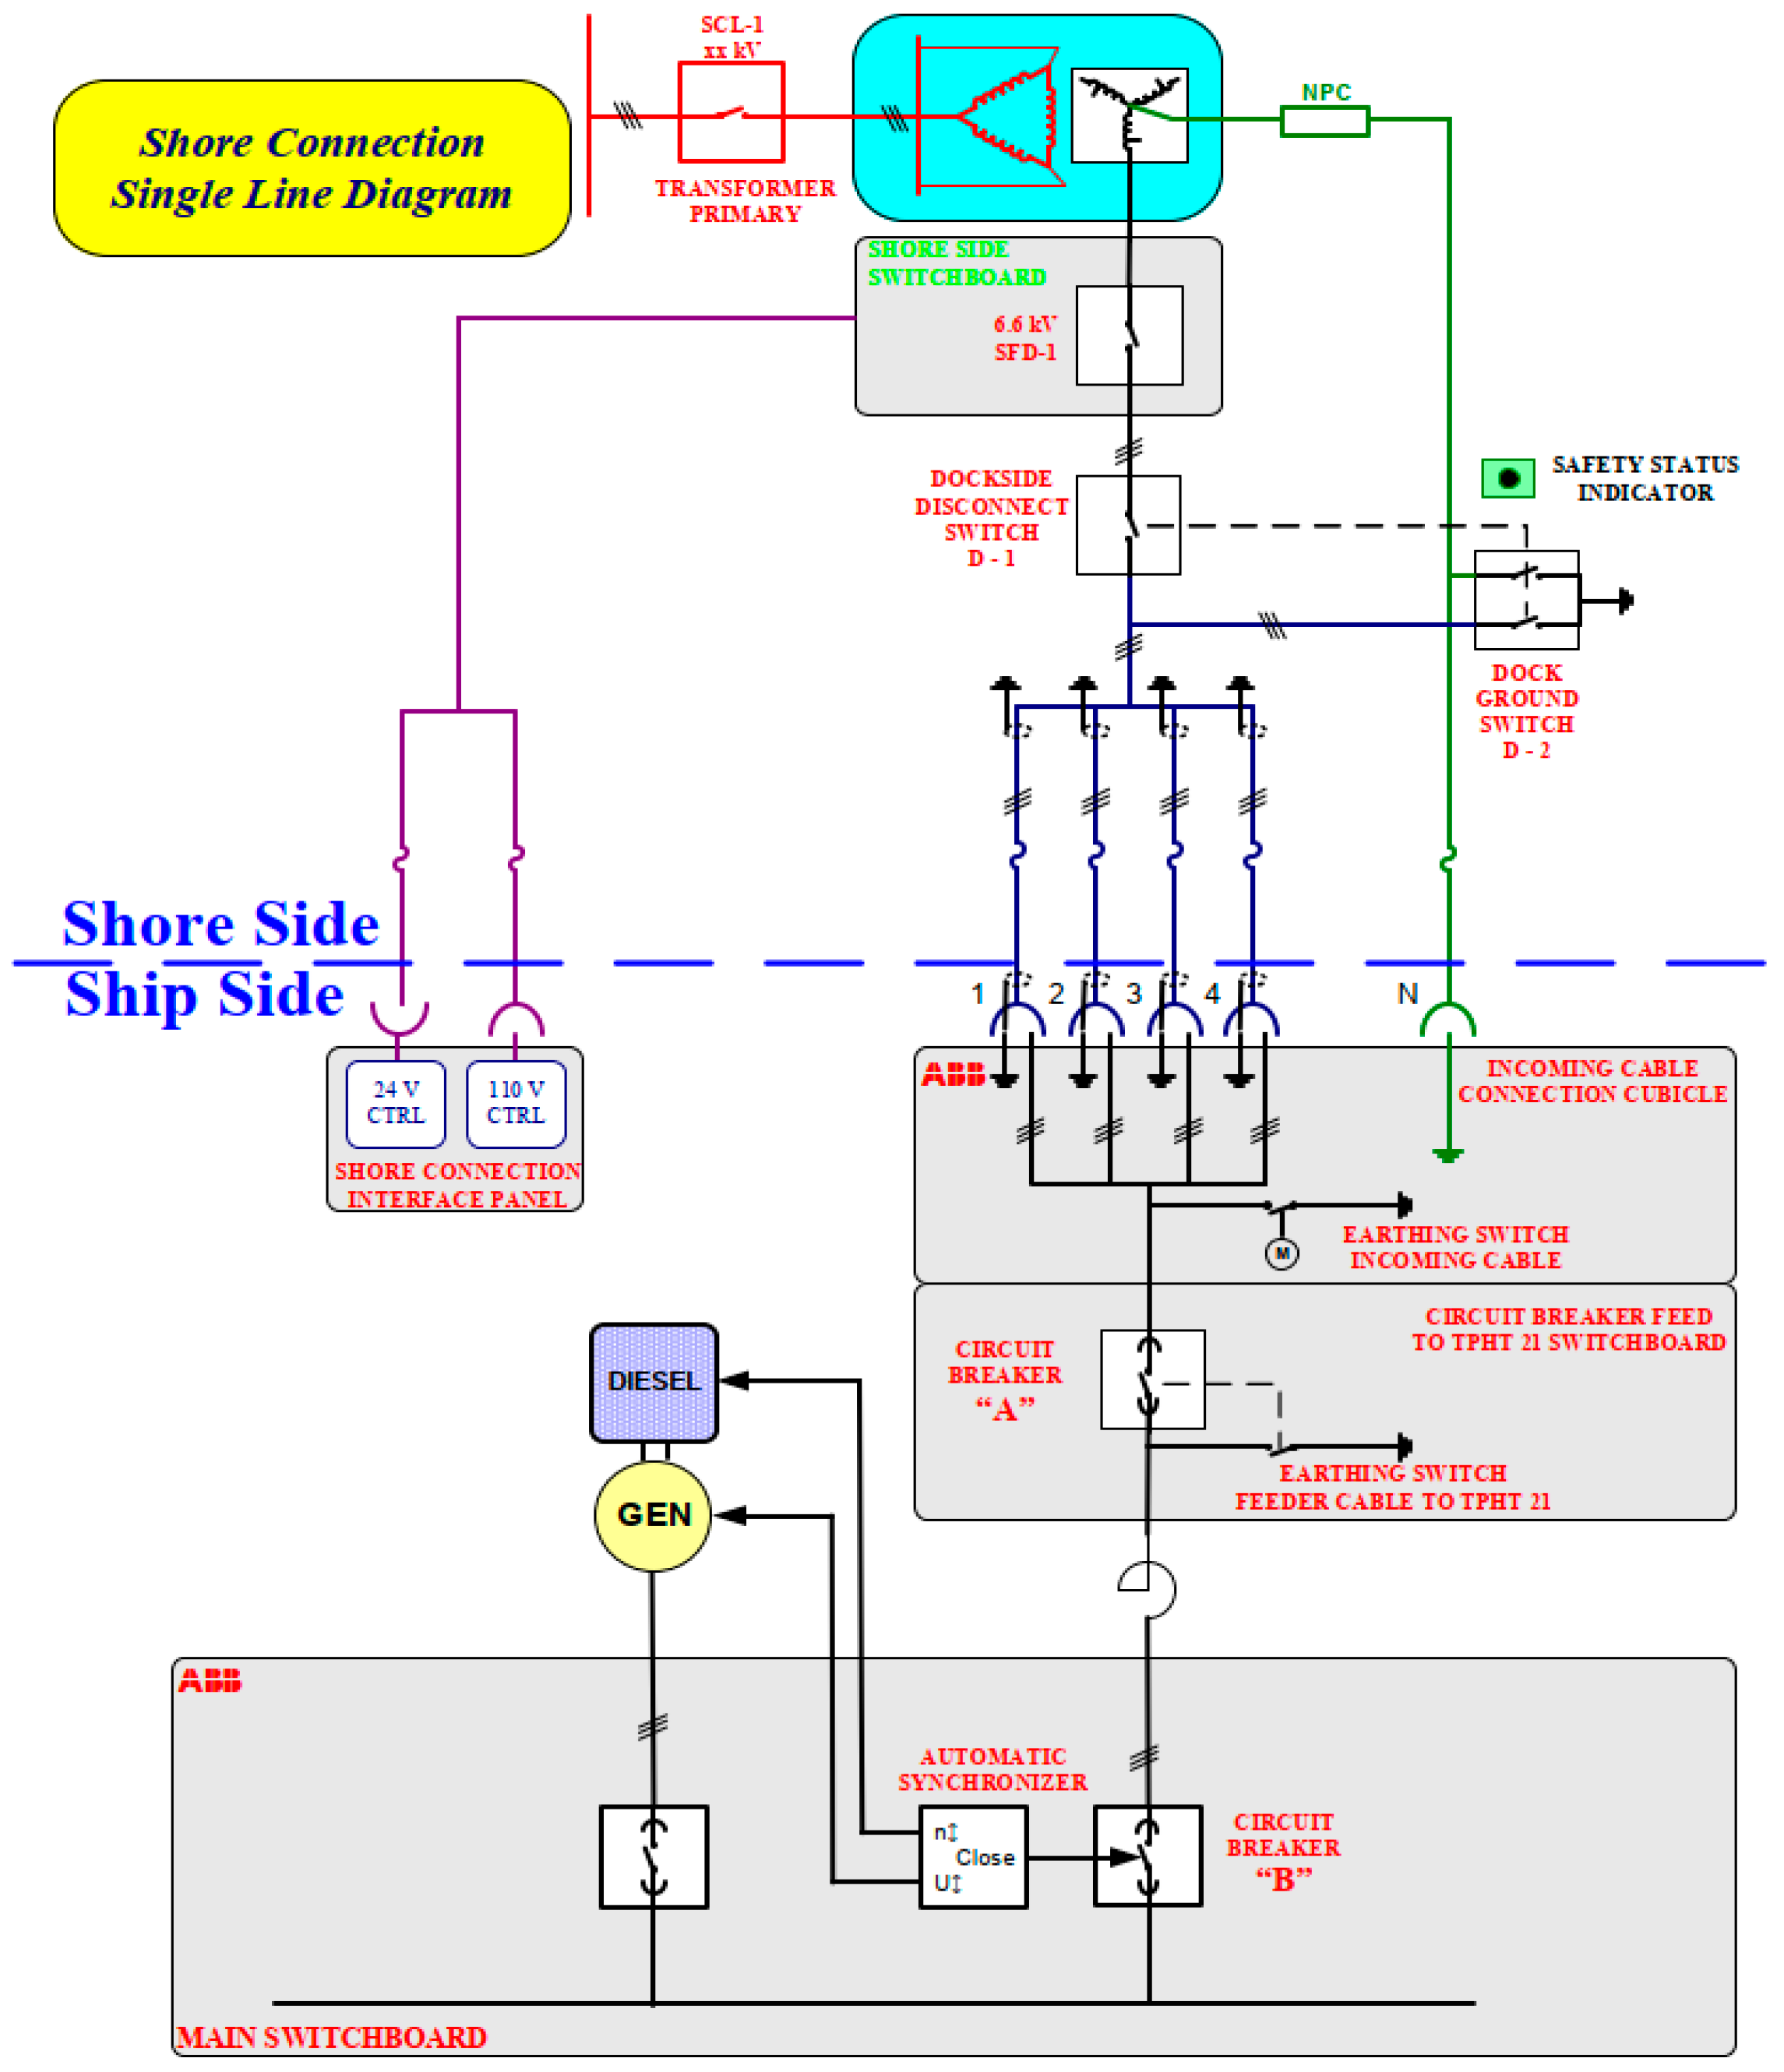
It is also necessary to install the shore connection switchboard on the ship. It usually has two cubicles (K01 and K02 in
Figure 1). The first cubicle (referred to as the incoming cable connection cubicle in
Figure 2) contains plugs for connecting cables from the port and an earthing switch. The second cubicle contains the high-voltage circuit breaker “A”, the terminals for connecting the cable that further leads to the main switchboard, and the earthing switch of this cable.
The main switchboard must also be extended by an automatic synchronizer, which, in cooperation with the automatic voltage regulator, regulates the generator so that it can be phased with the shore distribution network. The automatic voltage regulator must be connected to input signals to obtain information on the mode of the ship and whether the ship network has already been phased to the port distribution network.
The changes also affect the regulators of individual ship propulsions. Before connecting to the port, electricity consumption must be regulated and reduced below a specified level, below which it must be maintained.
The shore connection interface panel (CIP) must be installed for communication with the port. Its main components are cards with digital and analog inputs and outputs. It is necessary to ensure communication between the port and the ship and between the main switchboard in the ship and the shore connection switchboard. The CIP is also used to ensure communication between equipment for regulating the ship’s generators and the control system. Two cables with two voltage levels (24 VDC and 110 VDC) lead from the port to the CIP. Some very important signals, such as permission to close (confirmation to the port that the ship is ready to be connected), are sent by signal wires in both cables. Both cables are first connected to the ship in the control socket panel, from which the individual wires are routed to the CIP.
Another added hardware is the cable tension device. This device measures the tension of the power supply cables to the ship. This is important in the event that the cable or ship starts moving unexpectedly when the ship is electrically connected to the port. The cable tension device operates in three stages. When the tension increases above the first stage level, it sends an alarm to the control system, which is a signal to the operator to go to check the cable. If the tension increases further, then after exceeding the second stage level, the ship generator is switched on with a delay of 10 s. When third-stage tension is exceeded, a command is sent to turn off the circuit breaker, and the ship is electrically disconnected from the port. This minimizes the risk of the supply cables to the ship being unexpectedly turned off, causing the entire ship to lose power.
When a frequency converter is not used, then it is sometimes necessary to limit the short-circuit current that could flow to the main switchboard in the event of a short circuit. The main switchboard can be designed for short-circuit currents lower than the transformer in the port. At the top of the single line diagram in
Figure 1, it can be seen that the busbar in the shore connection switchboard is rated for a short-circuit current of 31.5 kA, while the busbar of the main switchboard is rated for 20 kA. For these reasons, it is necessary to install a reactor between these two cabinets that limits the short-circuit current, as can be seen in
Figure 2. When using a frequency converter, the problem is the opposite, and it must be ensured that the frequency converter will provide enough short-circuit current for the proper function of protection devices. It can be quite a challenging task because some semiconductor technology does not allow overcurrent capability. The solution is either to oversize a converter or to operate more converters in parallel.
4. Materials and Methods
Power system study calculations were computed by means of digital planning software DigSILENT Power Factory 2021 SP 2, which is a power system analysis software for applications in generation, transmission, distribution, and industrial systems.
According to [
27], the resulting voltage drop can be calculated by the sum of voltage drops on individual components.
For power cables, the voltage drop can be calculated approximately with the following formula [
30]:
where
VDrop,Cable is the voltage drop for power cables;
I is the current of loads on ships when berthing (A);
φ is the angle of power factor for the load;
R and
X are the resistance (Ω) and reactance (Ω) of the power cables. For inductive load (most cases), “+” is used, and for capacitive load, “−” is used.
For the power transformer, the voltage drop can be calculated approximately with the following formula [
30]:
where
VDrop,Tr is the voltage drop for power transformers;
VTr2 is the rated voltage of secondary terminal of the transformer;
R% and
X% are the percent resistance (%) and reactance (%) of the transformer, respectively;
SLoad is the loading (kVA) of the transformer; and
Sn is the rated power (kVA) of the transformer.
The resulting voltage drop gives us useful information about adjusting the tap-changer position.
However, for the calculation of actual values of voltage drop during droop control, a more complex approach is needed. The converter was modelled using the Static Generator model from the DIgSILENT PowerFactory library, which matches the ABB ACS880-207 frequency converter. The control chain of the frequency converter is based on the droop-controlled grid-forming converter model, which is defined in the DigSILENT Global library. The apparent output power of the ACS880-207-3080A-7 ISU is assumed to be limited by 2700 kVA. The converter operates in optimal grid control mode. Active and reactive power of the supplied grid are controlled by means of 1% P/f and Q/U droop.
Voltage regulation is implemented on the basis of the principle that reactive power contribution depends on the deviation in system voltage from the desired reference voltage value. This can be described mathematically by the following equation:
where Δ
V is the voltage error;
Vref is the reference voltage;
q is the measured reactive power;
mq is the droop gain; and
vmeas is the measured terminal voltage.
Frequency regulation is implemented on the basis of the principle that the difference between generated active power and load causes a deviation in the system frequency from the desired reference frequency. This can be described mathematically by the following equation:
where
fref is the reference frequency;
fmeas is the measured frequency;
ρ is the droop coefficient;
mp is the effective gain;
pset is the operating power set-point; and
preg is the active power reference. If the system frequency deviates from the reference frequency,
preg will change accordingly. In steady-state conditions,
preg will be equal to
pset.
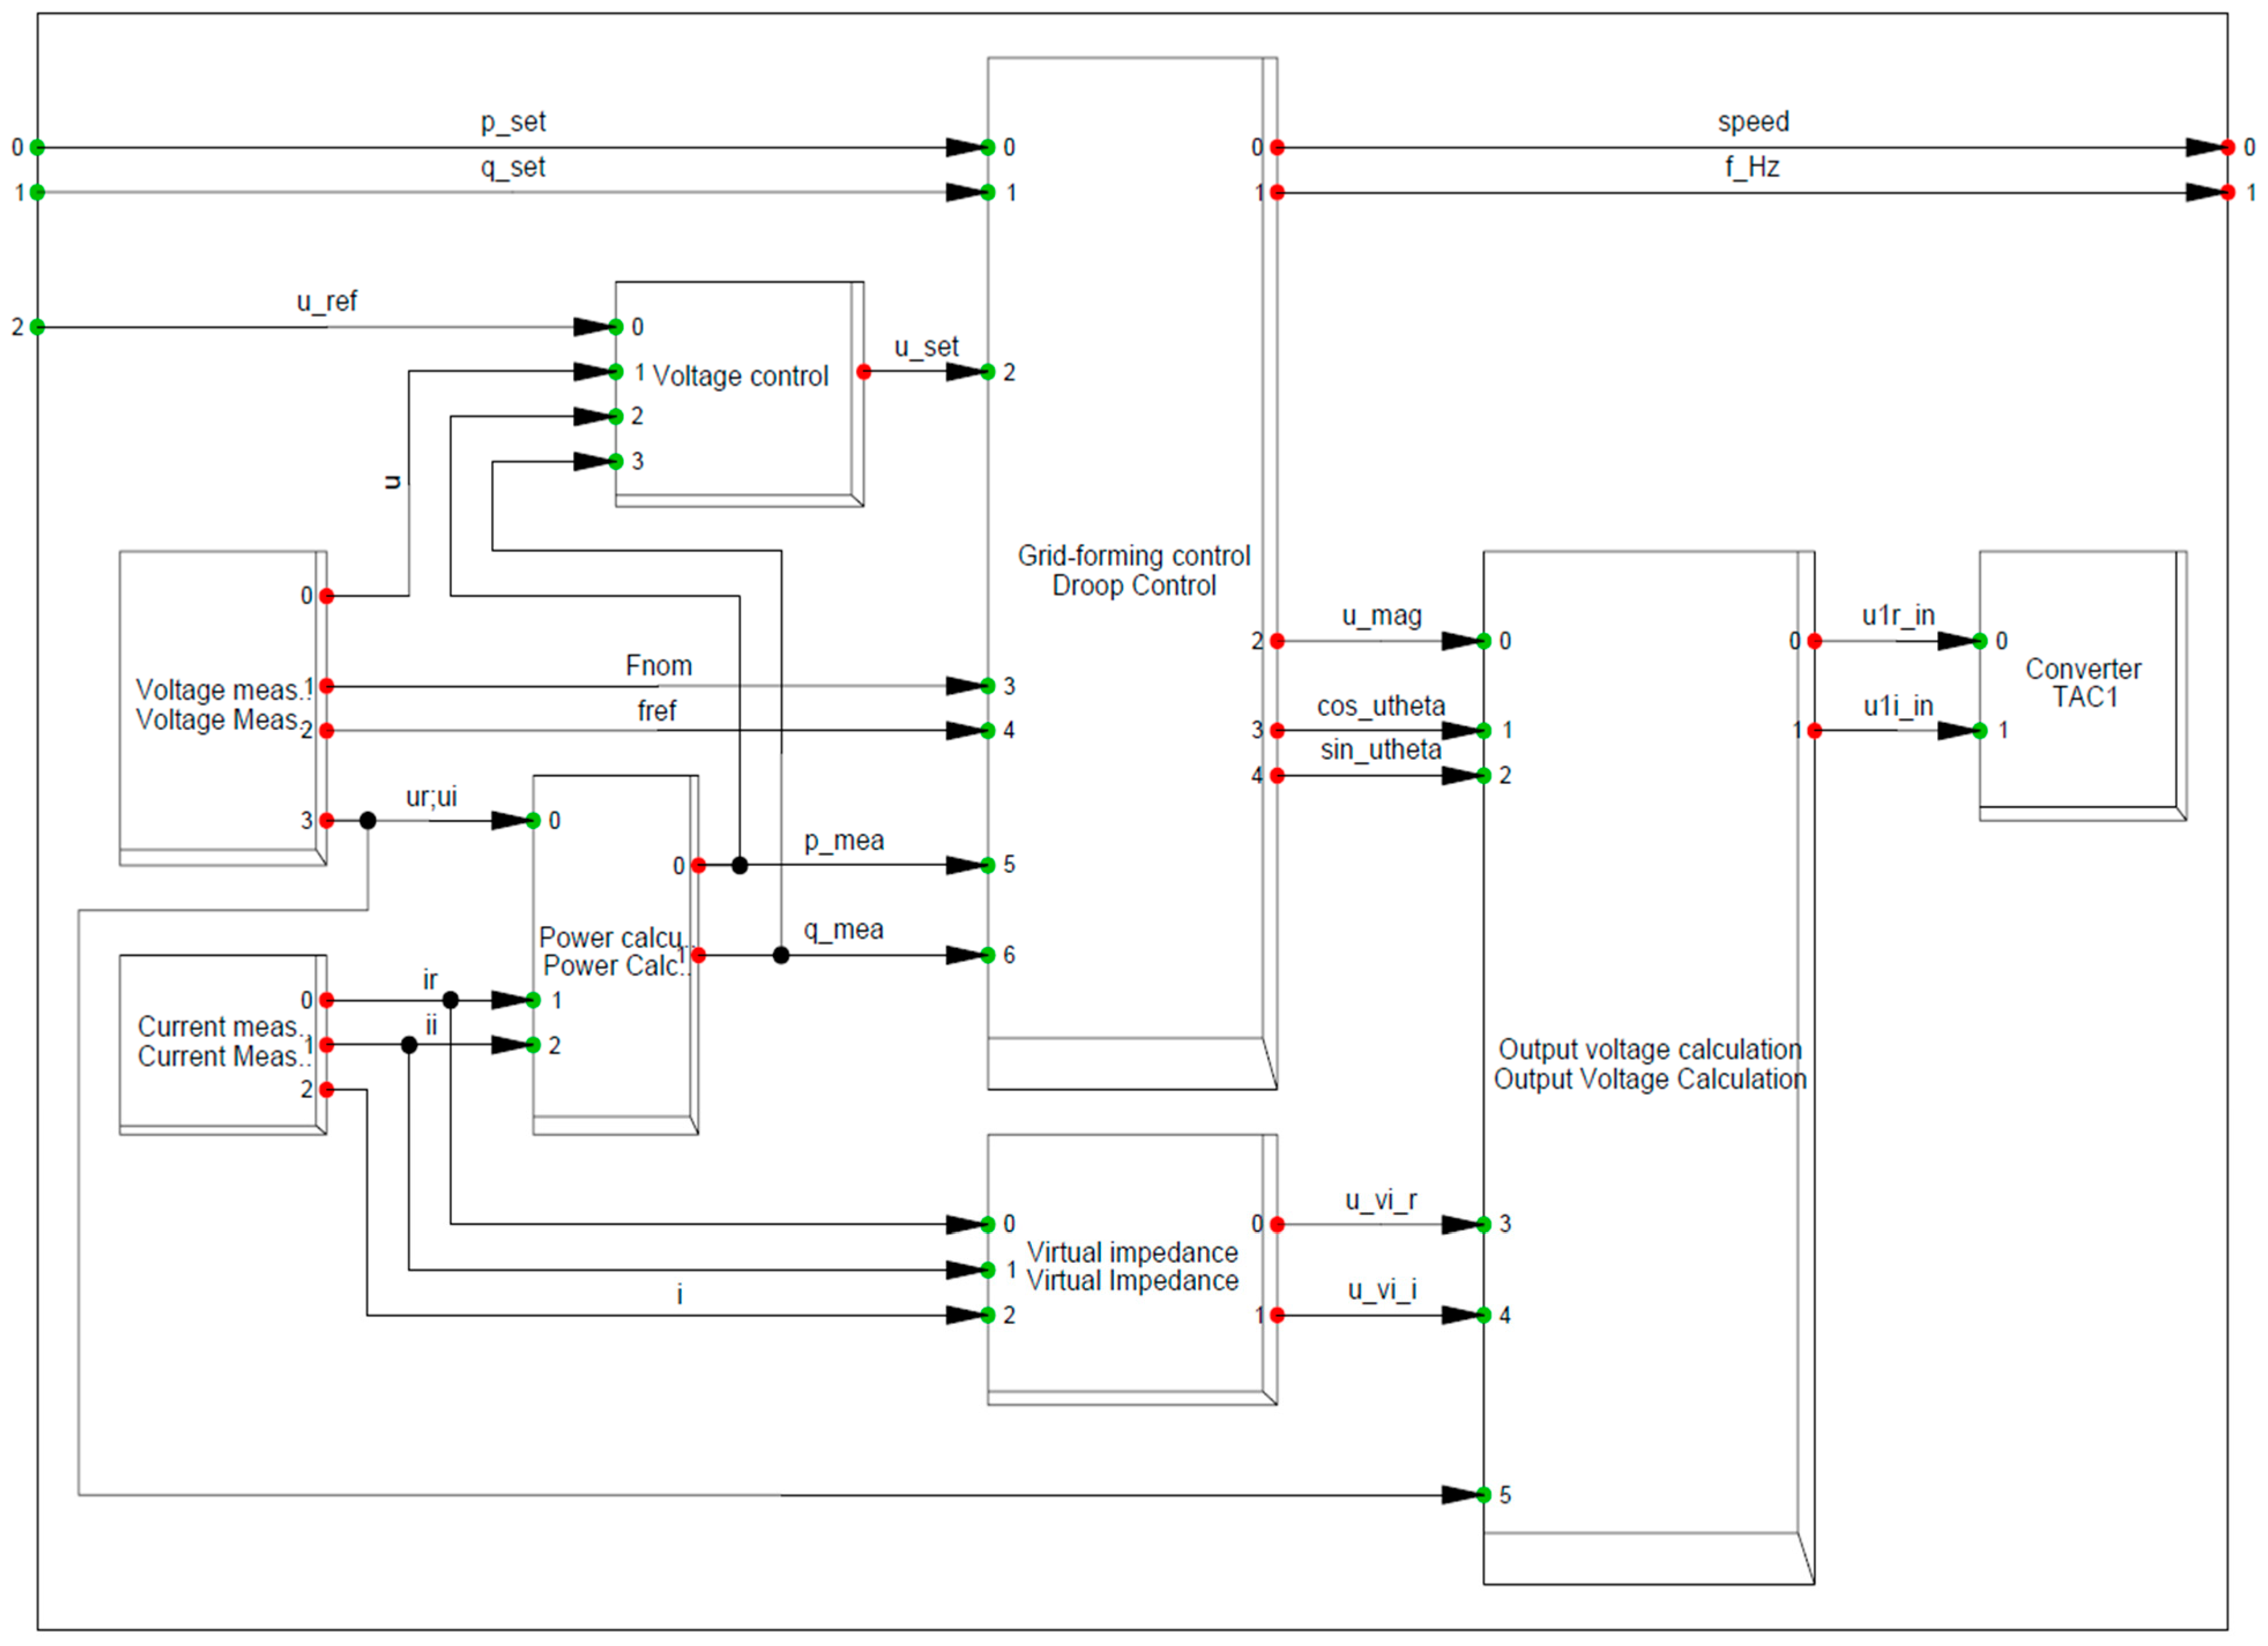
The used control diagram of the grid-forming converter is shown in
Figure 6. This diagram consists of individual blocks. There are three user inputs to these blocks: p_set, q_set, and u_ref. There are also two measurement blocks, which means that voltage and current must be measured. The power calculation block uses measured voltage and current for active and reactive power calculation, which are sent to the droop control block. The droop control block also receives information about the measured frequency from the voltage measurement block and the desired value of voltage from the voltage control block. The output voltage calculation block uses outputs from the droop control block and, in addition, outputs from the virtual impedance block. Virtual impedance is a way to alter the control of an inverter so that it appears as though an additional impedance is inserted between the inverter and the load in the physical circuit. This makes it possible to change the effective impedance between the inverter and the load. Finally, the output of the output voltage calculation block is connected to the converter.
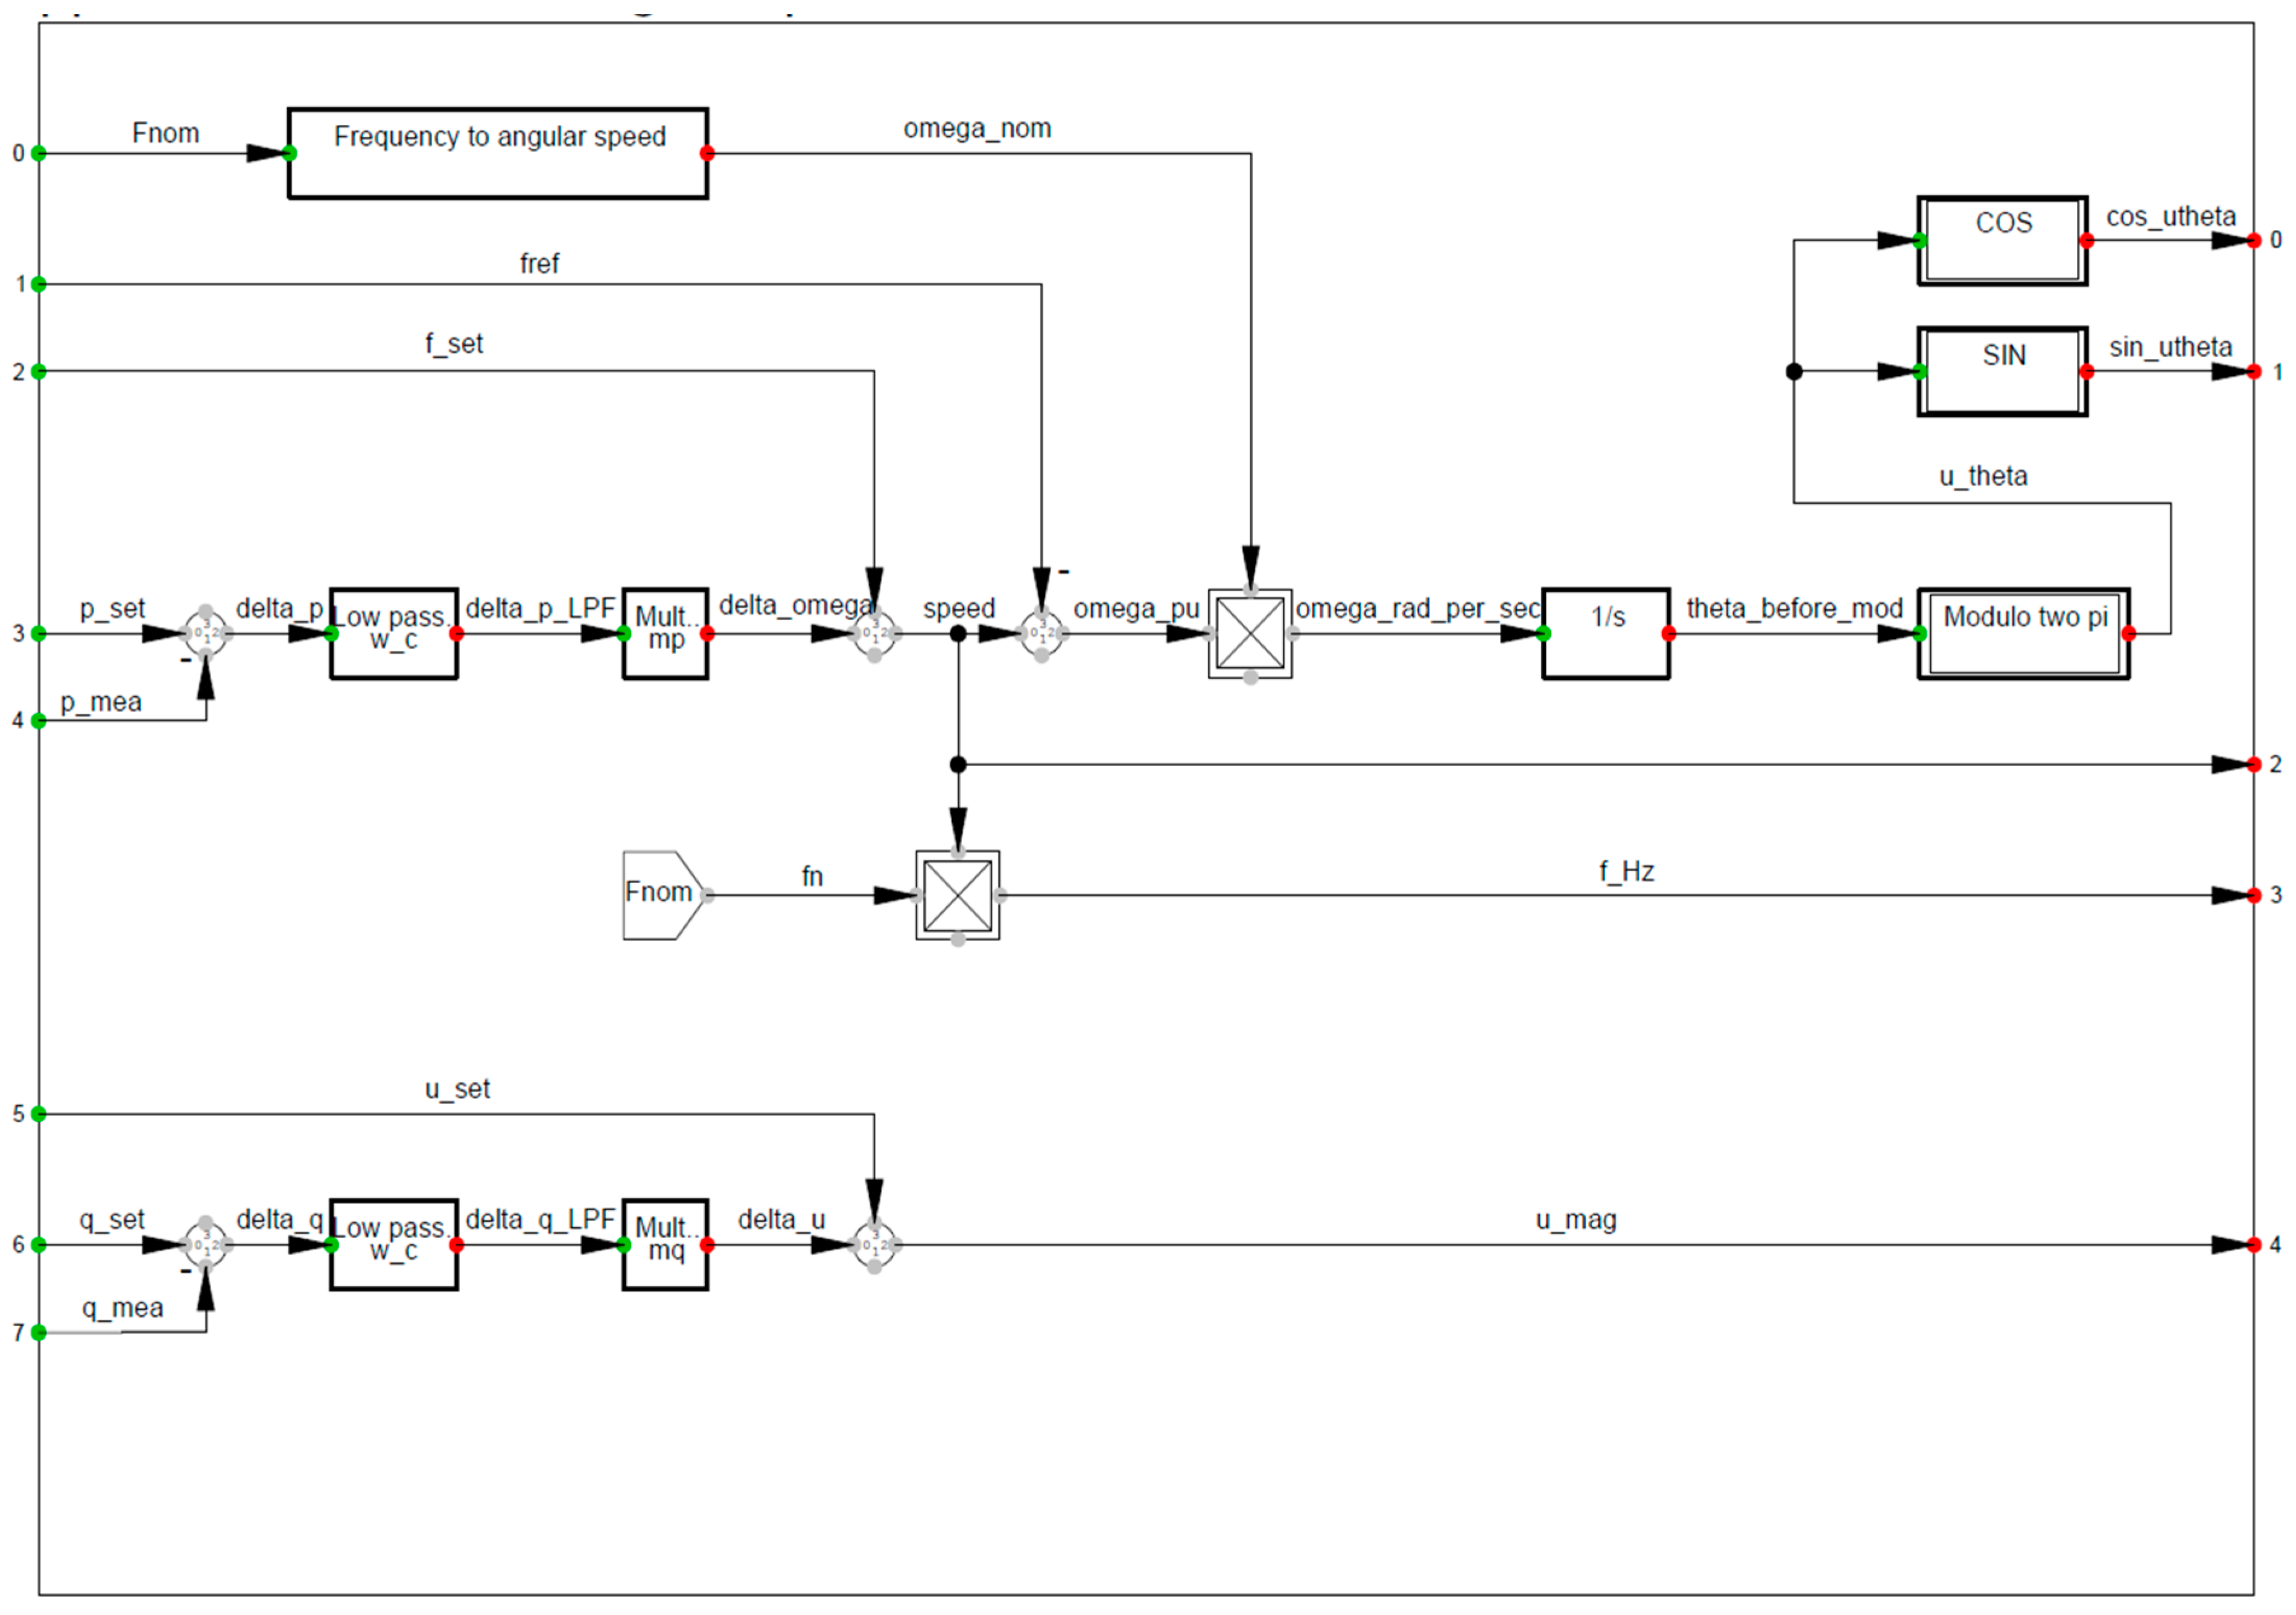
The function of the droop control block is shown in detail in
Figure 7. This diagram explains the calculation procedure of droop control loop.
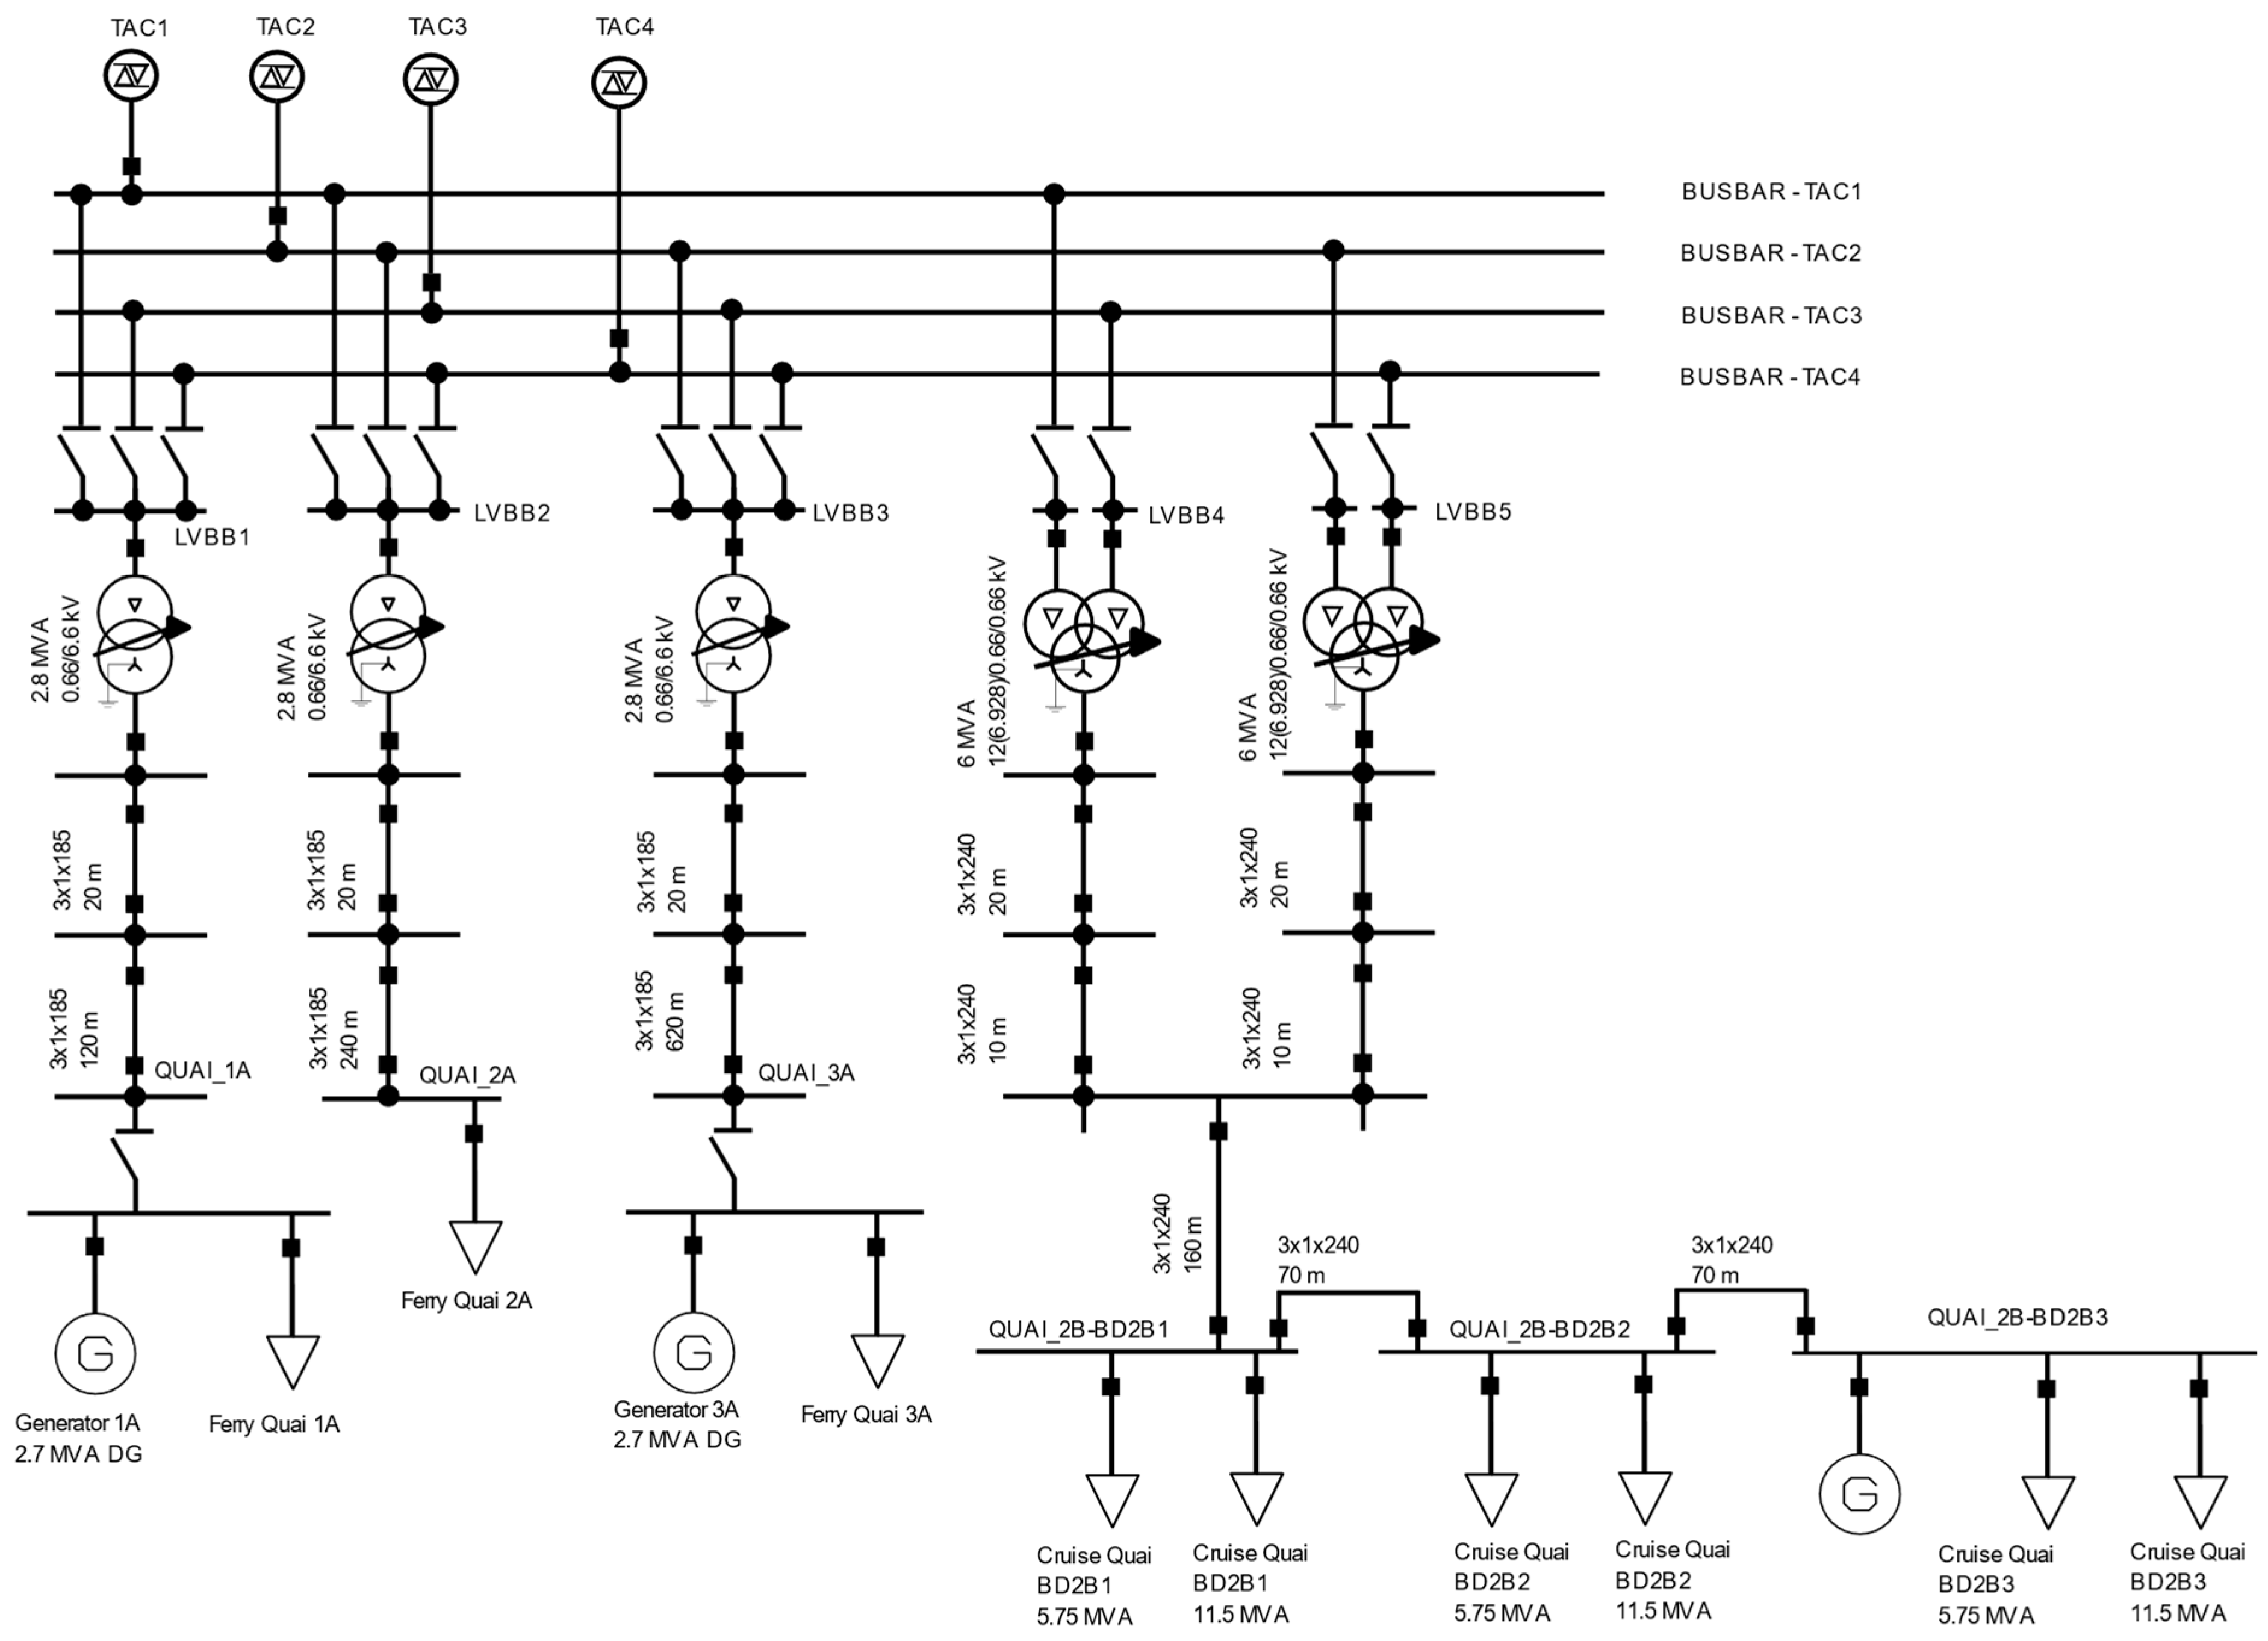
Based on the single line diagram of the distribution network of the port and the nominal values of the equipment, the network model was created using DigSILENT Power Factory 2021 SP-2 software (see
Appendix A). The network model contains the part from frequency converters to ship. This part consists of four identical frequency converters, converter busbars, three two-winding and two three-winding power transformers, cables between power transformer and quay, quay busbars, and two types of ship generators.
The transformer parameters are shown in
Table 3.
The parameters of the ship generators are shown in
Table 4.
5. Results and Discussion
Simulation was carried out using DigSILENT Power Factory 2021 SP 2. The simulation step size in the range of 0.2 to 0.5 ms was used, which is enough for the calculation of electromechanical transients. Used simulation parameters are shown in
Table 5.
First, a steady-state voltage drop was calculated to define the tap-changer position of the secondary windings of transformers. The voltage drop during transient events was then calculated.
The voltage drop was calculated for three events:
Connection of the load to the frequency converters
Connection of onboard generators with load transfer
Disconnection of the load from frequency converters.
For every event, voltage drop was calculated for three types of ship:
11 kV ferry mode (2700 kVA, cosφ = 0.8)
11 kV cruise mode (11,500 kVA, cosφ = 0.8)
6.6 kV cruise mode (11,500 kVA, cosφ = 0.8).
The results for off-load tap-changer positions are as follows:
+5% for 11 kV ferry mode (2700 kVA)
+3.6% for 6.6 kV cruise mode (11,500 kVA)
+5% for 11 kV cruise mode (11,500 kVA).
During the simulation of 2700 kVA ferry operation, the most left branch (1A) of the shore network was active as can be seen in
Figure A1. Only one frequency converter was active. During the simulation of 11,500 kVA cruise operation, all four frequency converters and both three-winding transformers were active. Quai 2B-BD2B3 was used because it has the longest cable and therefore the worst results from all three cruise quays.
The voltage drop during transient events was calculated for both the low-voltage (top part of figures) and high-voltage (bottom part of the figures) part of the network. Maximum voltage drop/surge values are shown in
Table 6. LVBB refers to low-voltage busbar. QUAI_1A refers to high-voltage busbar in the ferry quay. QUAI_2B-BD2B3 refers to high-voltage busbar in the cruise quay.
- a.
Connection of the load to the frequency converters
Initially, when the onboard CB is open, there are no loads connected to the converter station. The frequency converter is operated at a 1 p.u. voltage level. The voltage level at ship connection terminals is equal to 1.05 p.u. in ferry operation mode and in cruise operation mode with 6.6 kV topology. In cruise operation mode with 11 kV topology, the voltage level at ship connection terminals equals to 1.036 p.u. After a period of 2 s, the onboard CB is closed, and the load is connected. When the load is connected to the conversion station, the voltage drops, and the droop control starts acting until a new steady state is reached. According to the simulation results, the new steady state is reached in 70–80 ms.
- i.
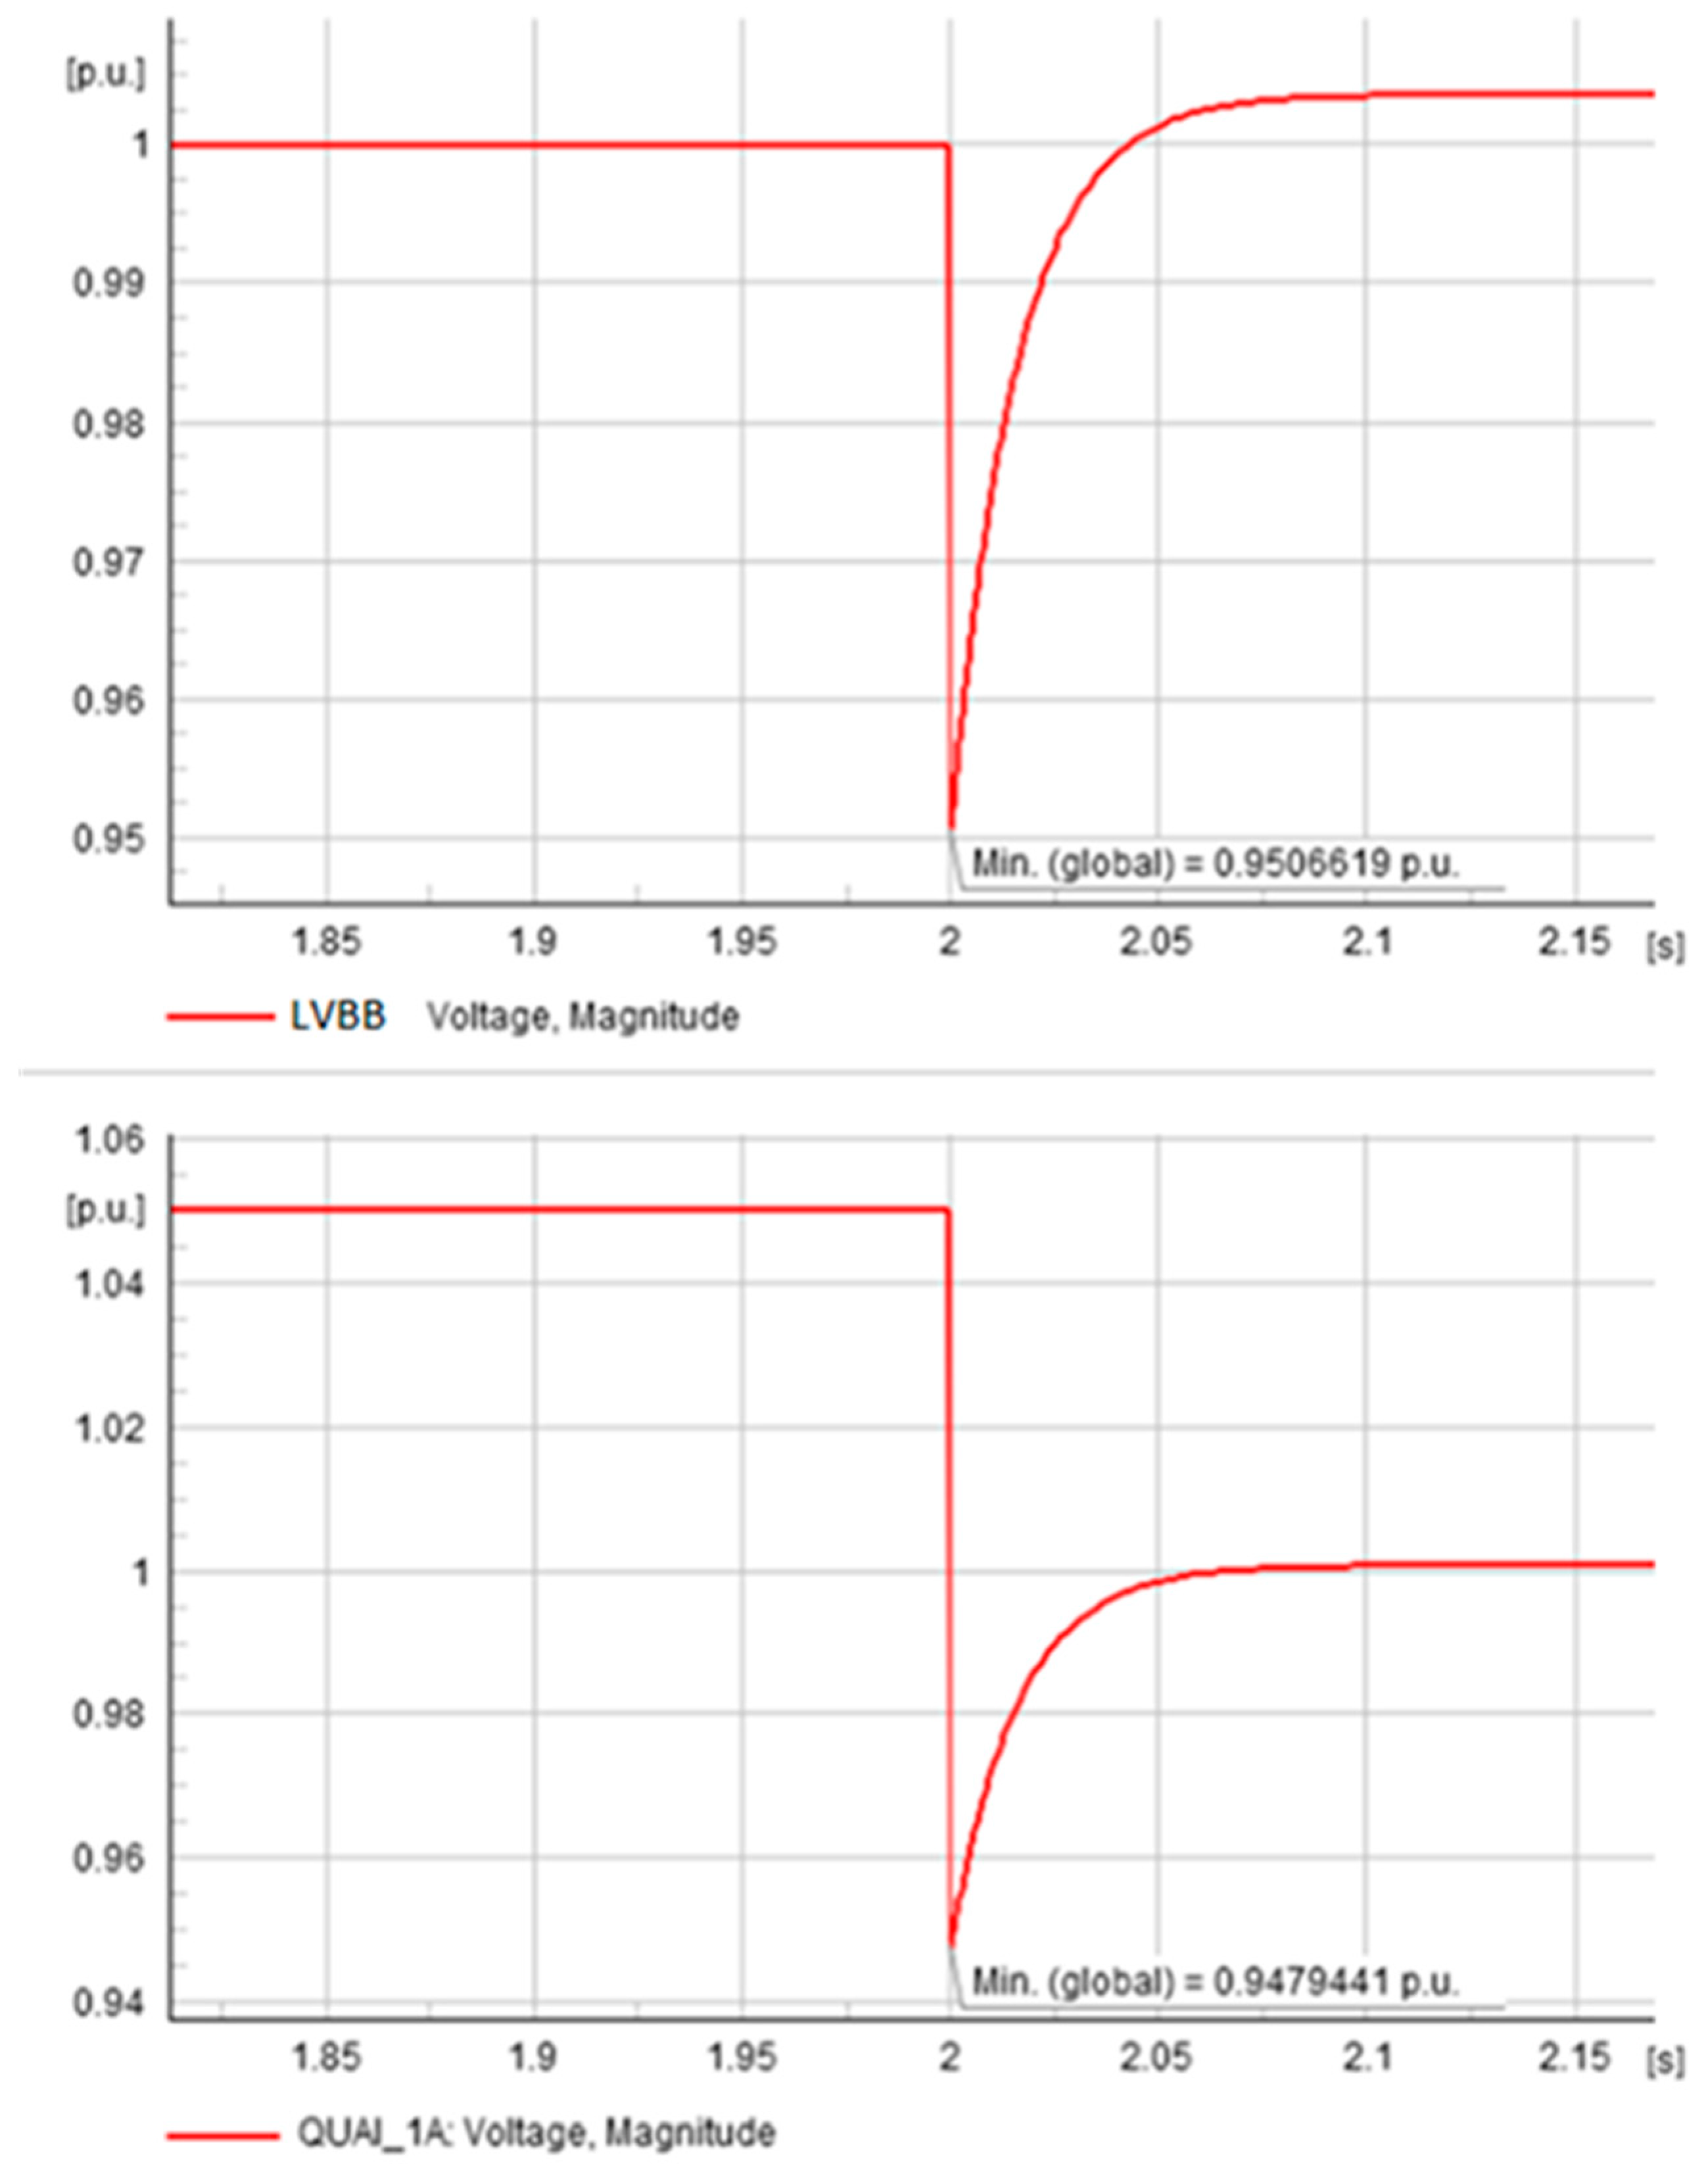
Connection of the load to frequency converters in 11 kV ferry mode
After the connection of the load voltage to the ship connection terminals, it drops to approximately 0.948 p.u. (see
Figure 8). When a transient process is finished, the voltage level during a new operation mode is established on a level equal to 1 p.u. at ship connection terminals. There is no exceeding of voltage limits observed.
- ii.
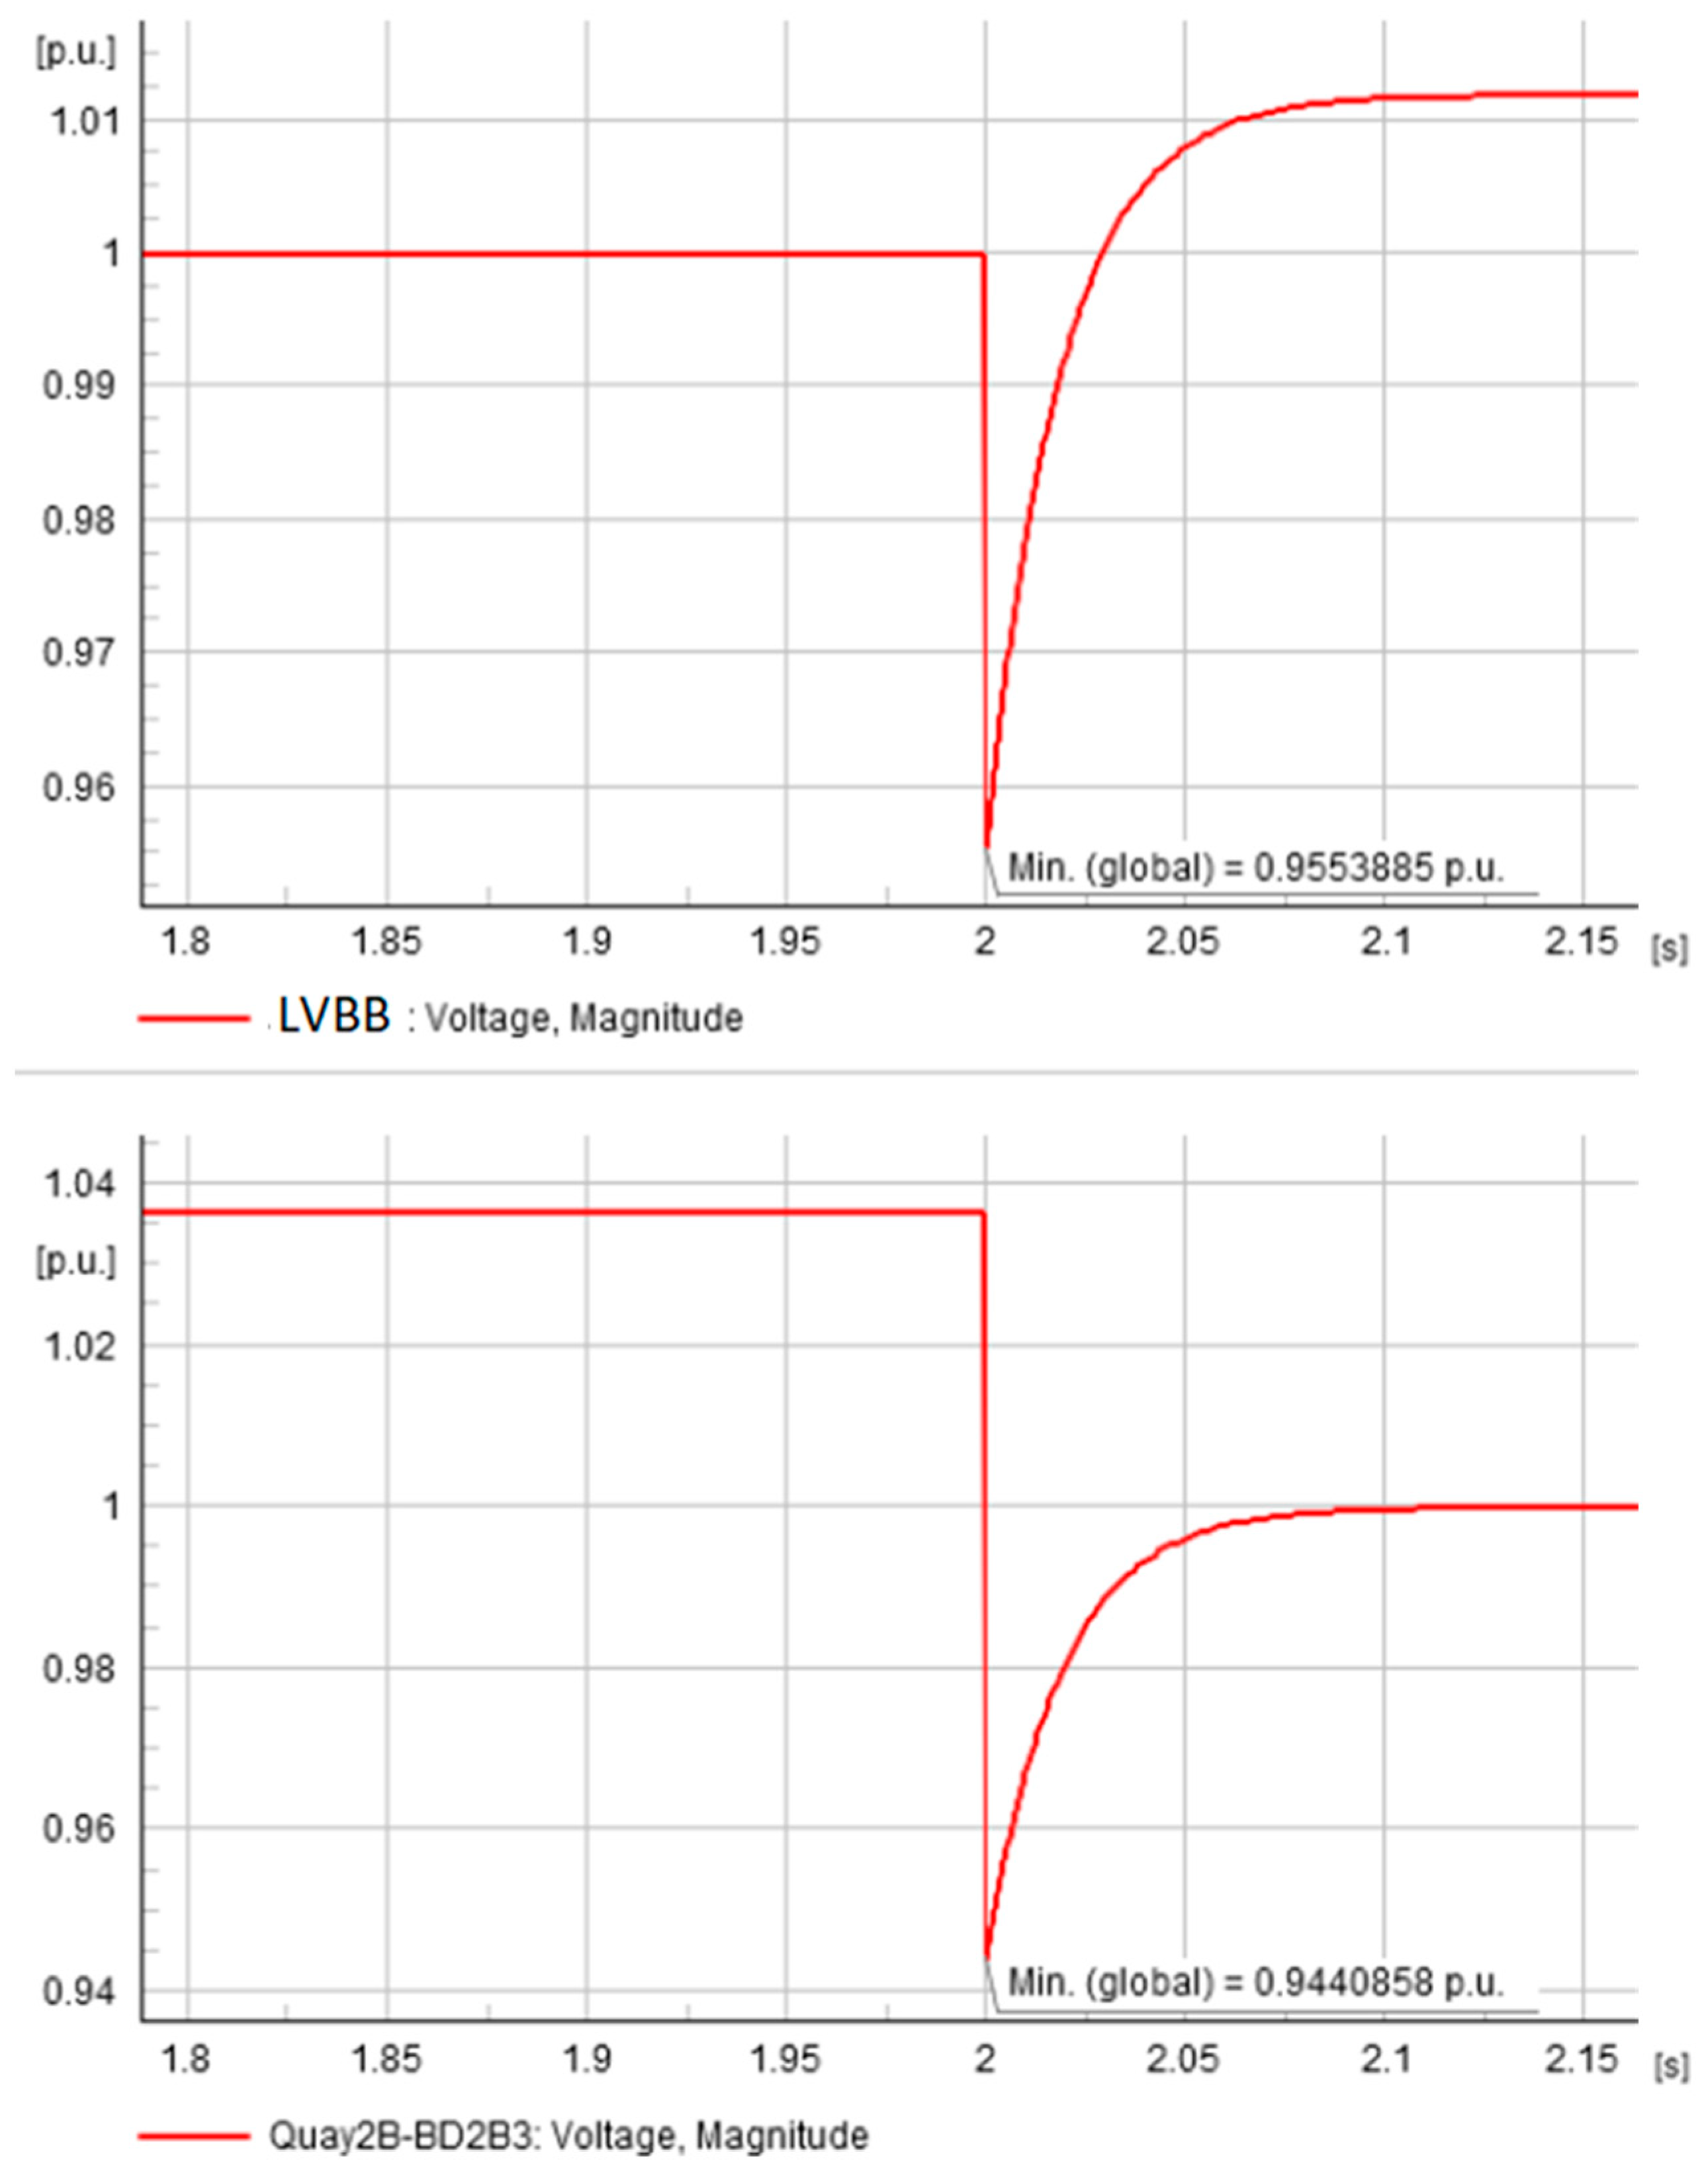
Connection of the load to frequency converter in 11 kV cruise operation mode
After connection of the load voltage at ship connection terminals, it drops to approximately 0.944 p.u. (see
Figure 9). When a transient process is finished, the voltage level during a new operation mode is established on a level equal to 1 p.u. at ship connection terminals. There is no exceeding of voltage limits observed.
- iii.
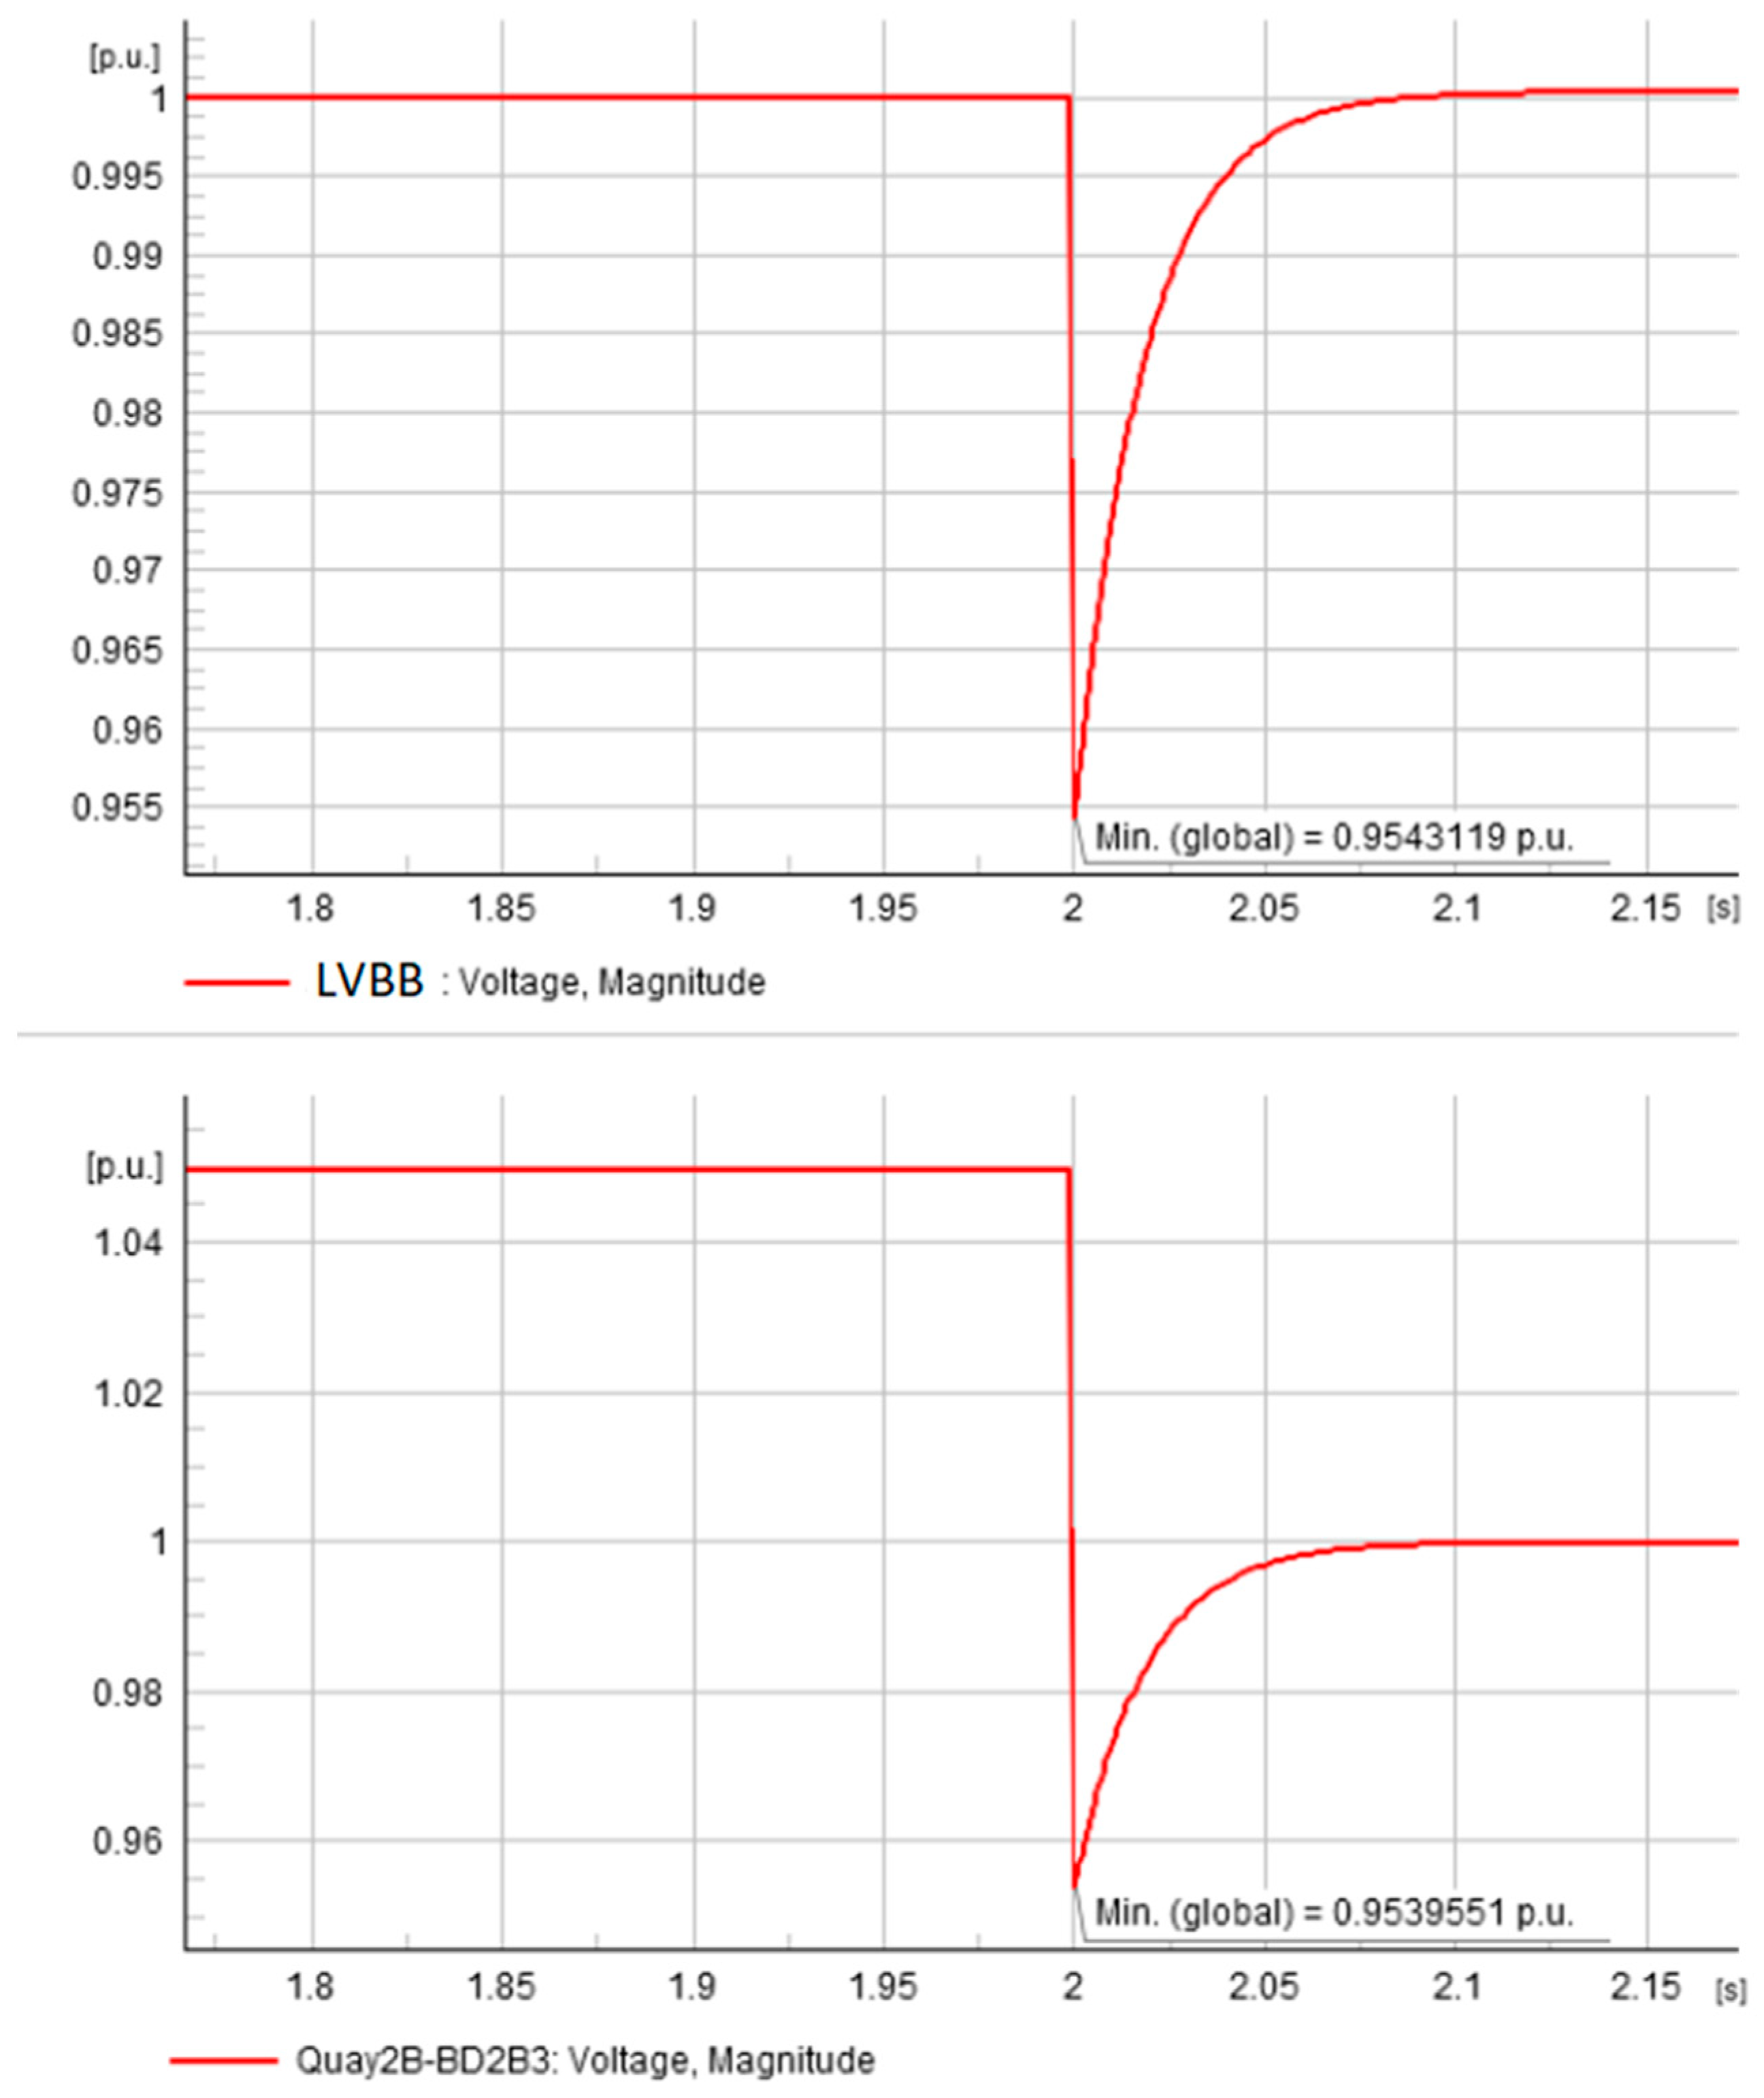
Connection of the load to frequency converter in 6.6 kV cruise operation mode
After the connection of the load voltage to the ship connection terminals, it drops to approximately 0.954 p.u. (see
Figure 10). When a transient process is finished, the voltage level during a new operation mode is established on a level equal to 1 p.u. at ship connection terminals. There is no exceeding of voltage limits observed.
- b.
Connection of onboard generators with load transfer
In this chapter, simulation results of voltage deviations for load transfer events are provided.
Initially, when the onboard CB is open, the network consists of two isolated grids: from the frequency converter to the onboard CB and from the onboard CB to the vessel generators. It is assumed that the converter and generator are both operated on the same frequency and with the same voltage angle at the point of ship connection. At the same time, the operating voltage of the synchronous generator is 1 p.u., and hence, the voltage difference between the ship connection terminal and the operational voltage of the synchronous generator could exist, but according to simulation results, this voltage difference does not exceed 0.05 p.u.
In a period of 2 s, when the CB is closing, synchronization of the vessel generator with the frequency converter begins. Synchronization is usually followed by a voltage drop and synchronizing currents. For the simulations provided in this chapter, the closing of the CB is accompanied by a load transfer from the onboard generators to the frequency converters, which, in turn, makes the voltage drop even higher. The load transfer is characterized by step change of the power dispatched from the synchronous generator, which results in worst case results in terms of voltage drop.
After closing the onboard CB and after the load transfer from generators to converters, AVR (automatic voltage regulator) and PSS (power system stabilizers, if present) of generators start acting concurrently with droop control of the frequency converter to restore the voltage level and operated frequency of the network until the time when a new steady state is reached.
- i.
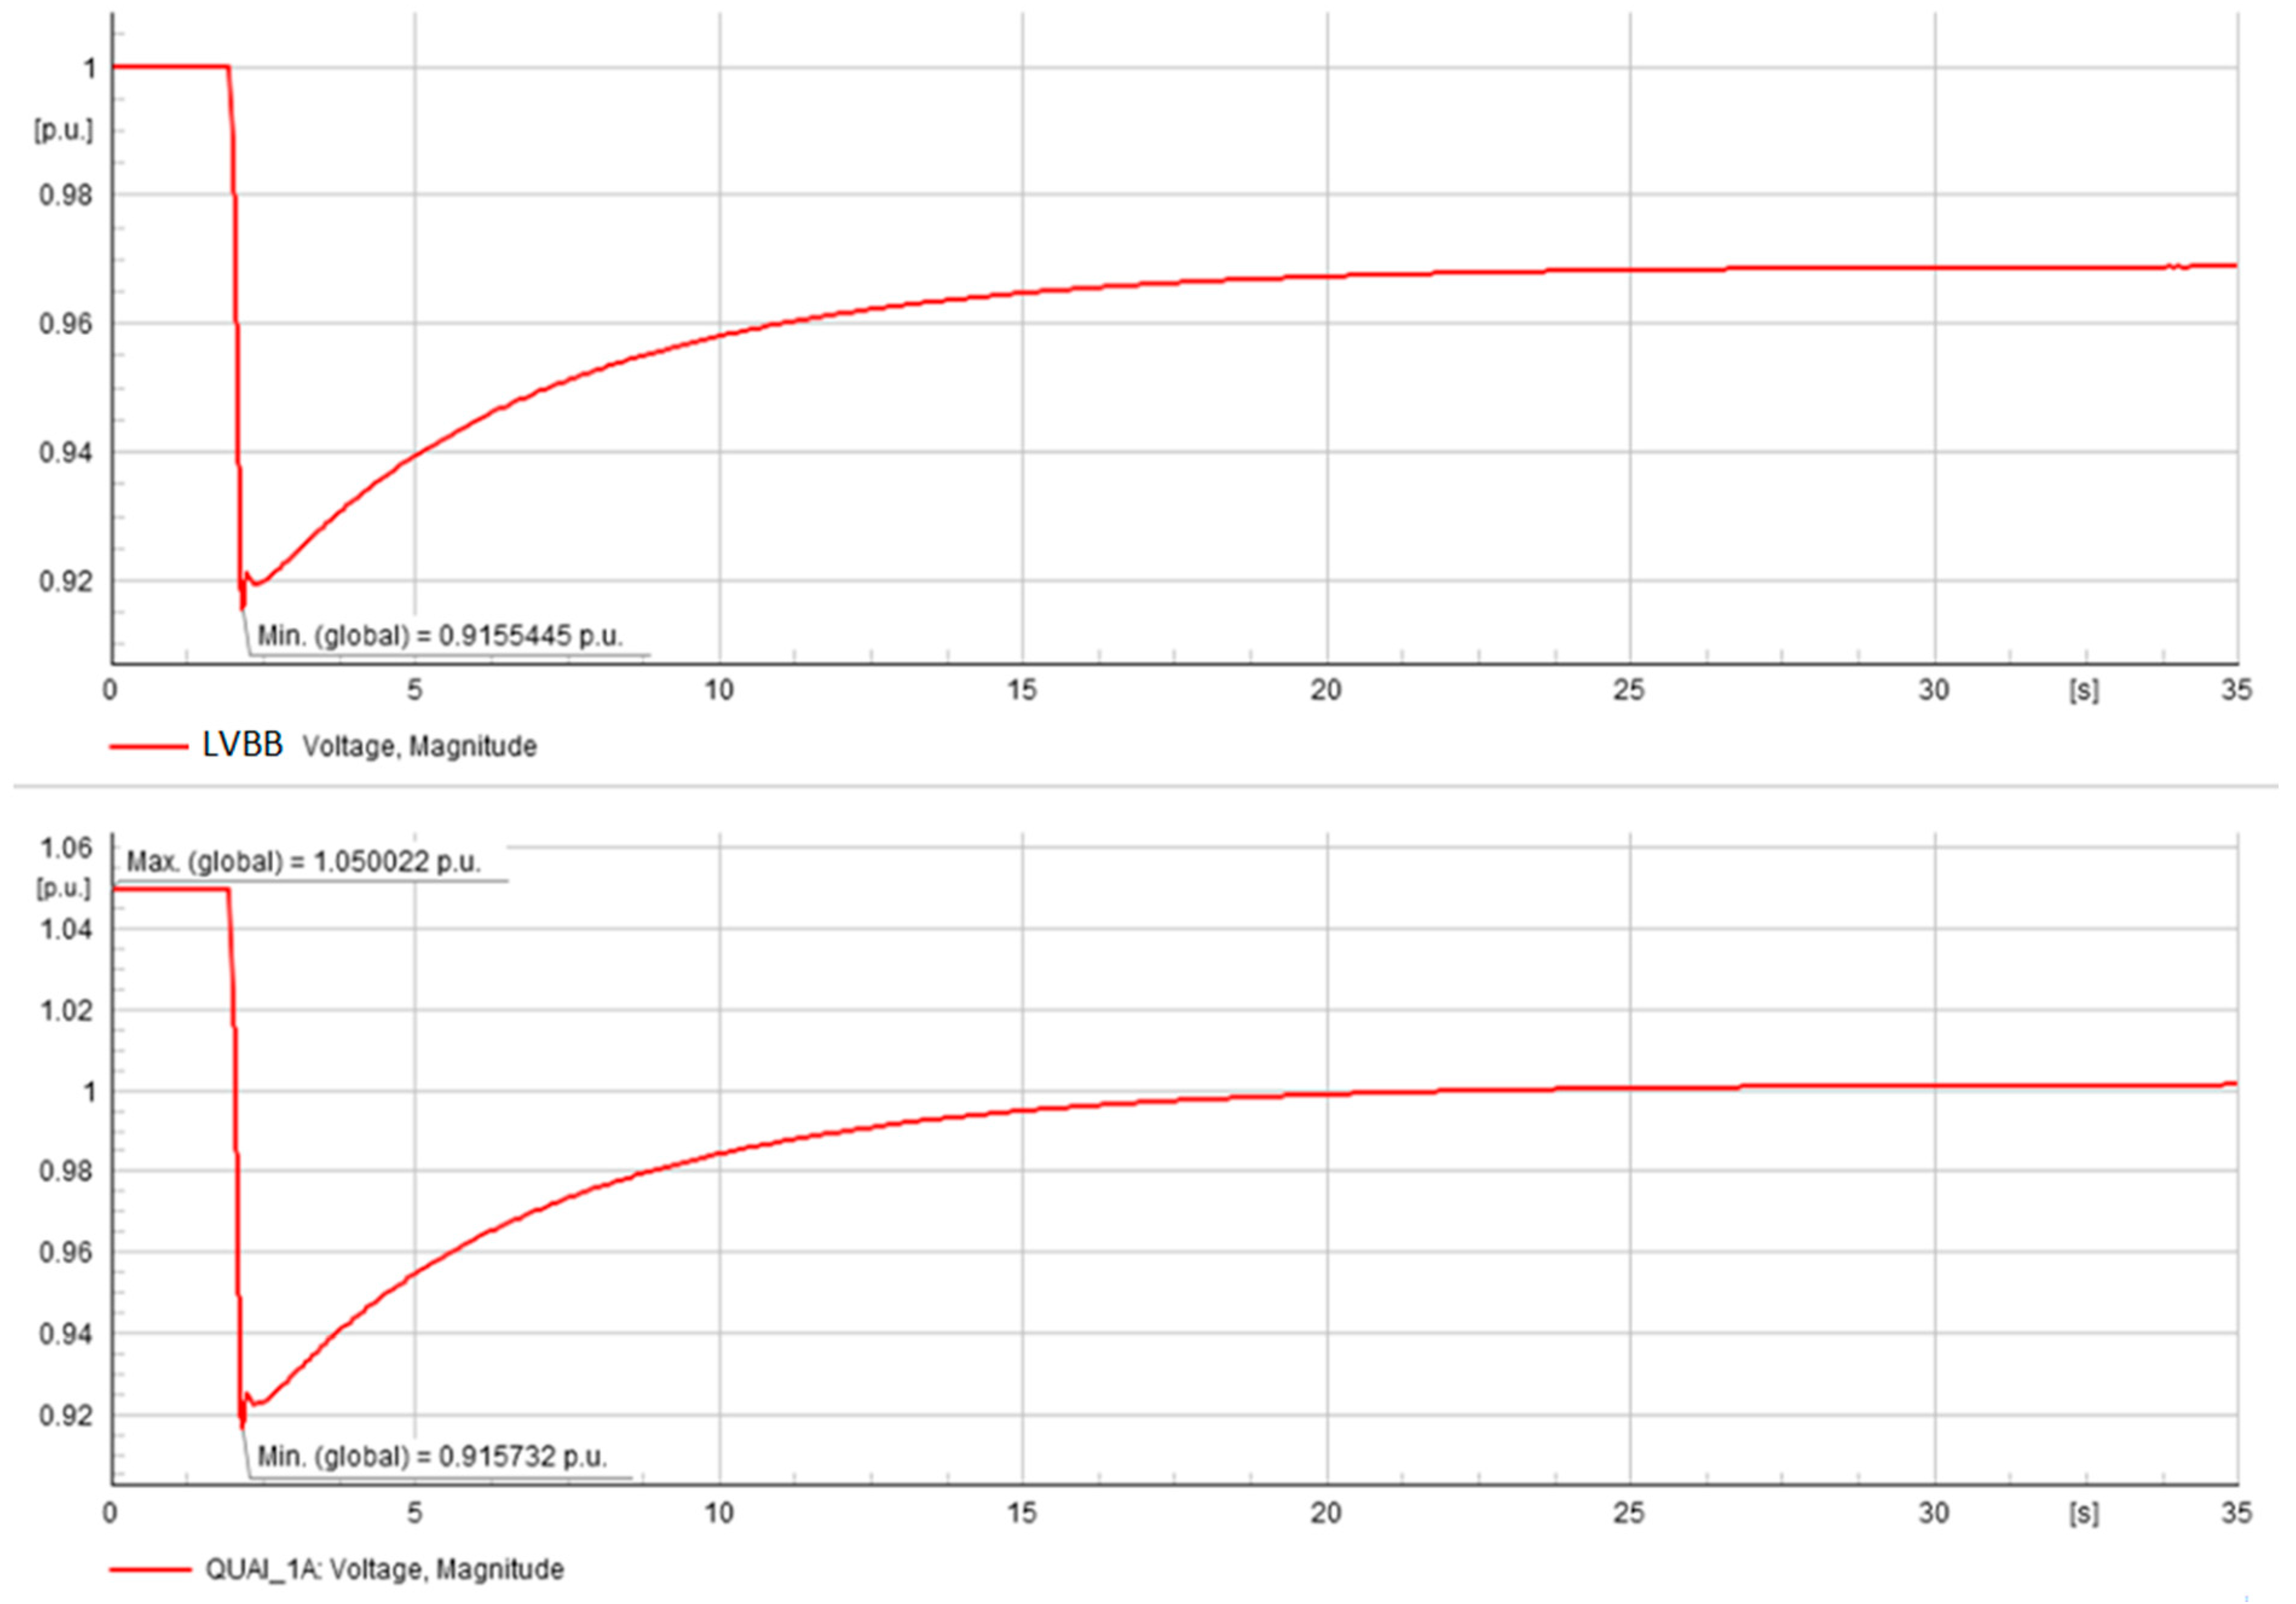
Connection of onboard generators with load transfer in 11 kV ferry operation mode
In this chapter, voltage deviations at ferry berths during transfer of 540 kW power are investigated. After closing the onboard CB and after load transfer event, the voltage at the ship connection terminals drops to approximately 0.915 p.u. (see
Figure 11). When a transient process is finished, the voltage level during a new operation mode is established at a level equal to 1 p.u. at the ship connection terminals. There is no exceeding of voltage limits observed.
- ii.
Connection of onboard generators with load transfer in 11 kV cruise operation mode
In this chapter, voltage deviations at cruise berth during transfer of 2300 kW power are investigated.
After connection of the load voltage at the ship connection terminals, it drops to approximately 0.919 p.u. (see
Figure 12). When a transient process is finished, the voltage level during a new operation mode is established at a level equal to 1 p.u. at ship connection terminals. There is no exceeding of voltage limits observed.
- iii.
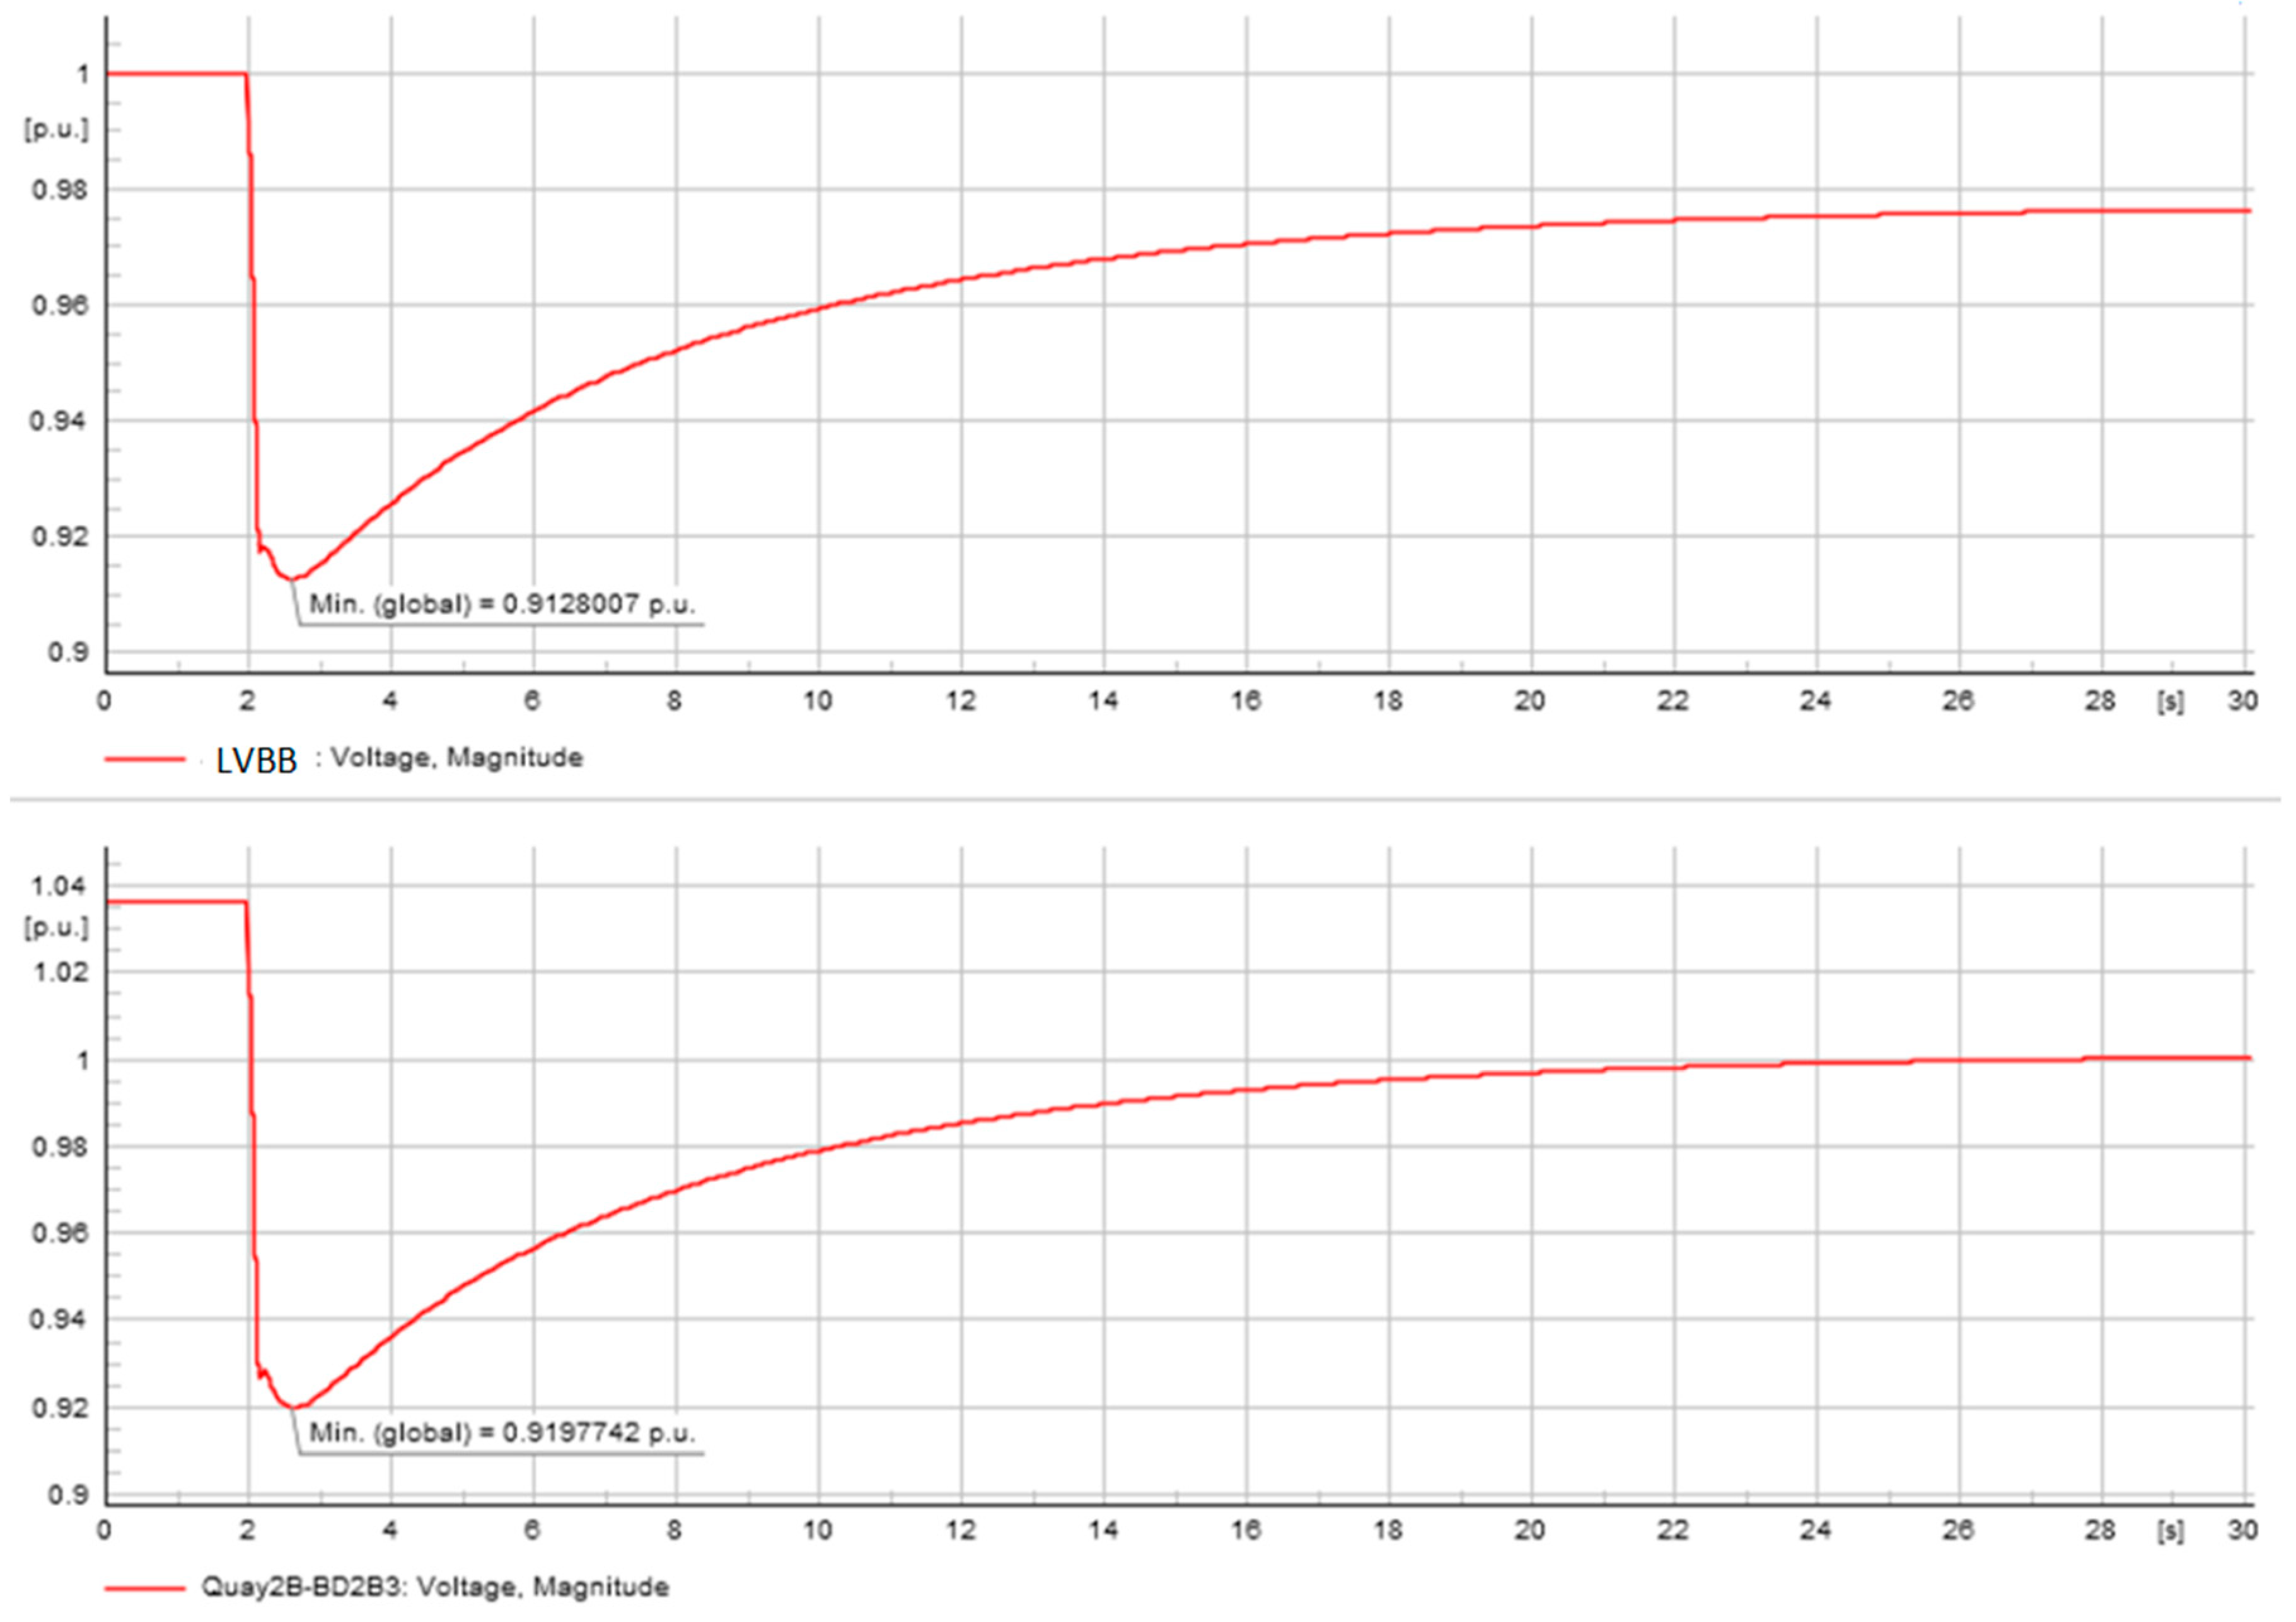
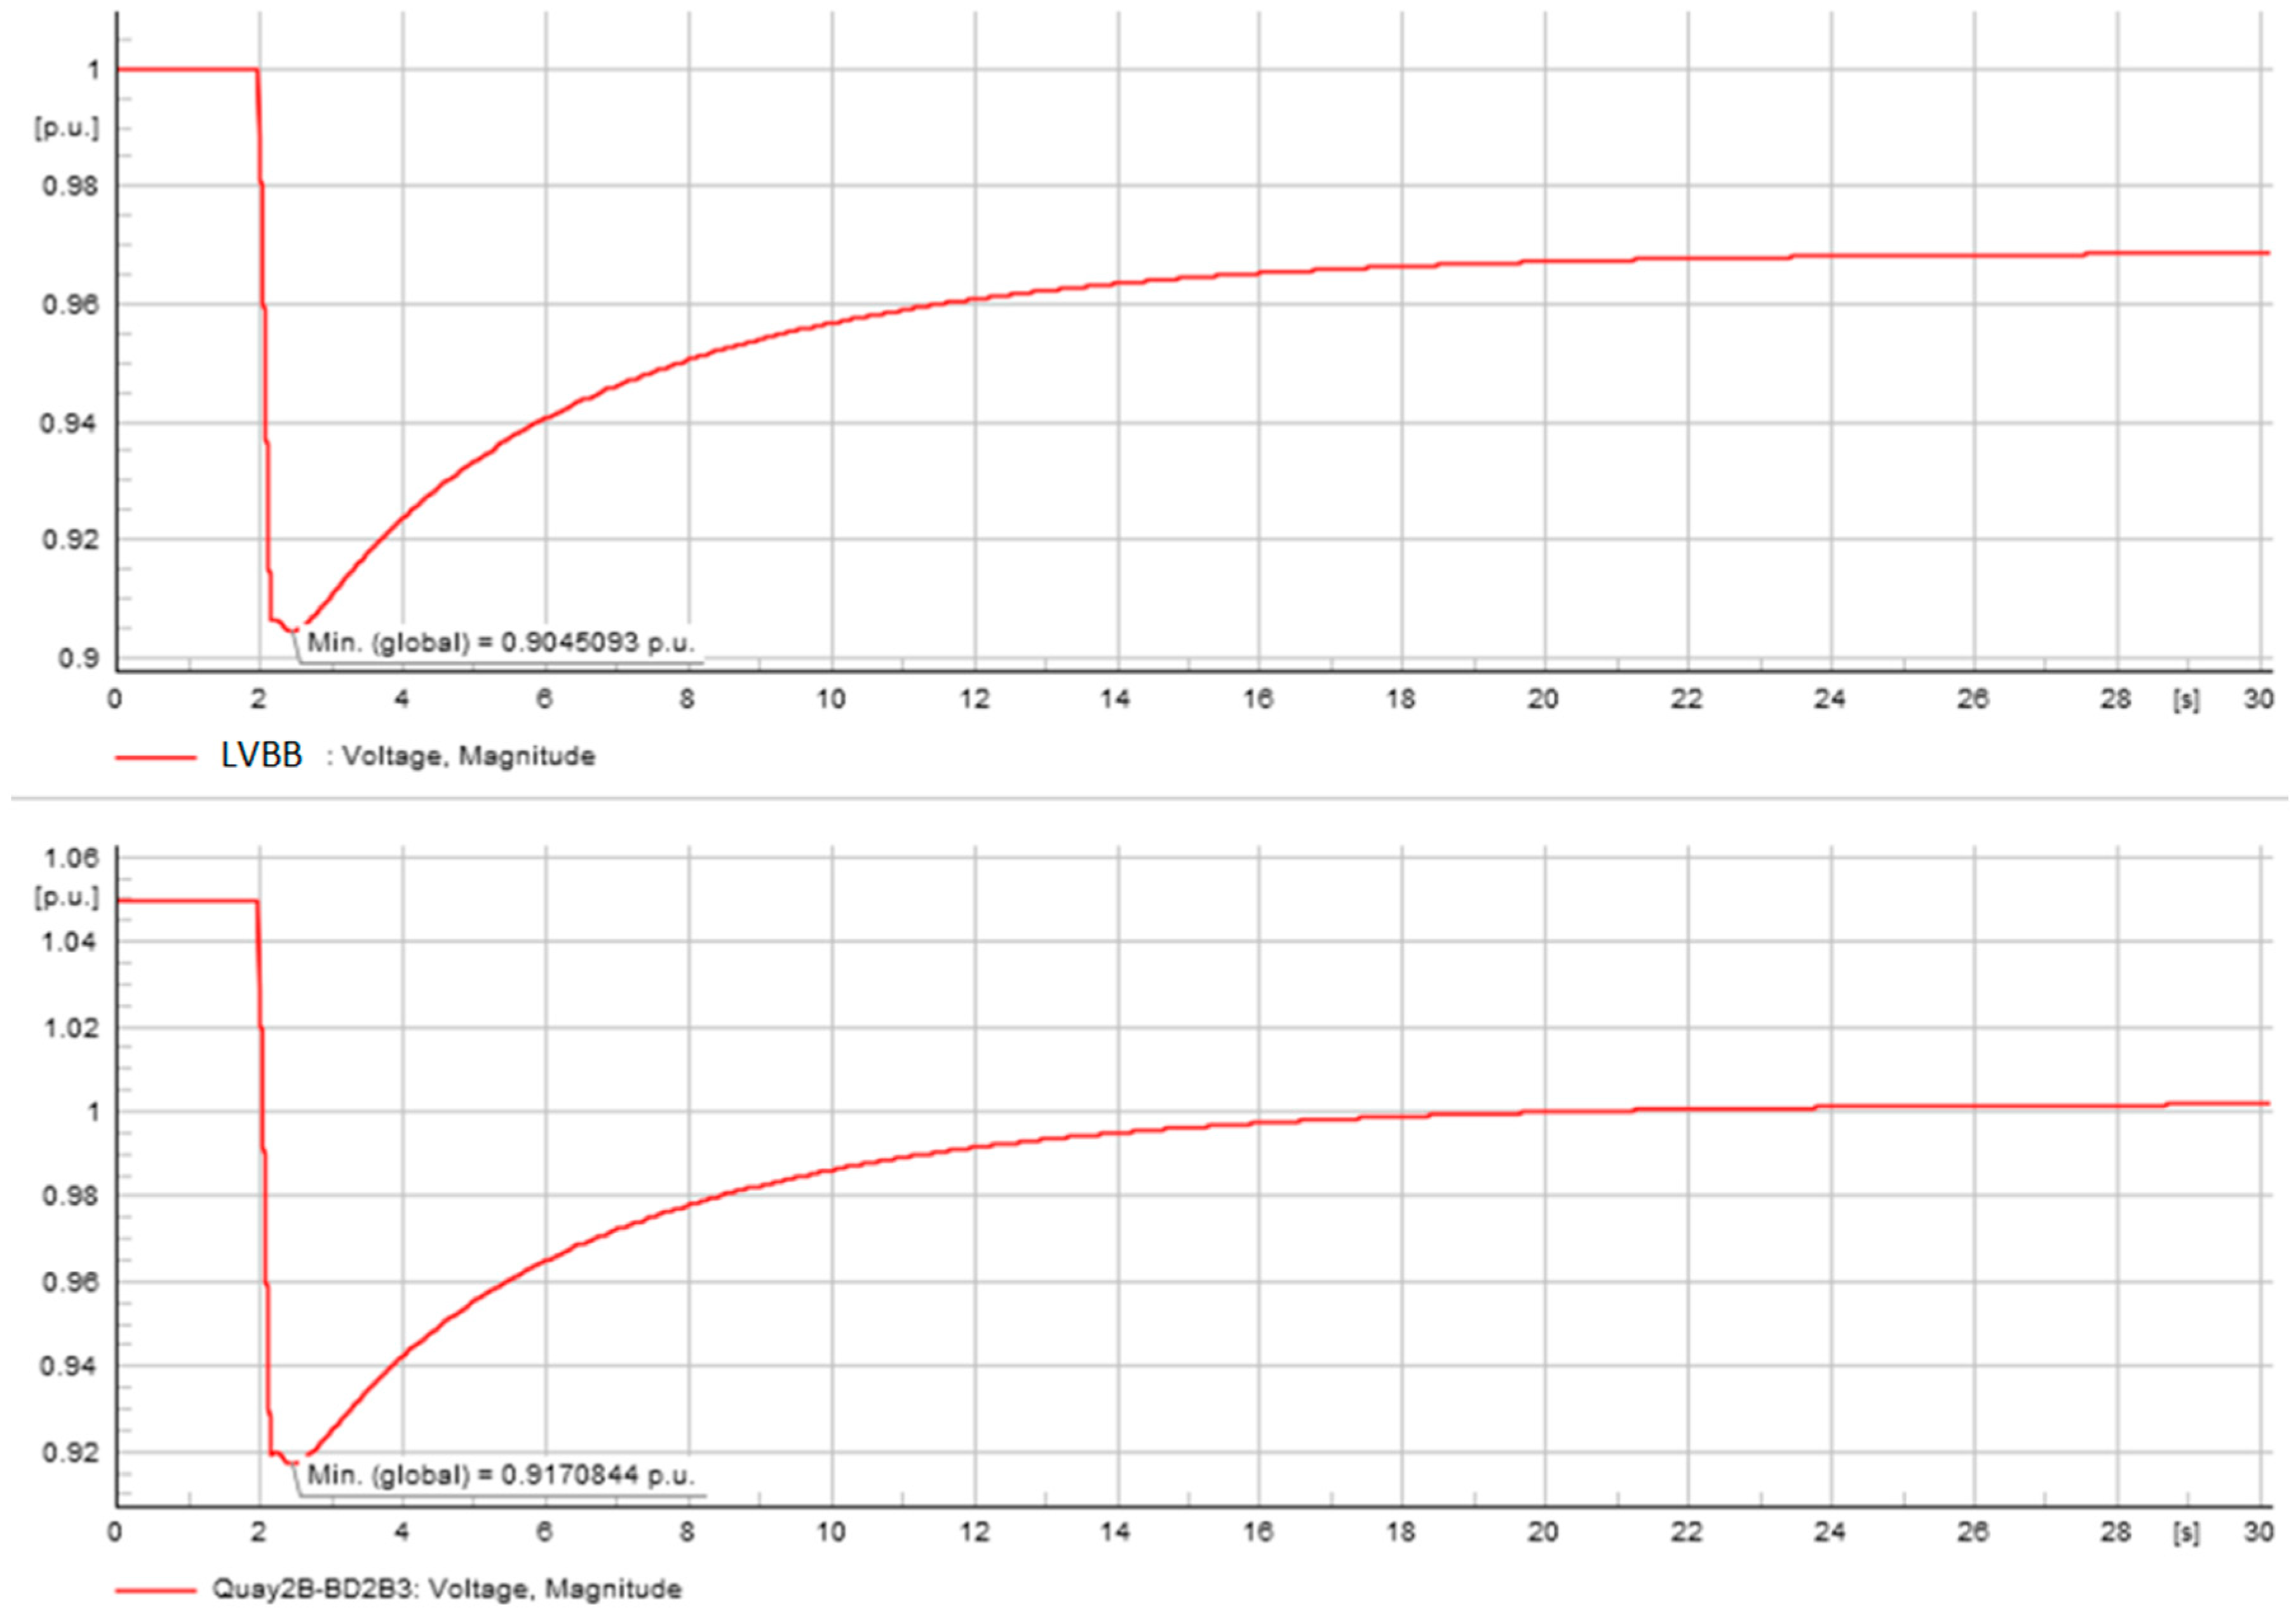
Connection of onboard generators with load transfer in 6.6 kV cruise operation mode
In this chapter, voltage deviations at cruise berth during transfer of 2300 kW power are investigated. The conversion station is run under very similar initial conditions as in previous section. The difference is in the power supply conditions and in tap position of power transformers.
After connection of the load voltage at the ship connection terminals, it drops to approximately 0.917 p.u. (see
Figure 13). When a transient process is finished, the voltage level during a new operation mode is established at a level equal to 1 p.u. at ship connection terminals. There is no exceeding of voltage limits observed.
- c.
Disconnection of the load from the frequency converter
In this chapter, simulation results of voltage deviations for load disconnection events are provided.
Initially, when the onboard CB is closed, the load of the vessel is fully powered by the frequency converter. The vessel generator is considered out of service.
After a period of 2 s, the load is stepped down and the onboard CB is opening. When the load is disconnected from the converter, the voltage suddenly increases, and the droop control starts acting until the time when a new steady state is reached. According to simulation results, the new steady state is reached in approximately 70–80 ms.
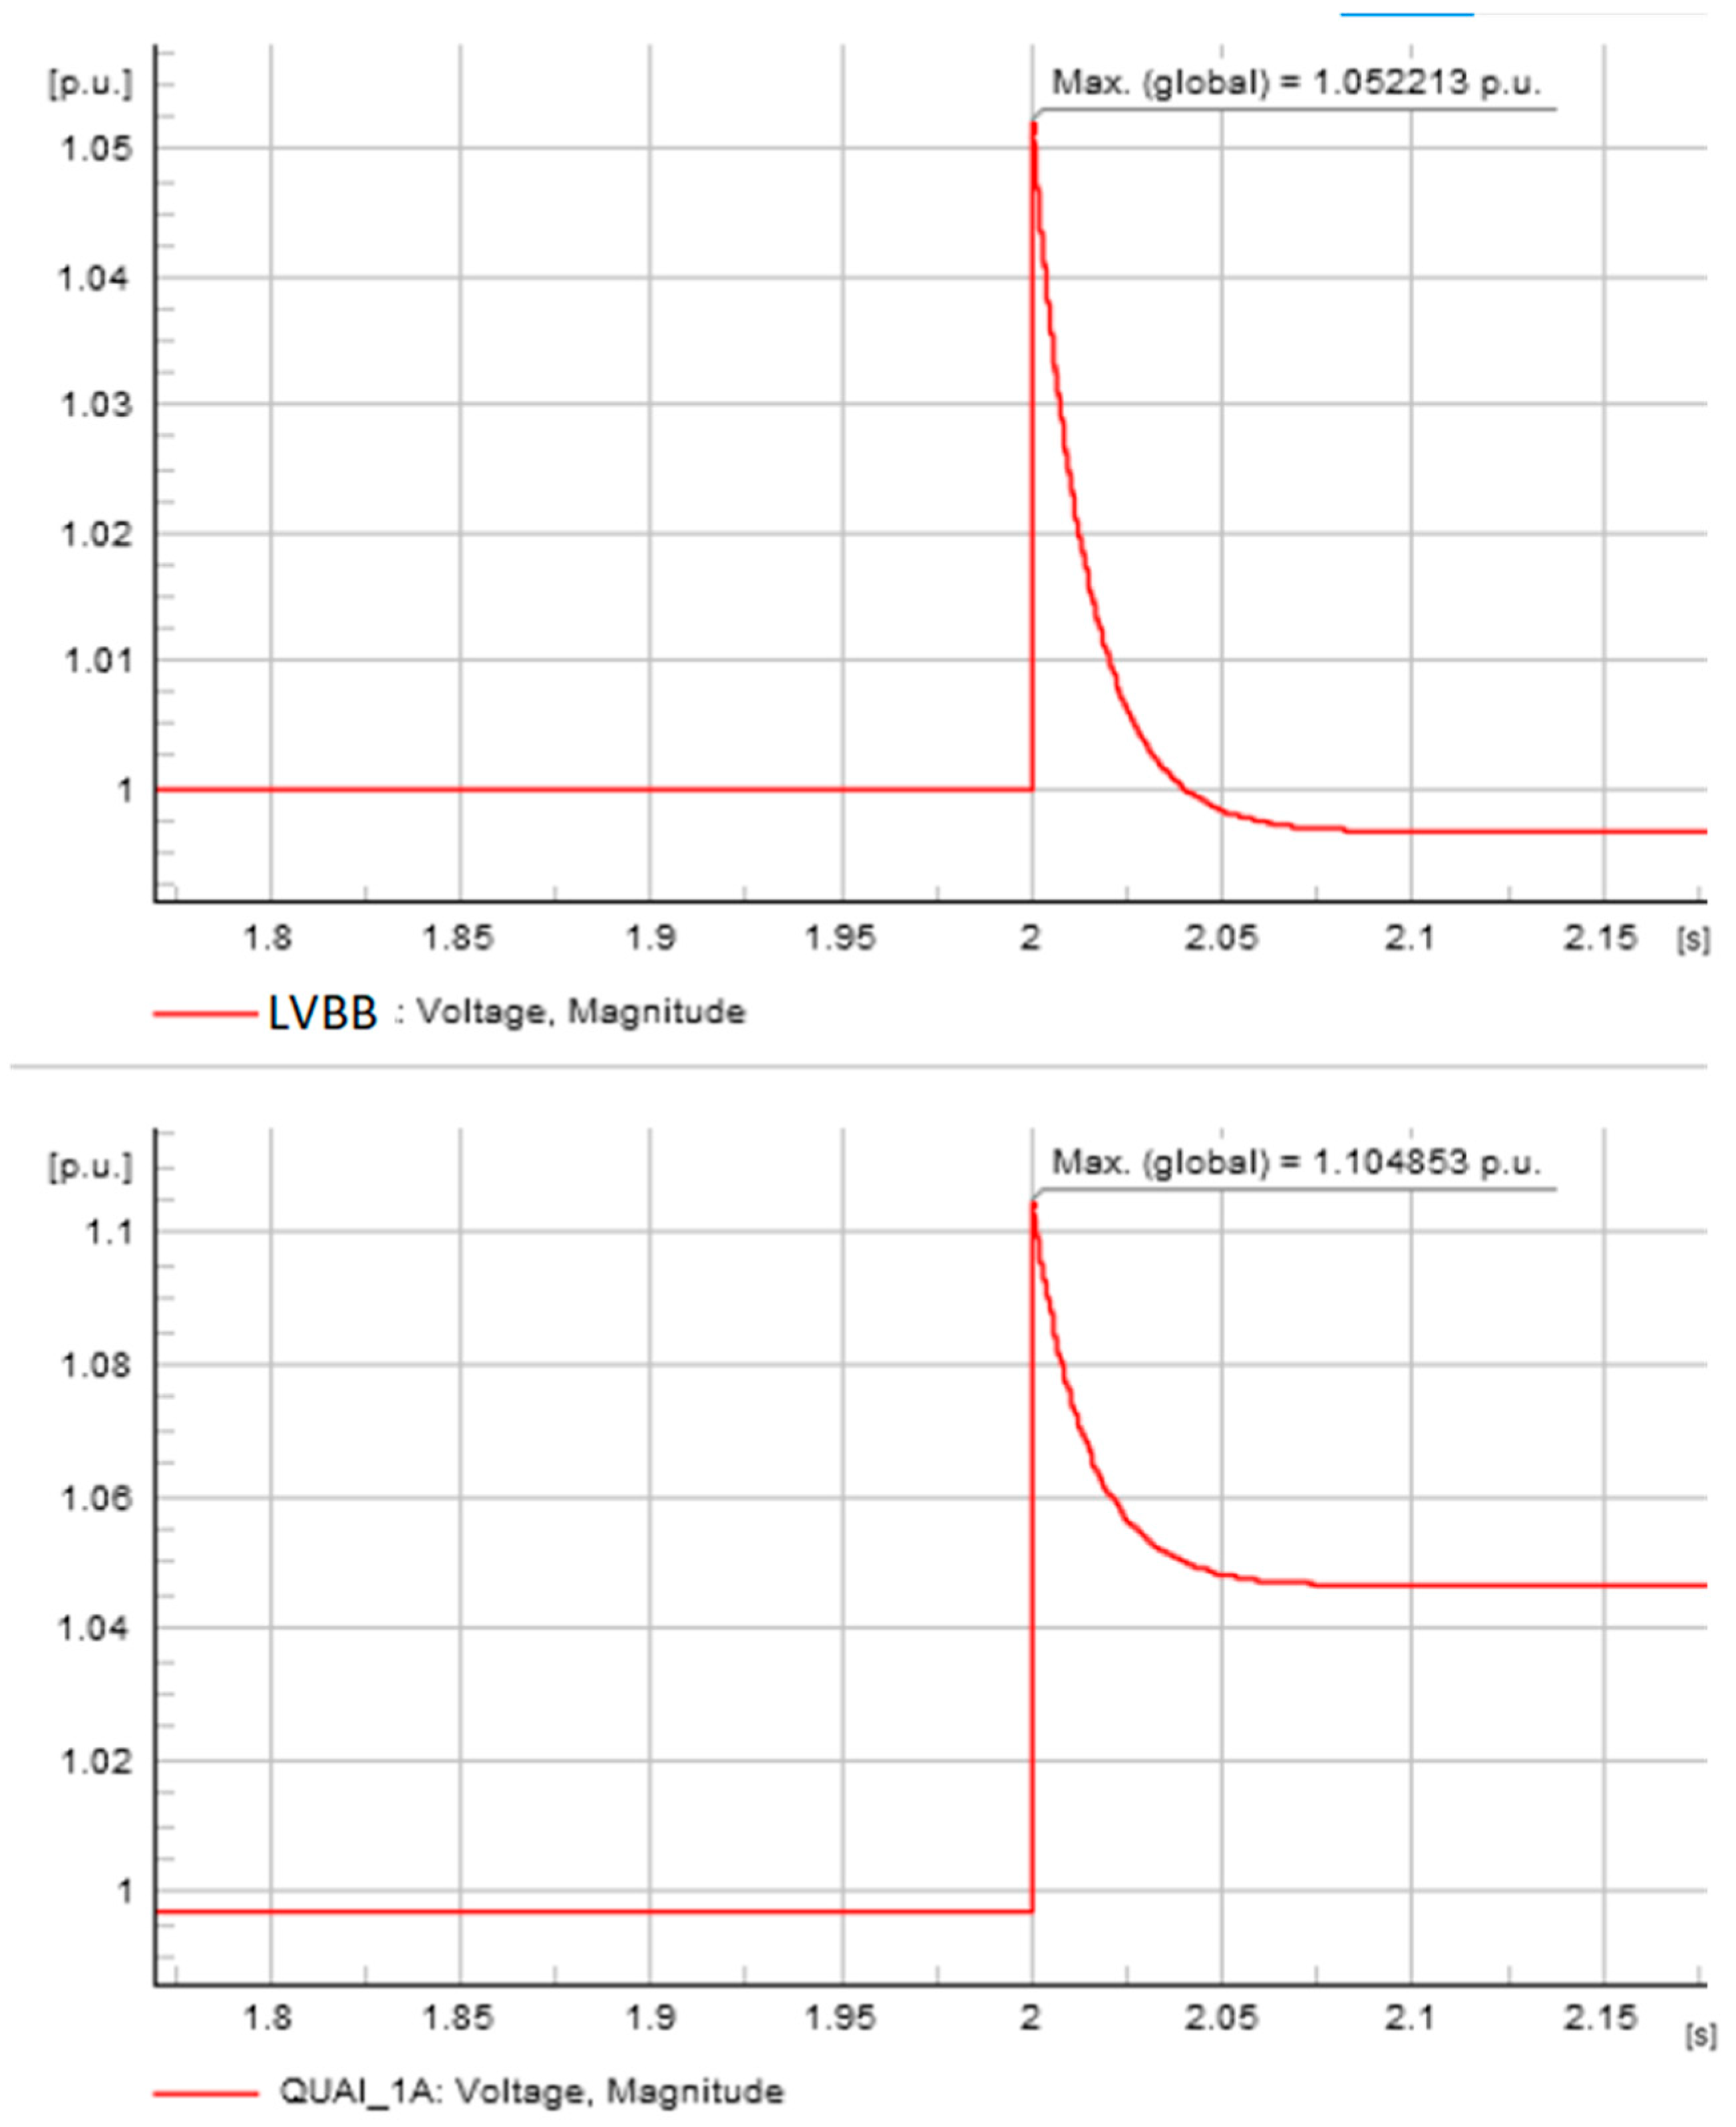
- i.
Disconnection of the load from the frequency converter in 11 kV ferry operation mode
In this chapter, voltage deviations at ferry berths are investigated. According to the simulation results provided, voltage surges appear after the electrical load reaches a value of 1.105 p.u. (see
Figure 14). There is no exceeding of voltage limits observed.
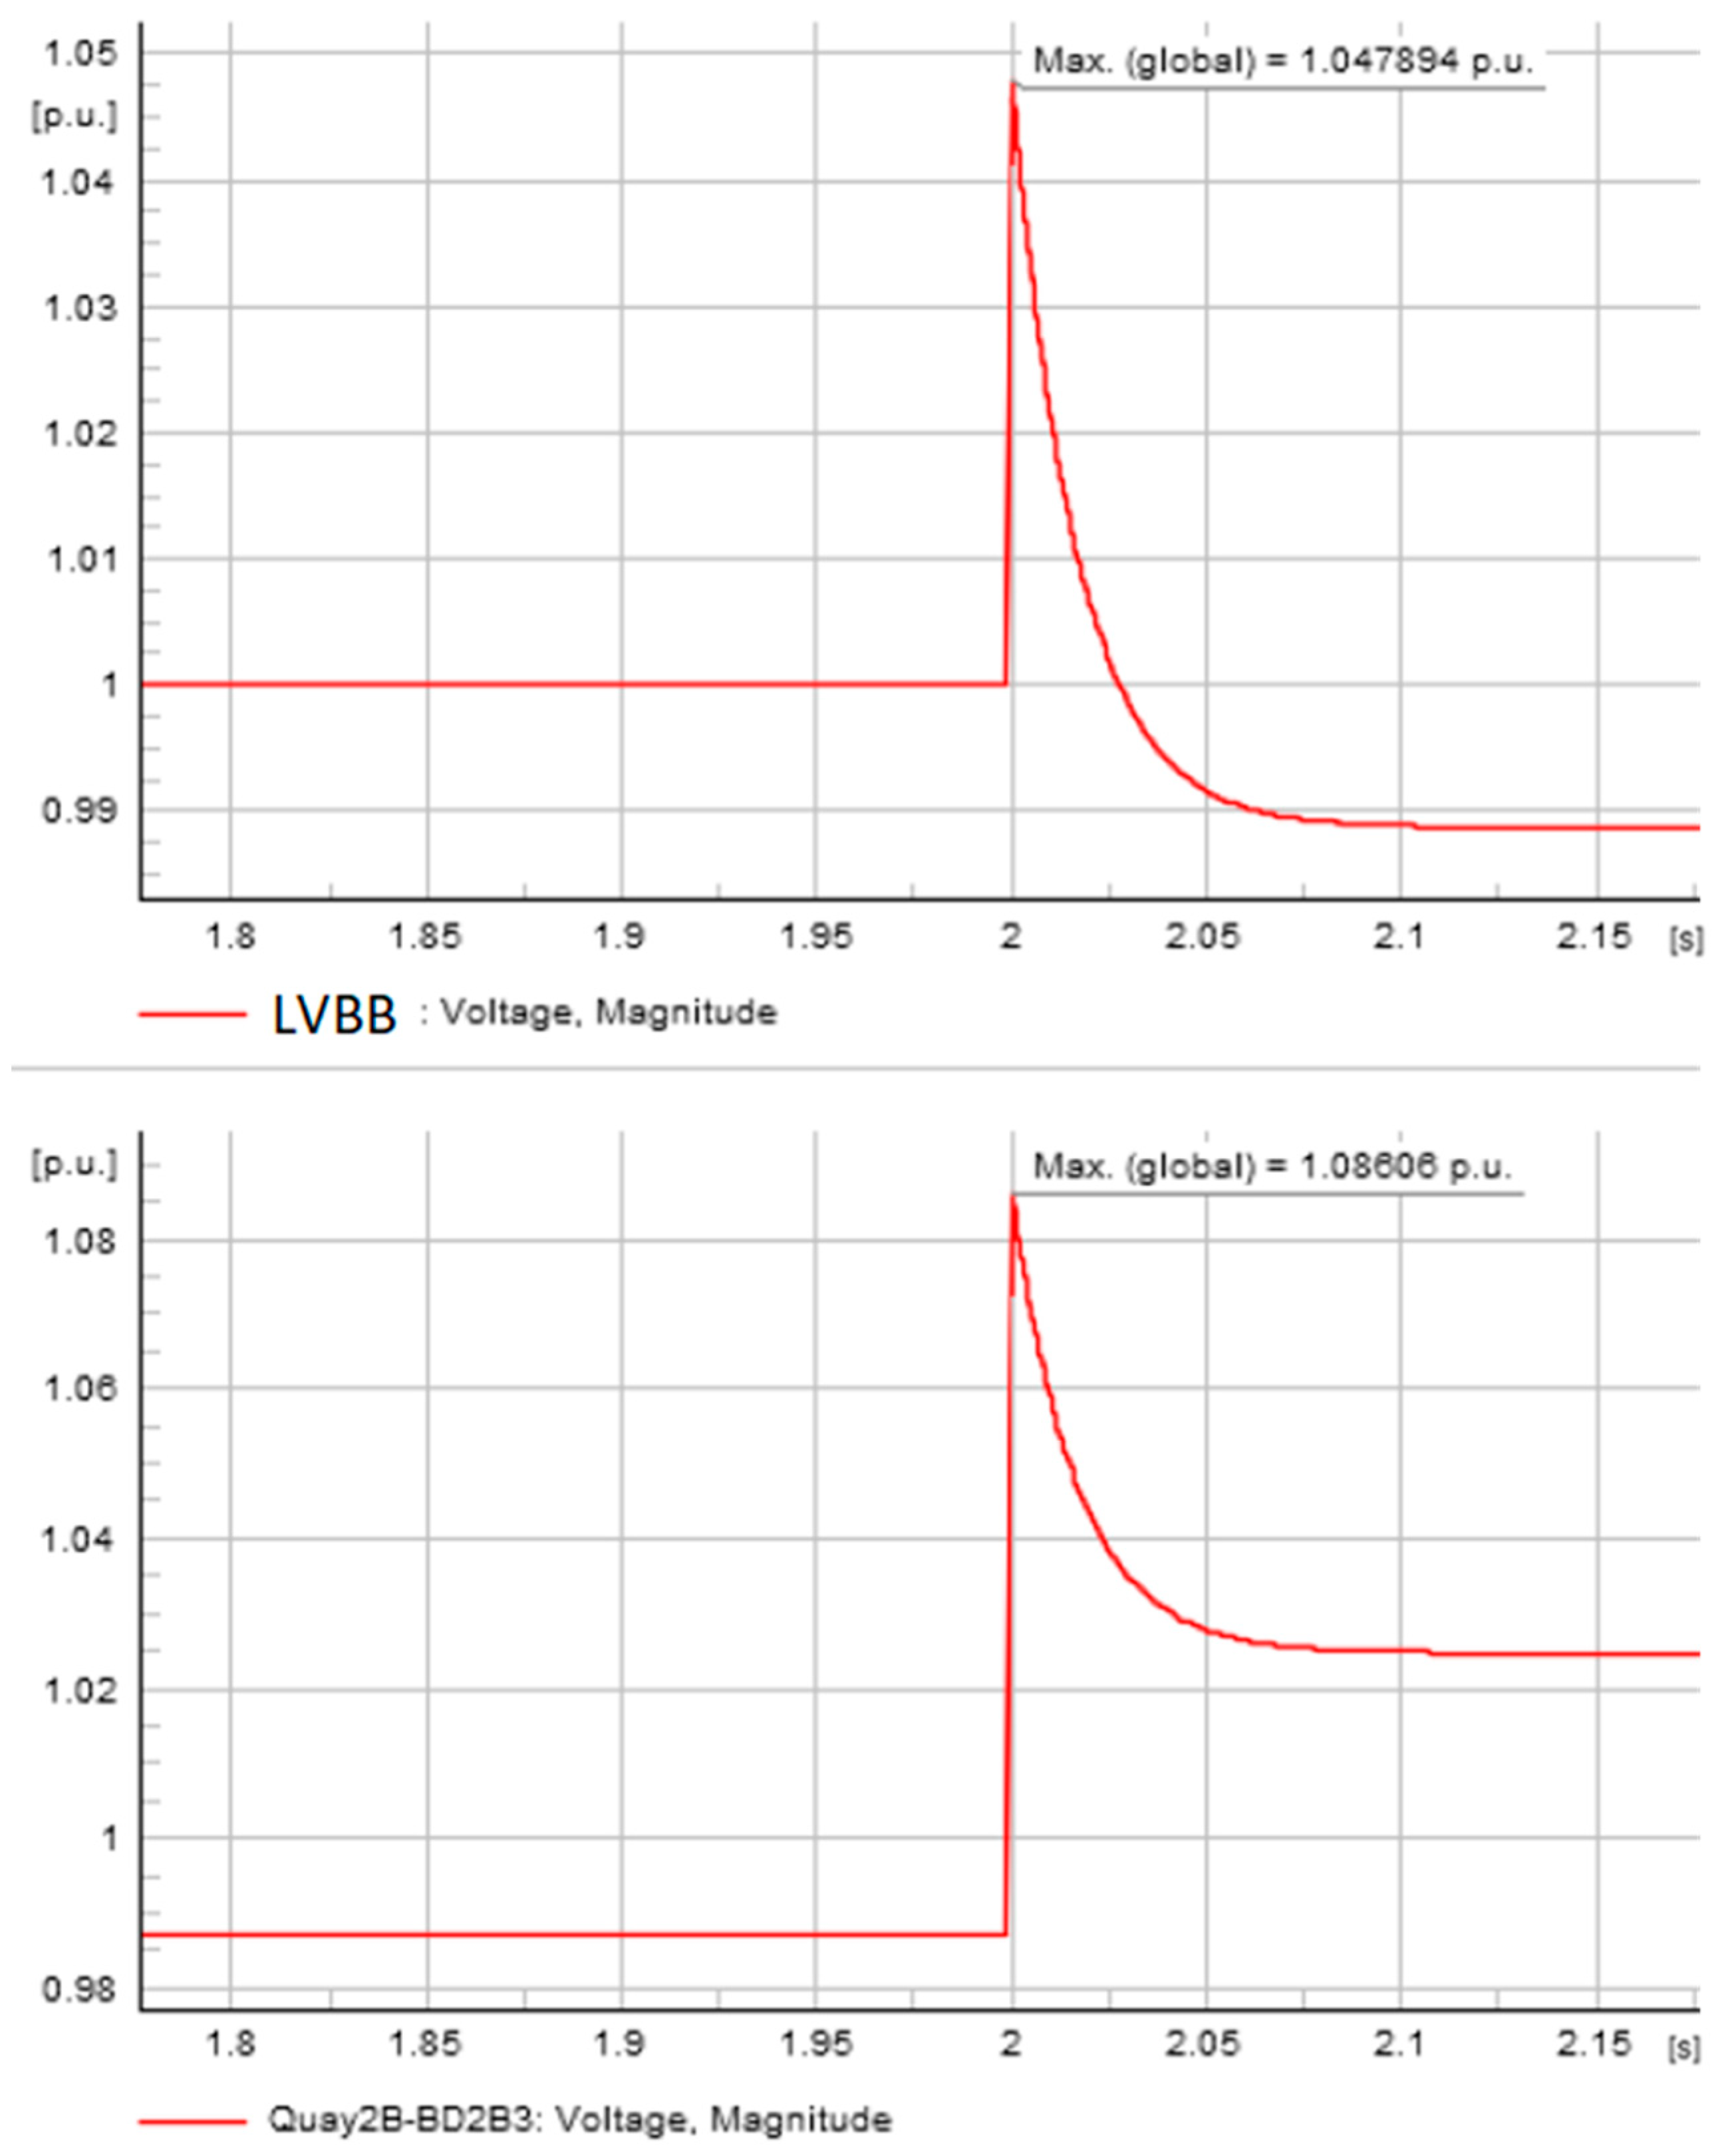
- ii.
Disconnection of the load from the frequency converter in 11 kV cruise operation mode
In this chapter, voltage deviations at cruise berths are investigated. According to the simulation results provided, the voltage surges that appear after the electrical load reach the value of 1.086 p.u. (see
Figure 15). There is no exceeding of voltage limits observed.
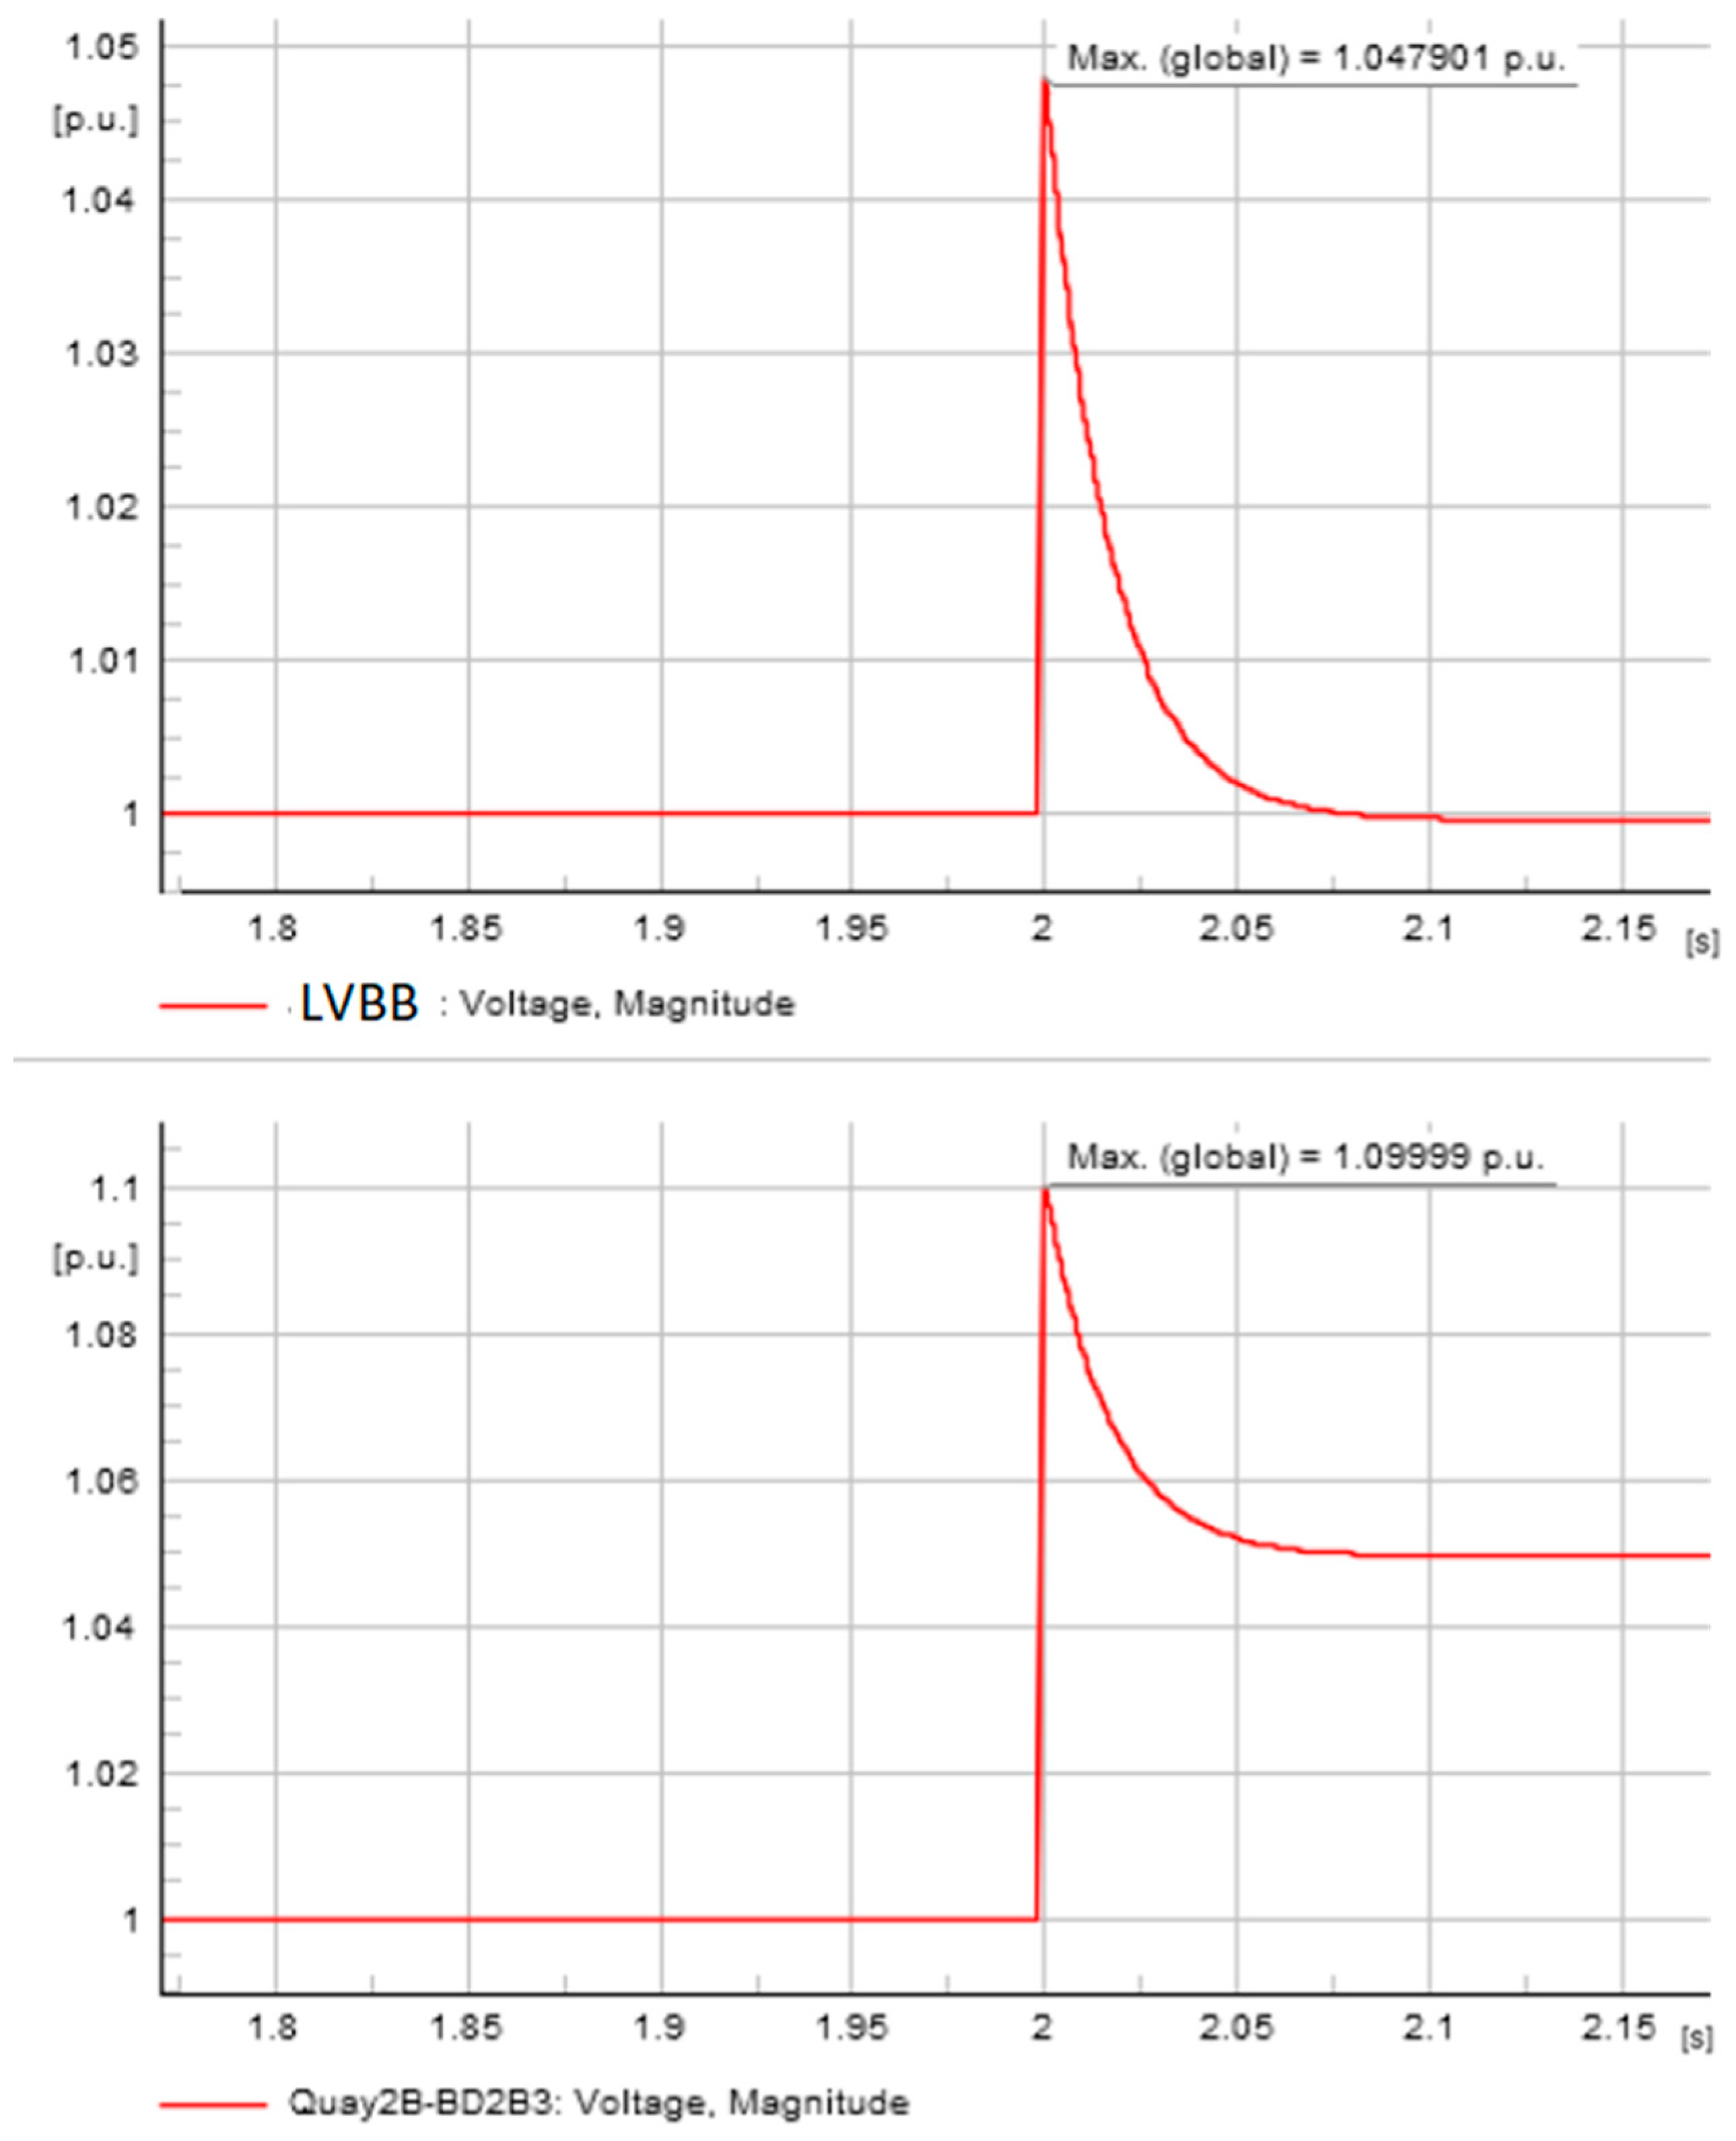
- iii.
Disconnection of the load from the frequency converter in 6.6 kV cruise operation mode
In this chapter, voltage deviations at cruise berths are investigated. According to the simulation results provided, the voltage surges that appear after the electrical load reach the value of 1.010 p.u. (see
Figure 16). There is no exceeding of voltage limits observed.


