Abstract
The Pisum sativum (PS), known as the green pea, was used in this investigation to produce a novel green surfactant. The performance of the PS green surfactant was also evaluated using various tests, including contact angle, IFT, emulsion, zeta potential, and oil recovery factor measurement in the presence of formation brine (FB) with a total dissolved solid (TDS) of 150,000 ppm. The characterization study using various tests revealed that the PS green surfactant was nonionic. The critical micelle concentration (CMC) measurement results indicated that the PS green surfactant’s CMC value is 1500 ppm. The IFT and contact angle measurements showed that the green surfactant significantly lowered the IFT and contact angles. The lowest IFT value of 3.71 mN/m and the contact angle of 57.37° were achieved at the FB concentration of 12,500 ppm (optimum salinity). The results of the emulsion tests showed that Winsor type III emulsions were achieved using PS green surfactant and crude oil. The core flooding experiments revealed that the tertiary recovery using a solution of 1500 ppm of PS green surfactant and 12,500 ppm of FB resulted in a maximum oil recovery factor of 83.55%.
Keywords:
green surfactant; Pisum sativum; IFT; contact angle; emulsion; oil recovery factor; capillary number 1. Introduction
Enhanced oil recovery (EOR) in conventional and unconventional oil reservoirs is of great importance. Among the available methods, chemically enhanced oil recovery (CEOR) is one of the pioneers, which has received significant attention recently. Surfactant flooding is one of the CEOR methods that has been successfully implemented for the past few decades; however, the environmental drawbacks of these chemical-based compounds have raised serious concerns about these materials. These chemical-based surfactants are toxic and nonenvironmentally friendly, restricting them from further development [1,2,3,4,5,6,7,8,9,10,11,12].
The application of green surfactants for EOR applications has recently received significant attention. These bio-based green surfactants, derived from various plants and animals, show promising results when applied to sandstone and carbonate reservoirs. These green surfactants are extracted from renewable and sustainable sources, and these groups of surfactants are nontoxic and environmentally friendly. In addition, the technical efficiency of these green surfactants is very close and, in some cases, even higher than the conventional chemical-based surfactants, which makes them very attractive to be used in field scales [13,14,15,16,17,18,19,20,21,22,23].
Saxena et al. derived a natural surfactant (anionic type) from Madhuca longifolia (Mahua) oil and examined its efficiency for EOR applications through contact angle and IFT measurements. Based on their findings, the Mahua anionic surfactant was highly effective in creating a favorable situation for EOR purposes. The surfactant’s CMC value was determined to be 9000 ppm. In their experiments, the optimum salinity led to an ultralow IFT value of 0.01 mN/m. The results of the contact angles revealed that the natural surfactant significantly changed the rock’s wettability from oil-wet to water-wet states, where a minimal contact angle of 8° was obtained. Furthermore, injecting surfactant slug as the tertiary recovery resulted in a maximum oil recovery of 77.92% [24].
Moradi et al. extracted a new bio-based surfactant from the Tribulus Terrestris plant and used it for EOR in a carbonate oil reservoir. They also investigated the effects of different ions (Ca2+, Mg2+, SO42−) on the efficiency of the green surfactant during smart water flooding. Their findings revealed that SO42− had the best impact on the green surfactant’s performance. At a CMC point of 0.3 wt%, the minimum contact angle and IFT values of 54.4° and 13.5 mN/m were attained, respectively. Furthermore, after injecting the smart solution as the tertiary recovery, the maximum oil recovery factor elevated to 72%. They concluded that the surfactant of the Tribulus Terrestris plant is highly beneficial for EOR applications [25].
A unique surfactant from the plant was employed for EOR purposes by Mehrabianfar et al. The effectiveness of the Acanthephyllum surfactant as the green surfactant was evaluated using contact angle and IFT measurements. They found that the extracted surfactant is highly effective at optimizing contact angles and IFT values. The initial value of IFT was 29.18 mN/m, and after applying this natural surfactant, it decreased to 2.16 mN/m, which is a 92.6% IFT reduction. In addition, the contact angle also changed from 146° to 64°, which is about a 56.14% improvement. They also performed a modeling study to determine the adsorption kinetics of the natural surfactant on the surface of the rock. They concluded that the adsorption behavior fits the pseudo-second-order model [21].
Sami et al. extracted a novel bio-based surfactant from Avena Sativa (AS) and examined its efficiency in the presence of various salts present in seawater. They also identified in their investigation the optimum salinity of the seawater. Their findings demonstrated that the AS green surfactant’s CMC value is 4000 ppm. Regarding IFT and contact angle reductions, it was also discovered that the diluted seawater with a salinity of 2000 ppm was the most suitable salinity with the AS green surfactant. The lowest IFT value (1.38 mN/m) among the salts tested was achieved when Na2CO3 was combined with AS green surfactant at a CMC point of 4000 ppm. After injecting 5 PVs of a solution containing AS green surfactant at the CMC point and Na2CO3 salt at the optimal salinity, where a minimum contact angle of 38.28° was attained, the oil recovery factor was increased by 28.98% as the tertiary recovery [26].
Pisum sativum (PS), commonly known as the green pea, is one of the major legumes in the world. It was originally found in southwestern Asia and then disseminated to other regions. In addition, it is cultivated in over 90 countries across the globe. It is estimated that the global annual production of this legume is about 13.5 million tons. The global consumption of this legume has been increasing annually as people are more concerned about their diet and health. Generally, it is used in different forms, including raw, cooked, or frozen. The major constituents of the PS are saponin, brassinosteroid, tannins, various acids, apigenin, daidzein, lectin, etc. These components provide unique characteristics for anticancer, antibacterial, antifungal, anti-inflammatory, antioxidant, antilipidemic, anti-helicobacter pylori, antidiabetic, etc. The PS has received attention in this study because of its saponin content [27,28,29]. For EOR applications, the PS saponin can be used as a green surfactant.
The extraction of a novel natural surfactant from the Pisum sativum is investigated in this study, which is the first time such an idea has been tested. Different experiments, including IFT, contact angle, emulsion, zeta potential, oil recovery factor measurements, and capillary number calculations, were designed and performed in this investigation. Moreover, the efficiency of the PS green surfactant in the presence of FB with high salinity was examined, and the optimum salinity of FB was determined. The findings of this research reveal a more in-depth understanding of the function of green surfactants in improving oil recovery from carbonate reservoirs.
2. Materials and Methods
2.1. Materials
In this investigation, the PS was purchased from a local shop and then prepared and utilized for saponin extraction, as illustrated in Figure 1. The crude oil with an API of 32.6° was collected from one of the Iranian carbonate oil reservoirs to use in this study. The amounts of asphaltene, saturate, resin, and aromatics of crude oil are 0.9, 68.7, 5.5, and 24.9%, respectively. The FB with a TDS of 147,847 ppm was collected from the same oil field and used in this study. In addition, deionized water (DIW) was used to prepare FB with different salinities. The carbonate rock samples were collected from an outcrop of the same oil field and were used after cutting and cleaning. The carbonate core sample used in this study mainly consisted of dolomite (33%), calcite (50), and other minerals (17%) [26]. The porosity of core samples used in this study was 14.24 and 14.36%, and the permeability of samples was 17.94 and 19.67 mD.
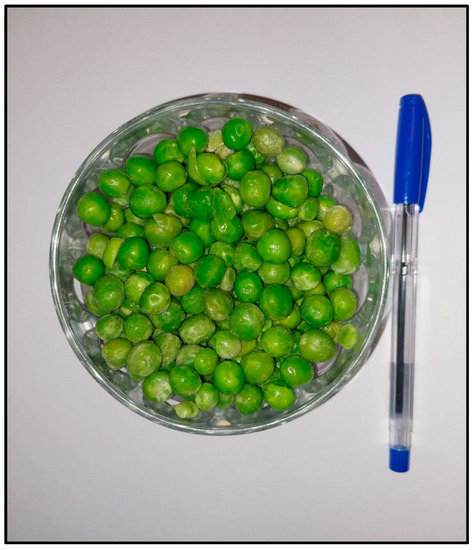
Figure 1.
Image of PS used in this study.
2.2. Methods
2.2.1. PS green Surfactant Extraction Procedure
The Soxhlet extraction method was employed to extract the high-purity saponin compound as the surfactant agent from the Pisum sativum. Figure 2 provides the schematics of procedures used for saponin extraction. In this step, 100 g of the fine PS powder was prepared and poured into the Soxhlet’s thimble, where it was mixed with 500 mL of methanol at 60 °C for about 12 h. Afterward, the methanol was separated using a rotary evaporator, and the left-over compound was mixed with 50 cc of DIW. The solution was mixed with 50 cc of n-butanol in a separatory funnel. After proper agitation, the solution changed into two immiscible organic (top phase) and aqueous (bottom phase) layers. Diethyl ether was added to the collected organic components, and the mixture was centrifuged for 20 min at 3500 rpm. Finally, the pure saponin was collected as the brown precipitated compound and used for EOR applications. The experimental results showed that the saponin yield as the natural surfactant in this study was 8.1%, which is comparable to the reported data in the literature [26,30,31].
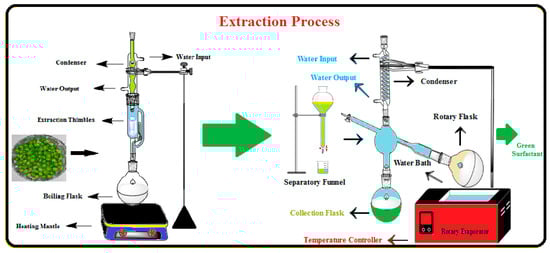
Figure 2.
Schematic diagram of procedures used for surfactant extraction from PS.
Two types of saponin are present in the PS: monodesmosidic and triterpene. It should be noted that these saponins are comparable to soybean saponins. Figure 3 presents the structure of the saponin component of PS. Moreover, the confirmation of the produced foam by the green surfactant extracted from the PS is shown in Figure 4. As shown in this figure, the produced foam is a clear indication of the presence of saponin in the chemical structure of the PS, which can be used efficiently for EOR applications [27,29].
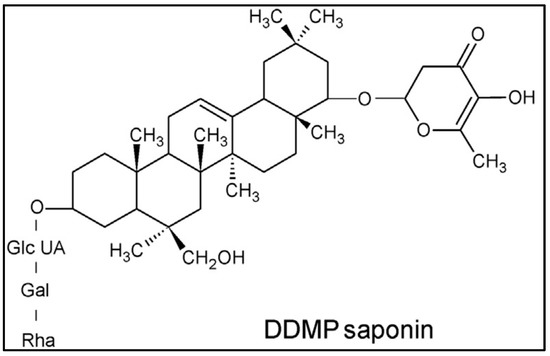
Figure 3.
Structure of saponin compound of PS (DDMP: 2,3-dihydro-2,5-dihydroxy-6-methyl-4H-pyran-4-one) adapted with permission from Ref. [27]. 2015, Elsevier.
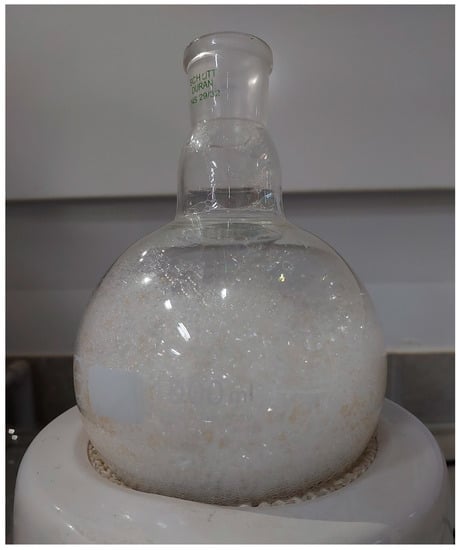
Figure 4.
Confirmation of the derived saponin component as the green surfactant agent from the PS.
2.2.2. Physicochemical Characterization of PS Green Surfactant
Several physical and chemical investigation techniques, including TGA, 1H NMR, and FT-IR, were applied to analyze the extracted PS green surfactant. The TGA test was performed using a Q600 analyzer (TA Instruments, USA), where a heating rate of 10 °C/min was employed, and the sample was heated under atmospheric air up to 700 °C. The prepared sample was mixed with dimethyl sulfoxide-d6 (DMSO-d6) and then analyzed using a Bruker 500 MHz spectrometer at ambient temperature to conduct the 1H NMR analysis. A VARIAN Inova 500 MHz H–125 MHz C (USA) instrument was used for FT-IR analysis at 500–4000 cm−1.
2.2.3. IFT Measurements
As shown in Figure 5, several IFT tests were performed using the IFT400 apparatus (Fars EOR Tech. Co., Shiraz, Iran) to examine the effects of PS green surfactant on the IFT of FB and crude oil. This device uses a pendant drop and the axisymmetric drop shape analysis (ADSA) technique to measure the IFT between two immiscible fluids. Initially, various sample solutions were made using multiple FB and PS green surfactant concentrations. Then, the image of each oil drop at different solutions was recorded and analyzed using the ADSA technique. The IFT measurements in this study were performed at 30 °C and 80 °C, with an error of ±5% for reporting each data point.
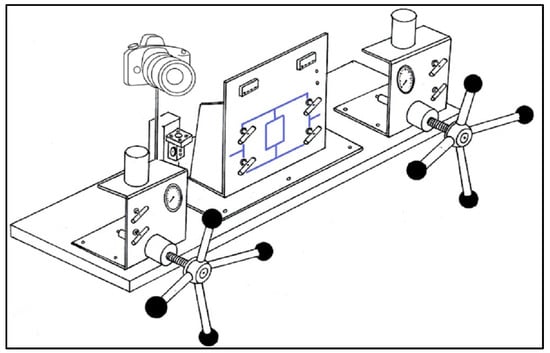
Figure 5.
Schematic diagram of IFT400 for the contact angle and IFT measurements.
2.2.4. Contact Angle Measurements
The prepared thin sections of carbonate rock were soaked in crude oil for 50 days at the reservoir temperature (80 °C) to restore the original wettability (oil-wet). Subsequently, various solutions using FB and the PS green surfactant were prepared. At the reservoir temperature and atmospheric pressure, the IFT400 instrument and sessile drop method were employed to measure the contact angle of an oil drop. Moreover, the dynamic contact angle tests were measured throughout a range of time intervals, up to 210 h; however, the plurality of the contact angle measurements was performed at 150 h as the optimum time. Each test was performed three times (at various points of the thin section) to reduce the negative impacts of rock heterogeneity on contact angle results. The average value was then reported as the measured contact angle value.
2.2.5. Zeta Potential Tests
The surface charge variations with various solutions were investigated using zeta potential measurements. Several solutions containing varying FB concentrations in the absence and presence of PS green surfactant at the CMC point were prepared. After that, crushed carbonate rock powder was added to each solution, and each sample’s zeta potential was measured at 80 °C.
2.2.6. Emulsion Tests
The ability of the PS surfactant for emulsification was examined using static bottle tests. In this part of the experiment, two different samples were made. The first sample solution contained 1500 ppm of PS green surfactant in 12,500 ppm of FB, and the second sample solution was prepared using 1500 ppm of PS green surfactant in 150,000 ppm of FB. In the static bottle test, 10 mL of the PS surfactant solution was combined with 5 mL of the crude oil, and then each mixture was kept for about 90 days. Then, the final image of each solution was recorded, and the produced emulsion was examined.
2.2.7. Capillary Number Calculation
In this study, three different cases were considered for capillary number calculations, which are:
- A solution of FB with a concentration of 150,000 ppm was prepared as the secondary recovery.
- As the tertiary recovery, a solution of 1500 ppm of PS green surfactant was made in 150,000 ppm of FB.
- As the tertiary recovery, a solution of 1500 ppm of PS green surfactant was made in 12,500 ppm of FB.
This investigation determined the capillary number (NCa) using Equation (1). In this equation, the IFT (mN/m) and contact angle of each case were measured directly from the performed experiments, and the viscosity of the solution (Pa.s), rock porosity, and velocity (m/s) of the injected solutions were measured separately, and used for capillary number calculations.
2.2.8. Core Flooding Tests
The setup for the core flooding tests used in this research (Fars EOR Tech Co., Iran) is demonstrated in Figure 6. The carbonate cores were cleaned and washed with acetone and toluene, then dried at 70 °C overnight. Each sample was then saturated with FB in a saturator vessel for 24 h at a confining pressure of 3500 psi. After placing the saturated core sample into the core holder, 5 PVs of FB were injected into the sample, followed by the injection of 5 PVs of crude oil at a confining pressure of 4500 psi and a temperature of 80 °C. Following this step, the sample was removed from the core holder and kept at 80 °C for around 30 days within a glass jar filled with crude oil to achieve a state of equilibrium between the carbonate rock, FB, and crude oil. In the next step, 5 PVs of FB were injected into the core sample to perform the secondary recovery after putting the core sample into the core holder. Finally, the tertiary recovery was performed by injecting 5 PVs of the smart solution into the core at a confining pressure of 4500 psia and a reservoir temperature of 80 °C. For the tertiary recovery, two different solutions were prepared. The first solution included 1500 ppm of PS green surfactant in 12,500 ppm of FB, while the second contained 1500 ppm of PS green surfactant in 150,000 ppm of FB. The amount of produced oil was measured during secondary and tertiary recoveries, and the oil recovery factor was measured accordingly.
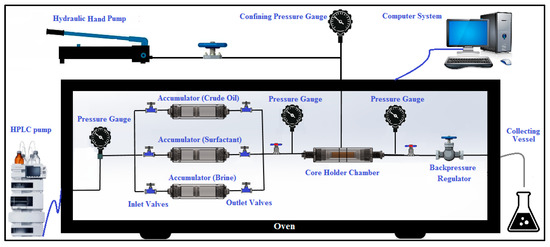
Figure 6.
The process of core flooding instrument used in this research.
3. Results and Discussion
3.1. Compatibility Tests
Two different samples of the PS green surfactant at a concentration of 1500 ppm were prepared to evaluate the PS surfactant’s compatibility with FB (12,500 and 150,000 ppm of FB) at reservoir conditions. The samples were kept at 30 °C and 80 °C for 30 days and then monitored for solid precipitation. Figure 7 presents the image of the samples after 30 days. This figure shows a clear solution was achieved with no precipitation after 30 days for both samples. This finding proves that the PS green surfactant works well with FB at low (12,500 ppm) and high (150,000 ppm) salinity conditions.
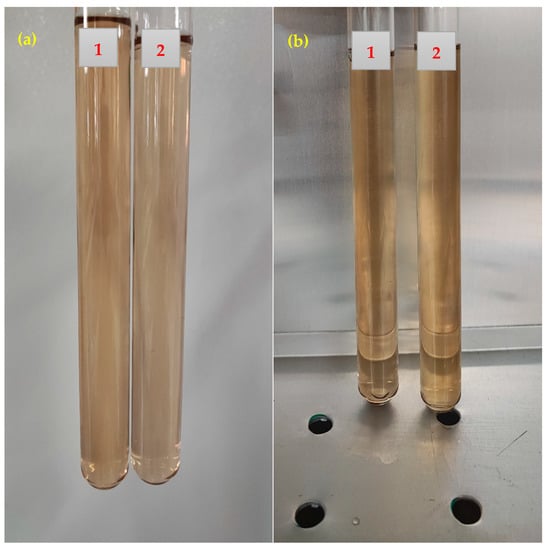
Figure 7.
Compatibility tests of different solutions after 30 days: (a) solutions at 30 °C; (b) solutions at 80 °C (1: 1500 ppm of PS green surfactant in 12,500 ppm of FB; 2: 1500 ppm of PS green surfactant in 150,000 ppm of FB).
3.2. Characterization of the Extracted PS Green Surfactant
The FT-IR analysis of the isolated PS green surfactant is shown in Figure 8. As illustrated, the major peaks of green surfactant are detected. The O–H stretching of the hydroxyl group in the PS green surfactant causes the peak at 3447 cm−1. The major peak at 2925 cm−1 is due to the C–H stretching of the aromatic compounds present in the PS green surfactant. The peaks at 1643 cm−1 and 1608 cm−1 are attributable to the C–C bond. The peak at 1371 cm−1 presents the C–H vibration. The peak at 1067 cm−1 presents the C–O–C vibration of the ester group, and the peak at 731 cm−1 shows the C–Br stretching. The results of the FT-IR analysis of PS green surfactant are aligned with findings presented in several previous investigations [26,27,28,29,30,31].
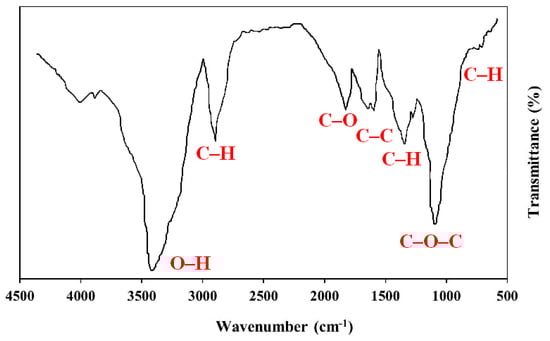
Figure 8.
FT-IR spectrum of PS surfactant.
Figure 9 indicates the TGA test results for the PS green surfactant’s thermal stability. The weight loss of the sample is around 1.73% at a reservoir temperature of 80 °C, demonstrating the extremely high thermal stability of the PS surfactant. In addition, further increasing the temperature to about 600 °C resulted in 36.74% weight loss. The weight loss of the PS surfactant at temperatures of up to around 175 °C is usually due to the evaporation of moisture and surface water. The weight loss at temperatures of 175 to 600 °C is generally due to the breakdown of glycosidic bonds and intermolecular hydrogen bonds. The TGA analysis result for the PS surfactant is on par with other green surfactants reported in the scientific literature [27,28,29,31,32].
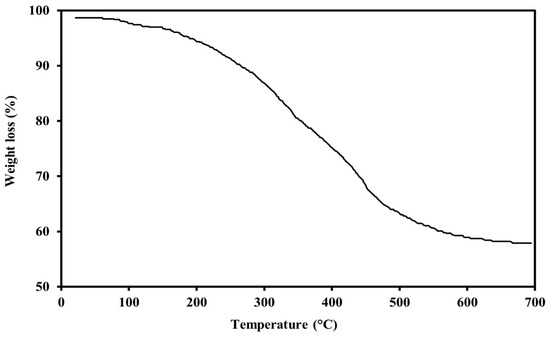
Figure 9.
TGA of green surfactant extracted from PS.
The PS green surfactant is analyzed by 1H NMR, as illustrated in Figure 10. The oligosaccharide component of saponin, which is represented in this figure at 2.8–4.9 ppm, is placed on the left side of the graph, while the aglycon component of the PS green surfactant, which is shown at 0.7–1.2 ppm, is positioned on the right side of the figure. The 1H NMR evaluation results of the PS green surfactant match remarkably with the previous findings [26,30,31].
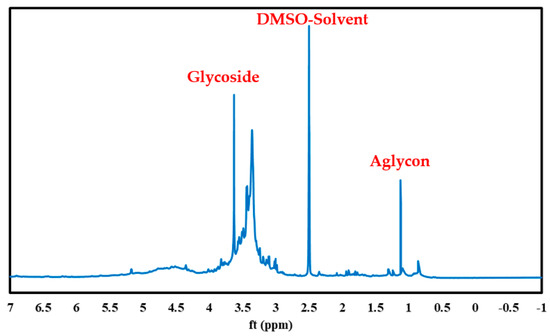
Figure 10.
1H NMR analysis of green surfactant extracted from PS.
3.3. CMC Measurements
The CMC measurement in this study was performed using two conventional tests, including IFT and contact angle measurements. Figure 11 indicates the IFT of crude oil and PS green surfactant prepared in DIW and FB at 30 and 80 °C. This figure shows that the IFT value declined quickly from its initial state to 1500 ppm. Raising the surfactant concentration to 5000 ppm had little influence on the IFT value independent of solution type and temperature. Therefore, the CMC point of the PS green surfactant is 1500 ppm.
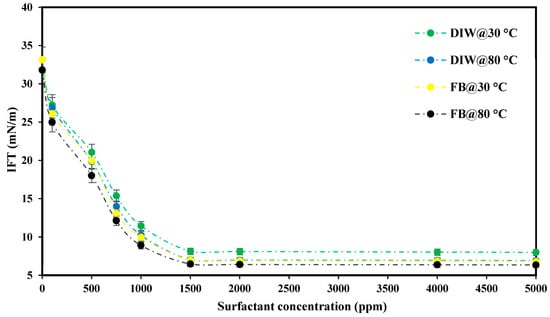
Figure 11.
IFT measurements between crude oil and extracted PS green surfactant were prepared in DIW and FB at 30 and 80 °C.
The IFT values for various solutions at the CMC point of PS green surfactant and crude oil are also shown in Table 1. As seen from the table, increasing the temperature from 30 to 80 °C benefitted the IFT value reduction for both tested solutions. In addition, among the two solutions, the best performance was acquired with FB and then DIW. IFT values of 7.02 mN/m and 6.47 mN/m were obtained with DIW and FB, respectively, at 80 °C. Raising the temperature reduces the free energy between the solution and crude oil, improving the mobility of the crude oil and water phases. In addition, the intermolecular forces at the oil–water phase interface decrease with increasing temperature, resulting in lower IFT values at 80 °C compared to 30 °C. On the other hand, using FB instead of DIW was also effective in reducing the IFT values. This study shows the presence of various ions in FB and the increase in ionic strength encourages IFT reduction [20,21,33].

Table 1.
IFT results of various solutions with crude oil at the CMC point (1500 ppm).
Figure 12 presents the CMC measurement using contact angle determination between crude oil and carbonate rock with various PS green surfactant solutions at different concentrations prepared in DIW and FB at 80 °C. As shown in this figure, the contact angle is reduced from an initial strong oil-wet to moderate oil-wet by raising the concentration of green surfactant from 100 to 5000 ppm; however, these changes are with two different slopes. The contact angle change from 100 to 1500 ppm is sharp, and this change from 1500 to 5000 ppm is nearly constant. These results imply that the PS surfactant’s CMC point is 1500 ppm. Contact angles of 116.82° and 108.39° are attained with DIW and FB, respectively, at the CMC point of 1500 ppm. Different ions in FB resulted in a better synergism between the crude oil and carbonate rock than with DIW. Therefore, lower contact angle values were achieved with FB instead of DIW.
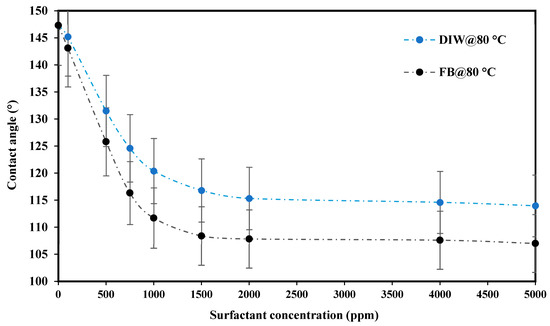
Figure 12.
Contact angle measurements between crude oil, carbonate rock, and different PS green surfactant solutions at various concentrations prepared in DIW and FB at 80 °C.
3.4. IFT Measurements
The IFT values between crude oil and varying concentrations of FB with and without the CMC of PS green surfactant (1500 ppm) at 80 °C are shown in Figure 13. This figure illustrates two different behaviors of change in the IFT values with varying concentrations of FB. The IFT values decreased as the FB concentration rose from 2500 to 12,500 ppm, whereas the IFT values increased as the concentration of FB increased to 150,000 ppm. The optimum salinity of 12,500 ppm was achieved with and without PS green surfactant, where the minimum IFT values were obtained. The IFT values between the crude oil and FB solutions were significantly decreased by adding 1500 ppm of PS green surfactant. When the optimal salinity of 12,500 ppm was considered, the IFT values of 3.71 and 19.34 mN/m were obtained between crude oil and FB solutions with and without 1500 ppm of PS green surfactant, respectively.
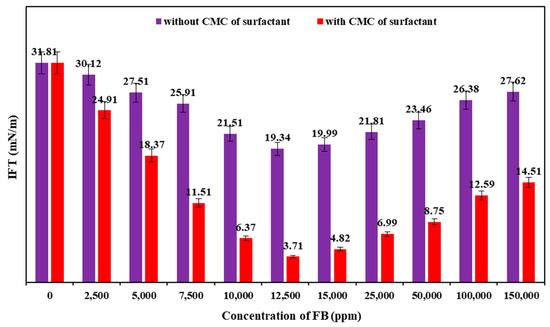
Figure 13.
IFT results of various concentrations of FB and crude oil with and without the CMC value of PS green surfactant at 80 °C.
Another observation from the IFT results is that adding 1500 ppm of PS green surfactant significantly decreased the IFT values between various concentrations of FB and crude oil. Table 2 presents the ultimate IFT reduction by adding 1500 ppm of PS green surfactant to FB at different concentrations. As shown in this table, raising the FB concentration to 12,500 ppm results in an increment in the ultimate IFT reduction, which is 15.63 mN/m. Further increasing the concentration of FB to 150,000 ppm causes a decrease in the ultimate IFT reduction. These results demonstrate that the PS green surfactant is highly compatible with the various FB solutions, especially at the optimum salinity point (12,500 ppm), which leads to reduced IFT values compared to the situations without the PS green surfactant.
Table 2.
Ultimate IFT reduction by the addition of 1500 ppm of PS green surfactant to FB solutions.
Several parameters are involved during fluid-fluid interaction for the IFT reduction in a system of FB, crude oil, and green surfactant. The controlling parameters are the salinity of FB, the type of ions and salts, the concentration of surfactant, and the composition of the crude oil. The reaction of the polar compounds in the crude oil and the salts present in the FB (especially NaCl) creates a situation that favors the IFT reduction. In the presence of green surfactant in solution, the so-called saponification process is favored, resulting in a lower IFT value in the presence of the CMC value of green surfactant in solution salinity [34,35,36,37]. Moreover, another reason to have an optimum FB salinity is the impacts of the “salting-in” and “salting-out” phenomena. At the low concentrations of FB (2500–12,500 ppm) the salting-in effects occur, in which the solubility of the organic compounds of the crude oil is increased. However, at the high concentrations of FB (15,000–150,000 ppm) the salting-out impacts occur, where the solubility of organic compounds is reduced. Hence, the tendency of the organic compounds to migrate to the oil–water interface is reduced; as a result, the IFT values are increased at high salinities of FB. The Gibbs free energy at the interface, which rises with an increase in FB salinity, is another mechanism contributing to the IFT increment at high FB salinities [38,39,40,41,42,43]. Therefore, at high concentrations of FB, the excess surface concentration of FB is negative, resulting in an increased IFT between the crude oil and FB. As a result, an optimum concentration of FB (12,500 ppm) and lower IFT values are achieved when 1500 ppm of PS green surfactant is added to the solutions.
3.5. Contact Angle Measurements
A series of contact angle tests were conducted to identify the most efficient timelapse for measuring the contact angle. The contact angle of crude oil and carbonate rock samples was measured in a solution of 1500 ppm of PS green surfactant in DIW at the reservoir temperature (80 °C). Figure 14 depicts the contact angle values of oil droplets with PS green surfactant at 1500 ppm in DIW at 80 °C at a different timelapse. As shown in this figure, the contact angle is drastically reduced at the initial stages of the experiments. With further increases in the timelapse, the contact angle value change is minimal. The contact angle is 147.31° at the beginning of the experiment, and it is reduced with increasing time; however, changes in the contact angle are not significant after reaching 150 h. The contact angle at 150 h is 116.82°, and the value is 116.56° at 210 h. Therefore, the timelapse of 150 h was selected as the optimal time to measure the contact angle values in this study. It is worth mentioning that the addition of 1500 ppm of PS green surfactant to DIW resulted in a 30° contact angle reduction after 150 h, which reveals the performance of PS surfactant in altering the rock’s wettability.
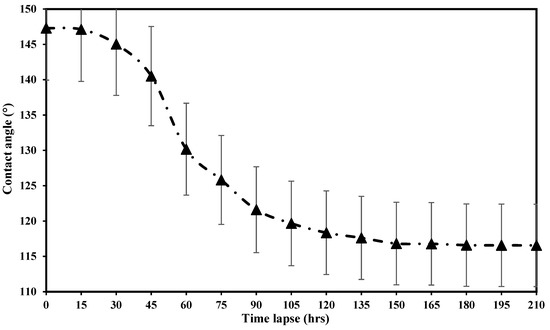
Figure 14.
The contact angle measurements with the PS green surfactant at 1500 ppm prepared in DIW at 80 °C.
Figure 15 presents the contact angle values of crude oil and carbonate rock samples with and without PS green surfactant at the CMC point (1500 ppm) at various concentrations of FB at 80 °C. These findings show that the contact angle has two different trends for increasing the concentration of FB, regardless of the solution used. Initially, the contact angle is decreased up to a concentration of 12,500 ppm of FB, at which point the minimal contact angle value is obtained. Then, the contact angle value is increased by raising the concentration of FB to 150,000 ppm. Moreover, the addition of 1500 ppm of PS green surfactant is very efficient in lowering the contact angle and altering the rock’s wettability from the oil-wet to the water-wet states. Considering the solutions without PS green surfactant, the contact angle is reduced from an initial state of 147.31° to 97.26° at 12,500 ppm of FB. It again increases to 125.64° at a concentration of 150,000 ppm. On the contrary, for the solutions containing the CMC value of PS green surfactant, the minimum contact angle of 54.37° is achieved at the concentration of 12,500 ppm of FB, and the value is increased to 108.39° at 150,000 ppm of FB.
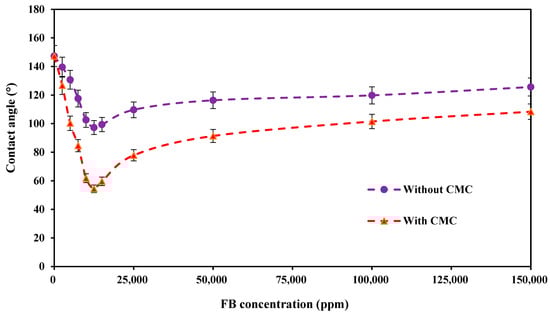
Figure 15.
Contact angle values of crude oil and carbonate rock with and without CMC of PS green surfactant at various concentrations of FB at 80 °C.
Table 3 also presents the final images of oil drops prepared with different concentrations of FB, with and without 1500 ppm of PS green surfactant, and carbonate rock samples at 80 °C. The changes in the oil drop shape are clearly shown in these images. Moreover, Table 4 shows the ultimate contact angle reduction by the addition of 1500 ppm of PS green surfactant in various concentrations of FB at 80 °C. As can be seen, adding 1500 ppm of PS surfactant (CMC point) to FB solutions significantly impacts the ultimate contact angle reduction. As shown in this table, the final contact angle reduction has risen by increasing the concentration of FB from 2500 to 12,500 ppm. Then, the contact angle reduction is decreased by further increasing the concentration of FB to 150,000 ppm. The maximum contact angle reduction of 42.89° is achieved at the optimum concentration of FB (12,500 ppm).
Table 3.
Contact angle values and oil drop images of different solutions containing 1500 ppm of PS green surfactant and variable concentrations of FB.
Table 4.
Ultimate contact angle reduction by the addition of 1500 ppm of PS green surfactant in various concentrations of FB at 80 °C.
In the absence of the PS green surfactant in solutions, the interaction between carbonate rock and various ions present in FB is the determining factor impacting the contact angle values. At low concentrations of FB (below the optimum salinity), the adsorption of polar components of crude oil onto the surface of carbonate rock changes the wettability of the rock toward a water-wet state. However, the decreased solubility of organic compounds of crude oil acts as an opposing factor and keeps the carbonate rock’s wettability in an oil-wet state. Therefore, the changes in contact angle values are not significant. At concentrations above the optimal salinity point, however, the separation between the water film and the carbonate rock surface increases due to the increasing ionic strength. As a result, the water phase is replaced with the oil phase at the carbonate rock surface, which results in increased wettability toward an oil-wet state [42,44,45,46].
In the presence of the PS green surfactant in solutions, the interactions between the green surfactant, carbonate rock minerals, and various ions present in FB are the governing factors affecting the carbonate rock’s wettability. The carbonate rock sample mainly comprises positively charged calcium (Ca2+) and magnesium (Mg2+) ions. On the other hand, the structure of PS green surfactant consists of negatively charged hydroxyl groups. Therefore, the electrostatic attraction forces between these negative and positive charges affect the carbonate rock’s wettability toward a more water-wet state. Moreover, the wettability of carbonate rock in the presence of PS green surfactant is also affected by salting-in and salting-out effects. The increased solubility of the organic components in crude oil and their adsorption on the surface of carbonate rocks change the rock’s wettability at low concentrations of FB. Additionally, the creation of a thin water film on the carbonate rock surface is improved by the adsorption of surfactant molecules on the rock. It changes the rock’s wettability toward a more water-wet condition. However, at high concentrations of FB (above the optimum salinity), the adsorption of surfactant molecules on the rock surface is hindered due to the salting-out effect, which results in slightly higher contact angle values [39,42,47,48,49].
3.6. Zeta Potential Measurements
Figure 16 shows the zeta potential values of various concentrations of FB with and without 1500 ppm of PS green surfactant at 80 °C. This figure shows that all the measured zeta potential values are negative, regardless of the solution type. The zeta potential values follow a similar pattern to the contact angle data, where the minimal zeta potential value is obtained at the concentration of 12,500 ppm of FB. Both solutions, with and without the CMC of PS green surfactant, show the same pattern. At 12,500 ppm of FB, the minimum zeta potential of −31.91 mV is achieved for the solution containing the CMC value of PS surfactant.
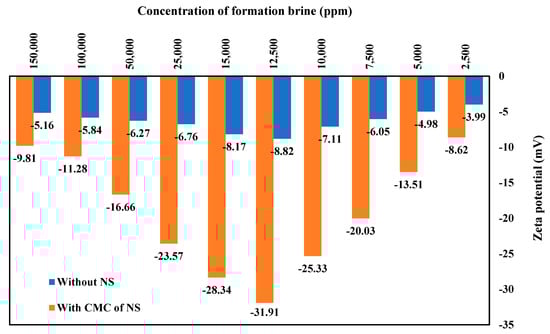
Figure 16.
Zeta potential measurements of various solutions of FB with and without natural surfactant (NS) at the CMC point (1500 ppm) at 80 °C.
The results for the zeta potential and the contact angle tests reveal a direct correlation between the two: the smaller the contact angle, the smaller the zeta potential values. The repulsive force at the interface of rock, brine, and crude oil affects the rock’s wettability, where the higher the repulsive force, the lower the contact angle value. On the other hand, the thicker the electrical double-layer expansion, the higher the zeta potential values. Adding the PS green surfactant to the solution favors this situation, where more negative values are achieved with the zeta potential. The findings of this investigation match remarkably with the previous results [46,50,51].
3.7. Emulsion Tests
The ability of the PS surfactant for emulsification was examined using static bottle tests at 80 °C. Two solutions containing 1500 ppm of PS green surfactant were prepared: the first with 12,500 ppm of FB (representing optimum salinity) and the other with 150,000 ppm of FB. Figure 17 presents the images of the two solutions after 1 h and 90 days. As depicted in this figure, pictures 1 and 2 represent the emulsion after one hour of mixing, where a single phase was produced. After 90 days, however, three different phases are identified: the oil, the emulsion, and the water columns, from top to bottom (images 3 and 4). After 90 days, the PS green surfactant successfully created an emulsion phase between the crude oil and water phases. The emulsion column height (labeled “EC”) for the solution with 1500 ppm of green surfactant and 12,500 ppm of FB (marked as 3) is higher than the emulsion column height for the solution with 1500 ppm of green surfactant and 150,000 ppm of FB (marked as 4).
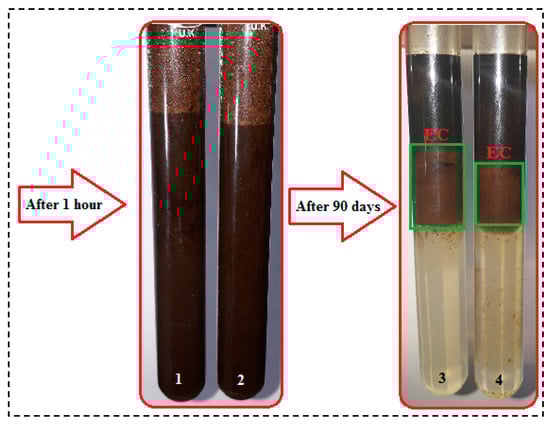
Figure 17.
Emulsion tests of different concentrations of FB with the CMC of PS green surfactant at 80 °C after 90 days.
In this study, the oil, emulsion, and water phases were clearly distinguishable in the Winsor type III emulsion produced using both solutions. The quality of the produced emulsion by the solution of FB at 12,500 ppm was much higher than that of FB at 150,000 ppm, which is due to the lower IFT value of this solution. The IFT value for the solution of 1500 ppm of PS green surfactant in 12,500 ppm of FB was 3.71 mN/m. In contrast, the value was 6.47 mN/m for the solution of 1500 ppm of PS green surfactant in 150,000 ppm of FB, resulting in a higher emulsion quality with 12,500 compared to 150,000 ppm of FB. The emulsion results obtained in this experiment are consistent with data from the literature [18,26,30,31,52].
3.8. Oil Recovery Factor Measurement
The efficiency of the PS green surfactant in improving oil recovery was investigated using core flooding experiments under reservoir conditions. In this study, two various sample solutions were made by combining the CMC value of PS green surfactant and different concentrations of FB. The first solution was 1500 ppm of PS green surfactant in 12,500 ppm of FB, and the second solution was 1500 ppm of PS green surfactant in 150,000 ppm of FB. Figure 18 presents the results of the oil recovery factor and pressure drop in both samples during secondary and tertiary recovery.
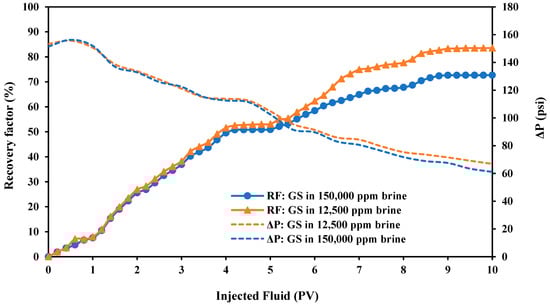
Figure 18.
Oil recovery factor and pressure drop measurements with two solutions containing the CMC value of PS green surfactant (GS) as the tertiary recovery at 80 °C.
This figure shows that an average oil recovery factor of 49% is achieved after the secondary recovery by FB flooding at 5 PVs. Surfactant solution injection, as the tertiary recovery, is highly efficient in raising the oil recovery, as displayed in Figure 18. The oil recovery factor gradually increases until it reaches the maximum value at the end of 5 PVs surfactant flooding. The maximum oil recovery factors of 72.68% and 83.55% were achieved for solutions of 1500 ppm of PS green surfactant in 150,000 ppm of FB and 1500 ppm of PS green surfactant in 12,500 ppm of FB, respectively. The preparation of green surfactant in low-salinity water (12,500 ppm of FB) was much more effective than the preparation in high salinity (150,000 ppm of FB), where the recovery factor difference was about 10.86%. The results of the oil recovery factor are aligned with the IFT and contact angle results, where the best performance and maximum compatibility at the CMC value of PS green surfactant were at 12,500 ppm of FB. In this study, the increase in the oil recovery is related to the wettability alteration of the carbonate rock sample to higher hydrophilicity and the reduction of IFT values. It should be noted that the IFT value was significantly reduced from an initial value of 31.81 mN/m to 3.71 mN/m when a solution of 12,500 ppm brine (optimum salinity) and the CMC value of the PS surfactant was used as the tertiary recovery. In addition, the contact angle value decreased from an initial value of 147.31° to 54.37° after using a solution of the PS surfactant at the CMC point and 12,500 ppm of brine. Furthermore, the capillary number is remarkably increased by adding the PS surfactant to the sample solution, which affects the amount of residual oil saturation and finally increases oil recovery. The oil recovery factor results in this experiment are consistent with data from the literature [26,30,53,54].
3.9. Capillary Number Measurement
The efficiency of chemical flooding in increasing the recovery factor was examined by applying the capillary number definition and measuring the capillary number in various situations. This work examined three scenarios: secondary recovery with 150,000 ppm of FB, tertiary recovery with 1500 ppm of green surfactant (GS) in 12,500, and 150,000 ppm of FB.
As shown in Figure 19, the capillary number was at its lowest value during the secondary recovery (1.25 × 10⁻⁵), and the residual oil saturation was about 52%. Then, applying surfactant flooding as the tertiary recovery positively impacted improvements to the capillary number, where the capillary number increased significantly. The tertiary recovery with a solution of 1500 ppm of PS green surfactant and 150,000 ppm of FB resulted in a capillary number of 3.27 × 10⁻⁵ with a residual oil saturation of 27%. For the best case, where 1500 ppm of PS green surfactant was prepared in 12,500 ppm of FB, the capillary number was increased to 1.10 × 10⁻⁴ with a residual oil saturation of 16%. The capillary number values showed that applying PS green surfactant and the optimum concentration of FB (12,500 ppm) was very effective in improving the oil recovery and reducing the residual oil saturation. The findings of capillary numbers in this experiment are consistent with data from the literature [55,56].
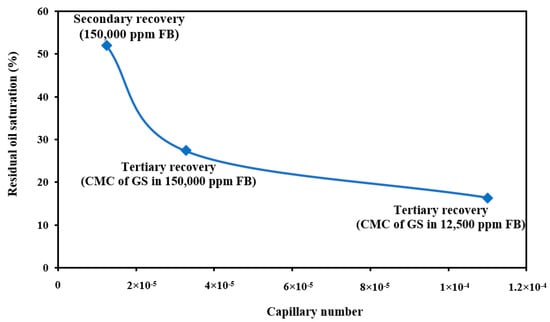
Figure 19.
Capillary number calculations with three different solutions.
4. Conclusions
The Pisum sativum (PS) was used in this investigation to produce a novel green surfactant. Numerous tests, including IFT, contact angle, zeta potential, oil recovery factor measurements, and capillary number calculations, were used to determine the performance of the extracted green surfactant for EOR purposes in the carbonate reservoirs. The research findings could be summed up as follows:
- The physical and chemical characterization of the PS surfactant showed that the extracted saponin from the PS was a nonionic surfactant.
- Based on the findings of the CMC measurements, it was determined that the PS surfactant’s CMC point is 1500 ppm.
- The lowest IFT and contact angle values were achieved at 12,500 ppm of FB, which was the optimum salinity point.
- The lowest IFT value (3.71 mN/m) and the minimum contact angle value (54.37°) were attained at 12,500 ppm of FB.
- The quality of the Winsor type III emulsion for the solution prepared using 1500 ppm of PS green surfactant in 12,500 ppm of FB was higher than the solution prepared using 1500 ppm of PS green surfactant in 150,000 ppm of FB.
- Based on the oil recovery factor measurements, the maximum recovery factor of 83.55% was attained after tertiary recovery using a solution of 1500 ppm of green surfactant in 12,500 ppm of FB.
- The capillary number calculation showed that the capillary number was increased from 1.25 × 10⁻⁵ for the secondary recovery to 1.10 × 10⁻⁴ after the tertiary recovery.
Author Contributions
Conceptualization, A.A. and E.M.; methodology, M.N. and A.A.; validation, A.A. and E.M.; formal analysis, Y.G. and L.Z.; investigation, A.A., E.M. and L.Z.; data curation, L.Z. and Y.G.; writing—original draft preparation, M.N. and A.A.; writing—review and editing, E.M., L.Z. and B.L.; supervision, A.A., B.L. and E.M.; project administration, B.L., E.M. and L.Z.; funding acquisition, B.L., E.M. and L.Z. All authors have read and agreed to the published version of the manuscript.
Funding
The authors would like to express their appreciation to the Natural Science Foundation of Heilongjiang Province (TD2021D001) for financial support of this experimental work.
Data Availability Statement
The data presented in this study are available on request from the corresponding author. The data are not publicly available due to privacy.
Acknowledgments
The authors would like to express their appreciation to the Department of Petroleum Engineering, Faculty of Engineering, Marvdasht Islamic Azad University, Marvdasht, Iran, for providing the lab space needed.
Conflicts of Interest
The authors declare that they have no known competing financial interests or personal relationships that could have appeared to influence the work reported in this paper.
References
- Qazvini, S.; Golkari, A.; Azdarpour, A.; Santos, R.M.; Safavi, M.S.; Norouzpour, M. Experimental and Modelling Approach to Investigate the Mechanisms of Formation Damage Due to Calcium Carbonate Precipitation in Carbonate Reservoirs. J. Pet. Sci. Eng. 2021, 205, 108801. [Google Scholar] [CrossRef]
- Liu, B.; Wang, Y.; Tian, S.; Guo, Y.; Wang, L.; Yasin, Q.; Yang, J. Impact of Thermal Maturity on the Diagenesis and Porosity of Lacustrine Oil-Prone Shales: Insights from Natural Shale Samples with Thermal Maturation in the Oil Generation Window. Int. J. Coal. Geol. 2022, 261, 104079. [Google Scholar] [CrossRef]
- Giraldo, L.J.; Galeano-Caro, D.; Franco, C.A.; Archila, J.; Villamil, F.; Cortés, F.B.; Franco, C.A. Development of a Novel Green Bio-Nanofluid from Sapindus Saponaria for Enhanced Oil Recovery Processes. Processes 2022, 10, 1057. [Google Scholar] [CrossRef]
- Tan, Y.; Zhang, Y.; Hui, C.; Yu, C.; Tian, S.; Wang, T.; Wang, F. Resonance-Enhanced Pulsing Water Injection for Improved Oil Recovery: Micromodel Experiments and Analysis. Processes 2023, 11, 957. [Google Scholar] [CrossRef]
- Wang, Y.; Jiang, H.; Li, L.; Wang, L.; Li, J. Flow Physics of Profile Control Fluids in Porous Media and Implications for Enhanced Oil Recovery: A Microfluidic Study. Processes 2022, 10, 112. [Google Scholar] [CrossRef]
- Cheraghian, G.; Rostami, S.; Afrand, M. Nanotechnology in Enhanced Oil Recovery. Processes 2020, 8, 1073. [Google Scholar] [CrossRef]
- Omran, M.; Akarri, S.; Torsaeter, O. The Effect of Wettability and Flow Rate on Oil Displacement Using Polymer-Coated Silica Nanoparticles: A Microfluidic Study. Processes 2020, 8, 991. [Google Scholar] [CrossRef]
- Numin, M.S.; Jumbri, K.; Ramli, A.; Borhan, N. Microemulsion Rheological Analysis of Alkaline, Surfactant, and Polymer in Oil-Water Interface. Processes 2020, 8, 762. [Google Scholar] [CrossRef]
- Shi, L.; Zhu, S.; Guo, Z.; Zhao, W.; Xue, X.; Wang, X.; Ye, Z. Experimental Study on the Effect of Polymer Injection Timing on Oil Displacement in Porous Media. Processes 2020, 8, 93. [Google Scholar] [CrossRef]
- Scott, A.J.; Romero-Zerón, L.; Penlidis, A. Evaluation of Polymeric Materials for Chemical Enhanced Oil Recovery. Processes 2020, 8, 361. [Google Scholar] [CrossRef]
- Azdarpour, A.; Rahmani, O.; Mohammadian, E.; Parak, M.; Daud, A.R.M.; Junin, R. The Effects of Polymer and Surfactant on Polymer Enhanced Foam Stability. In Proceedings of the 2013 IEEE Business Engineering and Industrial Applications Colloquium (BEIAC), Langkawi, Malaysia, 7–9 April 2013; pp. 97–102. [Google Scholar]
- Zeng, Y.; Kamarul Bahrim, R.Z.; Groot, J.A.W.M.; Vincent-Bonnieu, S.; Groenenboom, J.; Mohd Shafian, S.R.; Abdul Manap, A.A.; Tewari, R.D.; Mohammadian, E.; Azdarpour, A.; et al. Probing Methane Foam Transport in Heterogeneous Porous Media: An Experimental and Numerical Case Study of Permeability-Dependent Rheology and Fluid Diversion at Field Scale. SPE J. 2020, 25, 1697–1710. [Google Scholar] [CrossRef]
- Razzaghi-Koolaee, F.; Mehrabianfar, P.; Soulgani, B.S.; Esfandiarian, A. A Comprehensive Study on the Application of a Natural Plant-Based Surfactant as a Chemical Enhanced Oil Recovery (CEOR) Agent in the Presence of Different Ions in Carbonate Reservoirs. J. Environ. Chem. Eng. 2022, 10, 108572. [Google Scholar] [CrossRef]
- Chhetri, A.B.; Watts, K.C.; Rahman, M.S.; Islam, M.R. Soapnut Extract as a Natural Surfactant for Enhanced Oil Recovery. Energy Sources Part A Recovery Util. Environ. Eff. 2009, 31, 1893–1903. [Google Scholar] [CrossRef]
- Derikvand, Z.; Rezaei, A.; Parsaei, R.; Riazi, M.; Torabi, F. A Mechanistic Experimental Study on the Combined Effect of Mg2+, Ca2+, and SO42- Ions and a Cationic Surfactant in Improving the Surface Properties of Oil/Water/Rock System. Colloids Surf. A Physicochem. Eng. Asp. 2020, 587, 124327. [Google Scholar] [CrossRef]
- Deymeh, H.; Shadizadeh, S.R.; Motafakkerfard, R. Experimental Investigation of Seidlitzia Rosmarinus Effect on Oil–Water Interfacial Tension: Usable for Chemical Enhanced Oil Recovery. Sci. Iran. 2012, 19, 1661–1664. [Google Scholar] [CrossRef]
- Saxena, N.; Pal, N.; Dey, S.; Mandal, A. Characterizations of Surfactant Synthesized from Palm Oil and Its Application in Enhanced Oil Recovery. J. Taiwan Inst. Chem. Eng. 2017, 81, 343–355. [Google Scholar] [CrossRef]
- Saxena, N.; Goswami, A.; Dhodapkar, P.K.; Nihalani, M.C.; Mandal, A. Bio-Based Surfactant for Enhanced Oil Recovery: Interfacial Properties, Emulsification and Rock-Fluid Interactions. J. Pet. Sci. Eng. 2019, 176, 299–311. [Google Scholar] [CrossRef]
- Kumar, S.; Saxena, N.; Mandal, A. Synthesis and Evaluation of Physicochemical Properties of Anionic Polymeric Surfactant Derived from Jatropha Oil for Application in Enhanced Oil Recovery. J. Ind. Eng. Chem. 2016, 43, 106–116. [Google Scholar] [CrossRef]
- Imuetinyan, H.; Agi, A.; Gbadamosi, A.; Junin, R.; Oseh, J. Oil-Water Interfacial Tension, Wettability Alteration and Foaming Studies of Natural Surfactant Extracted from Vernonia Amygdalina. Pet. Res. 2021, 7, 350–356. [Google Scholar] [CrossRef]
- Mehrabianfar, P.; Bahraminejad, H.; Manshad, A.K. An Introductory Investigation of a Polymeric Surfactant from a New Natural Source in Chemical Enhanced Oil Recovery (CEOR). J. Pet. Sci Eng. 2021, 198, 108172. [Google Scholar] [CrossRef]
- Eslahati, M.; Mehrabianfar, P.; Isari, A.A.; Bahraminejad, H.; Manshad, A.K.; Keshavarz, A. Experimental Investigation of Alfalfa Natural Surfactant and Synergistic Effects of Ca2+, Mg2+, and SO42− Ions for EOR Applications: Interfacial Tension Optimization, Wettability Alteration and Imbibition Studies. J. Mol. Liq. 2020, 310, 113123. [Google Scholar] [CrossRef]
- Yekeen, N.; Malik, A.A.; Idris, A.K.; Reepei, N.I.; Ganie, K. Foaming Properties, Wettability Alteration and Interfacial Tension Reduction by Saponin Extracted from Soapnut (Sapindus Mukorossi) at Room and Reservoir Conditions. J. Pet. Sci. Eng. 2020, 195, 107591. [Google Scholar] [CrossRef] [PubMed]
- Saxena, N.; Saxena, A.; Mandal, A. Synthesis, Characterization and Enhanced Oil Recovery Potential Analysis through Simulation of a Natural Anionic Surfactant. J. Mol. Liq. 2019, 282, 545–556. [Google Scholar] [CrossRef]
- Moradi, S.; Isari, A.A.; Bachari, Z.; Mahmoodi, H. Combination of a New Natural Surfactant and Smart Water Injection for Enhanced Oil Recovery in Carbonate Rock: Synergic Impacts of Active Ions and Natural Surfactant Concentration. J. Pet. Sci Eng. 2019, 176, 1–10. [Google Scholar] [CrossRef]
- Sami, B.; Azdarpour, A.; Honarvar, B.; Nabipour, M.; Keshavarz, A. Application of a Novel Natural Surfactant Extracted from Avena Sativa for Enhanced Oil Recovery during Low Salinity Water Flooding: Synergism of Natural Surfactant with Different Salts. J. Mol. Liq. 2022, 362, 119693. [Google Scholar] [CrossRef]
- Reim, V.; Rohn, S. Characterization of Saponins in Peas (Pisum sativum L.) by HPTLC Coupled to Mass Spectrometry and a Hemolysis Assay. Food Res. Int. 2015, 76, 3–10. [Google Scholar] [CrossRef]
- Ge, J.; Sun, C.-X.; Corke, H.; Gul, K.; Gan, R.-Y.; Fang, Y. The Health Benefits, Functional Properties, Modifications, and Applications of Pea (Pisum sativum L.) Protein: Current Status, Challenges, and Perspectives. Compr. Rev. Food Sci. Food Saf. 2020, 19, 1835–1876. [Google Scholar] [CrossRef]
- Petropoulou, K.; Salt, L.J.; Edwards, C.H.; Warren, F.J.; Garcia-Perez, I.; Chambers, E.S.; Alshaalan, R.; Khatib, M.; Perez-Moral, N.; Cross, K.L.; et al. A Natural Mutation in Pisum sativum L. (Pea) Alters Starch Assembly and Improves Glucose Homeostasis in Humans. Nat. Food 2020, 1, 693–704. [Google Scholar] [CrossRef]
- Norouzpour, M.; Azdarpour, A.; Nabipour, M.; Santos, R.M.; Manshad, A.K.; Iglauer, S.; Akhondzadeh, H.; Keshavarz, A. Red Beet Plant as a Novel Source of Natural Surfactant Combined with ‘Smart Water’ for EOR Purposes in Carbonate Reservoirs. J. Mol. Liq. 2023, 370, 121051. [Google Scholar] [CrossRef]
- Norouzpour, M.; Nabipour, M.; Azdarpour, A.; Akhondzadeh, H.; Santos, R.M.; Keshavarz, A. Experimental Investigation of the Effect of a Quinoa-Derived Saponin-Based Green Natural Surfactant on Enhanced Oil Recovery. Fuel 2022, 318, 123652. [Google Scholar] [CrossRef]
- Wu, T.; Cheng, J.; Zhang, J.; Zhao, H.; Sui, W.; Zhu, Q.; Jin, Y.; Zhang, M. Hypoglycemic Activity of Self-Assembled Gellan Gum-Soybean Isolate Composite Hydrogel-Embedded Active Substance-Saponin. Foods 2022, 11, 3729. [Google Scholar] [CrossRef]
- Emadi, S.; Shadizadeh, S.R.; Manshad, A.K.; Rahimi, A.M.; Nowrouzi, I.; Mohammadi, A.H. Effect of Using Zyziphus Spina Christi or Cedr Extract (CE) as a Natural Surfactant on Oil Mobility Control by Foam Flooding. J. Mol. Liq. 2019, 293, 111573. [Google Scholar] [CrossRef]
- Nowrouzi, I.; Mohammadi, A.H.; Manshad, A.K. Double-Chain Single-Head Modification of Extracted Saponin from Anabasis Setifera Plant and Its Effects on Chemical Enhanced Oil Recovery Process by Surfactant-Alkali Slug Injection into Carbonate Oil Reservoirs. J. Pet. Sci. Eng. 2021, 201, 108438. [Google Scholar] [CrossRef]
- Khayati, H.; Moslemizadeh, A.; Shahbazi, K.; Moraveji, M.K.; Riazi, S.H. An Experimental Investigation on the Use of Saponin as a Non-Ionic Surfactant for Chemical Enhanced Oil Recovery (EOR) in Sandstone and Carbonate Oil Reservoirs: IFT, Wettability Alteration, and Oil Recovery. Chem. Eng. Res. Des. 2020, 160, 417–425. [Google Scholar] [CrossRef]
- Nafisifar, A.; Manshad, A.K.; Shadizadeh, S.R. Evaluation of a New Green Synthesized Surfactant from Linseeds-Chemical EOR Implications from Sandstone Petroleum Reservoirs. J. Mol. Liq. 2021, 342, 117263. [Google Scholar] [CrossRef]
- Shahri, M.P.; Shadizadeh, S.R.; Jamialahmadi, M. A New Type of Surfactant for Enhanced Oil Recovery. Pet. Sci. Technol. 2012, 30, 585–593. [Google Scholar] [CrossRef]
- Maghsoudian, A.; Esfandiarian, A.; Kord, S.; Tamsilian, Y.; Soulgani, B.S. Direct Insights into the Micro and Macro Scale Mechanisms of Symbiotic Effect of SO42−, Mg2+, and Ca2+ Ions Concentration for Smart Waterflooding in the Carbonated Coated Micromodel System. J. Mol. Liq. 2020, 315, 113700. [Google Scholar] [CrossRef]
- Esfandiarian, A.; Maghsoudian, A.; Shirazi, M.; Tamsilian, Y.; Kord, S.; Sheng, J.J. Mechanistic Investigation of the Synergy of a Wide Range of Salinities and Ionic Liquids for Enhanced Oil Recovery: Fluid–Fluid Interactions. Energy Fuels 2021, 35, 3011–3031. [Google Scholar] [CrossRef]
- Lashkarbolooki, M.; Ayatollahi, S.; Riazi, M. Mechanistical Study of Effect of Ions in Smart Water Injection into Carbonate Oil Reservoir. Process Saf. Environ. Prot. 2017, 105, 361–372. [Google Scholar] [CrossRef]
- Lashkarbolooki, M.; Riazi, M.; Hajibagheri, F.; Ayatollahi, S. Low Salinity Injection into Asphaltenic-Carbonate Oil Reservoir, Mechanistical Study. J. Mol. Liq. 2016, 216, 377–386. [Google Scholar] [CrossRef]
- Haghighi, A.N.; Nabipour, M.; Azdarpour, A.; Honarvar, B. Mechanistic Investigation of Using Optimum Saline Water in Carbonate Reservoirs Low Asphaltenic Crude Oil with High Resin Content: A Carbonate-Coated Microfluidic Study. J. Mol. Liq. 2022, 368, 120806. [Google Scholar] [CrossRef]
- Saxena, N.; Kumar, A.; Mandal, A. Adsorption Analysis of Natural Anionic Surfactant for Enhanced Oil Recovery: The Role of Mineralogy, Salinity, Alkalinity and Nanoparticles. J. Pet. Sci. Eng. 2019, 173, 1264–1283. [Google Scholar] [CrossRef]
- Manshad, A.K.; Nowrouzi, I.; Mohammadi, A.H. Effects of Water Soluble Ions on Wettability Alteration and Contact Angle in Smart and Carbonated Smart Water Injection Process in Oil Reservoirs. J. Mol. Liq. 2017, 244, 440–452. [Google Scholar] [CrossRef]
- Ahmadi, M.A.; Arabsahebi, Y.; Shadizadeh, S.R.; Behbahani, S.S. Preliminary Evaluation of Mulberry Leaf-Derived Surfactant on Interfacial Tension in an Oil-Aqueous System: EOR Application. Fuel 2014, 117, 749–755. [Google Scholar] [CrossRef]
- Ahmadi, P.; Asaadian, H.; Khadivi, A.; Kord, S. A New Approach for Determination of Carbonate Rock Electrostatic Double Layer Variation towards Wettability Alteration. J. Mol. Liq. 2019, 275, 682–698. [Google Scholar] [CrossRef]
- Zargar, G.; Arabpour, T.; Manshad, A.K.; Ali, J.A.; Sajadi, S.M.; Keshavarz, A.; Mohammadi, A.H. Experimental Investigation of the Effect of Green TiO2/Quartz Nanocomposite on Interfacial Tension Reduction, Wettability Alteration, and Oil Recovery Improvement. Fuel 2020, 263, 116599. [Google Scholar] [CrossRef]
- Yusuf, S.M.; Junin, R.; Sidek, M.A.M.; Agi, A.; Fuad, M.F.I.A.; Rosli, N.R.; Rahman, N.A.; Yahya, E.; Wong, N.A.M.S.; Mustaza, M.H. Screening the Synergy of Sodium Dodecylbenzenesulfonate and Carboxymethyl Cellulose for Surfactant-Polymer Flooding. Pet. Res. 2021, 7, 308–317. [Google Scholar] [CrossRef]
- Zendehboudi, S.; Ahmadi, M.A.; Rajabzadeh, A.R.; Mahinpey, N.; Chatzis, I. Experimental Study on Adsorption of a New Surfactant onto Carbonate Reservoir Samples—Application to EOR. Can. J. Chem. Eng. 2013, 91, 1439–1449. [Google Scholar] [CrossRef]
- Chen, L.; Zhang, G.; Wang, L.; Wu, W.; Ge, J. Zeta Potential of Limestone in a Large Range of Salinity. Colloids Surf. A Physicochem. Eng. Asp. 2014, 450, e109364. [Google Scholar] [CrossRef]
- Kazemzadeh, Y.; Ismail, I.; Rezvani, H.; Sharifi, M.; Riazi, M. Experimental Investigation of Stability of Water in Oil Emulsions at Reservoir Conditions: Effect of Ion Type, Ion Concentration, and System Pressure. Fuel 2019, 243, 15–27. [Google Scholar] [CrossRef]
- Gu, Y.; Chen, S.; Liu, H.; Wang, Y.; Zhou, P. Effect of Monovalent Anions on Cationic Gemini Micro-Emulsion. Chin. J. Chem. Eng. 2018, 26, 2636–2640. [Google Scholar] [CrossRef]
- Nowrouzi, I.; Mohammadi, A.H.; Manshad, A.K. Characterization and Likelihood Application of Extracted Mucilage from Hollyhocks Plant as a Natural Polymer in Enhanced Oil Recovery Process by Alkali-Surfactant-Polymer (ASP) Slug Injection into Sandstone Oil Reservoirs. J. Mol. Liq. 2020, 320, 114445. [Google Scholar] [CrossRef]
- Manshad, A.K.; Olad, M.; Taghipour, S.A.; Nowrouzi, I.; Mohammadi, A.H. Effects of Water Soluble Ions on Interfacial Tension (IFT) between Oil and Brine in Smart and Carbonated Smart Water Injection Process in Oil Reservoirs. J. Mol. Liq. 2016, 223, 987–993. [Google Scholar] [CrossRef]
- Guo, H.; Song, K.; Hilfer, R. A Brief Review of Capillary Number and Its Use in Capillary Desaturation Curves. Transp. Porous. Media 2022, 144, 3–31. [Google Scholar] [CrossRef]
- Wijaya, N.; Sheng, J.J. Uncertainty Quantification of Shale Capillary Desaturation Curves for Surfactant EOR in Shale through Fracturing Fluids Using Predictive Modeling. Fuel 2021, 283, 118857. [Google Scholar] [CrossRef]


Disclaimer/Publisher’s Note: The statements, opinions and data contained in all publications are solely those of the individual author(s) and contributor(s) and not of MDPI and/or the editor(s). MDPI and/or the editor(s) disclaim responsibility for any injury to people or property resulting from any ideas, methods, instructions or products referred to in the content. |
© 2023 by the authors. Licensee MDPI, Basel, Switzerland. This article is an open access article distributed under the terms and conditions of the Creative Commons Attribution (CC BY) license (https://creativecommons.org/licenses/by/4.0/).