Article

Data-Driven Evaluation of the Synergistic Development of Economic-Social-Environmental Benefits for the Logistics Industry

1
Business School, Suzhou University, Suzhou 234000, China
2
Center for International Education, Philippine Christian University, Manila 1004, Philippines
*
Authors to whom correspondence should be addressed.
Processes 2023, 11(3), 913; https://doi.org/10.3390/pr11030913
Submission received: 8 February 2023 / Revised: 10 March 2023 / Accepted: 15 March 2023 / Published: 17 March 2023
(This article belongs to the Special Issue Sustainable Supply Chains in Industrial Engineering and Management)

Abstract

:
The receding globalization has reshaped the logistics industry, while the additional pressure of the COVID-19 pandemic has posed new difficulties and challenges as has the pressure towards sustainable development. Achieving the synergistic development of economic, social, and environmental benefits in the logistics industry is essential to achieving its high-quality development. Therefore, we propose a data-driven calculation, evaluation, and enhancement method for the synergistic development of the composite system of economic, social, and environmental benefits (ESE-B) of the logistics industry. Based on relevant data, the logistics industry ESE-B composite system sequential parametric index system is then constructed. The Z-score is applied to standardize the original index data without dimension, and a collaborative degree model of logistics industry ESE-B composite system is constructed to estimate the coordinated development among the subsystems of the logistics industry’s ESE-B system. The method is then applied to the development of the logistics industry in Anhui Province, China from 2011 to 2020. The results provide policy recommendations for the coordinated development of the logistics industry. This study provides theoretical and methodological support for the sustainable development aspects of the logistics industry.

1. Introduction

1.1. Background

Currently, the world is experiencing the largest changes in a century [1]. Further, the “second generation” open policy with regulatory convergence at its core has triggered a new round of global economic and trade rules games, and the global pattern is showing an evolutionary trend of accelerated multipolar development [2]. Given the reshaping of the global value chain, how can the logistics industry (LI) develop itself? In today’s international multilateral environment, sustainable development should take precedence and the LI should achieve the synergistic development of economic, social, and environmental benefits (ESE-B) for sustainable development. As a link between production and consumption, the LI plays an important role in supporting and guaranteeing the regional economic development process and has become a new driving force for economic growth and social development [3]. For example, the LI provides a large number of employment opportunities and creates tax revenue but, at present, while the LI is playing an increasing role in promoting regional economic development, its negative impact on the ecological environment and society is also becoming increasingly obvious, and the rapidly developing LI will inevitably produce a series of environmental problems such as increased waste emissions, aggravated air pollution and increased energy consumption, as well as increased traffic accidents and noise pollution. For example, the average energy consumption of China’s LI over 2009–2019 accounted for 8.44% of the total energy consumption [4].
Therefore, in the context of global sustainable development, it is the goal and motivation of this article to define the synergistic development of economic, social and environmental benefits of the logistics industry, evaluate the level of their synergistic development, realize the synergistic development of economic, social and environmental benefits of the logistics industry, propose suggestions for the government and practitioners to enhance the synergistic development of economic, social and environmental benefits of the logistics industry, and promote the sustainable development aspects of the logistics industry.

1.2. Research Overview

Achieving the synergistic development of economic, social, and environmental benefits of the logistics industry is essential to achieving its high-quality development [3,4]. Synergetics, founded by the German physicist Haken, is the study of the way in which subsystems within open systems work in concert and interact with each other to evolve the system from disorder to order [5,6]. The idea of sustainable development was first introduced in the World Conservation Strategy in 1980 and has since become a common worldwide effort [7]. Sustainable development chiefly alludes to ensuring that development of the population, economy, resources, society, and surrounding conditions, as well as the overall human development, does not deprive future generations of good living conditions [8,9,10]. Many studies on the synergistic development of the logistics industry are centered on the synergy with other industries; therefore, the literature mainly covers the following aspects [11,12,13].
(1)
Research on synergistic development of logistics industry
Scholars have mostly studied the coordinated development of the logistics industry with other industries. For instance, Gordon et al. considered that the productive service industries, including logistics, play an important role in the development of manufacturing industry [14]. Hu and Shu [15] studied the coordinated development of the LI and agricultural ecosystem, and the path selection for the coordinated development of agricultural logistics so that the ecosystem can be optimized. Liang and Gu [16] studied the level of synergistic development between agriculture and LI in China from 2010 to 2019 and its temporal trends, and measured the correlation between the two industries using a gray correlation model to explore the key factors affecting the synergistic development of the two industries. Scholars likewise focused on the coordinated development of the LI and the regional economy, with Klaus [17] arguing that the logistics expenditure of a country is proportional to its national economic wealth, finding that, with the increasing global integration, logistics has become the basis of wealth. Chen et al. [18] studied the coordinated development paths of logistics and the economy in metropolitan cities based on the coordinated development theory. The academic research on the relationship between the LI and economic system and other industries has achieved fruitful results, thus confirming that the LI and other industries, as well as the regional economy, can promote each other and develop together. However, there are fewer studies on the synergistic development of the subsystems within the logistics industry.
With increased financial globalization, deepening environmental degradation, and overexploitation of assets and energy, all modern logistics activities can have positive or bad impacts on the ecological surrounding conditions [19], and the relationship between LI and the environment is gradually becoming a research hotspot. Liu et al. [20] used data from 42 Asian countries between 2007 and 2016 to demonstrate that logistics performance is significantly related to environmental degradation. Zhou [21] took the regional “logistics-ecological environment” composite system as research object, and based on the synergy theory, studied the coordinated development of regional logistics and ecological environment from the perspective of low carbon. Evangelista [22] studied the environmental performance of third-party logistics service companies and proved that these companies assume a critical part in reducing carbon emissions and improving the ecological execution of logistics. Overall, the studies on the relationship between the LI and environment have concluded that the LI and environment can develop in a mutually supportive manner. However, the studies treat the environment as an independent system, which cannot reflect the environmental impact of the logistics industry, and does not consider the social impact aspect of the logistics industry.
(2)
ESE-B synergy evaluation study in the logistics industry
When scholars study system coordination relationships, they generally construct evaluation index systems, collect data, and then use models to evaluate these systems. In constructing an evaluation index system, the LI is generally considered from the input-output perspective, the logistics economy from the growth level and foreign trade, and the logistics environment from pollution and carbon emissions [23,24,25]. These indicators do not fully reflect the benefits generated by the logistics industry, or are not closely related to the development of the logistics industry, and do not take into account the environmental factors such as resource utilization and energy consumption directly generated by logistics activities, not to mention the social factors. In terms of research methods, most studies used coupled coordination degree and composite system synergy models to study the coordinated development of two or more systems. Yu and Yin [26] studied the ESE-B of urban public transportation infrastructure using a coupled coordination degree model and investigated the influence of three benefits on its coordinated development level using a panel regression model. Li et al. [27] studied the growth and environmental impacts of green logistics performance in One Belt, One Road Initiative countries during 2007–2019 using least squares and generalized method of moments. There are also several other representative methods, such as data envelopment analysis to measure the low-carbon efficiency of LI [28,29] and the energy value approach to study the sustainability of logistics systems [30]. These methods have been proven to be better methods for studying synergistic relationships through theoretical and practical validation; however, development of more scientific measures for evaluating synergistic relationships is the direction of future research.
Based on these studies, scholars have each put forward policy recommendations to help increase the coordinated development of the LI and the economy or the environment, such as carrying out logistics infrastructure development, strengthening technological innovation, and creating a favorable environment [31,32].

1.3. Limitations of Prior Studies

In general, the extant research on coordinated development issues related to the LI has achieved clear results and has established a decent starting point for the study of the LI complex system, but due to the different perspectives and depths of scholars’ understanding, the existing research needs further improvement as follows.
(1)
Most extant studies focus on the coordinated relationship between two systems: LI and ecological environment/regional economy/other industries, ignoring the social system. Further, most of them treated the ESE-B as independent systems instead of a single complex system; therefore, the research on LI’s ESE-B composite system needs to be expanded.
(2)
In the construction of the ESE-B index system, the selected indicators are not comprehensive or not closely related to the development of the LI, and environmental factors such as resource utilization and energy consumption directly generated by logistics activities are not considered, so that the constructed index system cannot reflect well the essence and characteristics of the ESE-B composite system of the LI. As such, there is a need to accurately construct the LI ESE-B composite index system.
(3)
The CSSDM is generally utilized, which has laid a good foundation for this paper, but it is a challenge to measure and evaluate the synergy development level of LI’s ESE-B composite system scientifically and accurately. To this end, we construct a data-driven LI’s ESE-B composite system synergy degree model.
Therefore, our research objectives are: (1) to take the logistics industry as a total system and study the economic benefits, social benefits, environmental benefits and coordination of this total system; (2) to scientifically and objectively construct evaluation indicators for the ESE-B composite system of the logistics industry; (3) to scientifically and accurately measure and evaluate the level of synergistic development of the ESE-B composite system of the logistics industry using a data-driven approach, and on this basis, to propose targeted countermeasures and suggestions.

1.4. Manuscript Structure

This study adopts the composite system synergy model to study the ESE-B composite system of the LI and then considers Anhui Province as a case study. The evaluation index system of LI’s ESE-B composite system is constructed, and the orderliness of ESE-B subsystems and the composite system synergy of LI in Anhui Province are evaluated and improved by collecting and calculating basic data on Anhui Province from 2011 to 2020. The remainder of this paper is organized as follows. The subsequent segment presents the way(s) of doing things, which introduces the data-driven methodological processes of data collection, data handling, data modeling and application. The third segment presents the case study, which estimates the level of coordinated development of the LI’s ESE-B composite system in Anhui Province, China, and evaluates and seeks to enhance the coordinated development level. The final section offers the conclusions from the study.

2. Materials and Methods
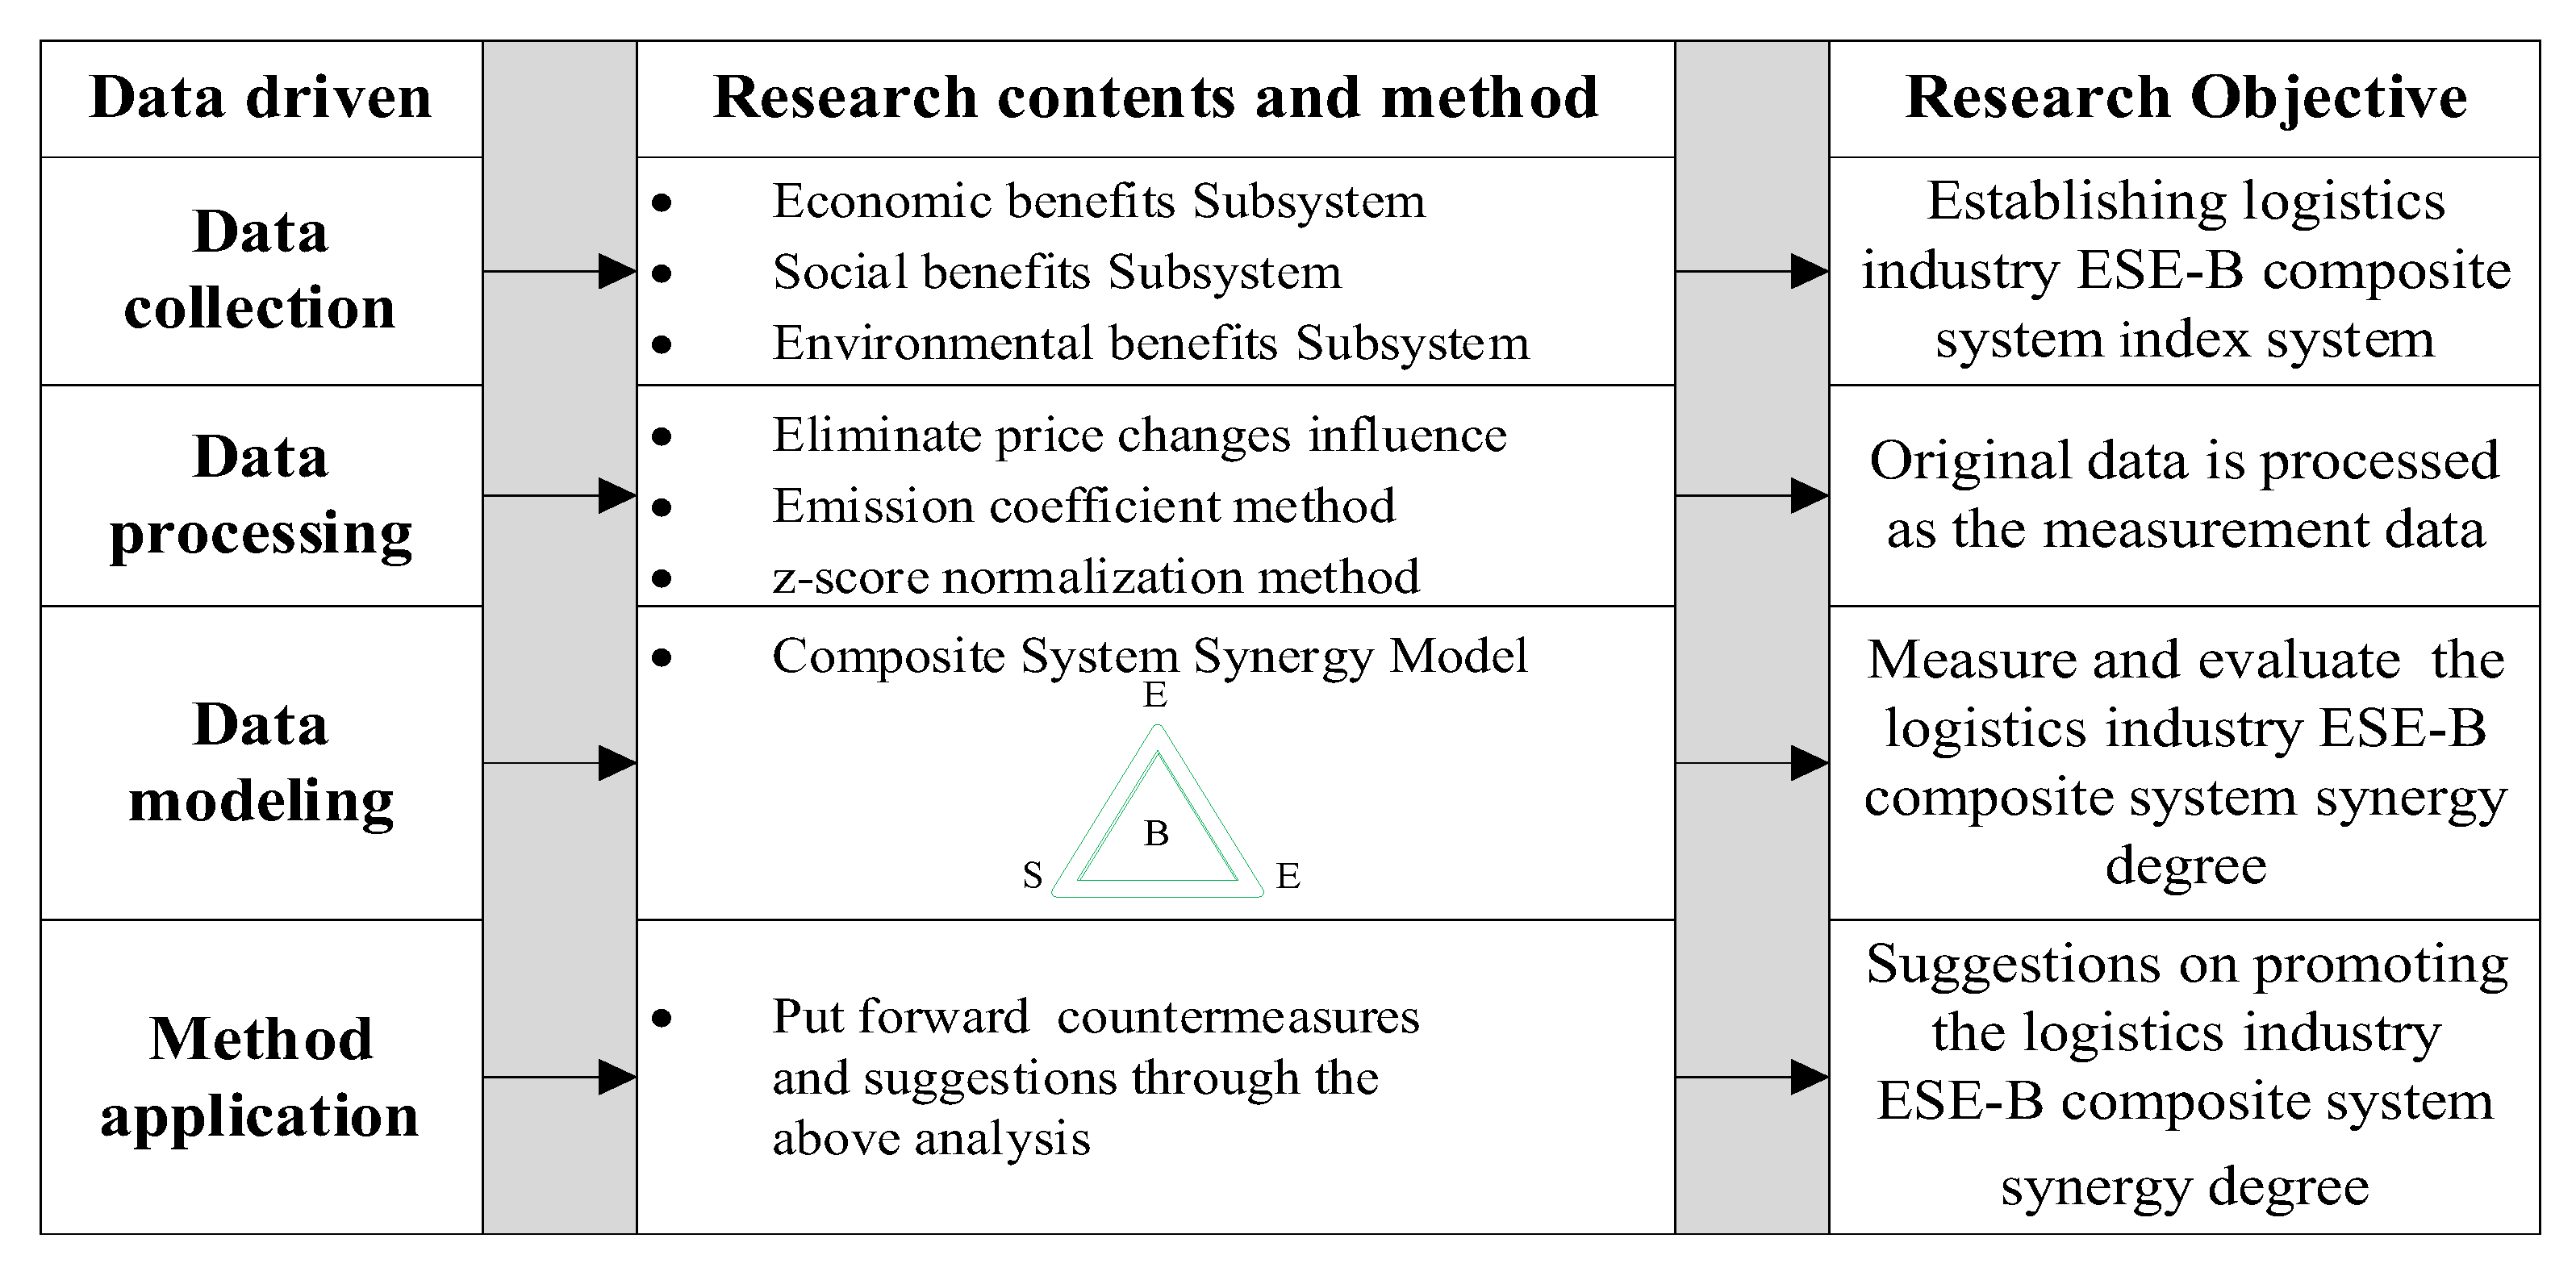
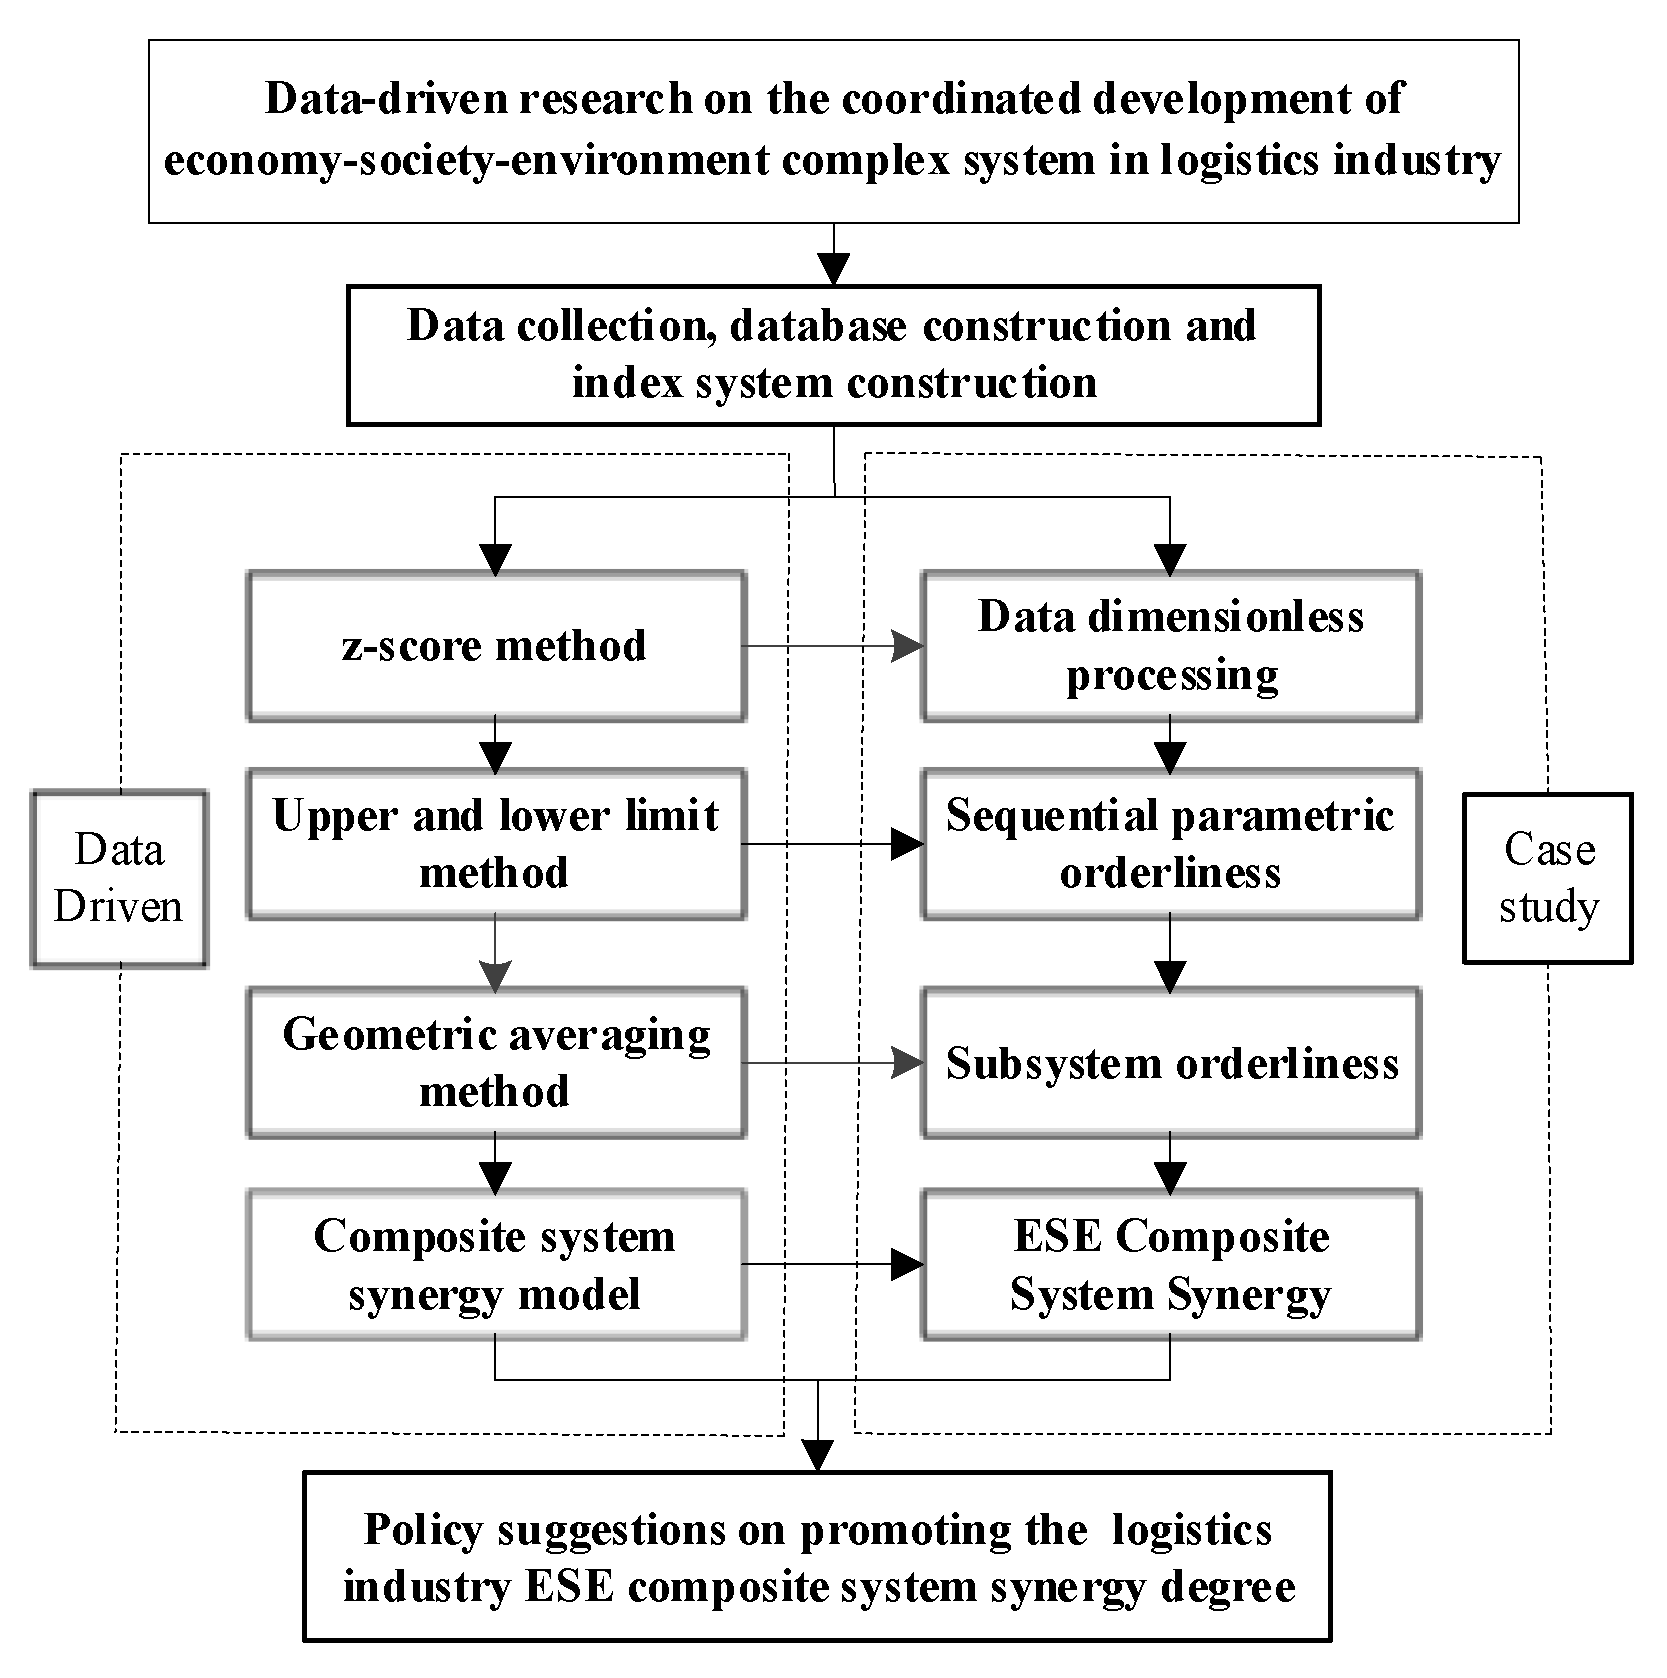
To evaluate and improve the synergistic development level of LI’s ESE-B composite system more objectively, comprehensively, and accurately, this section introduces the methods.

2.1. Method Flow

We promote the synergy of the ESE-B of LI, to achieve more efficient and sustainable development. Evaluating the relationship between these three systems from the systems theory viewpoint and formulating relevant policies from the worldwide optimization perspective are pressing requirements for SDLI research. However, the LI’s ESE-B composite system includes multiple data types. As such, we need to determine how to apply effective models to quantify, assess, and recognize numerous pointers and whether the proposed strategy proposals can really uphold related government navigation. These conundrums present research challenges. To meet this difficulty and ameliorate the coordinated development of LI’s ESE-B composite system, this paper proposes a data-driven method for measuring, evaluating, and enhancing coordinated development level of LI’s ESE-B composite system. We collected economic, social, and environment-related data for LI, while data processing entailed turning the original data into measurement data in the evaluation index system [33]. The methodology is also depicted in Figure 1.
The first step, data collection, is mainly to collect economic, social and environmental related data on the LI, including LI’s cargo turnover, added value, energy consumption, carbon emissions, etc.
The second step, data processing, is to process the original data into the measurement data in the evaluation index system, including the elimination of price fluctuations, the conversion of standard coal, the use of z-score for standardization processing, etc.
The third step, data modeling, is to construct the composite system synergy model and correlation analysis model, including analyzing the sequential parameters, orderliness and synergy of the 3 subsystems of economic benefits, social benefits and environmental benefits of LI.
The fourth step, data application, is to put forward targeted policy recommendations to promote the coordinated development of an ESE-B composite system based on the research results.

2.2. Sequential Parametric Index System

In the related literature, the LI is characterized as three parts: transportation, warehousing, and postal industry. Since these three parts comprise over 85% of the gross value added of the LI [34], there is a certain reliability in adopting this definition. The review’s motivation is to analyze the coordination relationship of the LI’s ESE-B composite system according to the principle of covariance. The ordinal parameter is a parameter variable that influences the evolution direction of the system and characterizes the degree of ordering of the system; as long as the ordinal parameter is controlled, the development direction of the entire system can be grasped [35]. However, the selection of different indicators will produce different results of the ordinal parameter calculation. As such, the scientific and reasonable selection of indicators becomes key to the accuracy of the sequential parameter calculation results, which requires that the selected indicators should conform to the connotation and reflect the characteristics of sequential parameters. On the basis of the meaning of SDLI, referring to the existing research results on LI’s coordinated development and guided by the sustainable development and green logistics theories, the typical order parameter index that can represent the ESE-B composite system of the LI is selected. We also construct a coordinated development index system of LI’s ESE-B composite system consisting of a subsystem layer (ESE-B), element layer (input, output), and index layer. This evaluation index system considers the LI as a total system, and its system coordination degree and the orderliness of each subsystem reflect the SDLI level, being an accurate definition of the SDLI [13].
The assessment indexes of the LI’s economic subsystem mainly contain the amount of investment in fixed assets and the added value of LI [36]. Compared with previous research indicators, this study adds “Internet broadband access port” [37] to reflect the information input of LI, because the input of information technology is necessary.
The evaluation indexes of LI’s social subsystem mainly reflect the contribution and harm of the LI to the society, among which LI’s added value and vehicle tax revenue are significant parts of the public economy, while t the freight turnover is LI’s commitment to freight transportation. In this study, the indicator of “vehicle and vessel tax revenue” was added to reflect LI’s contribution to the society, and the number of traffic fatalities and property damage were added to reflect the LI’s harm to the society [38].
LI’s environmental subsystem mainly measures the effect of the LI’s development on the ecological environment from two aspects: pollution and governance. The unfriendly effect of LI through CO2 emissions on the environment is climate warming, as LI’s exhaust gas emissions will pollute the environment. The number of deaths and property loss in traffic accidents and road traffic noise reflect LI’s adverse impact on society, which is also a new indicator added here based on previous studies [9,21]. The details are shown in Table 1.

2.3. Data Sources and Processing

(1)
The data in Table 1 were predominantly acquired from the China Energy Statistical Yearbook, China Statistical Yearbook, and Anhui Statistical Yearbook for 2012–2021 [39,40]. To eliminate the price ups and downs effect, price-related factors, for example, property damage and vehicle charge were switched over completely to real values, with 2011 as the base period.
(2)
LI’s carbon emissions in Table 1 were calculated according to the carbon emission factors of 17 energy sources in the 2006 IPCC Guidelines for National Greenhouse Gas Inventories, and then calculated by the amount of energy consumed by the LI [41]. LI’s exhaust gas emissions in Table 1 were determined by the emission factor method, drawing on EPA, AP-42, and Beijing emission factors [42] The emissions of NOX, PM10, PM2.5, SO2 of the LI in Anhui Province from 2011 to 2020 were measured by the emission factor method in the light of the primary energy consumption of the LI in the energy balance sheet. Finally, the exhaust gas emissions were obtained by summing up and the missing energy data in 2020 was filled in by interpolation.
(3)
Standardized data processing.
The standardization of raw index data is intended to transform raw index data into dimensionless index measurement values. Data standardization methods include, for example, min-max standardization or the z-score method. The z-score can reflect the original data values more accurately, so this paper uses it for standardization [43], as follows:
X i j * = X i j X ¯ j S j
X ¯ j = i = 1 n X i j n
S j = i = 1 n X i j X ¯ j 2 n 1
where X i j * is the normalized data, X i j the raw data, X ¯ j the mean of X i j , and S j the standard deviation of   X i j .

2.4. Data Modeling

The complex system synergy model can scientifically calculate the level of complex system synergy and is now widely used to analyze the dynamic synergy evolution of a system [20,44]. We also use it to measure the dynamic synergy level of LI’s ESE-B complex system as follows.
(1)
Orderliness of sequential parameters
LI’s ESE-B composite system can be expressed as S j = S 1 , S 2 , S 3 , which represent the three subsystems of ESE-B, respectively. The order parameter of each subsystem is e j = e j 1 , e j 2 , e j 3 e j n , where   j = 1 ,   2 ,   3 , and n 1 denotes the number of sequential parameters of each subsystem. α j i e j i β j i , i = 1 ,   2 ,   3 n . To ensure the stability of the system,   α j i and β j i are the upper and lower limits of ordinal parametric components e j i   [41]. Each ordinal parametric component’s orderliness is:
μ j ( e j i ) = e j i α j i β j i e j i   e j i   i s   a   positive   indicator μ j ( e j i ) = β j i e j i β j i e j i   e j i   is   a   negative   indicator
From Equation (4), μ j ( e j i ) 0 , 1 ; the larger the value is, the greater is the contribution of indicator e j i to the ordering of the subsystem.
(2)
Subsystem orderliness
The degree of subsystem order reflects the sum of the contribution of all components of order parameter variables e j to subsystem S j . The orderliness of the environmental benefit subsystem S 3 reflects the contribution of ordinal variables E31, E32,⋯,E36 to subsystem S 3 . It can be obtained by integrating each μ j ( e j i ) . We use the more accurate geometric mean method to synthesize the orderliness of each subsystem, μ j ( e j ) [45,46]:
  u j e j = i n   u j e j i n
where   μ j e j 0 , 1 ; the larger μ j e j is, the greater is the contribution that e j makes to the orderliness of subsystem S j and the higher is the degree of the subsystem orderliness, and vice versa.
(3)
Composite system synergy model
For a given initial moment t 0 , let the degree of subsystem S j order be μ j 0 e j , j = 1 , 2 , , k when the overall development of the composite system evolves to the moment t 1 ; at this point, the degree of subsystem   S j order is μ j 1 e j , j = 1 , 2 , k . Then, the coordination degree of composite system C t is [47]:
C t = θ · j n u j t e j u j 0 e j 1 / k
where θ = m i n u j t e j u j 0 e j 0 m i n u j t e j u j 0 e j 0 , j = 1 , 2 , 3 .
In Equation (6), u j t e j u j 0 e j is the change in the magnitude of subsystem S j from t 0 to t 1 , and u j t e j u j 0 e j   [−1, 1]. As C t [−1, 1], the larger the value is, the higher the degree of composite system coordinated development is, and vice versa. The significance of the introduction of parameter θ is that only condition u j t e j u j 0 e j > 0 , j [1, k], and the synergy degree of the composite system is positive. If in the t 0 , t 1 time period, the increase in the orderliness of one subsystem is larger and the increase in the orderliness of some other subsystems is smaller or even decreases, the coordinated development state of the entire complex system is bad or not coordinated at all, as shown by C t [−1, 0]. In this study, the LI ESE-B composite system has three subsystems. Thus, k = 3 and Equation (6) can be written as [48,49]:
C = θ · u 1 t e 1 u 1 0 e 1 · u 2 t e 2 u 2 0 e 2 · u 3 t e 3 u 3 0 e 3 3
From the literature, there are two algorithms for Equation (6): one takes the same moment as the base period and the other takes the neighboring moments as the base period. The two algorithms provide useful ideas for the comprehensive analysis of the composite system synergy; specifically, the first one can well reflect the long-term evolution trend of the composite system and the second one can better reflect whether the composite system is in a stable state of synergistic evolution. As such, we use two methods to measure the LI’s ESE-B composite system synergy. At present, most countries and international organizations generally use the same and adjacent base period synergy degree classification standard [50], as shown in Figure 2.
LI’s ESE-B composite system synergy model can explore the synergistic development of LI’s ESE-B and the classification of the coordination level can precisely define the level of coordination development, which is an important insight for the design of countermeasures to promote LI’s synergistic development and indicates the direction of the SDLI.

2.5. Data Optimization for Decision Making Applications

In the context of the increasingly prominent contradiction between the economic development, resource shortage, and social demand of LI, promoting the synergistic development of ESE systems of LI is of great practical importance to enhance the SDLI. Since the ESE-B of LI are considered comprehensively, an index system containing these three subsystems is proposed here. Due to the multiple sources of data for the LI composite system, this paper puts into use a data-driven approach. The study thus aims to apply a data-driven method to precisely measure, evaluate, and identify the synergistic development level of the LI’s ESE-B composite system, as well as to propose strategy proposals in view of the quantitative evaluation results and give a premise to decision making for LI specialists and chiefs. The specific applications are shown in Figure 3 below.
In the first step, the data related to the LI’s ESE-B composite system are collected and the database established. As indicated by the standards of data accessibility and scientificity, the ESE-B composite system index system is constructed from three aspects, covering the ESE-B of LI. This step represents the extraction and organization of data.
In the second step, the raw data are standardized using the Z-score method, so that the raw data are all converted to dimensionless values; that is, the indicators are all at the same quantitative level and can be used for comprehensive measurement. This step represents the conversion of the data to make them comparable.
In the third step, the ordinal covariates orderliness is calculated using the upper and lower bound method, and the geometric mean method is applied to calculate LI’s orderliness of ESE-B. This step represents the processing of standardized data to measure the contribution degree of ordinal covariates to the orderliness of subsystems.
In the fourth step, LI’s ESE-B composite system synergy model is constructed, LI’s ESE-B composite system synergy degree is calculated, and the coordination degree among LI’s subsystems is evaluated. This represents is the modeling of the data, being used to solve the realistic problem of the synergy of LI’s ESE-B.
In the fifth step, in view of the data-driven quantitative estimation and assessment results, the research conclusions are drawn and the shortcomings in LI’s development identified; based on these, strategy proposals are proposed to promote the synergistic development of LI’s ESE-B. This step represents the sublimation of the data and the presentation of the data modeling results to derive policy recommendations based on data.
Through the above data application, we can realize the measurement, evaluation. and optimization improvement of LI’s ESE-B composite system synergy and provide theoretical and methodological support for the SDLI.

3. Case Study

Using the above research method, the study is carried out using the example of LI’s ESE-B in Anhui Province, China. Section 3.1 presents the case background, Section 3.2 shows the data results calculated by using the above research method, and Section 3.3 provides suggestions to promote the synergy of LI’s ESE-B complex system in Anhui Province based on the results.

3.1. Background

Anhui Province, as shown in Figure 4, is located in East China, connecting Jiangsu Province and Zhejiang Province to the east, Hubei Province and Henan Province to the west, Jiangxi Province to the south, and Shandong Province to the north. It is not only a national comprehensive transportation hub, but also a deep hinterland of the Yangtze River Delta region. The LI of Anhui Province has been developing well. In 2020, the total revenue of LI in Anhui Province was 495 billion yuan, increasing by 2% compared with the previous year. The ratio of total social logistics cost to GDP was 14.7% [13], being lower by 0.2 percentage points compared with the previous year, which was the same as the national level. In 2021, the total social logistics in Anhui Province maintained a steady growth, reaching 8.08 trillion yuan, with a year-on-year increase of 15.1% and being 5.9 percentage points higher than the national value. LI’s added value was 98 billion yuan, with a year-on-year increase of 13.9%. The pace of transformation and upgrading is also accelerating. However, Anhui Province, as a latecomer in the Yangtze River Delta region, still requires improvements in terms of the ecological operation mode of LI and social impact. Therefore, through measuring, evaluating, and enhancing LI’s ESE-B composite system in Anhui Province, this paper proposes policy recommendations to promote the coordinated development of LI’s ESE-B composite system in this province in light of the appraisal results. This is of incredible importance to advance the SDLI of Anhui Province. However, this case study is restricted to Anhui Province only, and it can only be used as a reference by other provinces and cities. The condition underlying this case study is the uncoordinated development of ESE-B complex system of the logistics industry in Anhui Province.

3.2. Data Analysis Results

(1)
Normalized values of sequential parameters
For the collected LI ESE-B composite system index data in Anhui Province, standardized values were calculated using Formulas (1)–(3) (i.e., the z-score method), as shown in Table A1. See Appendix A.
(2)
Orderliness of sequential parametric indicators
In this study, when calculating the orderliness of subsystem sequential parametric indexes, we use our own comparison method to set the lower limit of the index threshold as the minimum value and the upper limit as the maximum value of the same index. It is expressed as 1.01 times of the minimum and 1.01 times of the maximum values, respectively. According to Equation (4) and the data in Table A1, the orderliness of the sequential parameter indicators of the LI’s ESE-B composite system in Anhui Province is calculated, as shown in Figure 4.
From Figure 5, the overall orderliness levels of the sequential covariates are low, but most of them show an upward trend from 2011 to 2020; the cargo turnover (E14), human resources input (E22), road traffic noise (E36) show an upward and then downward trend; the contribution rate of the LI (E16) and traffic accident property damage (E26) show a downward and then upward trend. In general, the degree of orderliness is improving. However, energy consumption (E31), electricity consumption (E32), carbon emissions (E34), and exhaust gas emissions (E35) show a decreasing trend, which means that these sequential parameters are areas that need to be improved (i.e., the orderliness of environmental benefits needs to be improved).
(3)
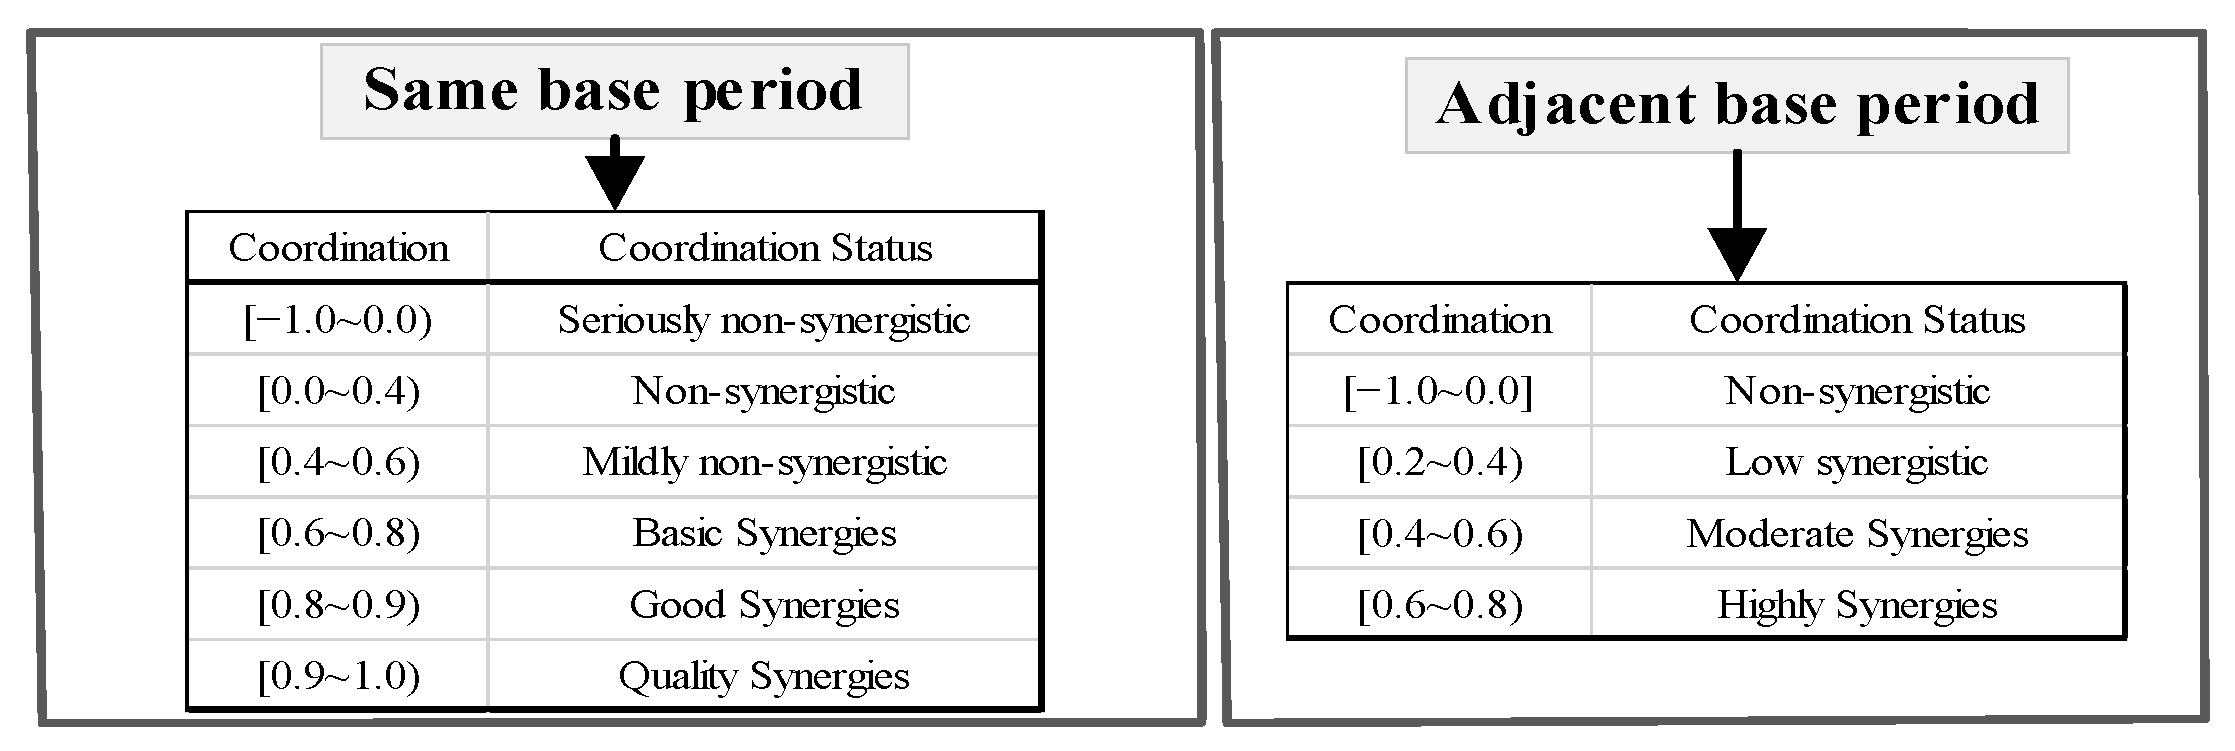
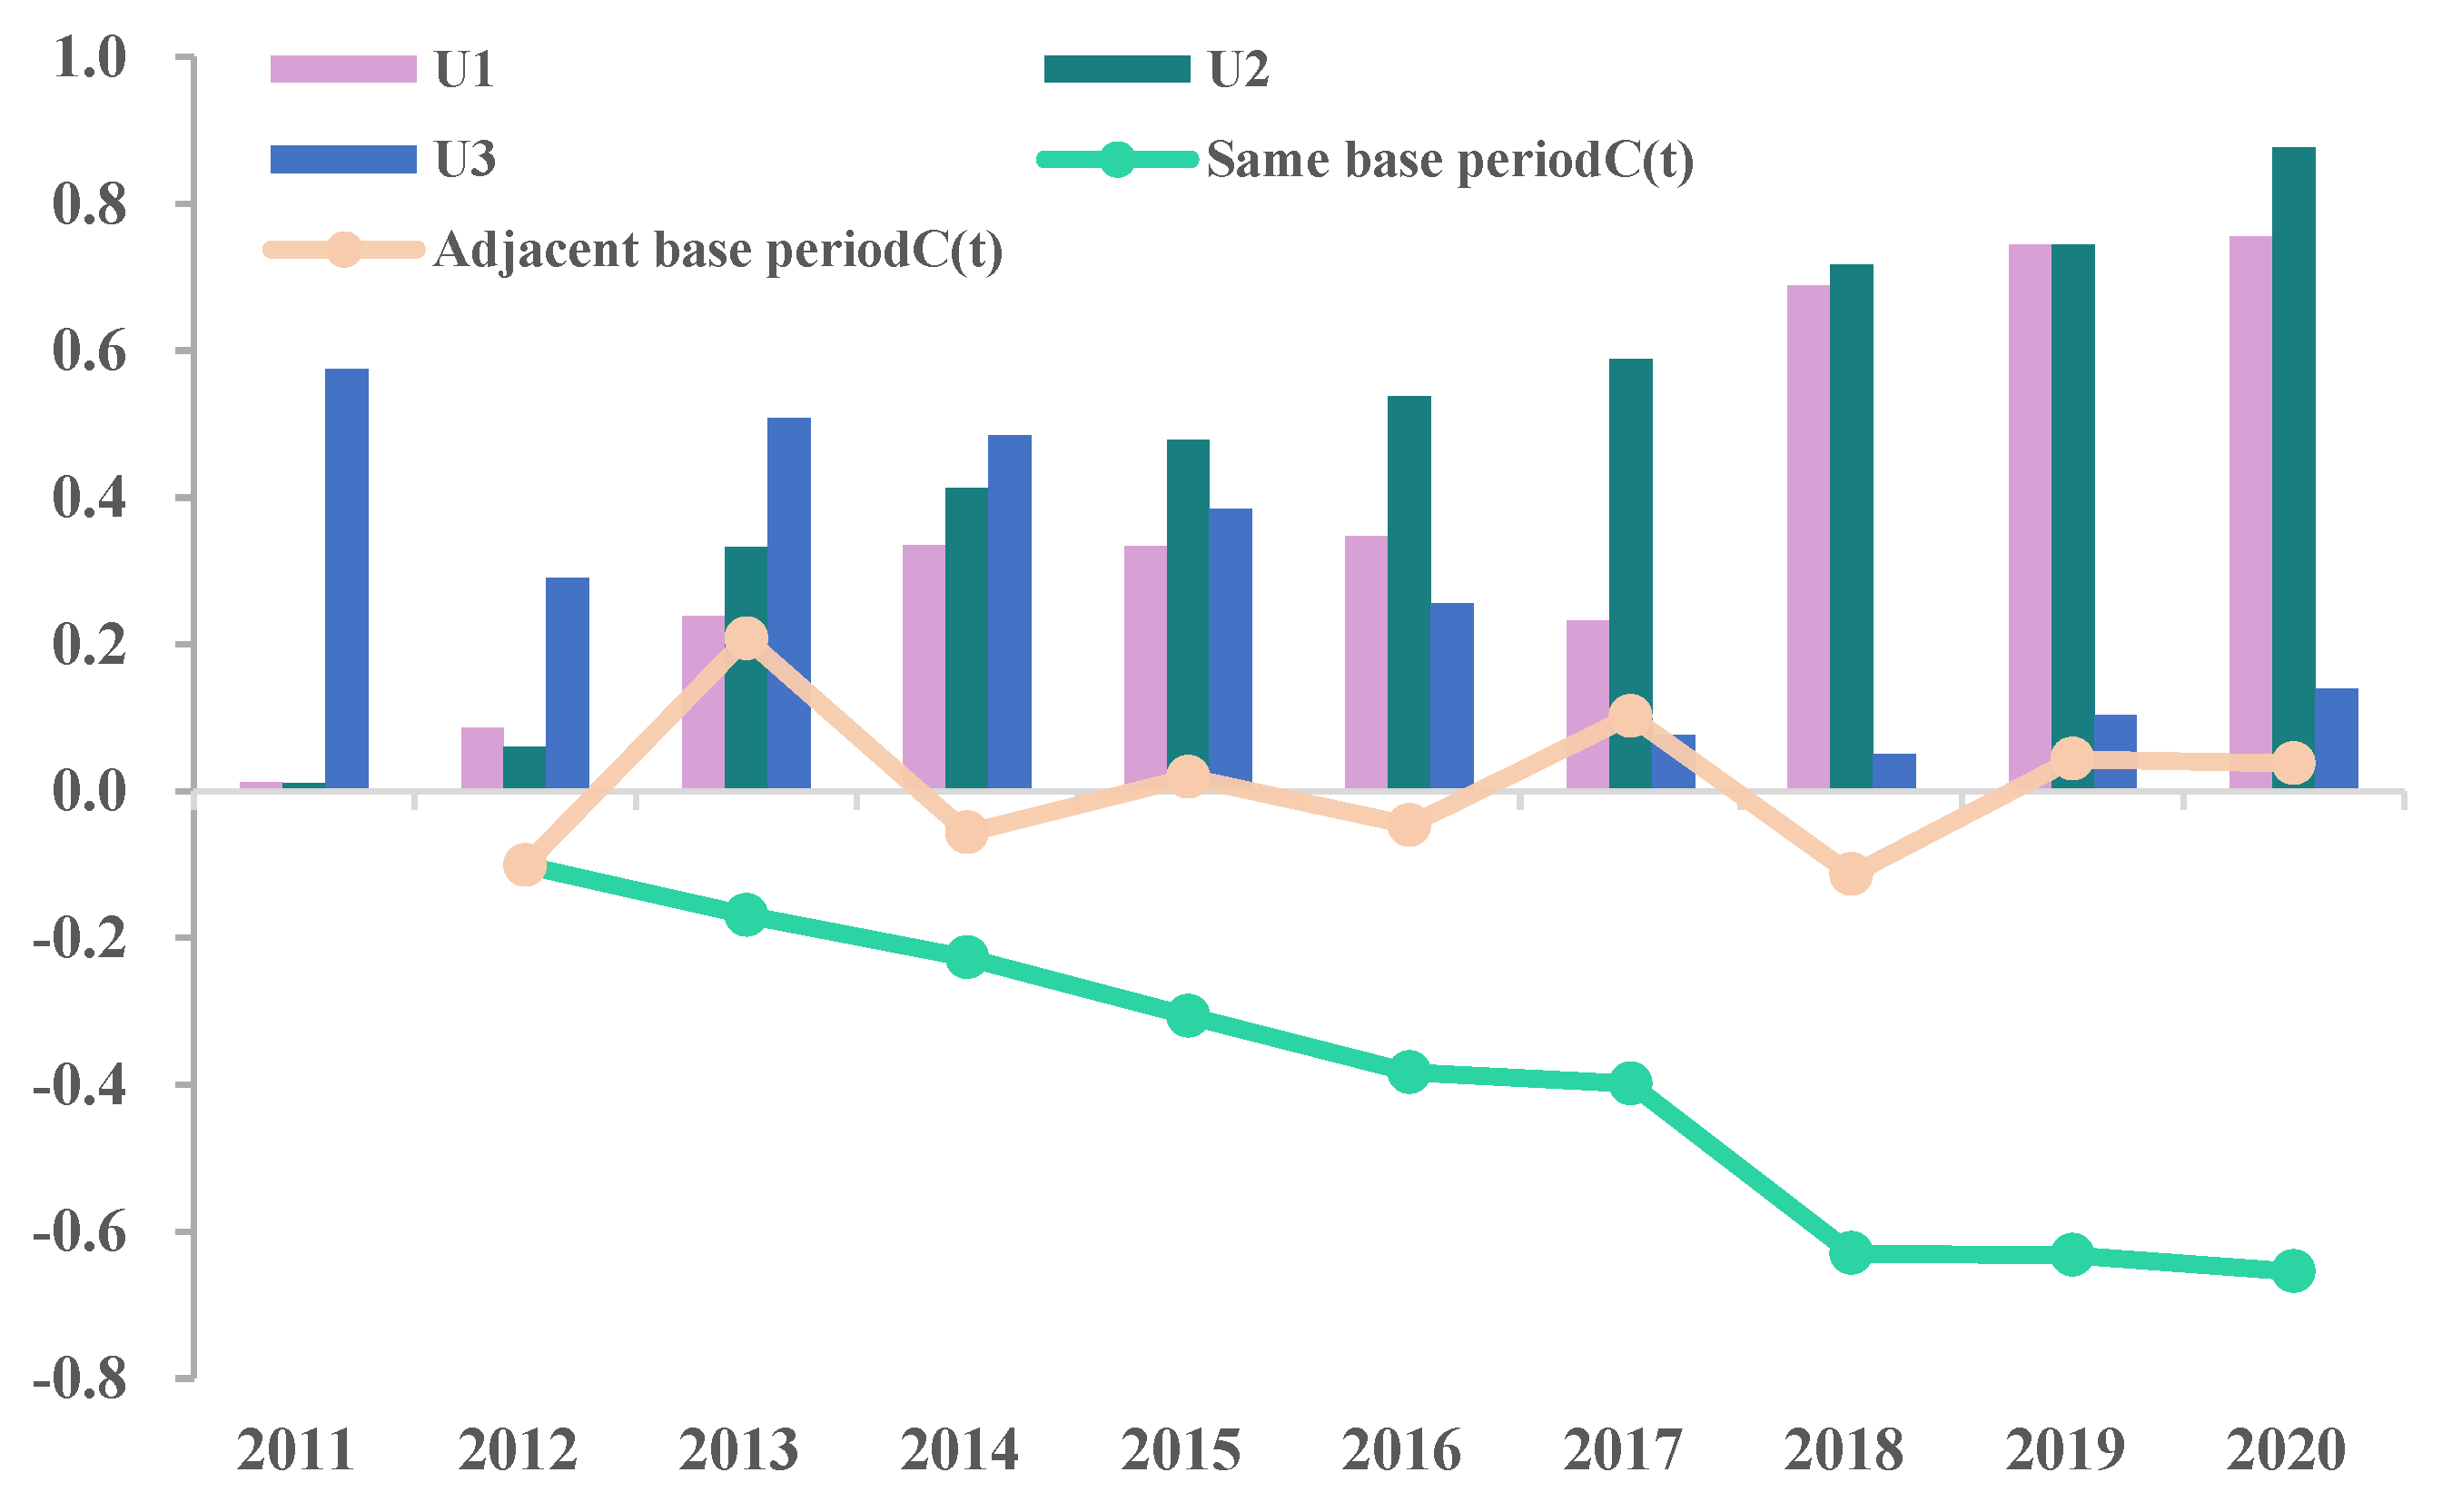
Calculation results of the orderliness and synergy degree
According to Equation (5) and the data in Figure 5, the orderliness of the ESE-B subsystems of LI in Anhui Province during 2011–2020 are calculated, with 2011 as the base year. The coordination degree of the same and adjacent base periods of LI’s ESE-B composite system in Anhui Province from 2012 to 2020 is calculated according to Equations (6) and (7), as shown in Figure 5.
Based on a single system, in terms of the economic efficiency of a subsystem, orderliness was only 0.012 in 2011 and reached 0.755 in 2020, with an average annual increase of 6.19%. Except for the decline in 2017 compared with 2016, the rest of the years showed an uptrend. The justification for this is that the orderliness of the LI’s contribution (E16) decreased in 2017, because the country and provinces and cities began to promote the construction of ecological civilization and comprehensively deploy the green and low-carbon development of LI; as a result LI began to focus on environmental benefits, and relatively speaking, the economic development speed decreased. However, after two or three years of coordinated development, the economic benefits subsystem orderliness began to increase in 2018 [51]. The orderliness of social benefits was only 0.011 in 2011 and reached a peak of 0.877 in 2020, with an average annual growth of 8.66%, which shows that the LI of Anhui Province is relatively good in terms of social benefits. However, the orderliness of social benefits can be improved even further if human resource input is increased. The environmental benefit orderliness shows an opposite trend to those of economic and social benefits, being 0.575 in 2012, reaching the minimum of 0.051 in 2018, and increasing to 0.139 in 2020, which indicates that the LI in Anhui Province has begun to pay attention to environmental protection, actively adopt new technologies and equipment, change the previous rough development mode, and gradually move toward a new logistics mode of green and collaborative development.
Based on the overall trend, between 2012 and 2020, the synergy (using the same base period) of LI’s ESE-B composite system in Anhui Province showed a decreasing trend year by year, reaching a minimum value of −0.655 in 2020, indicating a serious non-synergistic state. At the same time, the synergy degree of LI’s ESE-B composite system in Anhui Province shows a jump forward with insignificant increase, except for 2013 when it reached a moderate synergistic evolution. The rest of the analyzed years are alternating between non-synergistic evolution and low synergistic evolution. This indicates that the synergy degree of LI’s ESE-B composite system in Anhui Province needs to be improved, as does the stability degree. According to the order degree of each subsystem, the main reason for the serious non-synergy of LI’s ESE-B composite system in Anhui Province is that the order degree of the environmental benefit subsystem has been decreasing in almost all years and the improvement of the environmental protection capability of the LI is the top priority in this province at present.
(4)
Calculation results of two-synergy degree of each subsystem
From Figure 6, the synergy of LI’s ESE-B subsystems in Anhui is relatively stable in the same base period; basically, the synergy of two subsystems (economic and social benefits) increased year by year, but the synergy of two subsystems (environmental benefits and other subsystems) is not only negative, but also decreased year by year, which caused the synergy of the ESE-B composite system to decrease year by year. The synergy of LI’s ESE-B subsystems in Anhui shows a repeated trend of “rise–fall” in the adjacent base period, which also causes the synergy of the ESE-B composite system to show almost the same characteristics. This indicates that the development of the environmental efficiency subsystem and other subsystems of the LI in Anhui Province is non-synergistic, which hinders the improvement of synergy, and indicates that environmental problems need to be solved urgently.

3.3. Policy Recommendations

The synergistic development LI’s ESE-B is of extraordinary and useful importance for sustainable development. The measurements and evaluation in Anhui Province from 2011 to 2020 continue to decline and the synergy degree within each subsystem varies and is unstable. The following suggestions are proposed to promote the coordinated development of LI’s ESE-B complex system from three aspects: policy, intelligent systems, and energy, respectively. We thus propose the following countermeasures:
(1)
Formulate corresponding LI policies to promote the coordinated development of ESE-B
LI’s ESE-B composite system relies upon the increase of each subsystem order degree and the order parameter. From the calculation results, problems arise due to the order degree decline of the environmental benefit subsystem. The synergy degree of the composite system is declining overall. Therefore, the government should give full play to its guiding role and formulate comprehensive policies for the development of the three aspects of the LI (ESE-B) to provide a solid policy platform for the synergistic development of LI’s ESE-B complex system.
(2)
Promote the modernization of the LI and the development of intelligent logistics
The average orderliness of LI’s social benefit subsystem in Anhui Province from 2011 to 2020 is 0.48, which is greater than those of the economic and environmental benefit subsystems, but the property loss from traffic accidents in the social benefit subsystem first decreased and then increased during 2011–2020, reaching the lowest value of 0.0739 in 2012. This result is mainly attributed to the lack of in-depth application of logistics information technology. As such, the construction of intelligent logistics is imperative. Anhui Province should establish a data processing center based on big data and cloud computing [51] to integrate the resources of the logistics operation process from the three aspects of supply, demand, and supervision to achieve the optimal fit of each subsystem in LI’s ESE-B composite system.
(3)
Optimize the energy structure of the LI and enhance environmental orderliness
The orderliness of LI’s environmental benefit subsystem in Anhui Province is much lower than that of the economic and social benefit subsystems, with an average value of only 0.29, and it plays a decisive role in the synergy with other subsystems and in the total system. Achieving carbon neutrality is a common development goal worldwide, meaning that environmental benefits are still something to which Anhui Province needs to continue to pay attention. The LI in Anhui Province should expand the application of new energy and clean energy such as electricity and natural gas; develop multimodal transportation and other ways to optimize transportation; support, cultivate, and introduce specialized and low-carbon logistics enterprises; promote the diversification and clean transformation of energy consumption in the LI; establish waste emission standards for the LI; force a low-carbon transformation; and promote the ecological development of the LI.

3.4. Discussion

Comparison with existing literature [21,22]: the present paper makes the following contributions. First, it constructs a more comprehensive evaluation index system of LI’s ESE-B composite system from the viewpoint of synergy theory, systems theory, and input-output. Further, considering the three benefits of LI provides a more systematic and scientific approach. Second, the data-driven approach and the CSSMD are used to systematically and comprehensively consider the development of LI and more objectively quantify and evaluate the level of LI’s ESE-B composite system synergy development. This approach provides a scientific decision-making framework for relevant subjects and practitioners. Finally, to achieve sustainable development, we propose targeted countermeasures and ideas to advance the synergistic development of LI’s ESE-B composite system, which is of practical significance. However, the proposed method may not yield the obtained results in other provinces, cities or at other times, and the results require further temporal and spatial scaling.
Combining the findings, we can draw three management insights as follows:
First, to promote LI’s ESE-B synergistic development according to the point of view of systems theory and overall optimization, we cannot depend on a single part of a larger system. Instead, it is necessary to bring into full play the back and forth support of the three parts of larger systems to effectively help increase the SDLI.
Second, with social, economic, and technological development, the foundation of a data-driven estimation and assessment method for the collaborative development of LI’s ESE-B composite system can bring into full play of the advantages of each subsystem to achieve complementary strengths and weaknesses and collaborative development. As such, we can more effectively serve local government decision-making and local related enterprise management.
Finally, the synergistic development of LI’s ESE-B composite system is crucial to promoting the sustainable development of the region and it is additionally important for the public authorities and significant divisions to mutually advance the joining and improvement of every subsystem and to understand the profoundly interacting and synergistic advancement of LI’s ESE-B composite system.

4. Conclusions

Improving the coordinated development level of LI’s complex system is important to ensure sustainable development and the SDLI is one of the important ways to protect the environment, save resources, and benefit society in today’s world. To deal with the above research difficulties, this paper presents a data-driven research method and optimization countermeasure suggestions based on the data-driven coordination of LI’s composite system, drawing on the exploratory thoughts of [52,53]. This approach has both theoretical and practical significance.
The theoretical significance of this study is as follows. (1) It enriches the connotation of the LI composite system index system and constructs a three dimensional index system of the ESE-B of the LI from the input-output perspective. When constructing the index system, social factors such as traffic property loss and road traffic noise and environmental factors such as carbon and waste emissions are considered. (2) Based on the data-driven theory, the composite system synergy model is used for analysis and the assessment results are accurate and objective, better reflecting the degree of interdependence and interaction among the ESE-B of the LI. (3) The internal mechanism of the economic, social, and environmental development of LI is explained from the synergy perspective, which improves the theoretical framework for the synergistic development of the LI’s ESE-B. The practical significance of the results can be summarized as follows. (1) This study provides a quantitative basis for measuring, evaluating, and identifying the coordination level of the LI’s ESE-B complex system. (2) It also provides reference for promoting the SDLI. (3) Finally, it offers new research ideas to researchers and policy makers in the LI field. This is also the innovation of this paper. The method may be used in the future to study the coordinated development of economic, environmental and social benefits of the LI and promote the future role of LI policies in supporting sustainable development.
The elements involved in LI’s ESE-B composite system are complex, and the study of the synergistic development of each subsystem is complex. Hence, this study is not without limitations. (1) With the development of economy and society, the LI’s composite system will include more elements. In future research, it is necessary to further make the index of the composite system more complete and accurate. (2) Further, the data capacity needs to be expanded to improve the representativeness of the sample by including more provinces and cities, as well as a longer sample period. (3) Finally, the mechanisms influencing the LI’s complex system coordination need to be further explored. More effective countermeasures and suggestions need to be proposed to improve the coordination level, in support of regional sustainable development.

Author Contributions

Conceptualization, W.M.; methodology, W.M. and J.X.; investigation, W.G.; resources, W.G.; data curation, W.M.; writing—original draft preparation, W.M. and H.D.; writing—review and editing, J.X. and H.D. All authors have read and agreed to the published version of the manuscript.

Funding

This research is supported by key projects of Humanities and Social Sciences Research in Anhui Provincial Education Department (SK2016A1007 and SK2020A0539). Transportation rationalization consulting and transportation optimization services of Suzhou Chihan Transportation Co.(2022xhx150).

Data Availability Statement

Not applicable.

Conflicts of Interest

The authors declare no conflict of interest.

Appendix A

Table A1. Sequence parameters standardized values of ESE-B composite system.
YearE11E12E13E14E15E16E21E22E23E24E25E26E31E32E33E34E35E36
2011−1.676−1.127−1.407−1.827−0.9011.326−1.664−1.890−1.781−1.4521.056−0.913−1.989−1.207−1.314−2.486−2.3180.678
2012−1.435−1.142−1.092−0.811−0.7861.100−1.051−1.807−1.530−1.1990.5212.688−1.347−1.047−1.864−0.963−0.977−0.059
2013−0.944−0.842−1.0341.055−0.6860.871−0.7060.192−0.639−0.9490.3450.595−0.765−0.929−0.999−0.428−0.458−0.796
2014−0.328−0.517−0.9851.918−0.5300.407−0.6810.090−0.052−0.5880.1690.229−0.039−0.8080.0240.1890.131−2.270
20150.085−0.4430.001−0.378−0.537−0.667−0.1700.283−0.097−0.2520.201−0.1100.101−0.4320.0240.2400.463−0.501
20160.601−0.2170.301−0.012−0.489−1.3810.2470.5190.1770.0580.201−0.0370.3020.0510.4170.3400.5641.120
20170.6410.1980.6300.384−0.402−1.9120.4690.9680.6710.7170.529−0.5060.8050.4200.8100.7501.0881.415
20180.6510.8321.1080.6610.6810.0850.6861.0761.0011.2120.002−0.6101.0070.8551.0460.9981.1480.383
20191.0571.3371.210−0.4941.8840.2831.0740.7901.2940.955−0.182−0.6791.0701.4011.2040.7740.5980.236
20201.3471.9201.269−0.4971.765−0.1121.797−0.2210.9551.498−2.841−0.6570.8571.6940.6530.586−0.240−0.206

References

  1. Chen, J.X.; Chen, J. From optimization to reinvention—High quality development of supply chain in the big change. Syst. Eng. Theory Pract. 2022, 42, 545–558. [Google Scholar] [CrossRef]
  2. Peng, Z.W. Motivation and Countermeasures of Global Value Chain Adjustment, 20 January 2021. Available online: www.cssn.cn (accessed on 20 July 2022).
  3. Li, M.J.; Wang, J. Spatial-temporal evolution and influencing factors of total factor productivity in China’s logistics industry under low-carbon constraints. Environ. Sci. Pollut. Res. 2022, 29, 883–900. [Google Scholar] [CrossRef] [PubMed]
  4. Dong, Q.L.; Bai, D.L.; Wang, D.F. Eco-Efficiency and pollution reducing potential of Logistics industry in the Yellow River Basin. Ecol. Econ. 2021, 37, 34–42. [Google Scholar]
  5. Cooper, J. The paradox of logistics in Europe. Int. J. Logist. Manag. 1991, 2, 42–54. [Google Scholar] [CrossRef]
  6. Quesada-Mateo, C.A.; Solís-Rivera, V. Costa Rica’s national strategy for sustainable development: A summary. Futures 1990, 22, 396–416. [Google Scholar] [CrossRef]
  7. Cao, C.L. Measuring Sustainable Development Efficiency of Urban Logistics Industry. Math. Probl. Eng. 2018, 2018, 9187541. [Google Scholar] [CrossRef]
  8. Wu, H.J.; Dunn, S.C. Environmentally responsible logistics systems. Int. J. Phys. Distrib. Logist. Manag. 1995, 25, 20–38. [Google Scholar] [CrossRef]
  9. Zaman, K.; Shamsuddin, S. Green logistics and national scale economic indicators: Evidence from a panel of selected European countries. J. Clean. Prod. 2017, 143, 51–63. [Google Scholar] [CrossRef]
  10. Abareshi, A.; Molla, A. Greening logistics and its impact on environmental performance: An absorptive capacity perspective. Int. J. Logist. Res. Appl. 2013, 16, 209–226. [Google Scholar] [CrossRef]
  11. Ramos, T.R.P.; Gomes, M.I.; Barbosa-Povoa, A.P. Planning a sustainable reverse logistics system: Balancing costs with environmental and social concerns. Omega 2014, 48, 60–74. [Google Scholar] [CrossRef] [Green Version]
  12. Mota, B.; Gomes, M.I.; Carvalho, A.; Barbosa-Povoa, A.P. Towards supply chain sustainability: Economic, environmental and social design and planning. J. Clean. Prod. 2014, 105, 14–27. [Google Scholar] [CrossRef]
  13. Ding, H.P.; Liu, Y.; Zhang, Y.; Wang, S.; Guo, Y.; Zhou, S.; Liu, C. Data-driven evaluation and optimization of the sustainable development of the logistics industry: Case study of the Yangtze River Delta in China. Environ. Sci. Pollut. Res. 2022, 29, 68815–68829. [Google Scholar] [CrossRef] [PubMed]
  14. Gordon, I.R.; McCann, P. Industrial clusters: Complexes, agglomeration and/or social networks? Urban Stud. 2000, 37, 513–532. [Google Scholar] [CrossRef]
  15. Hu, Y.; Shu, H. Synergetic mechanism of agricultural logistics ecosphere—The case study based on Jiangxi Taoxin. Nankai Bus. Rev. Int. 2022; ahead-of-print. [Google Scholar] [CrossRef]
  16. Liang, W.; Gu, D.C. Study on the synergistic development of agriculture and logistics industry and key influencing factors. J. Yunnan Agric. Univ. Soc. Sci. 2021, 15, 93–101. [Google Scholar] [CrossRef]
  17. Klaus, P. Logistics research: A 50 years’ march of ideas. Logist. Res. 2009, 1, 53–65. [Google Scholar] [CrossRef]
  18. Chen, Y.; Lan, S.L.; Tseng, M.L. Coordinated development path of metropolitan logistics and economy in Belt and Road using DEMATEL-Bayesian analysis. Int. J. Logist. Res. Appl. 2018, 22, 1–24. [Google Scholar] [CrossRef]
  19. Perez-Suarez, R.; Lopez-Menendez, A.J. Growing green? Forecasting CO2 emissions with environmental Kuznets curves and logistic growth models. Environ. Sci. Policy 2015, 54, 428–437. [Google Scholar] [CrossRef]
  20. Liu, J.; Yuan, C.; Hafeez, M.; Yuan, Q. The relationship between environment and logistics performance: Evidence from Asian countries. J. Clean. Prod. 2018, 204, 282–291. [Google Scholar] [CrossRef]
  21. Zhou, T. Research on the coordinated development of regional logistics and ecological environment from the perspective of a low carbon. Stat. Inf. Forum 2021, 36, 62–72. [Google Scholar]
  22. Evangelista, P. Environmental sustainability practices in the transport and logistics service industry: An exploratory case study investigation. Res. Transp. Bus. Manag. 2014, 12, 63–72. [Google Scholar] [CrossRef]
  23. Lean, H.; Huang, W.; Hong, J.J. Logistics and economic development: Experience from China. Transp. Policy 2014, 32, 96–104. [Google Scholar] [CrossRef]
  24. Chen, D.Q.; Ignatius, J.; Sun, D.Z.; Zhan, S.L.; Zhou, C.Y.; Marra, M.; Demirbag, M. Reverse logistics pricing strategy for a green supply chain: A view of customers’ environmental awareness. Int. J. Prod. Econ. 2019, 217, 197–210. [Google Scholar] [CrossRef] [Green Version]
  25. Shu, L.L.; Chen, Y.; Huang, G.Q. Data analysis for metropolitan economic and logistics development. Adv. Eng. Inform. 2017, 32, 66–76. [Google Scholar] [CrossRef]
  26. Yu, S.; Yin, C. Evaluating the coordinated development of economic, social and environmental benefits of urban public transportation infrastructure: Case study of four Chinese autonomous municipalities. Transp. Policy 2018, 66, 116–126. [Google Scholar] [CrossRef]
  27. Li, X.L.; Sohail, S.; Majeed, M.T.; Ahmad, W. Green logistics, economic growth, and environmental quality: Evidence from one belt and road initiative economies. Environ. Sci. Pollut. Res. 2021, 28, 30664–30674. [Google Scholar] [CrossRef] [PubMed]
  28. Long, R.Y.; Ouyang, H.Z.; Guo, H.Y. Super-slack-based measuring data envelopment analysis on the spatial-temporal patterns of logistics ecological efficiency using global malmquist index model. Environ. Technol. Innov. 2020, 18, 100770–100784. [Google Scholar] [CrossRef]
  29. Deng, F.M.; Xu, L.; Fang, Y.; Gong, Q.; Li, Z. PCA-DEA-Tobit Regression Assessment with Carbon Emission Constraints of China’s Logistics Industry. J. Clean. Prod. 2020, 271, 12548. [Google Scholar] [CrossRef]
  30. Müller, E.; Stock, T.; Schillig, R. A method to generate energy value-streams in production and logistics in respect of time- and energy-consumption. Prod. Eng. Res. Devel. 2014, 8, 243–251. [Google Scholar] [CrossRef] [Green Version]
  31. Sun, Q. Empirical research on coordination evaluation and sustainable development mechanism of regional logistics and new-type urbanization: A panel data analysis from 2000 to 2015 for Liaoning Province in China. Environ. Sci. Pollut. Res. 2017, 24, 14163–14175. [Google Scholar] [CrossRef]
  32. Yang, J.N.; Tang, L.; Mi, Z.F.; Liu, S.; Li, L.; Zheng, J.L. Carbon emissions performance in logistics at the city level. J. Clean. Prod. 2019, 231, 1258–1266. [Google Scholar] [CrossRef]
  33. Alarcón, F.; Cortés-Pellicer, P.; Pérez-Perales, D.; MengualRecuerda, A. A Reference Model of Reverse Logistics Process for Improving Sustainability in the Supply Chain. Sustainability 2021, 13, 10383. [Google Scholar] [CrossRef]
  34. Jiang, X.H.; Ma, J.X.; Zhu, H.Z.; Guo, X.C.; Huang, Z.G. Evaluating the Carbon Emissions Efficiency of the Logistics Industry Based on a Super-SBM Model and the Malmquist Index from a Strong Transportation Strategy Perspective in China. Int. J. Environ. Res. Public Health 2020, 17, 8459. [Google Scholar] [CrossRef] [PubMed]
  35. Wu, C.X. Synergistic effects of low-carbon economic development in China. Manag. World 2021, 8, 105–116. [Google Scholar]
  36. Feng, J.H.; Zhang, J.L.; Tang, L. Study on the coupling and coordinated development of agricultural economy ecology society composite system: Take Shaanxi Province as an example. J. Syst. Sci. 2021, 29, 92–96. [Google Scholar]
  37. Cao, B.R.; Kong, Z.Y.; Deng, L.J. A study on provincial logistics efficiency and spatial and temporal evolution in the Yangtze River Economic Belt. Geoscience 2019, 39, 1841–1848. [Google Scholar]
  38. Wang, Y.F. Research on the Evaluation of High-Quality Development of the Logistics Industry. Master’s Dissertation, Henan University of Technology, Zhengzhou, China, 2020. [Google Scholar] [CrossRef]
  39. Energy Statistics Division of the National Bureau of Statistics. China Energy Statistical Yearbook; China Statistics Press: Beijing, China, 2012–2021. [Google Scholar]
  40. Anhui Provincial Bureau of Statistics. Anhui Provincial Statistical Yearbook; Anhui Statistics Publishing House: Anhui, China, 2012–2021. [Google Scholar]
  41. Sun, H.; Hu, X.Y.; Nie, F.F. Spatio-temporal Evolution and Socio-economic Drivers of Primary Air Pollutants from Energy Consumption in the Yangtze River Delta. China Environ. Manag. 2019, 11, 71–78. [Google Scholar] [CrossRef]
  42. IPCC. 2006 IPCC Guidelines for National Greenhouse Gas Inventories. Available online: http://www.ipcc-nggip.iges.or.jp./public/2006gl/index.html (accessed on 1 August 2022).
  43. Ramanathan, R. The moderating roles of risk and efficiency on the relationship between logistics performance and customer loyalty in e-commerce. Transp. Res. Part E 2010, 46, 950–962. [Google Scholar] [CrossRef]
  44. Zhao, J.Q.; Xiao, Y.; Sun, S.Q.; Sang, W.G.; Axmacher, J.C. Does China’s increasing coupling of “urban population” and “urban area” growth indicators reflect a growing social and economic sustainability? J. Environ. Manag. 2022, 301, 113932. [Google Scholar] [CrossRef]
  45. Liu, X.L.; Guo, P.B.; Yue, X.H.; Zhong, S.C.; Cao, X.Y. Urban transition in China: Examining the coordination between urbanization and the eco-environment using a multi-model evaluation method. Ecol. Indic. 2021, 130, 108056. [Google Scholar] [CrossRef]
  46. Cheng, X.; Long, R.Y.; Chen, H.; Li, Q.W. Coupling coordination degree and spatial dynamic evolution of a regional green competitiveness system–A case study from China. Ecol. Indic. 2019, 104, 489–500. [Google Scholar] [CrossRef]
  47. Fang, X.; Shi, X.Y.; Phillips, T.K.; Du, P.; Gao, W.J. The coupling coordinated development of urban environment towards sustainable urbanization: An empirical study of Shandong Peninsula, China. Ecol. Indic. 2021, 129, 107864. [Google Scholar] [CrossRef]
  48. Wu, X.; Wenqi, C.; Xinyu, D. Coupling and coordination of coal mining intensity and social-ecological resilience in China. Ecol. Indic. 2021, 131, 108167. [Google Scholar] [CrossRef]
  49. Ariken, M.; Zhang, F.; Liu, K.; Fang, C.L.; Kung, H.T. Coupling coordination analysis of urbanization and eco-environment in Yanqi Basin based on multi-source remote sensing data. Ecol. Indic. 2020, 114, 106331. [Google Scholar] [CrossRef]
  50. Li, J. Reconstruction of intelligent logistics model based on big data and cloud computing. China Circ. Econ. 2019, 33, 20–29. [Google Scholar] [CrossRef]
  51. Zheng, H.; Khan, Y.A.; Abbas, S.Z. Exploration on the coordinated development of urbanization and the eco-environmental system in central China. Environ. Res. 2021, 204, 112097. [Google Scholar] [CrossRef] [PubMed]
  52. Liu, C.; Gao, M.; Zhu, G.; Zhang, C.; Cai, W. Data driven eco-efficiency evaluation and optimization in industrial production. Energy 2021, 224, 120170. [Google Scholar] [CrossRef]
  53. Wang, C.; Zhang, C.; Hu, F.; Wang, Y.; Yu, L.; Liu, C. Emergy-based ecological efficiency evaluation and optimization method for logistics park. Environ. Sci. Pollut. Res. 2021, 28, 58342–58354. [Google Scholar] [CrossRef]
Figure 1. Research process.
Processes 11 00913 g001
Figure 2. Evaluation criteria for the synergy degree: same and adjacent base periods.
Processes 11 00913 g002
Figure 3. Data application diagram.
Processes 11 00913 g003
Figure 4. Orderliness of sequential parametric indicators of ESE-B composite system.
Processes 11 00913 g004
Figure 5. Orderliness of logistics industry ESE-B subsystems and synergy of composite systems.
Processes 11 00913 g005
Figure 6. Synergy degree of two-two subsystem of logistics industry ESE-B.
Processes 11 00913 g006
Table 1. The index system of LI’s ESE-B composite system.
SubsystemSequential Parametric Indicator LayerPropertiesReferences
LI
Economic
Benefits
subsystem
S1
Investment in fixed assets (billion yuan) E11Positive[9]
Number of cargo vehicles (million units) E12Positive[9]
Internet broadband access ports (million) E13Positive[7]
Cargo turnover (billion ton kilometers) E14Positive[21]
Value added of logistics industry (billion yuan) E15Positive[21]
Logistics industry contribution rate (%) E16Positive[21]
LI
Social
Benefits
Subsystem
S2
Logistics network mileage (million km) E21Positive[13]
Human resource input (10,000 people) E22Positive[13]
Total wages of urban personnel (billion yuan) E23Positive[38]
Vehicle tax revenue (billion yuan) E24Positive[38]
Number of traffic fatalities (persons) E25reverse[38]
Traffic accident property damage (million yuan) E26reverse[38]
LI
Environmental Benefits
Subsystem
S3
Energy consumption (million tons of standard coal) E31reverse [7]
Electricity consumption (billion kWh) E32reverse[13]
Greening coverage rate of built-up area (%) E33Positive[21]
Carbon emissions (million tons) E34reverse[7]
Exhaust gas emission (million tons) E35reverse[7]
Road traffic noise (decibels) E36 reverse[9]
Disclaimer/Publisher’s Note: The statements, opinions and data contained in all publications are solely those of the individual author(s) and contributor(s) and not of MDPI and/or the editor(s). MDPI and/or the editor(s) disclaim responsibility for any injury to people or property resulting from any ideas, methods, instructions or products referred to in the content.

