1. Introduction
According to the United Nation’s (UN) News, 55% of the world’s population lived in urban areas in 2018, estimated to rise to 68% by 2050 [
1]. The high population density in urban areas is often associated with air pollution and carbon emission problems [
2]. As urban populations and the number of motor vehicles simultaneously increase, and countries become more industrialized, air pollution becomes more and more of a serious problem. The urban population spends their time in the indoor environment every day. Indoor air pollution directly affects people’s health. Studies showed that more than 4.3 million deaths each year are caused by poor IAQ [
3]. Poor indoor air can lead to human discomfort, health problems, and even disease. Poor IAQ also has a negative impact on work efficiency. Poor indoor air will make staff emotionally irritable and physically tired and can even cause disease epidemics. Macao is a highly urbanized region with a very high population density of 27,259 inhabitants/km
2 [
4], and the total population of Macao reached 683,200 inhabitants in 2021 [
5]. Therefore, IAQ is a serious issue for a high-density environment such as Macao [
6,
7,
8]. There have been many related technical studies as the impact of IAQ on health has attracted more and more attention. The current understanding of the synergistic and antagonistic effects of multiple pollutants at low concentrations for a long time is not comprehensive.
This work focuses on the IAQ of shopping malls in Macao with frequent renovation projects. These projects of different sizes are carried out in operating buildings. However, the emission of PM
10 and PM
2.5 in the indoor environment caused by interior decoration is not thoroughly evaluated. More importantly, people spend about 90% of their time in indoor buildings, such as in schools, offices, and shopping centers [
9,
10,
11,
12]. Therefore, having a comfortable living environment and good IAQ are important factors that affect human health and work efficiency. The outbreak of COVID-19 in recent years has led to adopting social distancing measures such as school closures and working from home [
13]. This has led to an increase in indoor activities and the growing problem of indoor air pollution, which has different levels of impact on the human body, so providing a good IAQ environment can minimize health impacts and economic losses.
In recent years, many buildings in Macao have been undergoing renovation work which causes an increase in particulate matters (PM) in indoor building. For example, Sands China invested
$470 million in Hong Kong Dollars (HKD) in renovation projects of their premises in 2021. The concessionaire has invested more than
$100 billion HKD over the years [
14]. Nevertheless, there was minimal attention to indoor PM
2.5 emissions in numerous interior renovation projects. On-site operators are exposed to high concentrations of PM
2.5 for extended periods of time. The health of operators may be affected by the polluted air in the buildings. The emission of indoor PM
2.5 is a serious threat to human health.
The concept of IAQ was first proposed in the 1990s in Nordic Countries and North America, focusing on indoor air in non-production places, such as residences, offices, schools, hospitals, and hotels. Due to people who stayed indoors for a long time often feeling uncomfortable, new problems and concepts, such as SBS and Legionnaires’ disease, gradually emerged [
15]. People also realized that indoor air pollution was closely related to different diseases, such as asthma and lung cancer. SBS is a condition in which people experience acute health or comfort-related effects within a poor indoor environment, and the complaint may be for a specific room, area, or entire building, and research found that symptoms subsided or disappeared when the environmental elements causing SBS were removed [
16]. The symptoms of SBS include headaches, dizziness, nausea, eye, nose, or throat irritation, dry cough, dry or itchy skin, difficulty concentrating, fatigue, reduced sensitivity to smells, hoarseness, allergies, colds, flu-like symptoms, increased incidence of asthma attacks, and personality changes [
17]. The cause of these symptoms is unclear, but most victims said their symptoms could be relieved by leaving the property [
18].
Some possible main contributors to SBS include chemical pollutants, biological pollutants, insufficient ventilation, poor air circulation, psychological factors, insufficient and inappropriate lighting, and poor acoustics [
19,
20,
21,
22,
23,
24,
25,
26]. Symptoms of BRI include coughing, chest pains, shortness of breath with mild exertion, edemas, palpitations, nosebleeds, cancer, pregnancy problems, and miscarriages. In addition, extrinsic allergic alveolitis, Legionnaires’ disease, humidifier fever, pneumonia, and occupational asthma are also known to occur due to BRI [
27]. A large amount of formaldehyde was released inside buildings during the renovation process, which led to many residents experiencing acute irritation and poisoning symptoms, and some even suffered toxic hepatitis or allergic purpura [
28,
29]. These studies discovered that volatile organic compounds (VOCs) have a high contribution to indoor pollution sources for human exposure.
Systematic studies around IAQ initially focused on the relationship between indoor and outdoor air quality and the impact of indoor air pollutants on human health. The world’s first systematic and large-scale study of the relationship between indoor and outdoor air quality was conducted in 1965 [
30]. The study measured the relationship between indoor and outdoor SO
2, smoke, and dust, determining the relatively safe levels of IAQ during air pollution episodes. The relationship between smoking and indoor aerosol generation, indoor SO
2 attenuation, and building age was also explored. The results showed significant differences between indoor and outdoor air quality and that IAQ might have more of an impact on human health than outdoor air quality [
31].
This work hopes to establish a comprehensive management system for pre-assessment and to discuss IAQ management from the aspects of building material management, architectural design management, and facility management and to manage and control the level of IAQ in public places and civic buildings. In addition, this work aims to explore the correlation between the number of workers and the levels of PM2.5 concentrations in the shopping mall. Prior to this study, there were no measures being implemented, and on-site monitoring to assess the levels of PM2.5 concentrations was non-existent on this specific premises, which is a very concerning situation for both the workers and visitors. This study is the first assessment of the relationships between the level of PM2.5 concentrations, number of workers, and the construction processes in a large shopping mall in Macau.
2. Materials and Methods
In recent years, the government has made great efforts to promote Macao as a “World Center of Tourism and Leisure.” Shopping malls of different sizes and themes, each with its own unique architectural style, were built, large complexes combining food, drink, and entertainment, providing one-stop diversified facilities and attracting many tourists and locals, especially during weekends and holidays. In this study, fixed-point measurement was carried out on-site using low-cost portable monitoring sensors. As of now, there are no specific indoor air quality (IAQ) guidelines established or being enforced in the indoor buildings of Macao. Therefore, the IAQ standard would be the same as the ambient air quality standard established by the Macao Meteorological and Geophysical Bureau (SMG), which adopted the WHO Interim Target 2 (IT-2) standard.
The collected data were obtained using TSI Sidepak AM510 Personal Aerosol Monitor calibrated to factory settings, temporarily set up in two monitored areas, consisting of 2 h of data collection during the peak periods of the day when most shopping mall employees worked in their respective areas. The duration of monitoring campaign lasted for 14 days in each area. The collected data showed that the levels of PM2.5 concentration were different between these three collection points in two monitored areas, including Construction Site A and B and Renovation Area. During the construction phase, the level of PM2.5 concentration reached its peak because many processes were being performed, and different operation processes produced different levels of PM2.5 concentration. The construction site had a suitable hoarding, forming a barrier between the construction and public areas. In comparison, the renovation site was adjacent to the public area, in which the area was small and also had a suitable hoarding to prevent customers from entering by mistake. The measurement points in each area were chosen for the following reasons:
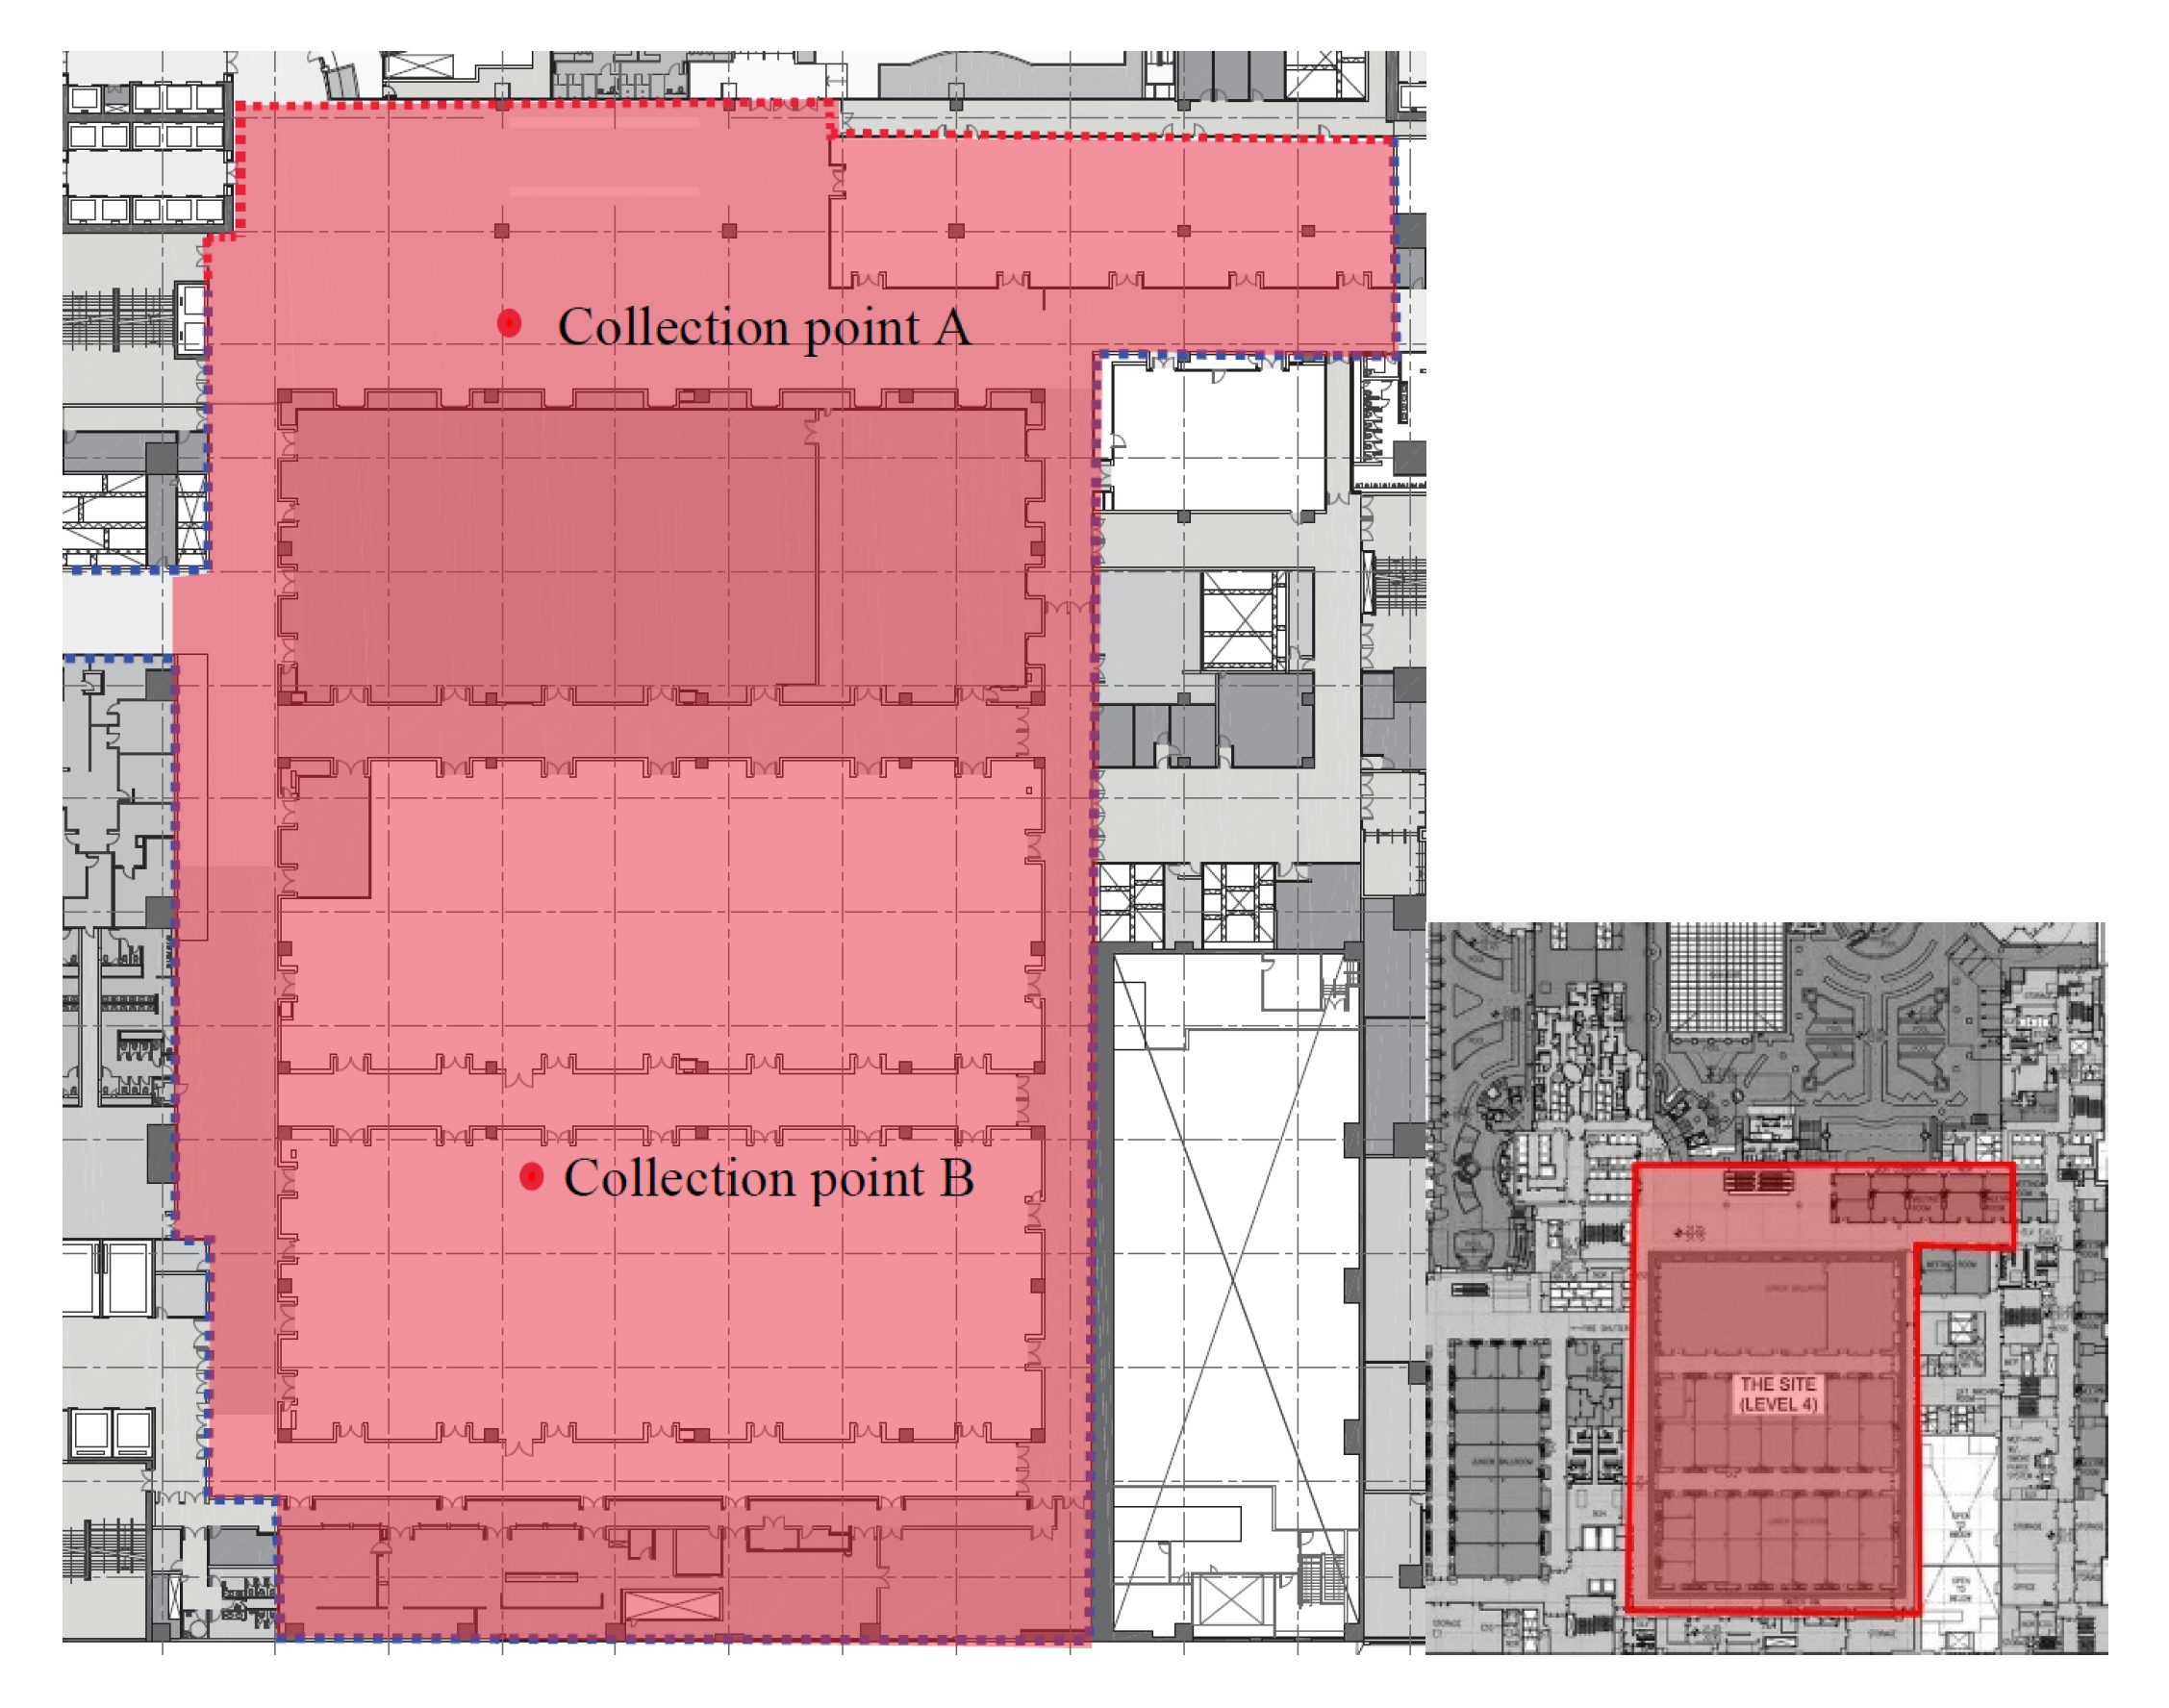
The construction area was large, with collection points A and B being core areas with complicated processes and dense flows of people. For this study, the monitored construction site was located on the upper floor of a shopping mall, with an area of about 11,000 m
2. Hence, it was important to monitor these locations for the IAQ of the mall. The demolition process caused the worst air pollution at the construction site, which generally emits a high concentration of PM
2.5, followed by the grinding and the drilling installation tasks.
Figure 1 shows the layout of the construction site.
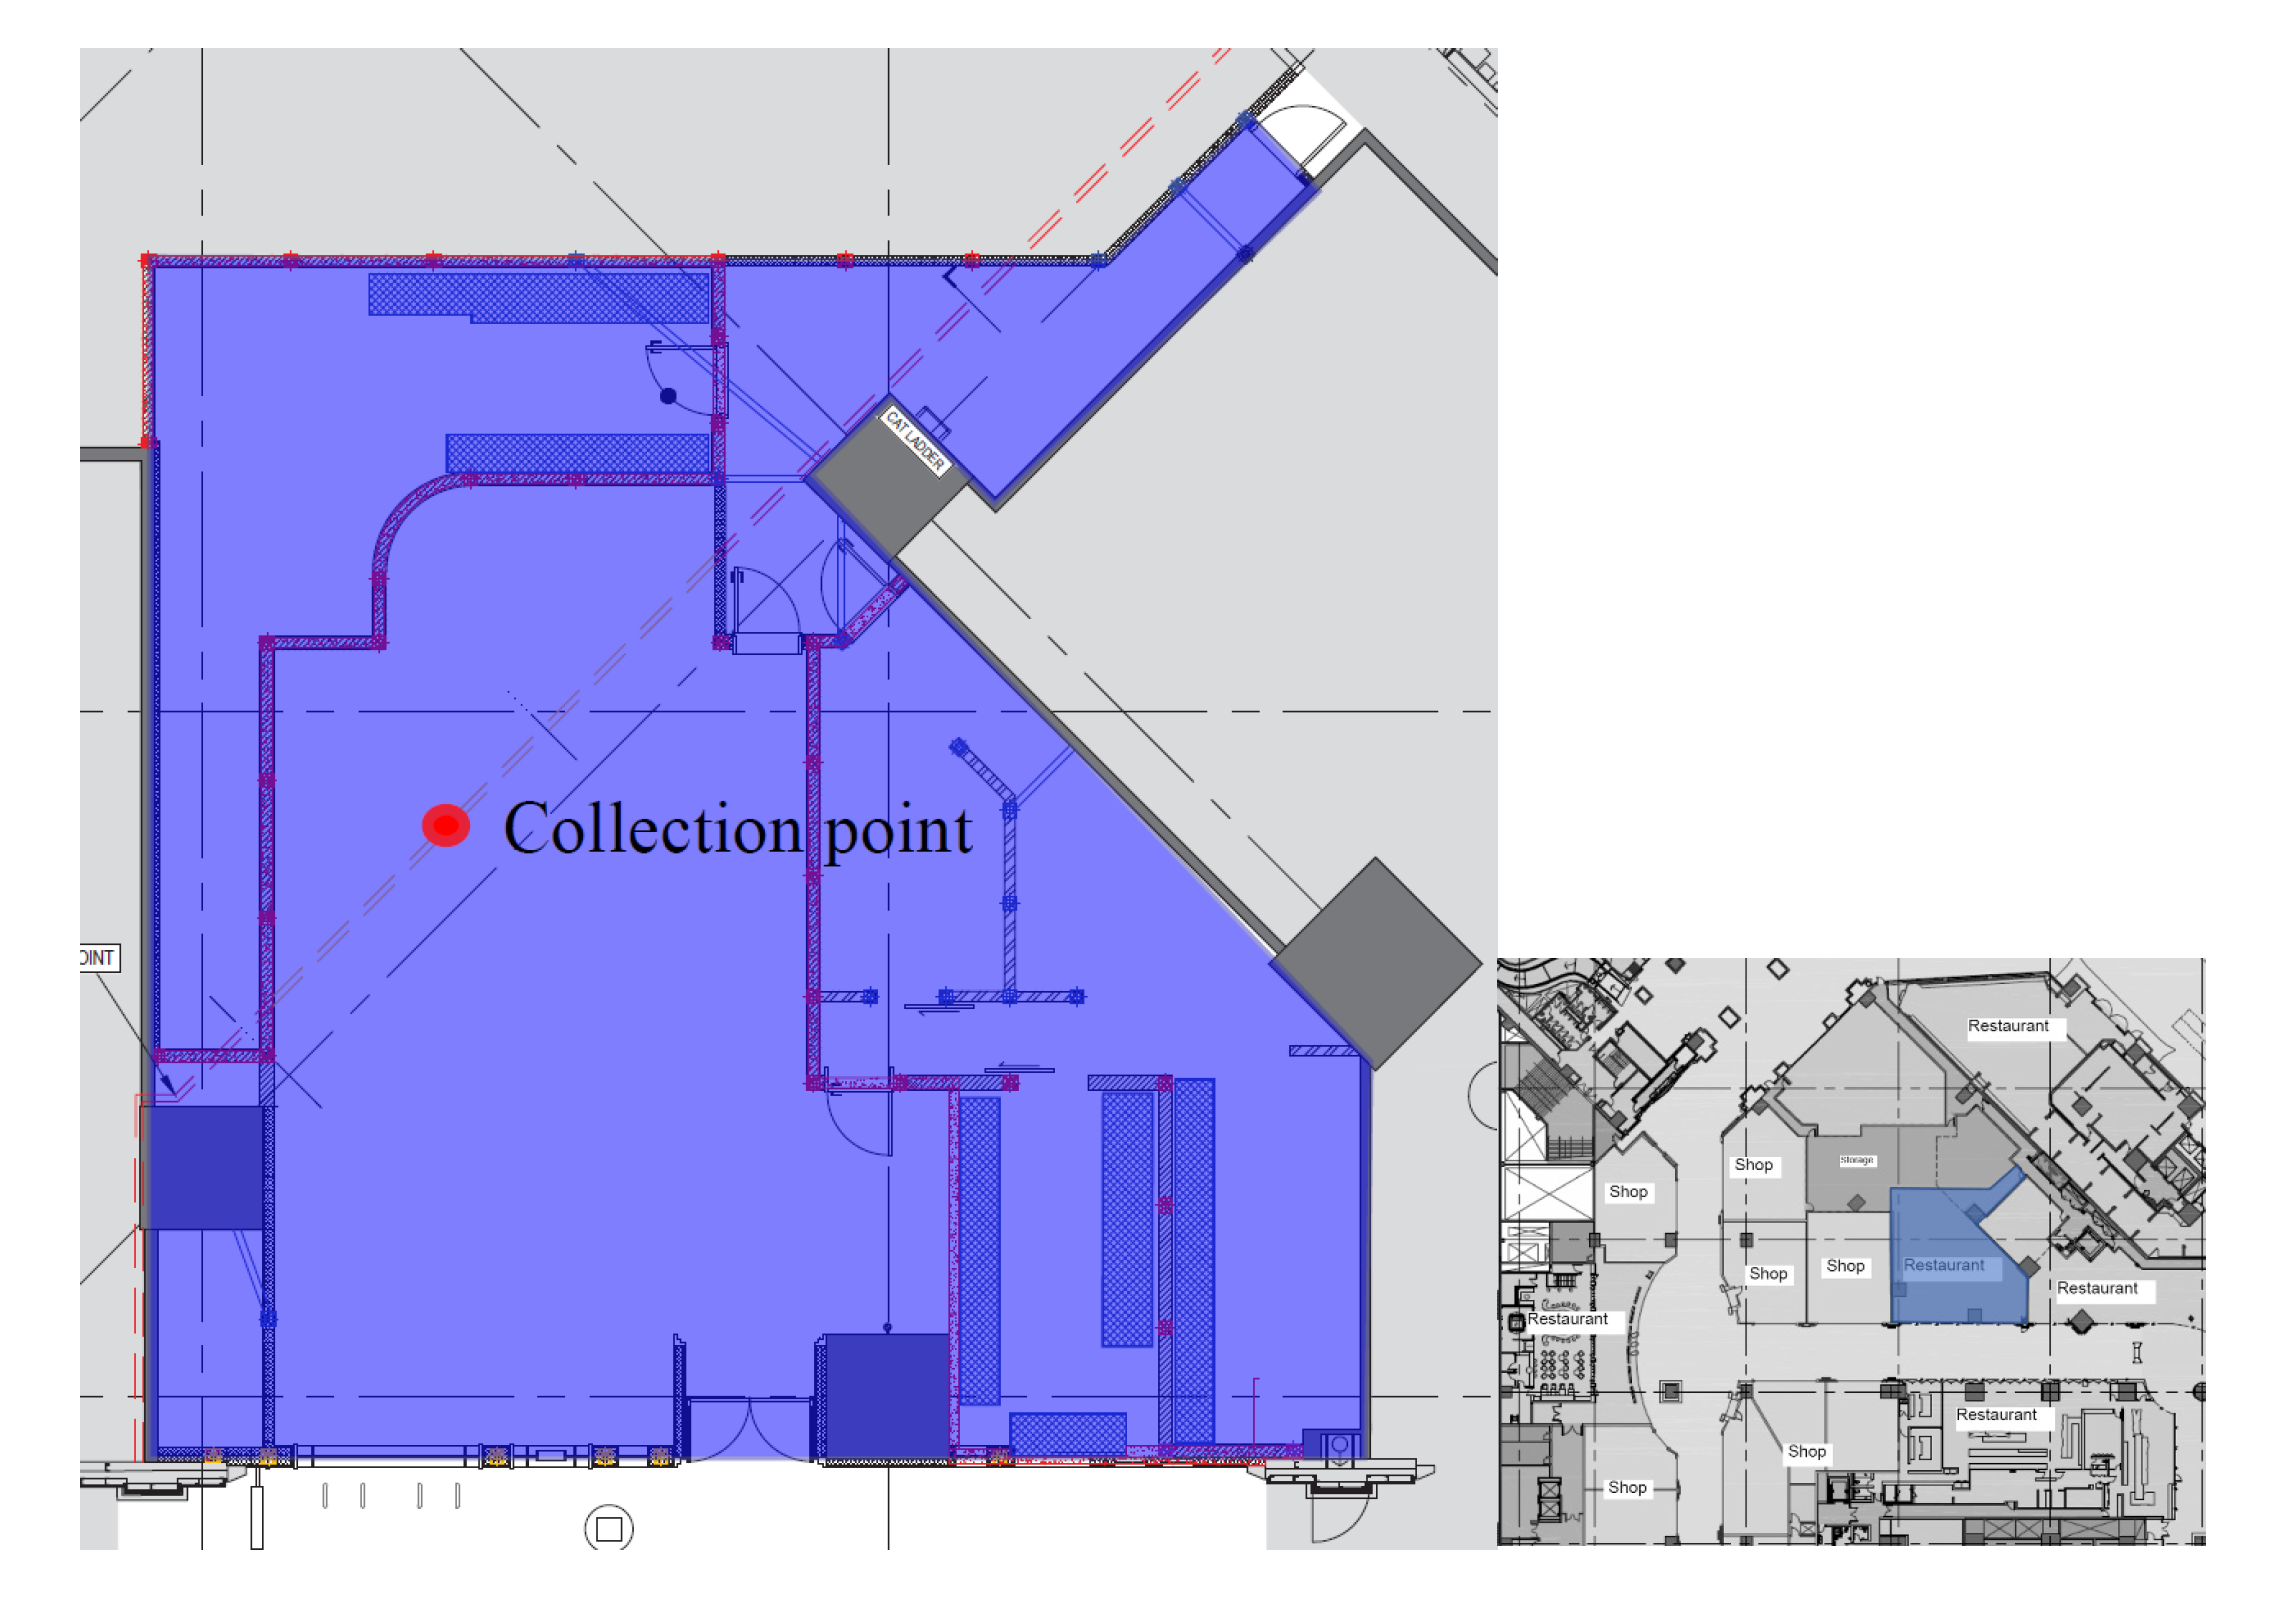
The renovation area measurement point was chosen because the scope of the store renovation was relatively small, and the collection point was chosen in the center of the district. For this study, the monitored renovation area was about 200 m
2 and located in the center of the shopping mall, near many shops and restaurants.
Figure 2 shows the collection point of the public area next to the store renovation area, and the measurement point was where the public gathered. The collected data reflect the impact of IAQ on the public and study the impact of PM
2.5 on the health of the operators. The peak levels of PM
2.5 concentration during the refurbishment were recorded during the cement-sand task when the cement and sand were mixed. The second highest levels recorded were during the grinding process, with a large amount of PM
2.5 emitted during the grinding of ceiling surface defects.
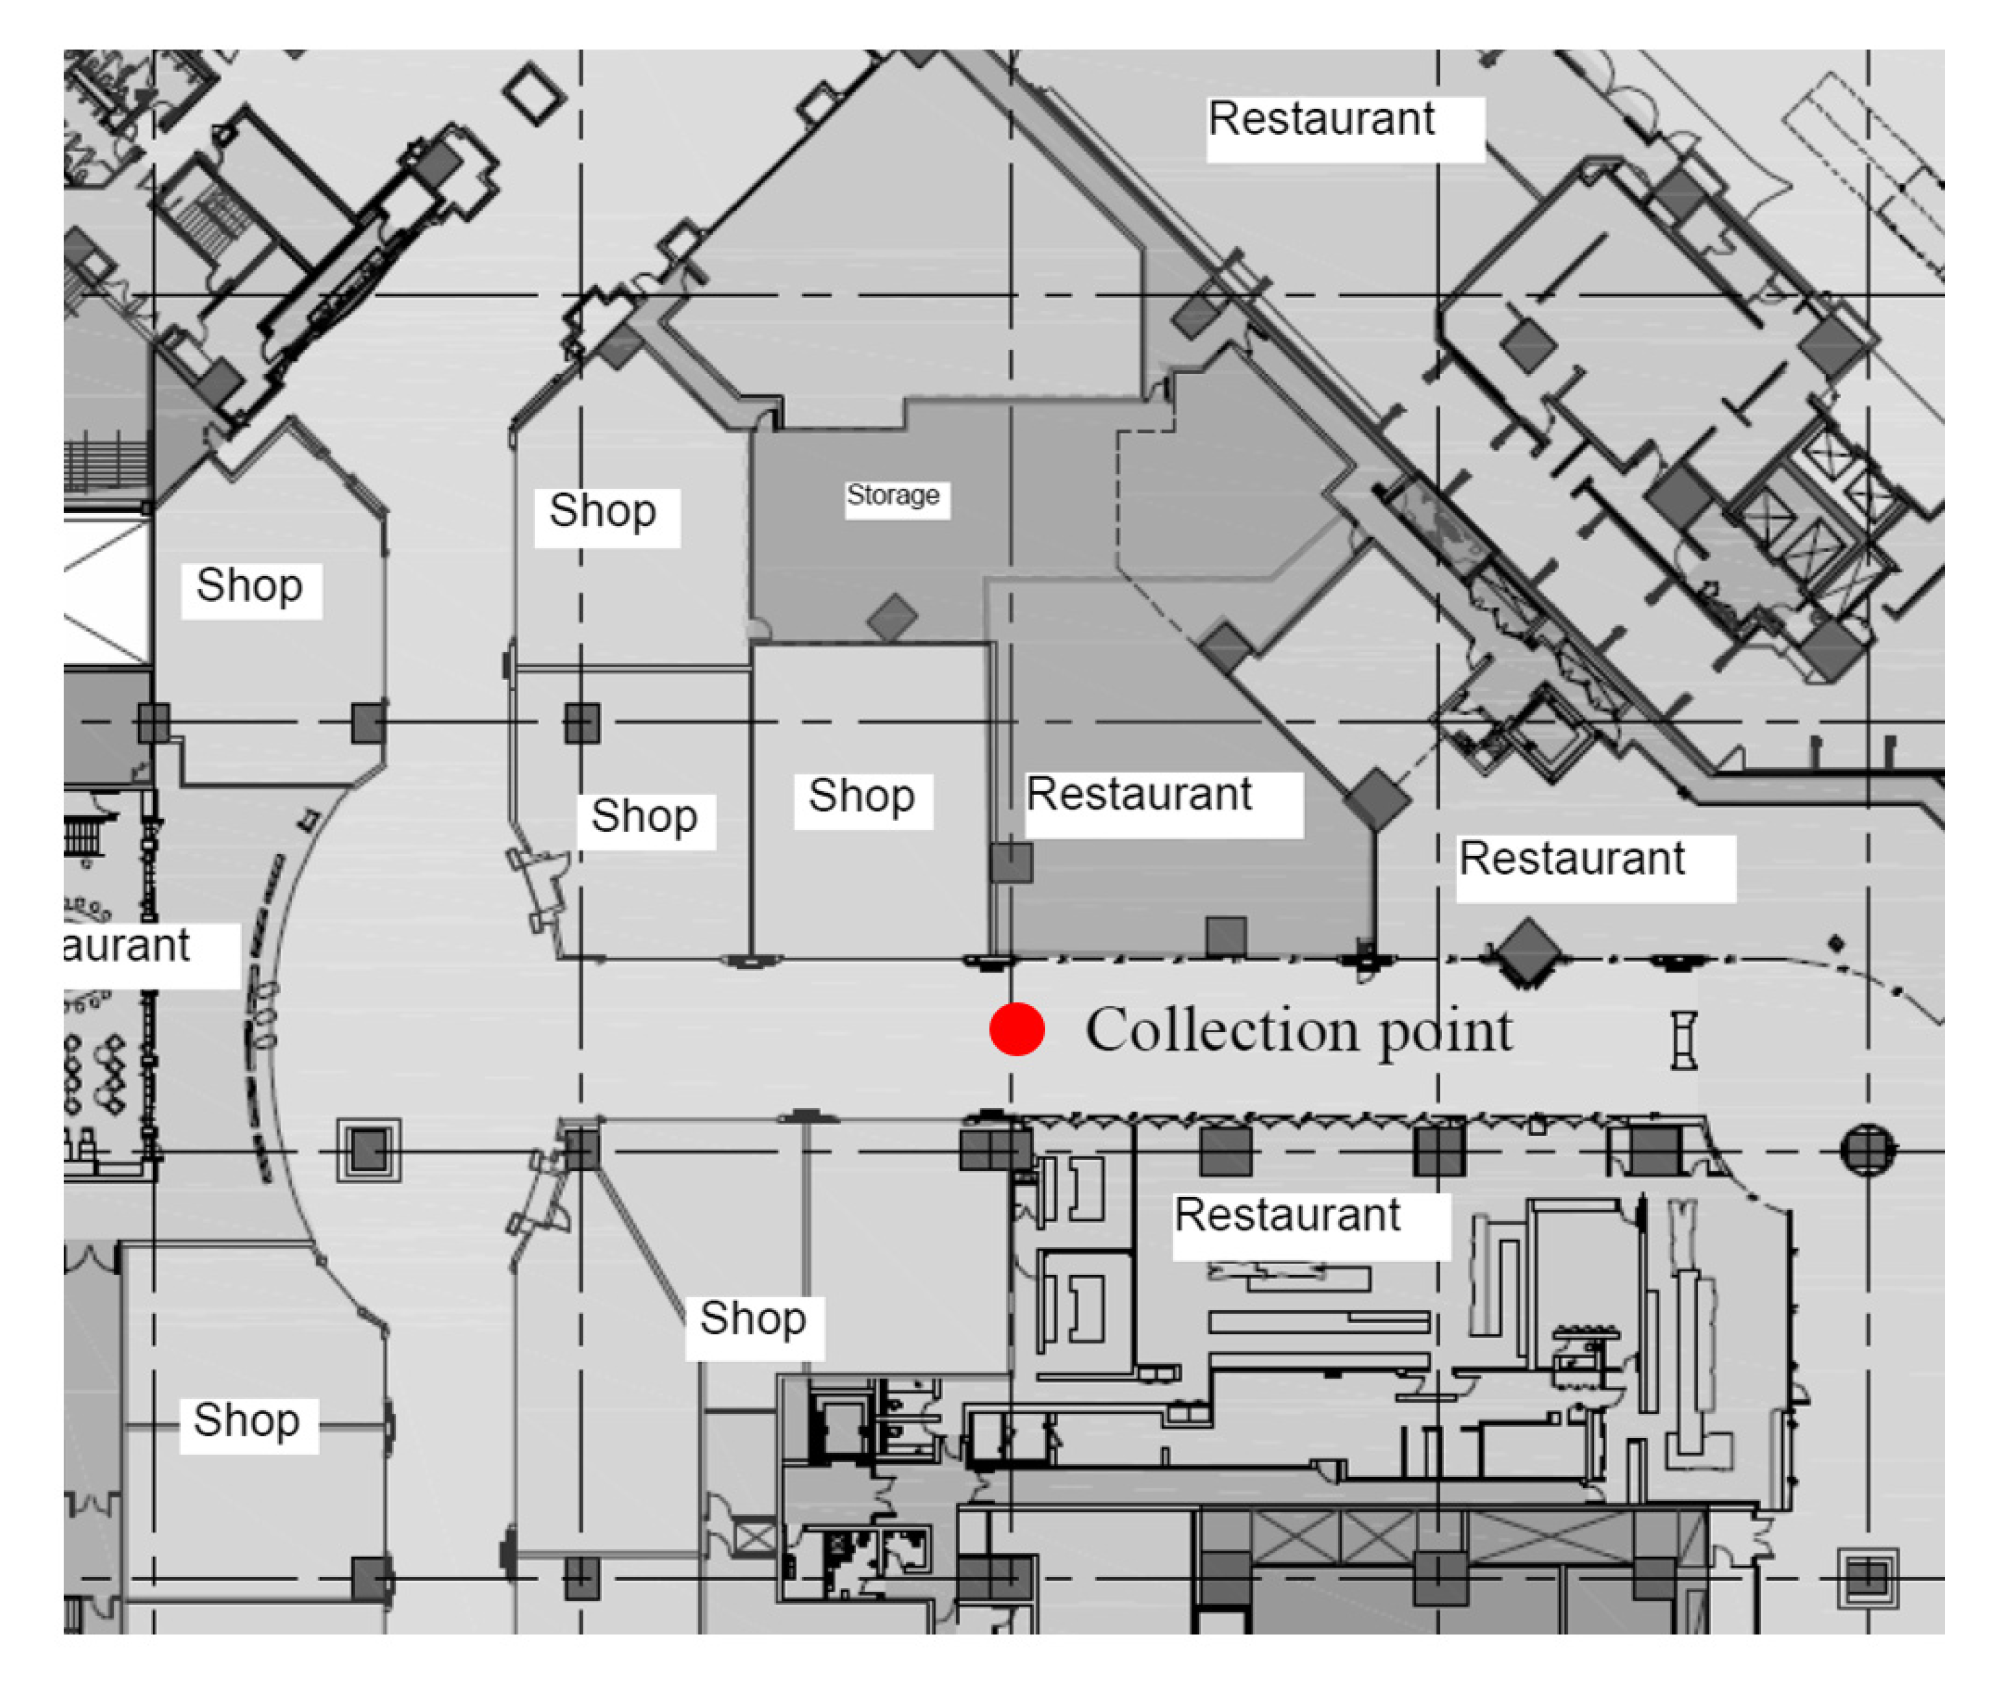
The public area of the shopping mall is where customers gather for a short period of time. Customers may go to the stores or restaurants through the high-traffic corridor, which is very congested during public holidays and festivals. As shown in
Figure 3, the collection point was located in a densely populated area. This study monitored the public area near the renovation area and collected the PM levels.
As part of this study, a survey on dust prevention measures was conducted. All 29 surveys received were completed by working professionals who applied at least one dust control measure in their working environment. The survey was voluntary and designed to allow the participants multiple answers to each question.
3. Results and Discussion
This section will discuss the levels of PM
2.5 concentrations during the 14-day monitoring campaign in the construction and renovation areas, with the public area being the control of this study. This section also explores the correlation between the number of workers and the observed values for PM
2.5 concentration in different locations, and the correlation between the levels of PM
2.5 concentrations and the meteorological parameters such as temperature and humidity. A previous study shows that each construction activity demonstrates different pattern and level of PM
2.5 concentration, and exposure to high concentration of PM
2.5 has caused impairment of lung function performance and led to respiratory health problems [
32]. In addition, the construction site needs to control and monitor its emission of PM
2.5 with a proper construction time management schedule on site [
33].
3.1. Construction Area
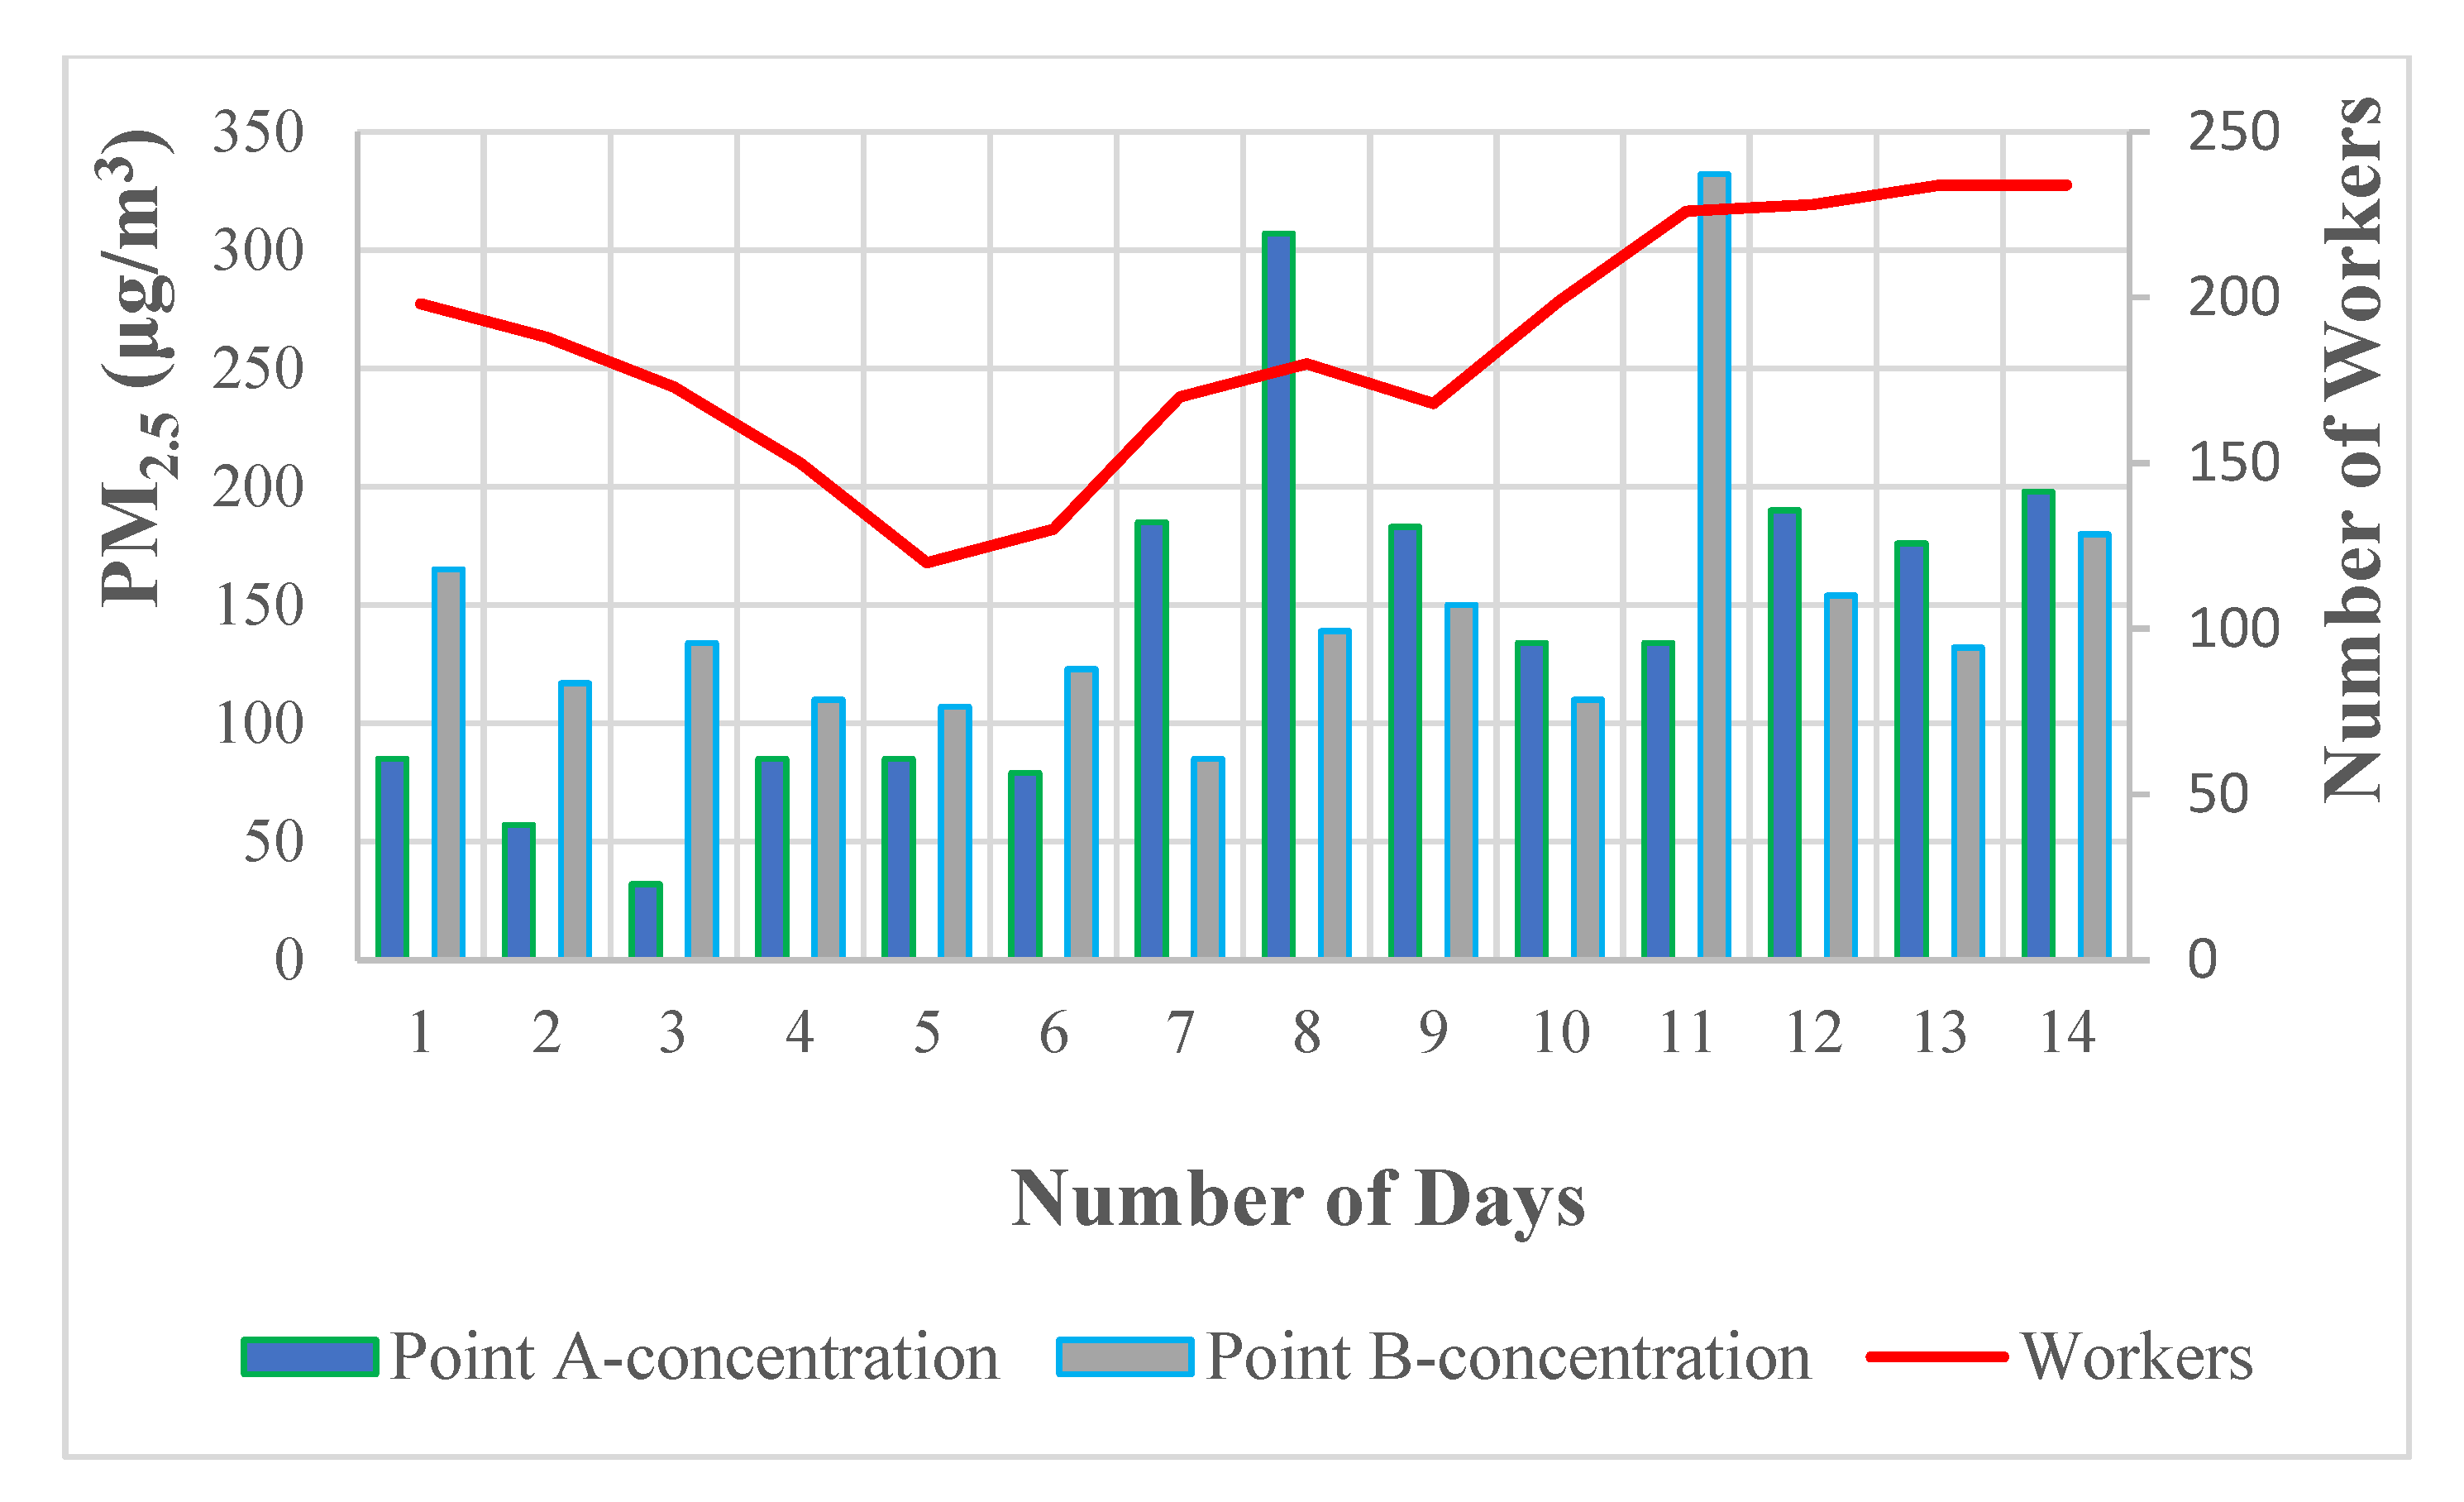
Figure 4 shows that the level of PM
2.5 concentration at the construction site of collection point A was significantly higher at 307.00 μg/m
3 on day 8 due to the spray-painting work. The level of PM
2.5 concentration at collection point B was significantly higher at 332.00 μg/m
3 on day 11 due to the drilling work. Painting and drilling work produce high levels of PM
2.5 concentration, so it is necessary to check whether the control measures on-site are sufficient. It is necessary to improve the personal protective equipment (PPE) of the on-site personnel, such as by wearing N95 filter masks.
As shown in
Table 1, descriptive statistics were obtained for the mean, median mode, minimum, and maximum concentration of PM
2.5. Point B has a higher mean value for PM
2.5 compared to point A at the construction site due to the demolition and drilling work. Since there are many elderly people and children in the shopping malls, the use of a blower fan is recommended to manage PM
2.5 inside the shopping malls.
3.2. Renovation Area
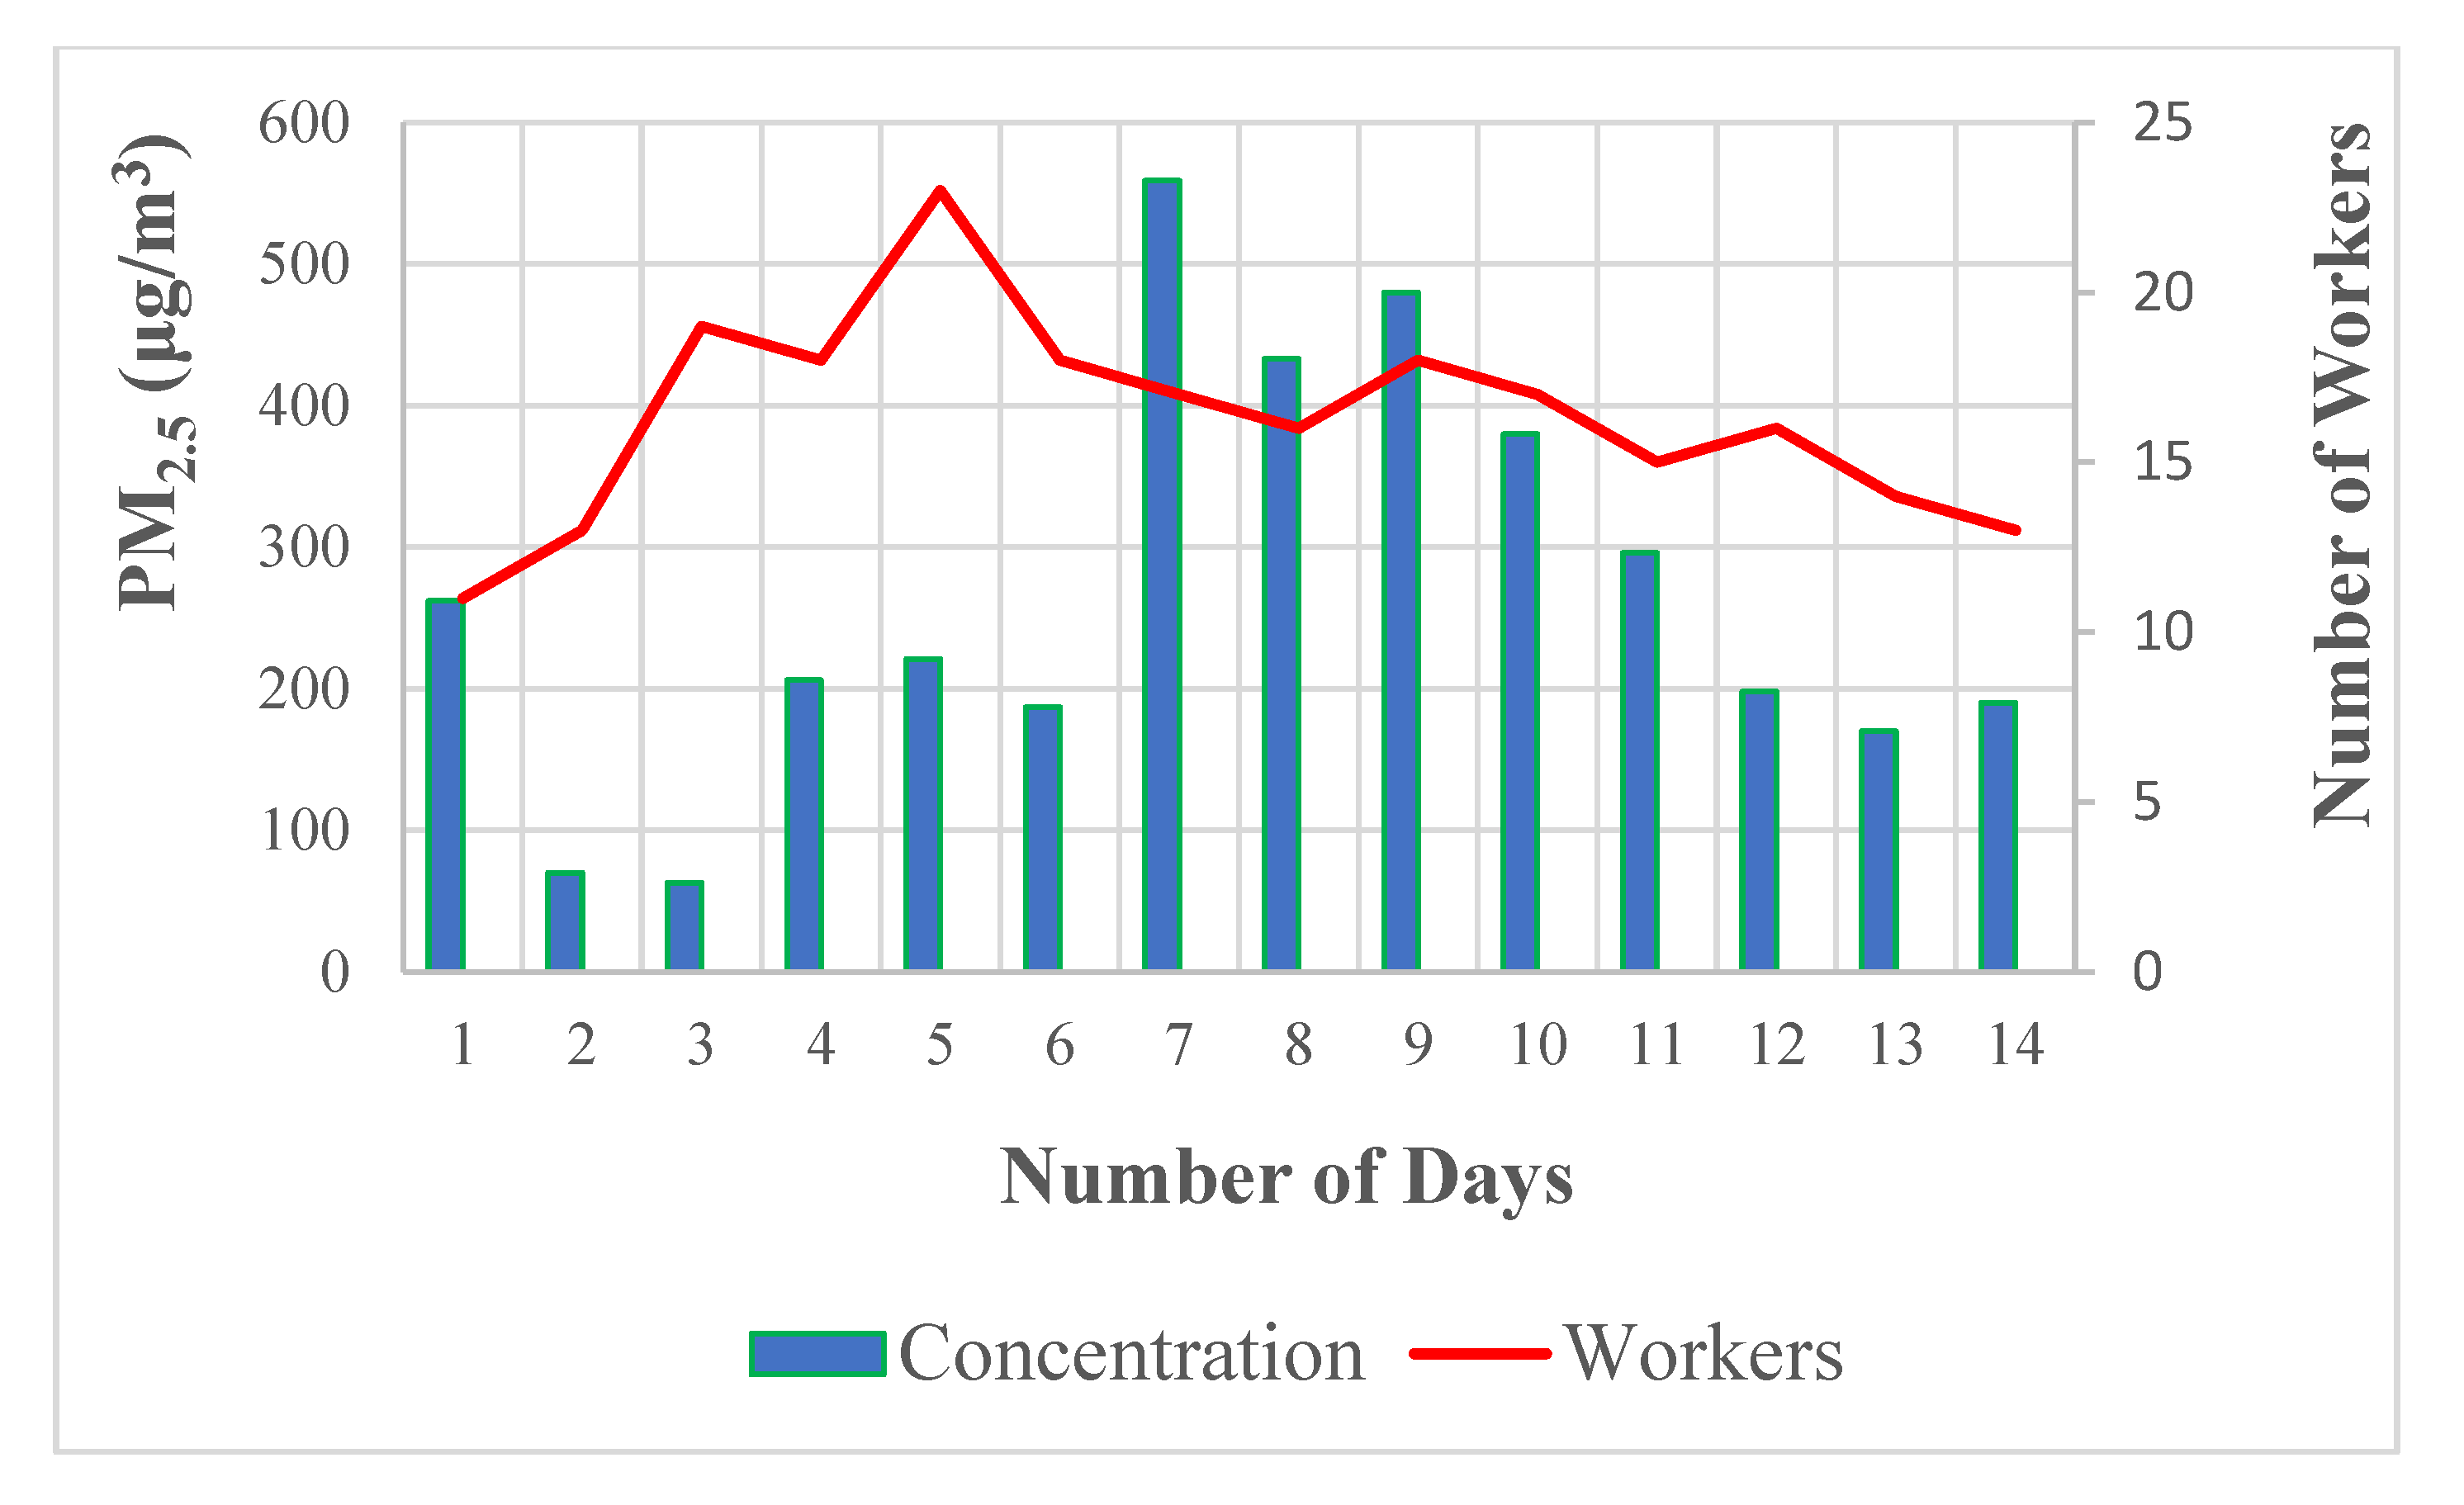
Figure 5 shows the extremely high level of PM
2.5 concentration from days 7 to 9 because of the cement-sand mixing task, with day 7 reaching a peak of 559 μg/m
3. After the mixing task was completed, the level of PM
2.5 concentration slowly dropped to a more reasonable level.
The data collected on site showed no significant relationship between the number of workers and the level of PM2.5 concentration. The high level of PM2.5 concentration was recorded during special tasks, such as cement-sand mixing, drilling, and demolition work. The collected data showed the high levels of PM2.5 concentration produced during these special tasks. Thus, corresponding control measures should be developed to reduce the high levels of PM2.5 concentration.
Table 2 shows a descriptive analysis of the renovation area. The level of PM
2.5 concentration at the renovation site has a high peak, exceeding the levels in the construction area. The high PM
2.5 levels were caused by the cement-sand mixing task. Thus, the use of cement slurry mixers should be adopted by the shopping mall, and protective measures should be taken in advance. Hence, it is clear that the shopping mall staff should consider each renovation carefully to ensure a safe level of IAQ is guaranteed.
3.3. Public Area
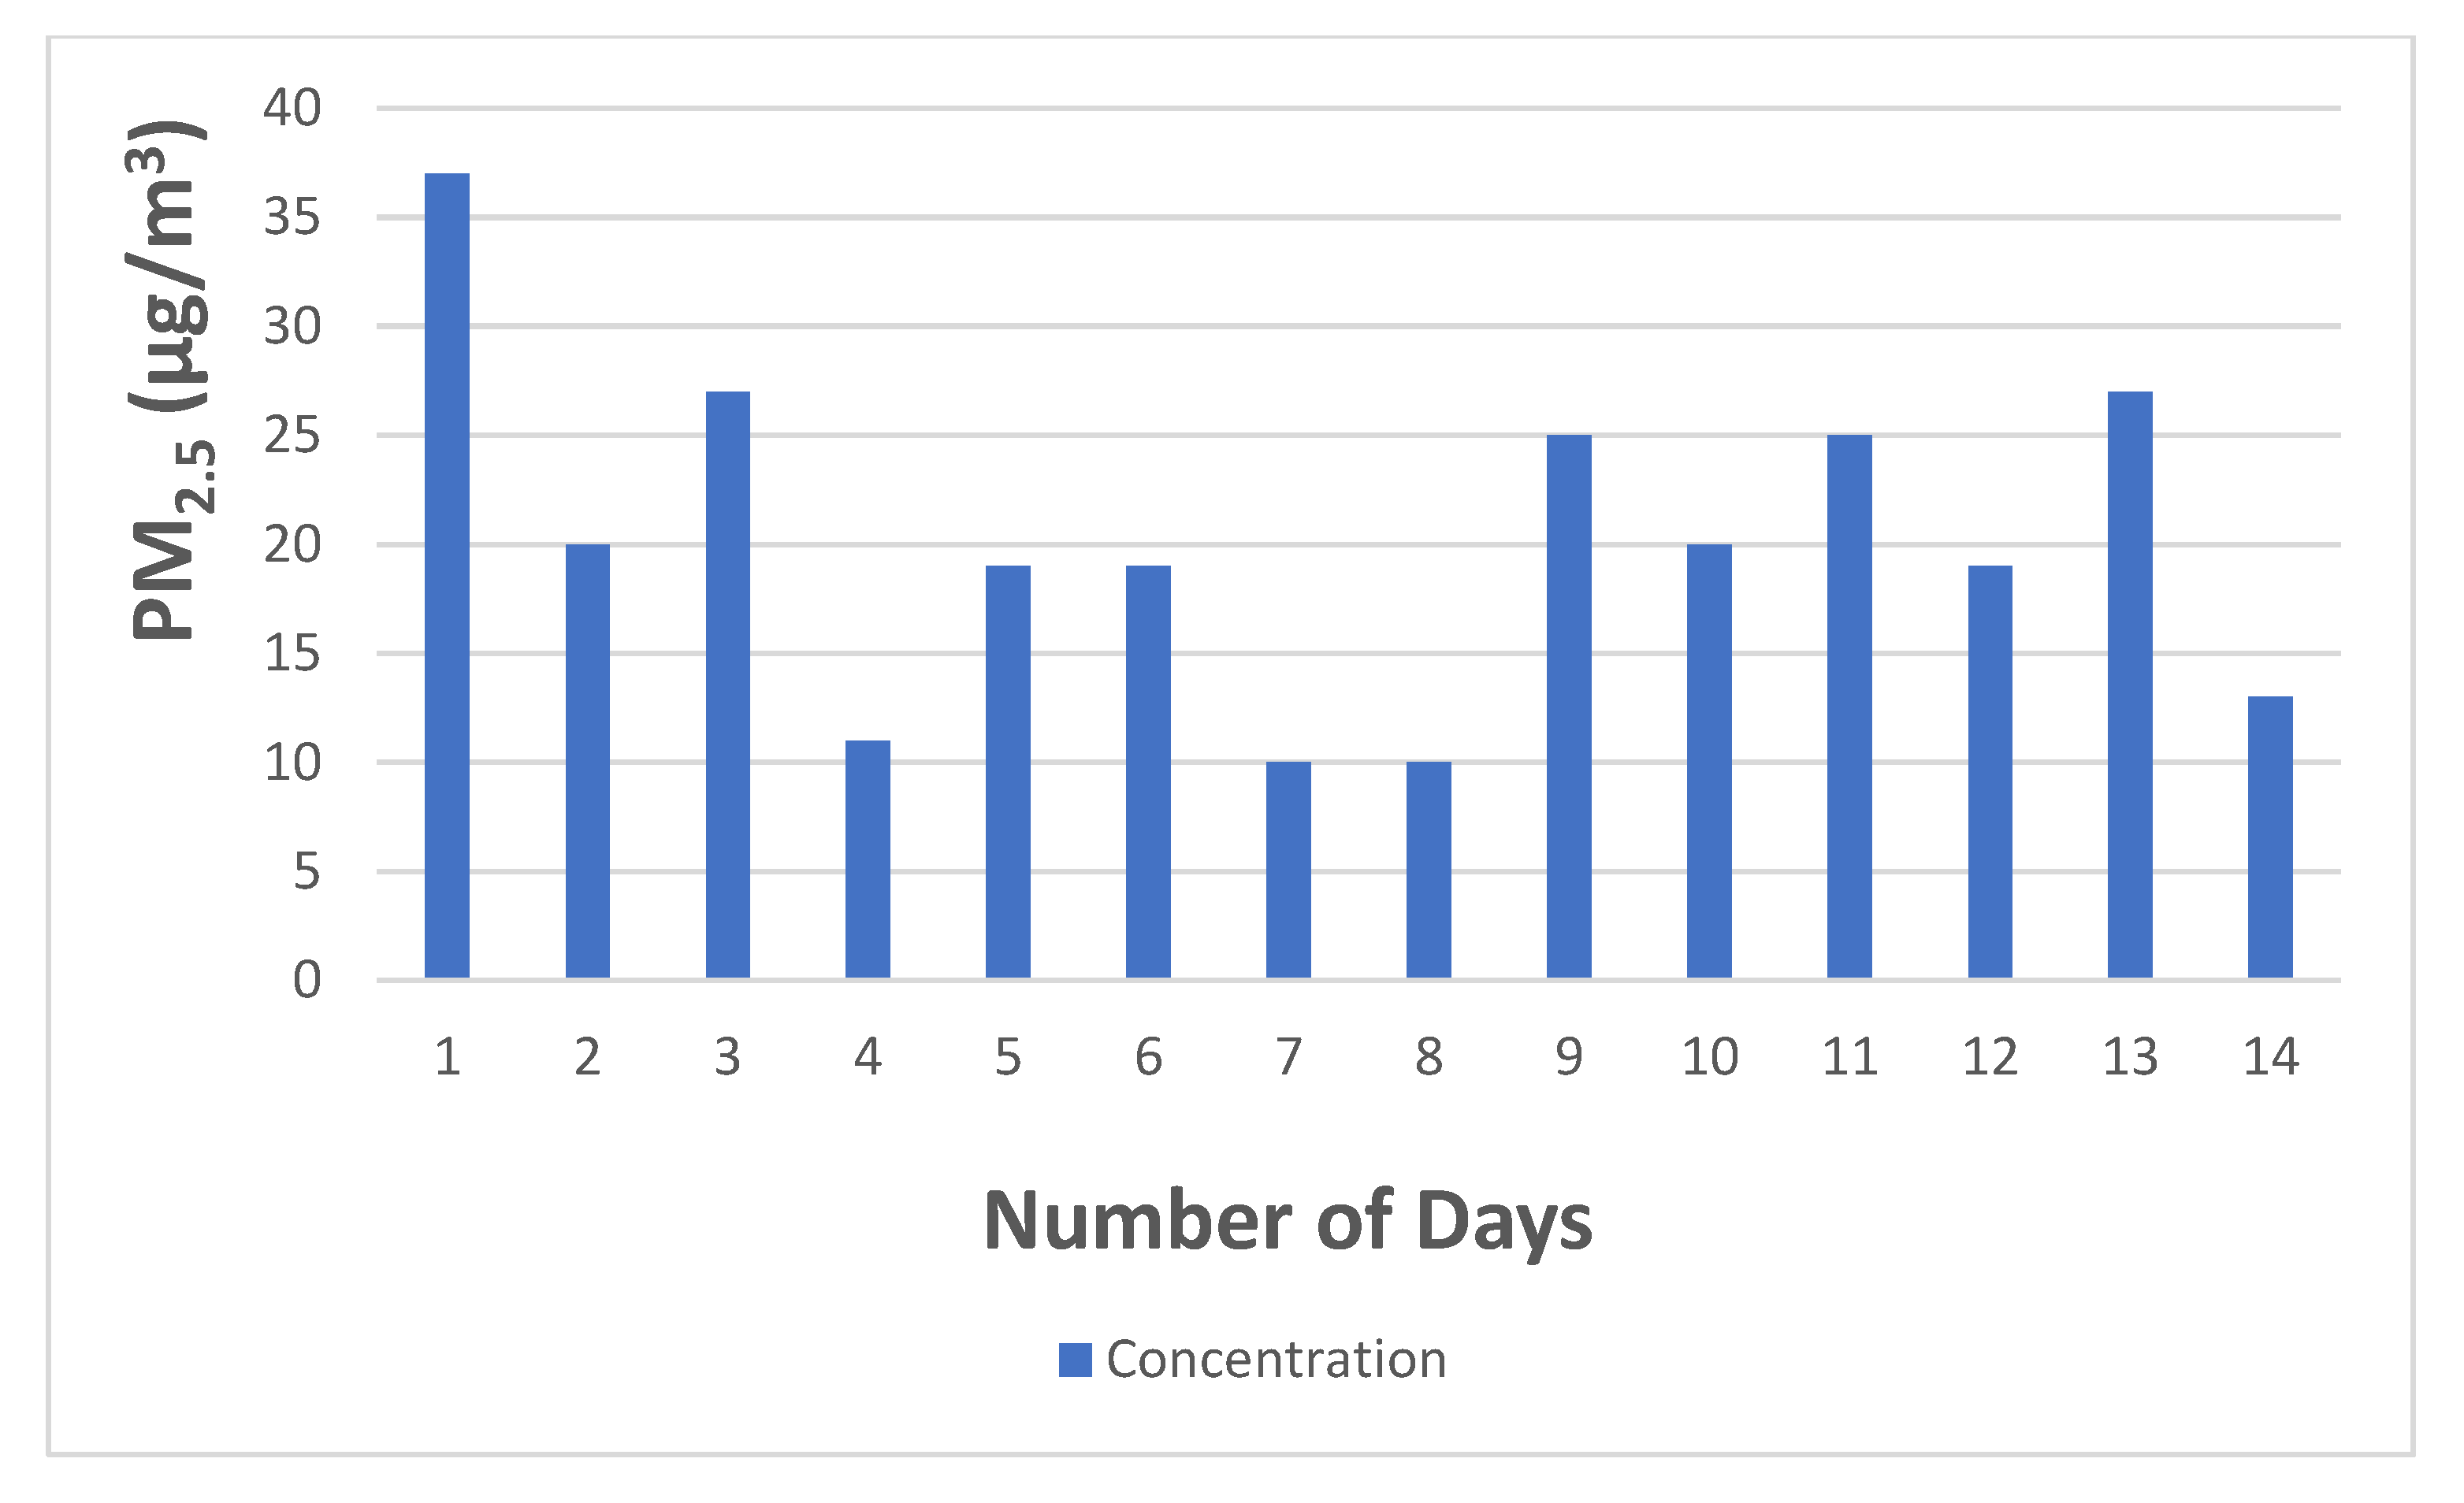
Figure 6 shows the levels of PM
2.5 concentration in the public area, which is also the control of this study. The results show the levels of PM
2.5 concentration to be significantly lower than in the construction and renovation area, with the peak levels being measured at only 37 μg/m
3 on day 1.
Table 3 shows a descriptive analysis of the public area. The level of PM
2.5 concentration at the public area has a mean of 20.14 μg/m
3, which is well below the levels measured in the construction and renovation area. This shows that the processes being performed in the construction and renovation area have led to a burst of PM
2.5 in a short period of time, causing a health hazard to the on-site personnel.
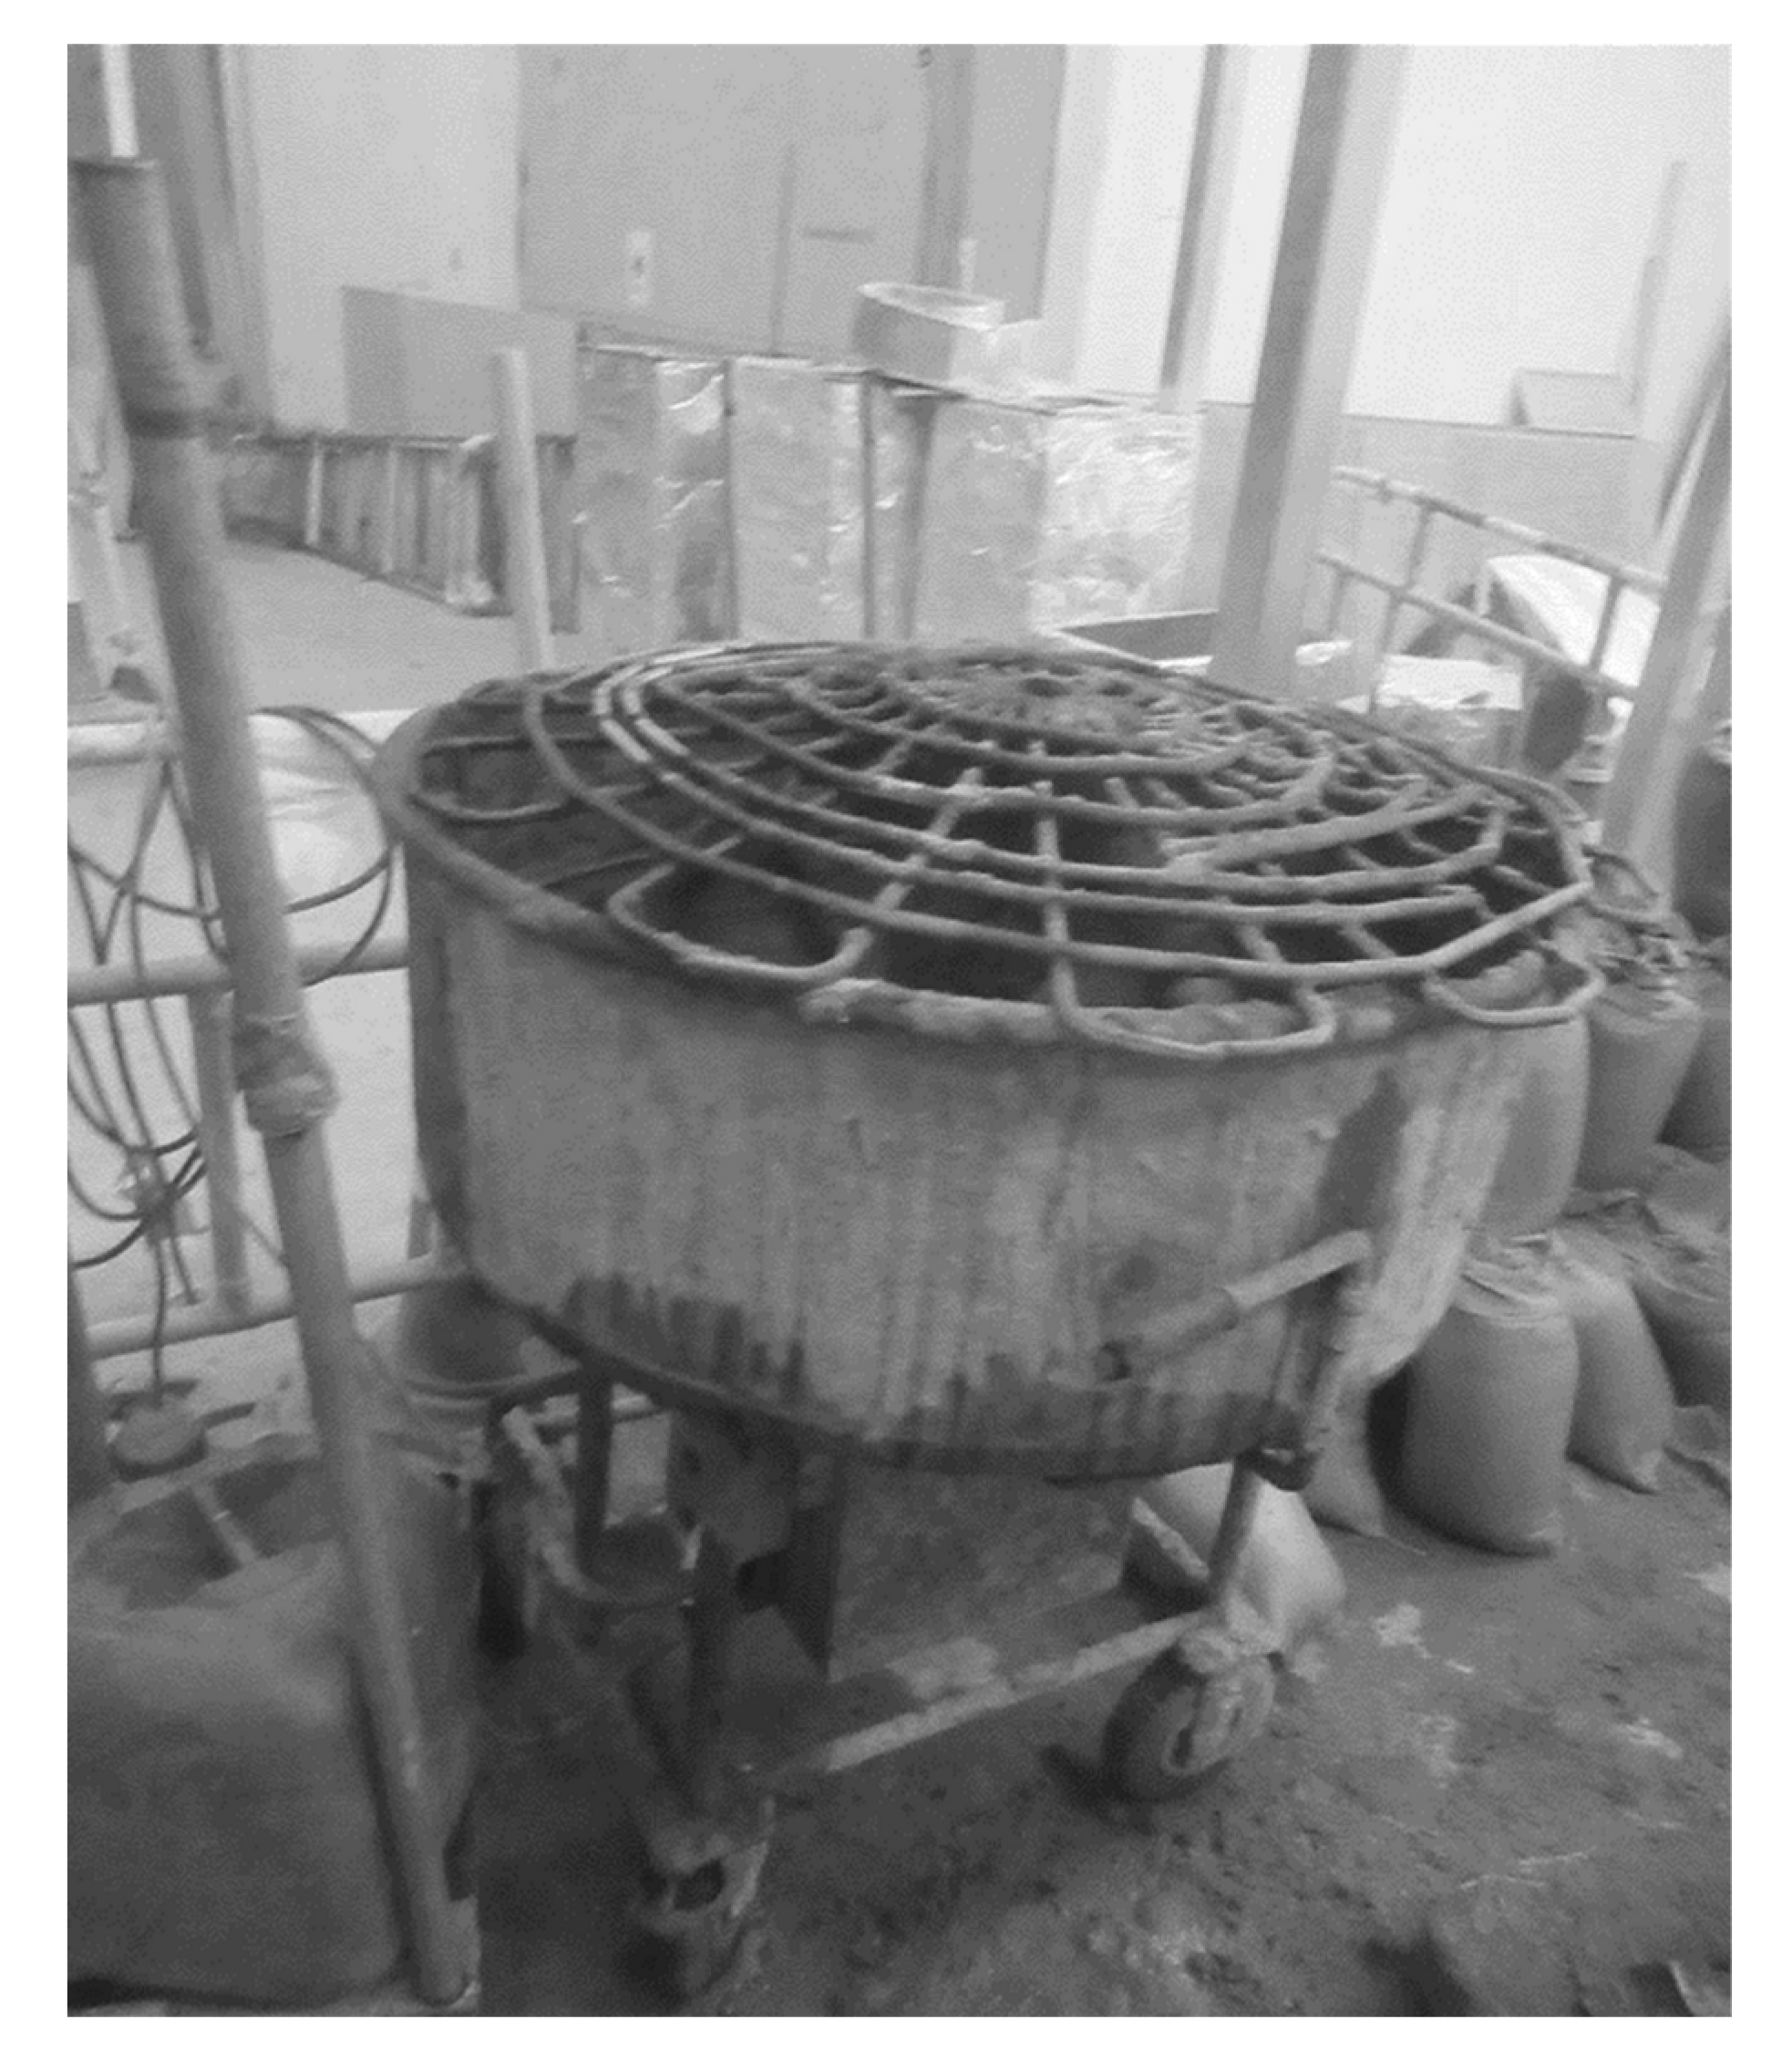
Figure 7 shows a cement slurry mixer commonly found in the construction industry and is used to mix cement and water into a uniform slurry, which can lower the emission of PM
2.5 in a construction environment.
3.4. Correlation between Workers and PM2.5 Concentrations
According to
Table 4, the correlation coefficient (r) between point A and point B is very low (r = 0.10). Thus, there is no correlation between these two collection points. Nevertheless, the number of workers and PM
2.5 concentration in point A has a low-to-medium correlation (r = 0.38), and the number of workers and PM
2.5 concentration in point B has a medium-to-high correlation (r = 0.51). Overall, the correlation between the levels of PM
2.5 and the number of workers in the construction area (r = 0.38 to 0.51) is too low to show any relationship between them.
As shown in
Table 5, the number of workers and PM
2.5 concentration in the renovation area shows a low correlation (r = 0.11), which show there is no relationship between the levels of PM
2.5 and the number of workers in the renovation area.
As shown in
Table 6, the average temperature and relative humidity during the 14 days of the monitoring campaign are 21.9 °C and 50.1%, respectively.
As shown in
Table 7, the correlation coefficient between the levels of PM
2.5 concentration in the construction area A and B and the temperature is low (r = 0.23 to 0.50) and the humidity is very low (r = −0.17 to 0.24). The correlation coefficient between the levels of PM
2.5 concentration in the renovation area and the temperature is medium (r = 0.55) and the humidity is low (r = 0.17). The correlation coefficient between the levels of PM
2.5 concentration in the public area and the temperature is medium (r = 0.52) and the humidity is medium (r = −0.55). Overall, there is a low-to-medium correlation between the meteorological parameters and the levels of PM
2.5 concentrations in all areas.
Hence, the use of prefabricated cement parts and structures constructed in the factory and only brought on-site for installation is recommended. In addition, optimizing work team structures and introducing robots for certain tasks will help to minimize human exposure to PM2.5 generated by cement-sand mixing tasks. Additionally, it is recommended that there should be fewer workers for demolition work, which could reduce threats to workers’ health due to poor IAQ. The shopping mall may consider optimizing the work team structure and even introduce robots to replace some manual labor.
3.5. On-Site Survey
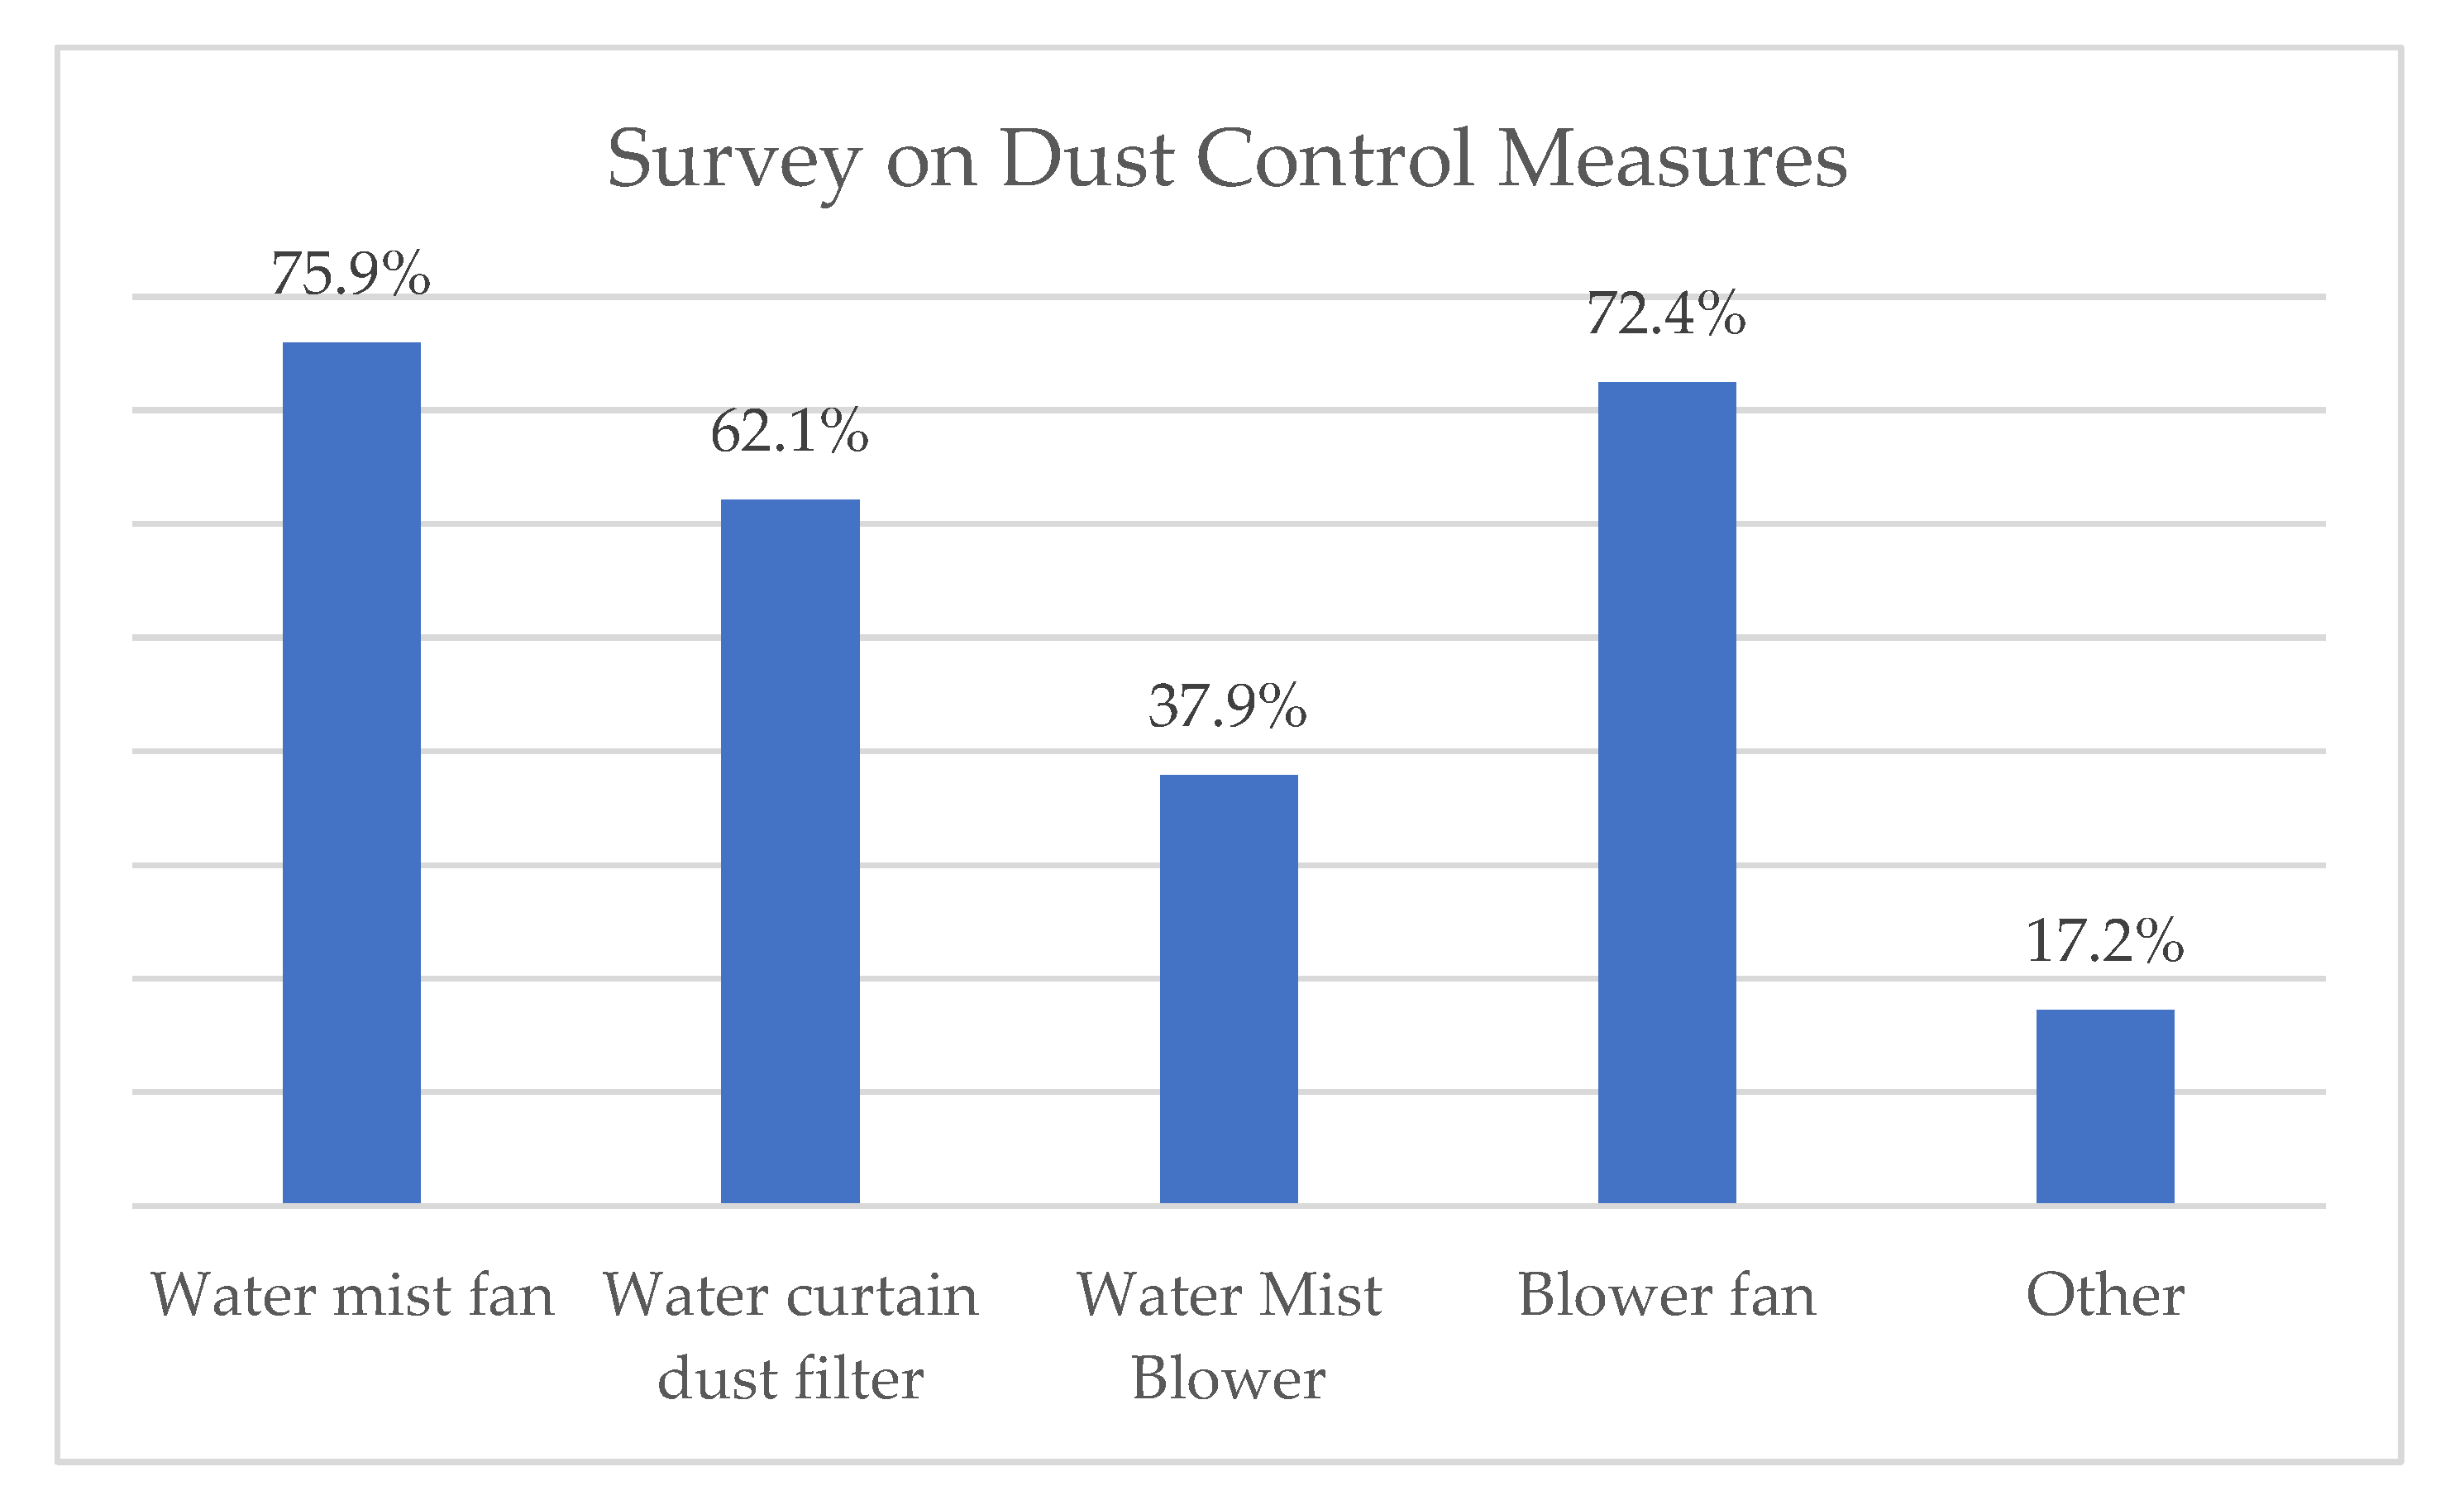
As shown in
Figure 8, 75.9% of the respondents believed that watering and spraying were the best control measures due to the relatively low cost of the humidification and dust reduction equipment and the smaller portable machines needed for this. Over 72.4% of respondents believed blower fans to be effective measures, with the advantages of relatively low cost, lightness, and flexibility of use. Furthermore, only 62.1%, and 37.9% of respondents believed water curtains and water mist blowers to be effective due to their large size and inability to be moved freely. Other measures, such as dust filters and curtain separators, were the least popular, only selected by 17.2% of the respondents. According to the survey results, preventing dust at the source is the most effective mitigation method.


