Article

Prediction of Molecular Weight of Petroleum Fluids by Empirical Correlations and Artificial Neuron Networks

1
LUKOIL Neftohim Burgas, 8104 Burgas, Bulgaria
2
Institute of Biophysics and Biomedical Engineering, Bulgarian Academy of Sciences, Georgi Bonchev 105, 1113 Sofia, Bulgaria
3
Intelligent Systems Laboratory, Department Industrial Technologies and Management, University Prof. Dr. Assen Zlatarov, 8010 Burgas, Bulgaria
4
Department of Mathematics, University of Chemical Technology and Metallurgy, Kliment Ohridski 8, 1756 Sofia, Bulgaria
*
Author to whom correspondence should be addressed.
Processes 2023, 11(2), 426; https://doi.org/10.3390/pr11020426
Submission received: 24 November 2022 / Revised: 19 January 2023 / Accepted: 27 January 2023 / Published: 31 January 2023

Abstract

:
The exactitude of petroleum fluid molecular weight correlations affects significantly the precision of petroleum engineering calculations and can make process design and trouble-shooting inaccurate. Some of the methods in the literature to predict petroleum fluid molecular weight are used in commercial software process simulators. According to statements made in the literature, the correlations of Lee–Kesler and Twu are the most used in petroleum engineering, and the other methods do not exhibit any significant advantages over the Lee–Kesler and Twu correlations. In order to verify which of the proposed in the literature correlations are the most appropriate for petroleum fluids with molecular weight variation between 70 and 1685 g/mol, 430 data points for boiling point, specific gravity, and molecular weight of petroleum fluids and individual hydrocarbons were extracted from 17 literature sources. Besides the existing correlations in the literature, two different techniques, nonlinear regression and artificial neural network (ANN), were employed to model the molecular weight of the 430 petroleum fluid samples. It was found that the ANN model demonstrated the best accuracy of prediction with a relative standard error (RSE) of 7.2%, followed by the newly developed nonlinear regression correlation with an RSE of 10.9%. The best available molecular weight correlations in the literature were those of API (RSE = 12.4%), Goosens (RSE = 13.9%); and Riazi and Daubert (RSE = 15.2%). The well known molecular weight correlations of Lee–Kesler, and Twu, for the data set of 430 data points, exhibited RSEs of 26.5, and 30.3% respectively.

1. Introduction

In petroleum engineering simulations to design new equipment or rate the existing one the molecular weight of the petroleum fluids is one of the most important characterization parameters [1,2,3,4,5]. It affects thermodynamic phase equilibrium, reaction kinetics, and vapor density calculations [5]. The measurement of petroleum fluid molecular weight is not a simple job, and, depending on the method used, either vapor pressure osmometry or freezing point depression, some discrepancies may arise [6]. For example, Powers et al. [7] reported repeatability of 15% for molecular weight measurement of asphaltenes, while Yarranton et al. [8] reported repeatability of 12% for saturates/aromatics/resins (SAR), and Lemus et al. [2] reported repeatability of ±15% for the bitumen and its distillation cuts. All these studies [2,7,8] employed vapor pressure osmometry. Thus, petroleum fluid molecular weight has the highest measurement uncertainty of the three main physical properties: boiling point, specific gravity, and molecular weight [1]. Considering the higher precision of measurement of boiling point and specific gravity, several empirical correlations were developed to predict petroleum fluid molecular weight from boiling point and specific gravity (density) [1,2,6,7,8,9,10,11,12,13,14,15,16,17,18,19,20,21,22,23]. Schneider [6] summarized the petroleum fluid molecular weight correlations, which appeared in the period 1964–1984. He concluded that the molecular weight correlation selected impacts engineering calculations to a significant degree [6]. During simulation of a crude distillation column for Bachaquero crude feed constant side-draw product rates, constant barrels per day (bpsd) overflash, constant column bottoms true boiling point (TBP) 5% point flash zone temperature variations of 10 to 30 °F, and heater duty differences of 5 to 10%, were obtained when different molecular weight correlations were employed [6]. Such large variations, he concluded, would make the process design and troubleshooting inaccurate. Unfortunately, he did not point out which of the studied molecular weight correlations were most appropriate. Instead he deduced that a molecular weight correlation used for any purpose should not be extended beyond the limits for which it is valid without caution. Goosens [9] announced in his research that a major oil company had reviewed 37 different methods and their marked deviations beyond molecular weights of 300 g/mol. A major reason for the abundance of still less satisfactory correlations, he underlined, is the fact that the principal independent variable for the prediction of the molecular weight, being some average boiling point, is often ill-defined. Lemus in her PhD thesis [1] summarized the petroleum fluid molecular weight correlations, which appeared in the period 1989–2010. She reported average absolute relative deviation for the molecular weight prediction of bitumen and heavy oils ranging between 7.6 and 30.7% for the different literature correlations [1]. The new molecular weight correlation proposed in her PhD thesis shows an average absolute relative deviation of 5.3%. Since 2016, no reports have appeared in the literature to summarize the available information about the molecular weight correlations of petroleum fluids. Moreover, in 2021 Hosseinifar, and Shahverdi [10] proposed a new petroleum fluid molecular weight correlation suggesting that it should be superior to others. Considering the importance of the molecular weight in petroleum engineering calculations, we decided to make a generalization of the correlations published in the literature for the period 1969–2021. Table 1 summarizes 13 published in the literature petroleum fluid molecular weight correlations for the period 1969–2021. Nine of these correlations (Hariu and Sage [21], Kesler and Lee [13], Riazi and Daubert (1980) [15], Twu [20], Rao and Bardon [19], Soreide [12], Goosens [9], Riazi and Daubert for MW ≤ 300 [18], Riazi and Daubert for MW ≤ 700 [15]) and their applications have been already discussed in the PhD thesis of Lemus [1]. The additional four correlations included in Table 1 (Liñan et al. [23], Liñan et al. (API) [23], Lemus et al. [2], and Hosseinifar, and Shahverdi [10]) have not been examined with a great number of data points, and can be considered relatively new because the last assessment of molecular weight correlations was reported in 2016 [2]. The correlation of Liñan et al. [23] has been developed to predict molecular weight of petroleum residues and cuts. The correlation of Lemus et al. [2] has been developed to predict molecular weight of heavy oil distillation cuts. The correlation of Hosseinifar, and Shahverdi [10] has been developed for petroleum fluids having a specific gravity from 0.68 to 0.92, boiling points from 340 to 722 K, and molecular weight from 84 to 414 g/mol.
There is no consent in the literature about which correlation can be deemed most appropriate to predict the molecular weight of petroleum fluids. For example, Liu et al. [24] argue that the developed correlations after those of Lee–Kesler correlation [13,14], and the Twu correlation [20], described by Riazi [18] do not have a significant advantage over the Lee–Kesler or Twu correlations. Liu at al. [24] reported that Aspen HYSYS uses the Twu correlation to calculate the molecular weight of petroleum fluids.
Table 1. Summary of correlations available in the literature to estimate molecular weight.
Source (Year of Publication)CorrelationRange of ApplicabilityEq.
Hariu, and Sage [21] (1969) M W = 0.6670202 + 0.1552531 K w 0.005378496 K w 2 × 0.004583705 T b K w + 0.00002500584 T b K w 2 + 0.000002698693 T b 2 + 0.0000387595 T b 2 K w 0.00000001566228 T b 2 × K w 2 30 < T b < 800 (1)
Kesler and Lee [13] (1976) M W = D + A T b + B T b 3 T b < 750 (2)
D = 12272.6 + 9486.4 × S G + 4.6523 3.3287 × SG × T b
A = 1 0.77084 × S G 0.02058 × S G 2 × 1.3437 720.79 T b × 10 7
B = 1 0.80882 × S G + 0.02226 × S G 2 × 1.8828 181.92 T b × 10 12
Riazi and Daubert [15] (1980) M W = 0.000045673 × T b 2.1962 × S G 1.0164 300 < T b < 610 (3)
Twu [20] (1984) ln M = ln M ° 1 + 2 f M / 1 2 f M 2 M W < 600 (4)
f M = Δ S G M χ + 0.0175691 + 0.143979 T b 1 / 2 Δ S G M
χ = 0.012342 0.2445541 / T b 1 / 2
Δ S G M = e x p 5 S G ° S G 1
S G ° = 0.843593 0.128624 α 3.36159 α 3 13749.5 α 12
α = 1 T b / T b °
Rao and Bardon [19] (1985) ln M W = 1.27 + 0.071 K w ln ( 1.8 T b 22.31 + 1.68 K W ) 361 < T b < 830 (5)
Soreide [12] (1989) T b = 1928.3 169500 × M W 0.03522 × S G 3.266 D / 1.8 361 < T b < 830 (6)
D = EXP 0.004922 × M W 4.7685 × S G + 0.003462 M W S G
Goosens [9], (1996) M W = 0.010770 T b 1.52869 + 0.06486 ln T b 1078 T b /d 306 < T b < 1012 (7)
Riazi and Daubert for MW ≤ 300 g/mol [18] (2005) M = 1.6607 × 10 4 T b 2.1962 S G 1.0164 300 < T b < 610 (8)
Riazi and Daubert for MW ≤ 700 g/mol [18], (2005) M = 42.965 e x p 2.097 × 10 4 T b 7.78712 S G + 2.08476 × 10 3 T b S G T b 1.26007 S G 4.98308 300 < T b < 900 (9)
Liñan et al. [23] (2011) M W a d C = 284.75 e x p 0.00322 t V A B P + 273.15 e x p 2.52 S G × t V A B P + 273.15 0.083 S G 2.44 673 < T b < 1235 (10)
Liñan et al. [23] (2011) (API) M W A P I = 219.05 exp 0.0039 t b + 273.15 exp 3.07 S G × t b + 273.15 0.118 S G 1.88 (11)
Lemus et al. [2] (2016) T b = 1805 21131 × M W 0.049 × S G 1.5258 D / 1.8 300 < T b < 900 (12)
D = EXP 0.005 × M W 2.675 × S G + 0.003 × M W × S G
Hosseinifar, and Shahverdi [10] (2021) M w T b , S G = d 1 × T b d 2 3 + 2 S G 3 S G d 3 2 + d 4 × T b d 5 3 + 2 S G 3 S G d 6 2 d 7 340 < T b < 722 (13)
Goosens [9] stated that the correlation developed in his work was superior to that of API procedure 2B2.1 imposed as a standard that was limited to molecular weights of 700. The correlation of Goosens covers the full practical range of molecular weights of 75–1700 [9]. Hosseinifar and Shahverdi [10] have developed recently a new petroleum fluid molecular weight correlation, which is suggested to have advantage over the published (until 2021) other molecular weight correlations. In addition, Hosseinifar and Shahverdi [25] developed a method to generate TBP distillation data from molecular weight, or T50% and density, that allowed us, in our recent study, to employ artificial neural network (ANN) to predict petroleum viscosity [26]. The same approach could be applied to predict petroleum fluid molecular weight from boiling point and density using the method of Hosseinifar and Shahverdi [25] to generate more than two (density and boiling point) inlet parameters to allow the employment of the ANN method. In our recent research, the ANN method using the approach discussed above demonstrated the best prediction of petroleum viscosity [26]. In order to evaluate the molecular weight prediction ability of the available empirical correlations in the literature, data from 430 petroleum fluids and individual hydrocarbons with molecular weight variation between 70 and 1685 g/mol were selected from 21 literature sources [1,2,9,22,23,27,28,29,30,31,32,33,34,35,36,37,38,39,40,41,42] and shown in Table S1. The data generated by the use of the Hosseinifar and Shahverdi [25] method, described in our recent research [26], along with specific gravity, boiling point, and the corresponding molecular weight of the 430 petroleum fluids to be used for molecular weight modeling by the ANN method, are presented Supplementary Table S2. The wide range of variation of molecular weight, boiling points, and density of the 430 petroleum fluids and individual hydrocarbons allows us to explore the capabilities of two commonly used techniques to model petroleum properties: the nonlinear regression and the ANN. This can give a notion as to which method is better to model petroleum fluid molecular weight. Comparisons between capabilities of the nonlinear regression and the metaheuristic methods to model oil properties have been reported in several studies [43,44,45,46,47,48]. However, no such study has been reported yet, to the best of our knowledge, for modelling of petroleum fluid molecular weight by the use of ANN. That was the reason for us to conduct this research.
The aim of this investigation is to develop two new methods to predict petroleum fluid molecular weight using two different techniques, nonlinear regression and ANN, and contrast them with the empirical correlations available in the literature.

2. Materials and Methods

The petroleum fluids, whose measured density, boiling point, and molecular weight were extracted from the literature, vary between light naphtha and vacuum residue. The carbon number of the individual hydrocarbons, extracted from the literature, and used in this study, varies between C6 and C52. The boiling point of the 430 petroleum fluids and individual hydrocarbons varies between 30 (303K) and 739 °C (1012K), and specific gravity at 15.6 °C varies between 0.631 and 1.527. The boiling point, specific gravity, and measured molecular weight of the 430 oils are summarized in Table S1.
The method of Hosseinifar and Shahverdi [25] and its use to generate TBP boiling point at 5, 10, 30, 50, 70, and 90 vol.% and its application for making more inlet parameters required by the ANN method is detailed in our recent research [26]. The equations used to generate TBP boiling point at 5, 10, 30, 50, 70, and 90 vol.% are shown below:
T 50 = 1.037003 T b 16.0825
T 70 = 1.06487 T b + 18.49267
T 30 = 1.679547 T b 31.7009 3 T 50 3 2 T 70 3 1 / 3
T 10 = A b s 0.94473 E x p S G + 3.178959 K w 1.52054 1.011152 T 50 1.58808
T 90 = 1.01857 0.5 T b + T 70 + 11.24528 2 0.5 T 50 + T 10
T 5 = A b s 1.42946 T b T 50 0.5 7.25905 3 T 70 3 T 90 3 ) ^ 0.343176
where,
  • T50–TBP boiling point at 50% evaporate, °C;
  • T70–TBP boiling point at 70% evaporate, °C;
  • T30–TBP boiling point at 30% evaporate, °C;
  • T10–TBP boiling point at 10% evaporate, °C;
  • T90–TBP boiling point at 90% evaporate, °C;
  • T5–TBP boiling point at 5% evaporate, °C;
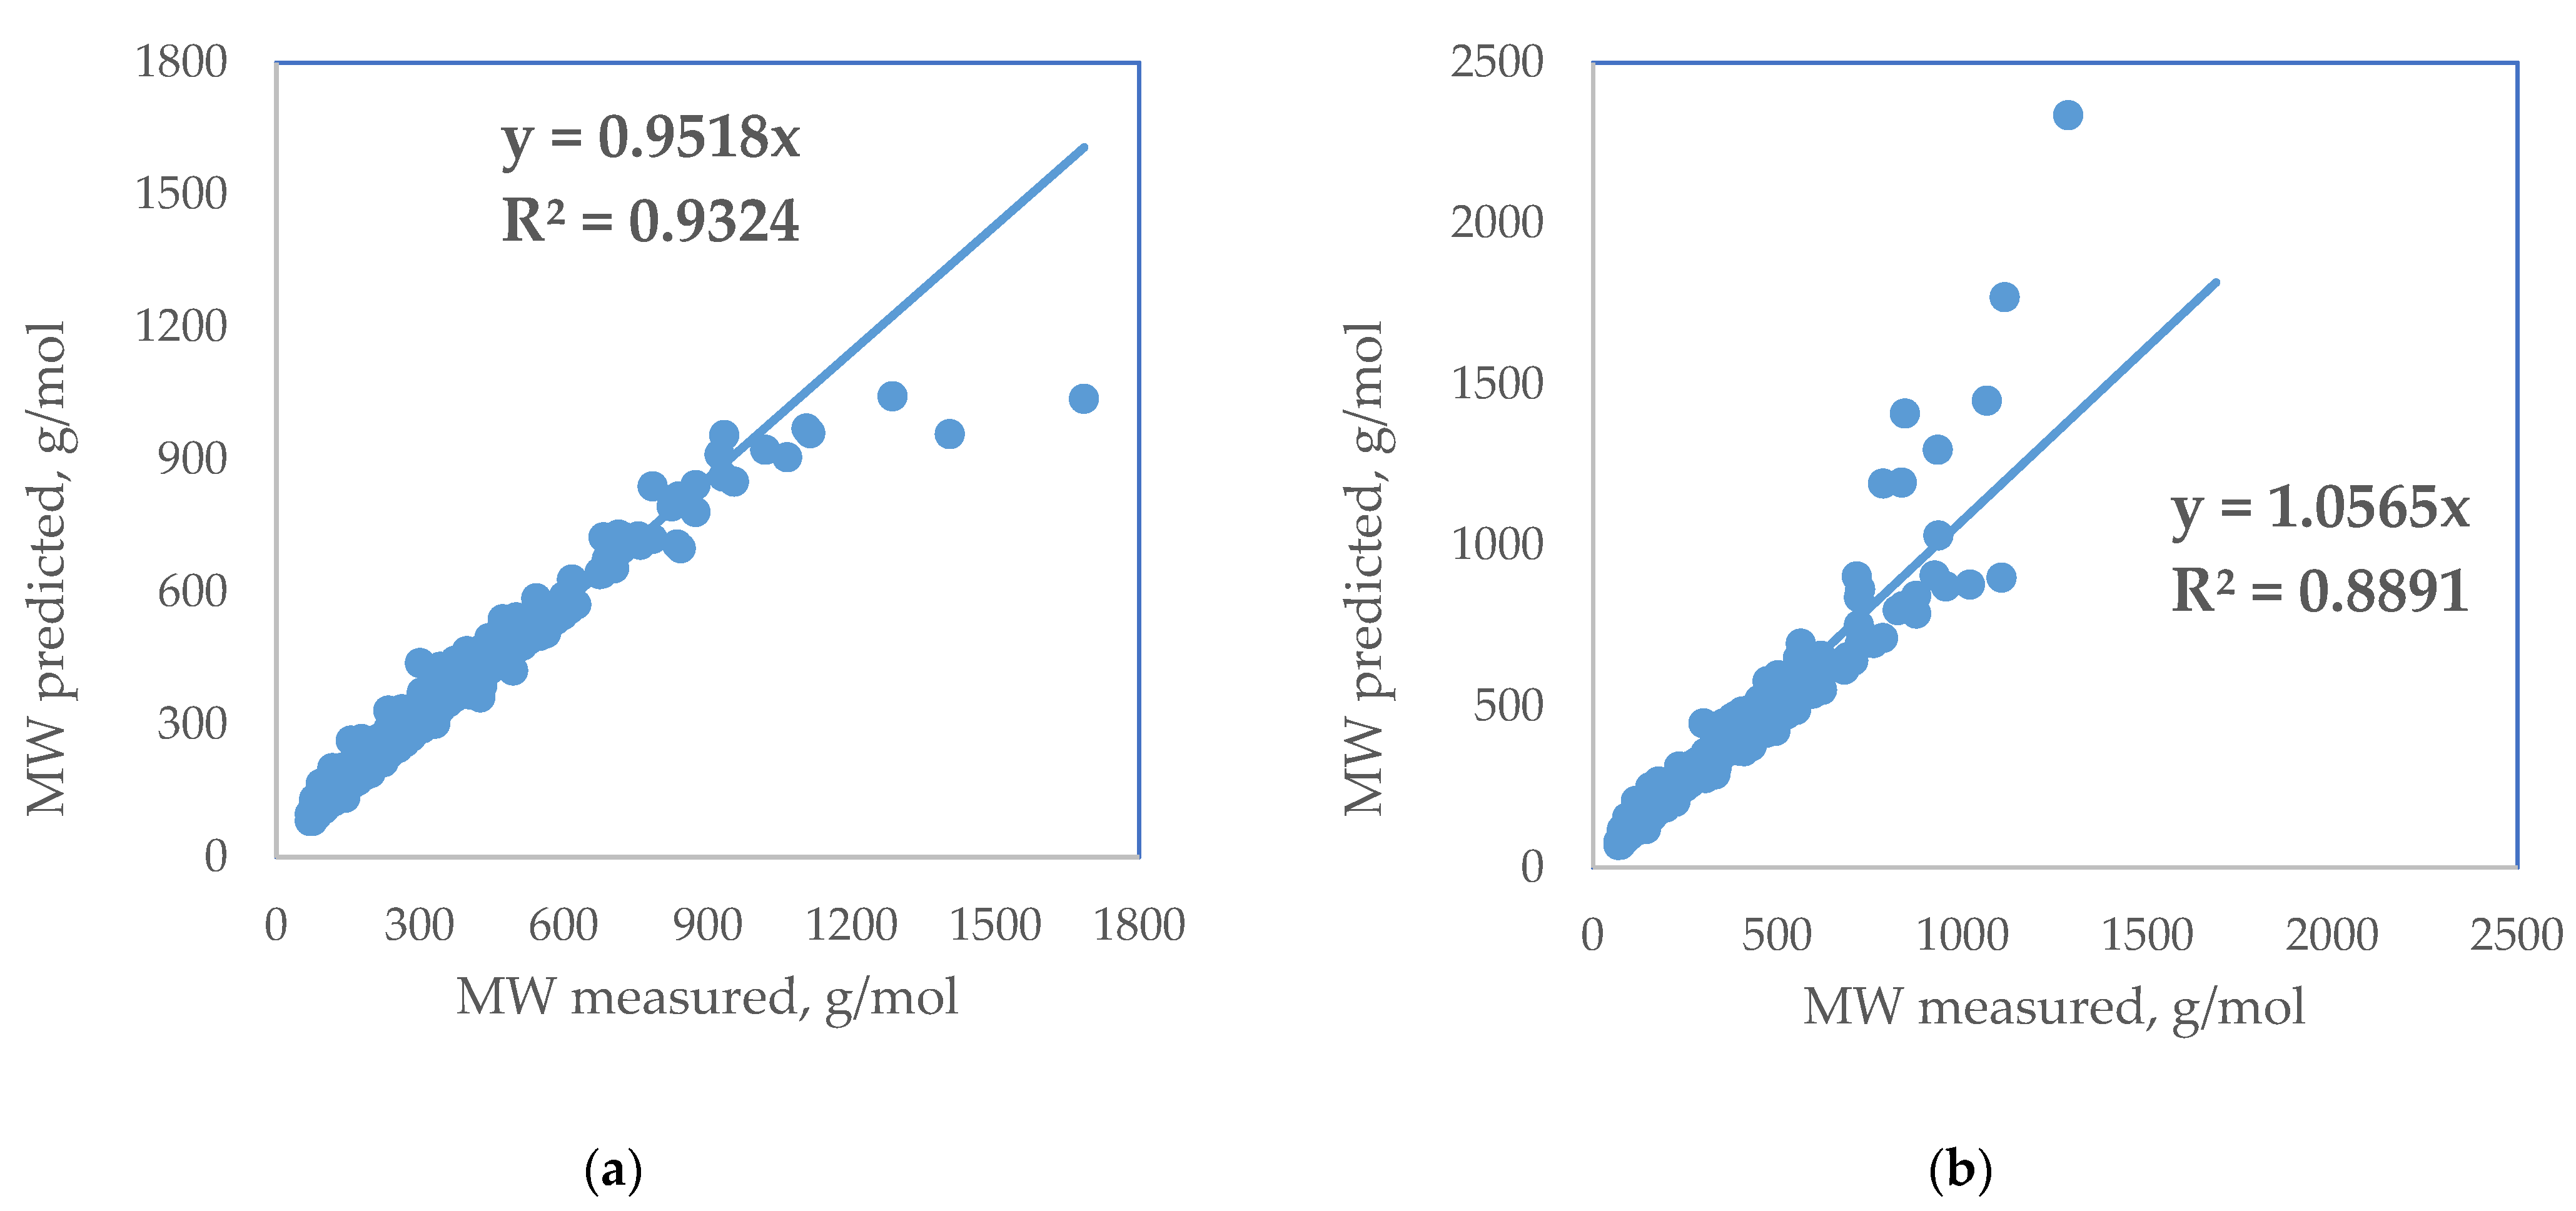
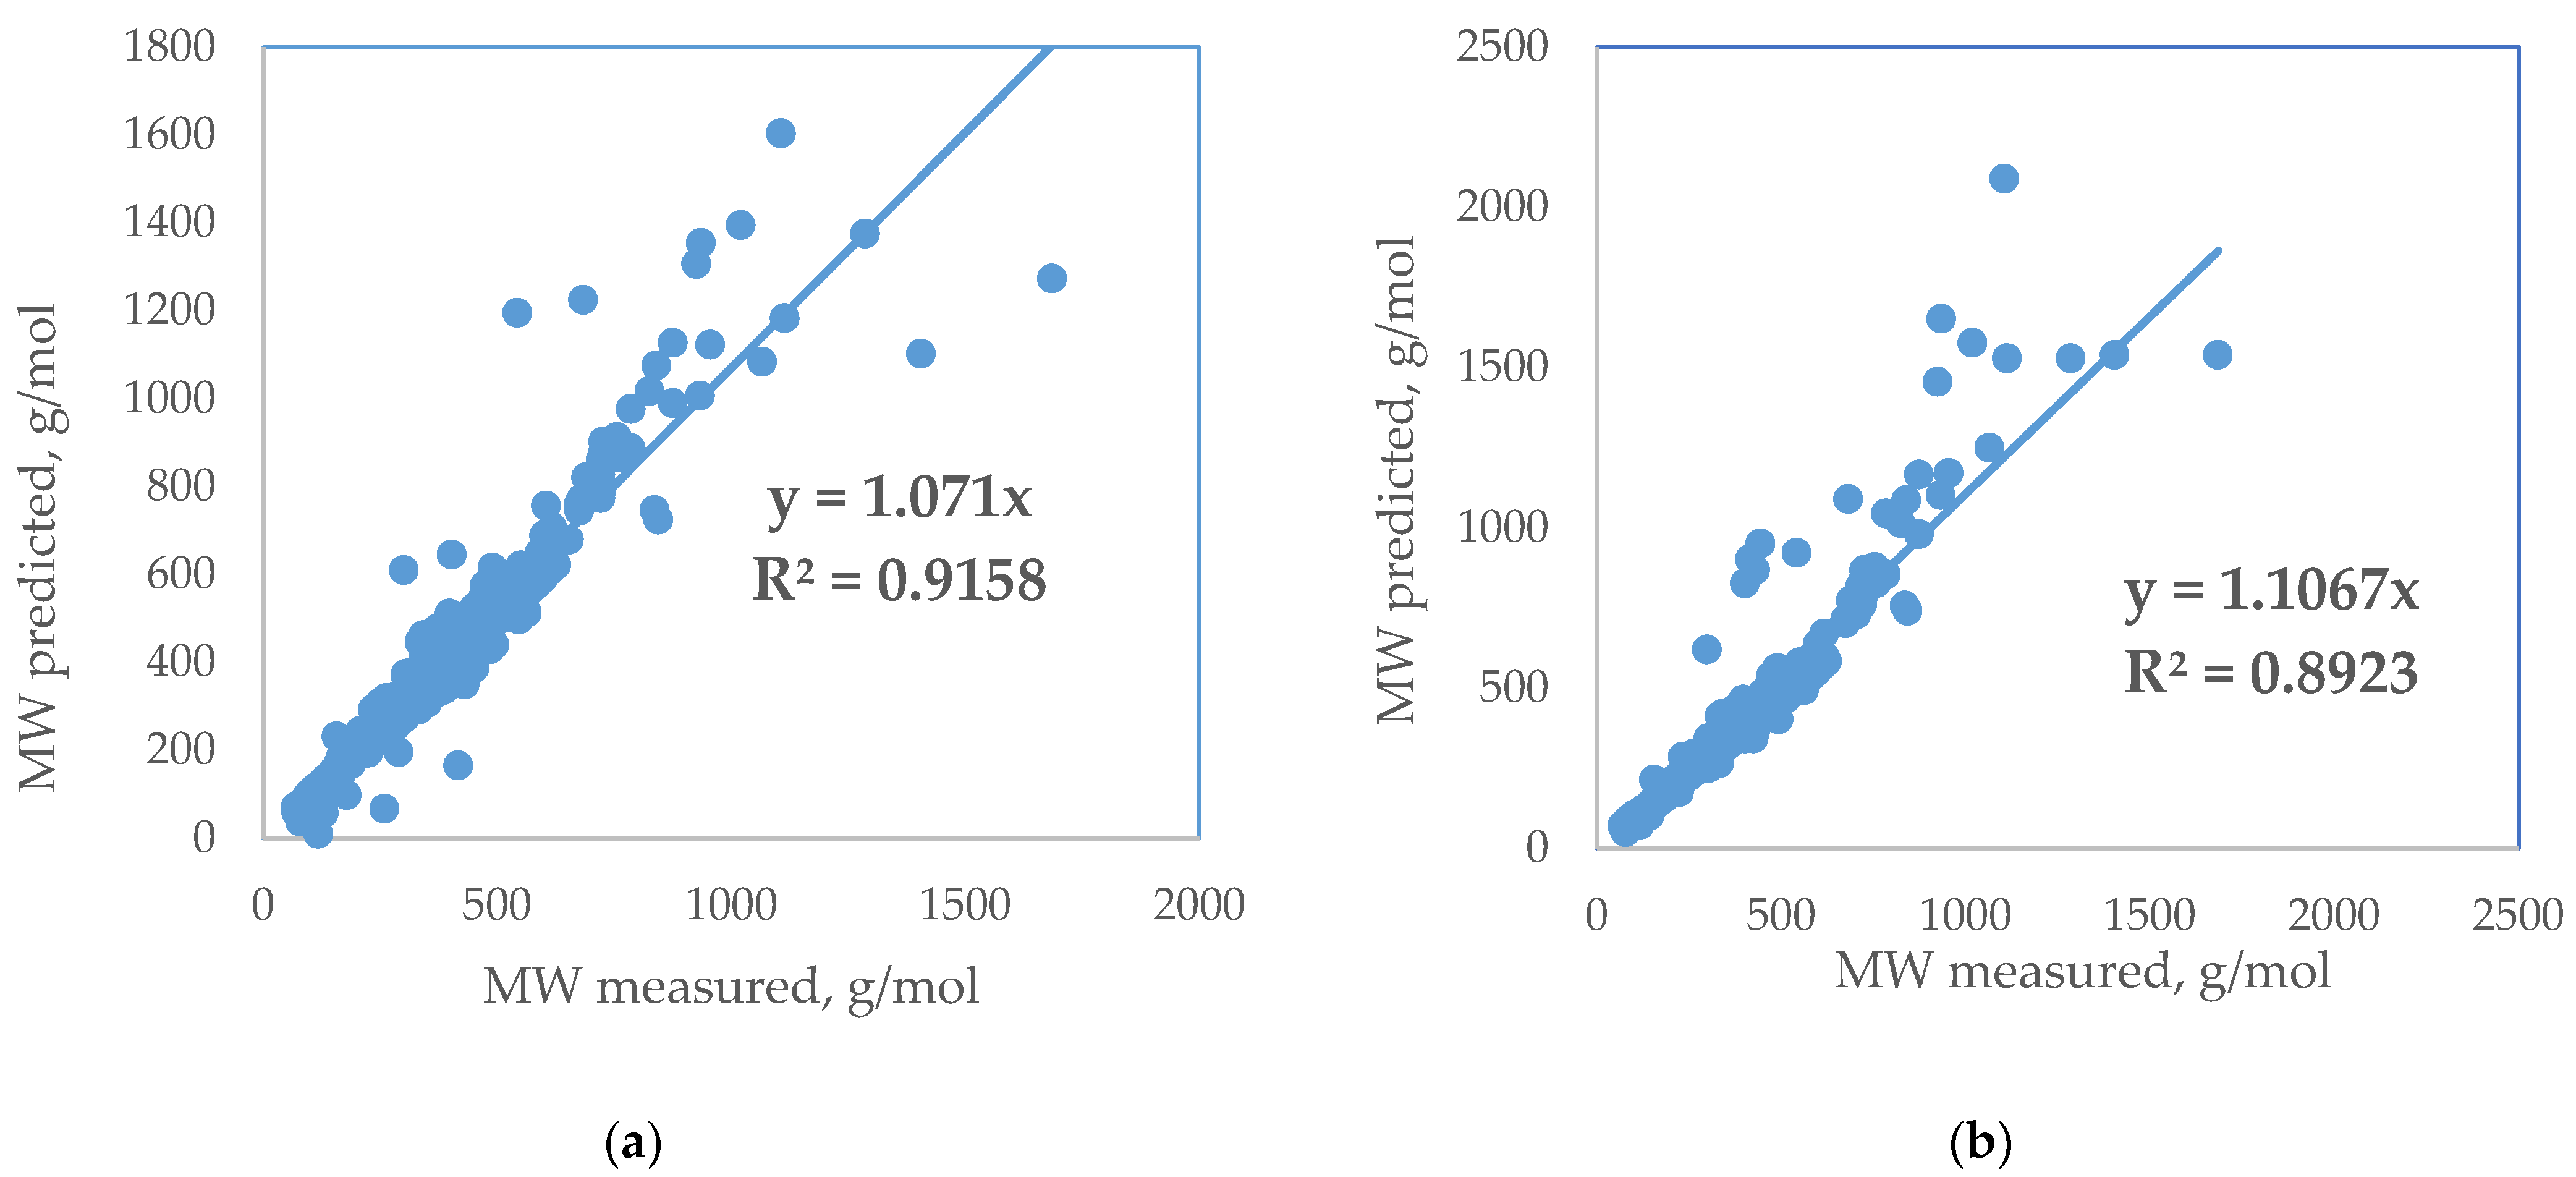
It is worth mentioning here that the use of the method of Hosseinifar and Shahverdi [25] has not been made to construct the real TBP curve, but instead to make more than two inlet parameters (specific gravity, and boiling point) to apply for ANN modeling purposes. Kw-characterization factor of the studied oils was estimated as shown in our recent article [26]. Table S2 summarizes the data employed for ANN modeling that includes nine inlet characterizing parameters: specific gravity, boiling point (K), T5%, T10%, T30%, T50%, T70%, T90%, and Kw. The Kw-characterization factor for the studied oils varies between 7.4 and 14.5.
The computer algebra system (CAS) Maple and NLPSolve with Modified Newton Iterative Method as described in [43] was employed to develop a new empirical correlation predicting molecular weight of petroleum fluids using the data extracted from the literature and discussed above.
The artificial neural network (ANN) modeling approach used in this investigation is described in our earlier research [26].
The accuracy of petroleum fluid molecular weight prediction has been evaluated by the statistical parameters shown as Equations (20)–(25).
Error   ( E ) :   E = M W e x p M W c a l c M W e x p × 100
Standard error   ( SE ) :   S E i = ( M W e x p M W c a l c ) 2 N 2 1 2
Relative standard error   ( RSE ) :   R S E i = S E m e a n   o f   t h e   s a m p l e × 100
Sum of square errors   ( SSE ) :   S S E = 1 M W e x p 2 ( M W e x p M W c a l c ) 2
Average absolute deviation   ( % AAD ) :   % A A D = 1 N M W e x p M W c a l c M W e x p × 100
Sum of relative errors   ( SRE ) :   S R E = ( M W e x p M W c a l c M W e x p ) × 100

3. Results

Goosens [9] mentioned in his work that a great number of petroleum fluid molecular weight correlations exhibited marked deviations beyond molecular weights of 300 g/mol. That was the reason for us to select a data base with a very wide range of variation of molecular weight, boiling points, and specific gravity. Figure 1 shows a graph of dependence of molecular weight on boiling point for the selected data base of 430 petroleum fluids and individual hydrocarbons. It is evident from this data that molecular weight exponentially increases with boiling point augmentation. It can be also seen that some individual polynuclear aromatic hydrocarbons deviate from the general exponential dependence, displaying lower molecular weight at the same boiling point.
The specific gravity, which well reflects the aromatic structure content [45], accounts for this deviation of the polynuclear aromatic compounds from the general exponential dependence of molecular weight on boiling point. By the use of CAS Maple and NLPSolve with Modified Newton Iterative Method and 306 points (the data with numbers from 1 to 306 from Table S1) out of 430, the following new empirical correlation was developed:
M W = 552.982 + 453.095 E X P ( 0.19239 E X P 0.000421163 B P 1.22097 S G 0.297075 )
where,
  • BP = boiling point of the petroleum fluid or individual hydrocarbon, K;
  • SG = specific gravity at 15.6 °C.
The remaining 124 data points were used to test the validity of Equation (26). For the development of the artificial neural network, a 3-layer deep learning neural network with a structure of 9 inputs (SG, BP, T5%, T10%, T30%, T50%, T70%, T90%, and Kw), 12 neurons in the first layer, 1 neuron in the output layer, and 1 output was used. Figure 2 presents the structure of the neural network employed in this study.
The entire training process took 18 iterations, and the performance was 0.0031481. The training process is shown in the Figure 3.
The regression coefficients of the artificial neural network are: Training—0.99705, Testing—0.99118, Validation—0.99638, All—0.99615 (Figure 4).
It is worth mentioning here that, during ANN modeling, the logarithm of molecular weight was modeled and the output of the ANN model was converted in molecular weight by the use of exponential function.
Figure 5 presents parity graphs for both new methods to predict molecular weight of petroleum fluids using nonlinear regression (Figure 5a) and ANN (Figure 5b).
Figure 6, Figure 7, Figure 8 and Figure 9 presents parity graphs of predicted versus measured molecular weight by the empirical correlations of Goosens (Figure 6a), the API method reported in [23], Riazi and Daubert correlations for MW ≤ 300 (Figure 7b) and 700 g/mol (Figure 7a), Kesler and Lee [14] (Figure 8a), Twu (Figure 8b), Liñan et al. [23] (Figure 9 a), and Hosseinifar and Shahverdi [10] (Figure 9b).
Table 2 summarizes the statistical analyses for the new empirical correlation, the ANN model, and the ten studied empirical correlations available from the literature.
The data in Table 2 indubitably indicates that the ANN method provides the best accuracy of molecular weight prediction of petroleum fluids, following by the new empirical correlation developed in this work. If one compares the data for accuracy of molecular weight prediction of the methods tested in this work with the 430 petroleum fluid sample points with those reported by the authors who have developed the correlations, some discrepancies will be seen. For example, Goosens [9] reported standard deviation for his method of about 2%, while the relative standard error, that can be assumed equivalent to the standard deviation shown in Table 2, is 13.9%. The %AAD of Riazi and Daubert MW ≤ 700 g/mol was reported as 4.7 [18], while that shown in Table 2 for this method is 6.3%. Liñan et al. [23] reported %AAD of 2.2, while that shown in Table 2 for this method is 11.3. Lemus et al. [2] reported %AAD of 5.3, while that shown in Table 2 for this method is 10.8. The reason for these discrepancies may lie in the range for which the discussed correlations were developed, confirming again the statement of Schneider [6] that any molecular weight correlation should not be extended beyond the limits for which it is valid. Considering that some of the tested correlations were developed for a narrower range of boiling point and molecular weight variations, a statistical analysis of the studied methods was performed for the petroleum fluids whose molecular weight is ≤300 g/mol.
Table 3 presents data of standard error, relative standard error, and %AAD for the predictive methods employing only these petroleum fluid data whose molecular weight is ≤300 g/mol.
The data in Table 3 indicates that the correlation of Riazi and Daubert MW ≤ 300 g/mol and the ANN model demonstrate the highest accuracy in molecular weight prediction, followed by the new correlation developed in this work. It is worth mentioning here that a great part of the data points in Table S1 which have molecular weight ≤ 300 g/mol 83 points out of 240 (35%), is taken from Riazi’s work [27]. Therefore, the highest accuracy of the correlation of Riazi and Daubert MW ≤ 300 g/mol may be attributed to this fact. It is also worth noting here that the accuracy of prediction of the lower molecular weight petroleum fluids (MW ≤ 300 g/mol) is understandably higher than that of the higher molecular weight petroleum fluids (MW ≥ 300 g/mol), because the heavy oil molecular weight is measured with a lower exactitude. Nevertheless, the correlations developed on the basis of extended molecular weight range also exhibit a satisfactory prediction for the lower molecular weight petroleum fluids (see, for example, the data for the ANN model, the new correlation, and Riazi and Daubert MW ≤ 700 g/mol from Table 3).

4. Discussion

Artificial neural networks are a mathematical model inspired by biological neural networks [49]. They are a class of artificial intelligence algorithms addressing different aspects or elements of learning, such as how to learn, how to induce, and how to deduce [50]. In our study, a classical three-layered neural network, as depicted in Figure 10, was availed.
where
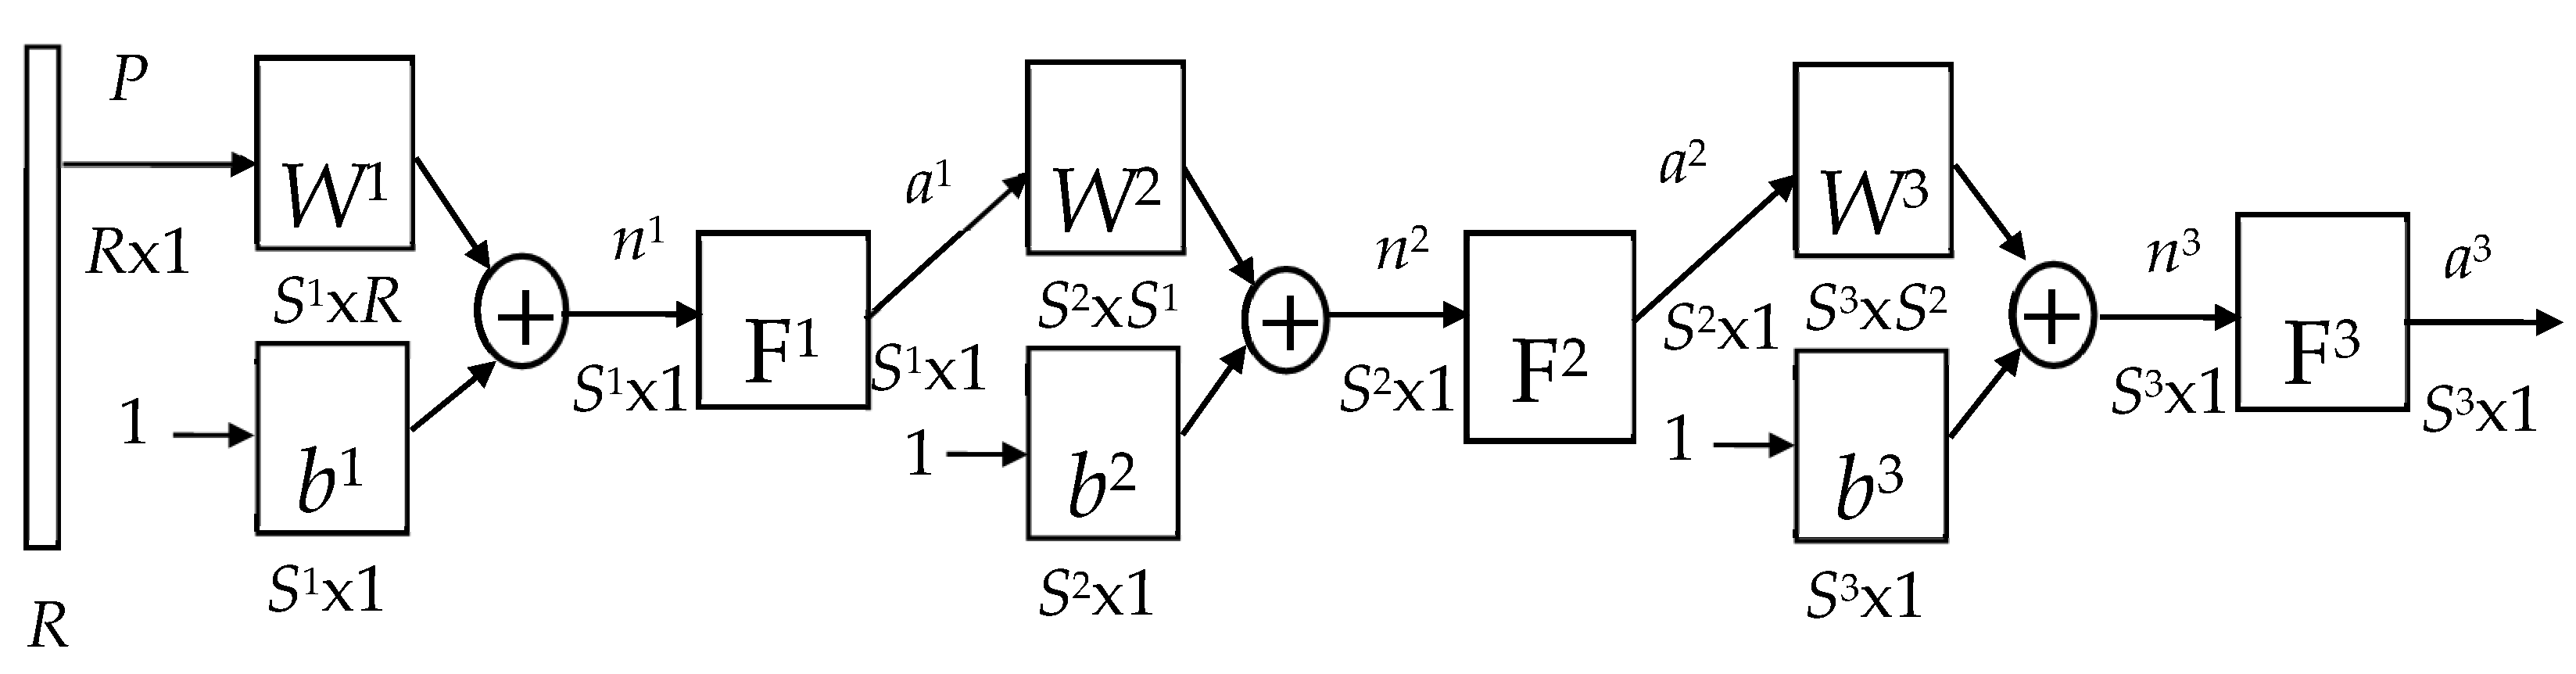
  • P is an entry network’s vector;
  • am is the exit of the m-th layer of the neural network, where;
  • wm is a matrix of the coefficients of all inputs;
  • bm is neuron’s input bias;
  • Fm is the transfer function of the m-th layer exit.
In multilayer networks, the outputs of the previous (or first) layer become inputs to the next. In tutored learning (supervised learning), the neural network must achieve a result that is labeled as a goal and is predefined. Weighting factors are accordingly calculated to target values. After training, the neural network is tested—only input signals are given, without the one to be received. The main algorithm for training neural networks with a teacher is back-propagation. It is designed for multilayer networks with direct transfer.
The ANN molecular weight model developed in this research, as shown in the data in Figure 5b and Table 2 and Table 3, distinguishes with the highest accuracy of prediction among all investigated empirical correlations. These findings support the opinion of Hadavimoghaddam et al. [51] that the artificial intelligence models provide the lowest average absolute relative error of petroleum property prediction. The use of Hossenifar and Shahverdi [25] method to generate seven additional inputs for the ANN showed again that it is a successful approach to model not only viscosity, as reported in our recent research [26], but also molecular weight of petroleum fluids.
The data in Table 2 and in Figure 5, Figure 6, Figure 7, Figure 8, Figure 9, and Figure 11 indicates that the new empirical correlation (Equation (26)) demonstrates the best accuracy among the other empirical correlations available in the literature when the whole data base of 430 points is concerned. Then the correlations of Goosens (Equation (7)), Riazi and Daubert (Equation (9)), and that of API (Equation (11)) distinguish with better accuracy in molecular weight prediction than the remaining seven correlations. However, the new correlation (Equation (26)) and those of Goosens and Riazi and Daubert have been developed based on a great amount of data in Table S1. That is why their comparison with data not included in their development may give a better indication of their molecular weight prediction ability. This was performed with 124 data points, and the statistical analysis of this comparison is summarized in Table 4.
The data in Table 4 again confirms the best performance of Equation (20) among the empirical correlations. It deserves mentioning here that 52 data points (42%) (the data pints with numbers from 379 to 430 from Table S1) of all tested 124 data points (the data pints with numbers from 307 to 430 from Table S1) were reported to be measured with repeatability of 15% [1]. This could explain the higher inaccuracy of molecular weight prediction for this test data set compared with that observed for the whole 430 data points and shown in Table 2.

5. Conclusions

The measurement of molecular weight of heavy oils is a difficult task associated with an error of about 15%. Thus, the correlations which satisfactorily predict molecular weight of various petroleum fluids can be an appropriate substitute for measurement. Among the correlations existing in the literature examined in this work, three distinguished with a better precision of prediction: Goosens, Riazi and Daubert, and API. The new correlation developed in this work using a nonlinear regression technique demonstrated a higher accuracy of molecular weight prediction than that of the three correlations mentioned above. However, the molecular weight prediction by the ANN three-layered neural network with a back-propagation teacher model exhibited much better exactitude than the new nonlinear regression correlation. This observation confirms again that the ANN method can predict petroleum properties with a higher accuracy than the regression correlations. In opposite of some statements in the literature that the other correlations developed after those of Lee–Kesler and Twu are not superior, the results of this research showed that the correlations of Goosens, Riazi and Daubert, API, and the new correlation predicted the molecular weight with a higher accuracy.

Supplementary Materials

The following supporting information can be downloaded at: https://www.mdpi.com/article/10.3390/pr11020426/s1, Table S1: 430 data points for boiling point, specific gravity, and molecular weight of petroleum fluids, and individual hydrocarbons to be used for nonlinear regression modeling; Table S2: 430 data points for boiling point, specific gravity, Kw-factor, and TBP distillation characteristics and molecular weight of petroleum fluids, and individual hydrocarbons to be used for ANN modeling.

Author Contributions

Conceptualization, D.S.; methodology, E.S.; software, S.N. and S.S. (Sotir Sotirov); validation, S.S. (Stanislav Simeonov), R.D. and D.Y.; formal analysis, G.N.P.; investigation, I.V.K. and S.V.; data curation, I.S.; writing, D.S.; supervision, K.A. All authors have read and agreed to the published version of the manuscript.

Funding

This research was funded by Asen Zlatarov University—Burgas, Project: Center of Excellence UNITE BG05M2OP001-1.001-0004 /28.02.2018 (2018–2023).

Conflicts of Interest

The authors declare no conflict of interest.

Nomenclature

ANNArtificial neural network
%AAD% Average absolute deviation
EError
KwKw-characterization factor of petroleum fluids
MWMolecular weight
RSERelative standard error
SEStandard error
SRESum of relative errors
SSESum of squared errors
RSEDichloromethane
TbBoiling point

References

  1. Lemus, M.C.S. Extended Distillation and Property Correlations for Heavy Oil. Ph.D. Thesis, University of Calgary, Calgary, AB, Canada, December 2015. [Google Scholar]
  2. Lemus, M.C.S.; Schoeggl, F.; Taylor, S.D.; Yarranton, H.W. Physical properties of heavy oil distillation cuts. Fuel 2016, 180, 457–472. [Google Scholar] [CrossRef]
  3. Nji, G.N. Characterization of heavy oils and bitumens. Ph.D. Thesis, University of Calgary, Calgary, AB, Canada, January 2010. [Google Scholar]
  4. Al-Mhanna, N.M. Simulation of High Pressure Separator Used in Crude Oil Processing. Processes 2018, 6, 219. [Google Scholar] [CrossRef] [Green Version]
  5. Aladwani, H.A.; Riazi, M.R. Some guidelines for choosing a characterization method for petroleum fractions in process simulators. Trans IChemE Part A Chem. Eng. Res. Des. 2005, 83, 160–166. [Google Scholar] [CrossRef]
  6. Schneider, D.F. Select the Right Hydrocracbon Molecular Weight Correlation. Available online: https://www.stratusengr.com/Articles/MoleWt.pdf (accessed on 17 November 2022).
  7. Powers, D.P.; Sadeghi, H.; Yarranton, H.W.; van den Berg, F.G.A. Regular solution based approach to modeling asphaltene precipitation from native and reacted oils: Part 1, molecular weight, density, and solubility parameter distributions of asphaltenes. Fuel 2016, 178, 218–233. [Google Scholar] [CrossRef]
  8. Yarranton, H.W.; Powers, D.P.; Okafor, J.C.; van den Berg, F.G.A. Regular solution based approach to modeling asphaltene precipitation from native and reacted oils: Part 2, molecular weight, density, and solubility parameter of saturates, aromatics, and resins. Fuel 2018, 215, 766–777. [Google Scholar] [CrossRef]
  9. Goosens, A.G. Prediction of molecular weight of petroleum fractions. Ind. Eng.Chem. Res. 1996, 35, 985–988. [Google Scholar] [CrossRef]
  10. Hosseinifar, P.; Shahverdi, H. A predictive method for constructing the distillation curve of petroleum fluids using their physical bulk properties. J. Petrol. Sci. Eng. 2021, 200, 108403. [Google Scholar] [CrossRef]
  11. Altgelt, K.H.; Boduszynski, M.M. Composition and Analysis of Heavy Petroleum Fractions; Marcel Dekker: New York, NY, USA, 1994; pp. 1–495. [Google Scholar]
  12. Soreide, I. Improved Phase Behavior Predictions of Petroleum Reservoir Fluids from a Cubic Equation of State. Ph.D. Thesis, Norwegian Institute of Technology, Department of Petroleum Technology and Applied Geophysics, Trondheim, Norway, 1989. [Google Scholar]
  13. Lee, B.I.; Kesler, M.G. A Generalized thermodynamic correlation based on the three-parameter corresponding states. AIChE J. 1975, 21, 510–527. [Google Scholar] [CrossRef]
  14. Kesler, M.G.; Lee, B.I. Improve prediction of enthalpy of fractions. Hydrocarb. Process 1976, 55, 153–158. [Google Scholar]
  15. Riazi, M.R.; Daubert, T.E. Simplify property predictions. Hydrocarb. Process 1980, 59, 115–116. [Google Scholar]
  16. Riazi, M.R.; Daubert, T.E. Analytical correlations interconvert distillation-curve types. Oil Gas J. 1986, 84, 50–57. [Google Scholar]
  17. Riazi, M.R.; Daubert, T.E. Characterization parameters for petroleum fractions. Ind. Eng. Chem. Res. 1987, 26, 755–759. [Google Scholar] [CrossRef]
  18. Riazi, M.R. Characterization and Properties of Petroleum Fractions, 1st ed; ASTM International: West Conshohocken, PA, USA, 2005; pp. 1–407. [Google Scholar]
  19. Rao, V.K.; Bardon, M.F. Estimating the molecular weight of petroleum fractions. Ind. Eng. Chem. Proc. Des. Dev. 1985, 24, 498. [Google Scholar] [CrossRef]
  20. Twu, C.H. An internally consistent correlation for predicting the critical properties and molecular weight of petroleum and coal-tar liquids. Fluid Phase Equilibria 1984, 16, 137–150. [Google Scholar] [CrossRef]
  21. Hariu, O.H.; Sage, R.C. Crude split figured by computer. Hydrocarb. Process 1969, 4, 143–148. [Google Scholar]
  22. Katz, D.L.; Firoozabadi, B. Predicting phase behavior of condensate/crude oil systems using methane interaction coefficients. J. Pet. Tech. 1978, 228, 1649–1655. [Google Scholar] [CrossRef]
  23. Liñan, L.Z.; Lima, N.M.N.; Maciel, M.R.W.; Filho, R.M.; Medina, L.C.; Embiruçu, M. Correlation for predicting the molecular weight of Brazilian petroleum residues and cuts: An application for the simulation of a molecular distillation process. J. Pet. Sci. Eng. 2011, 78, 78–85. [Google Scholar] [CrossRef]
  24. Liu, Y.A.; Chang, A.-F.; Kiran, P. Chapter 1: Characterization, physical and thermodynamic properties of oil fractions. In Petroleum Refinery Process Modeling: Integrated Optimization Tools and Applications; Wiley-VCH Verlag GmbH & Co. KGaA: Weinheim, Germany, 2018; pp. 1–58. [Google Scholar]
  25. Hosseinifar, P.; Shahverdi, H. Prediction of the ASTM and TBP distillation curves and specific gravity distribution curve for fuels and petroleum fluids. Can. J. Chem. Eng. 2022, 100, 3288–3310. [Google Scholar] [CrossRef]
  26. Stratiev, D.; Shishkova, I.; Dinkov, R.; Nenov, S.; Sotirov, S.; Sotirova, E.; Kolev, I.; Ivanov, V.; Ribagin, S.; Atanassov, K.; et al. Prediction of petroleum viscosity from molecular weight and density. Fuel 2023, 331, 125679. [Google Scholar] [CrossRef]
  27. Riazi, M.R.; Daubert, T.E. Prediction of molecular-type analysis of petroleum fractions and coal liquids. Ind. Eng. Chem. Res. 1986, 25, 1009–1015. [Google Scholar] [CrossRef]
  28. Riazi, M.R.; Daubert, T.E. Improved characterization of wide boiling range undefined petroleum fractions. Ind. Eng. Chem. Res. 1987, 26, 629–632. [Google Scholar] [CrossRef]
  29. White, C.M.; Perry, M.B.; Schmidt, C.E.; Douglas, L.J. Relationship between refractive indices and other properties of coal hydrogenation distillates. Energy Fuels 1987, 1, 99–105. [Google Scholar] [CrossRef]
  30. Bollas, G.M.; Vasalos, I.A.; Lappas, A.A.; Iatridis, D.K.; Tsioni, G.K. Bulk molecular characterization approach for the simulation of FCC feedstocks. Ind. Eng. Chem. Res. 2004, 43, 3270–3281. [Google Scholar] [CrossRef]
  31. Vargas, F.M.; Chapman, W.G. Application of the one-third rule in hydrocarbon and crude oil systems. Fluid Phase Equilib. 2010, 290, 103–108. [Google Scholar] [CrossRef]
  32. Yarranton, H.W.; Okafor, J.C.; Ortiz, D.P.; van den Berg, F.G.A. Density and refractive index of petroleum, cuts, and mixtures. Energy Fuels 2015, 29, 5723–5736. [Google Scholar] [CrossRef]
  33. Carbognani, L.; Díaz-Gómez, L.; Oldenburg, T.B.P.; Pereira-Almao, P. Determination of molecular masses for petroleum distillates by simulated distillation. Cienc. Tecnol. Futuro 2012, 4, 43–55. [Google Scholar]
  34. Wang, S.; Dong, X.; Sun, R. Predicting saturates of sour vacuum gas oil using artificial neural networks and genetic algorithms. Expert Syst. Appl. 2010, 37, 4768–4771. [Google Scholar]
  35. Wang, G.; Liu, Y.; Wang, X.; Xu, C.; Gao, J. Studies on the catalytic cracking performance of coker gas oil. Energy Fuels 2009, 23, 1942–1949. [Google Scholar] [CrossRef]
  36. Pitault, I.; Nevicato, D.; Forissier, M.; Bernard, J.-R. Kinetic model based on a molecular description for catalytic cracking of vacuum gas oil. Chem.Eng.Sci. 1994, 49, 4249–4262. [Google Scholar] [CrossRef]
  37. Sheng, Q.; Wang, G.; Duan, M.; Ren, A.; Yao, L.; Hu, M.; Gao, J. Determination of the hydrogen-donating ability of industrial distillate narrow fractions. Energy Fuels 2016, 30, 10314–10321. [Google Scholar] [CrossRef]
  38. Altgelt, K.H.; Boduszynski, M.M. Composition of heavy petroleums. 3. An improved boiling point-molecular weight relation. Energy Fuels 1992, 6, 68–72. [Google Scholar] [CrossRef]
  39. Dominguez, M. FCC feed fractionation. Pet. Coal 2003, 45, 113–118. [Google Scholar]
  40. Van Camp, C.E.; Van Damme, P.S.; Froment, G.F. Thermal cracking of kerosene. Ind. Eng. Chem. Process Des. Dev. 1984, 23, 155–162. [Google Scholar] [CrossRef]
  41. Nace, D.M.; Voltz, S.E.; Weekman, V.W., Jr. Application of a kinetic model for catalytic cracking. Effects of charge stocks. Ind. Eng. Chem. Process Des. Develop. 1971, 10, 530–538. [Google Scholar] [CrossRef]
  42. Zhang, Y.; Schuler, B.; Fatayer, S.; Gross, L.; Harper, M.R.; Kushnerick, J.D. Understanding the effects of sample preparation on the chemical structures of petroleum imaged with non-contact atomic force microscopy. Ind. Eng. Chem. Res. 2018, 57, 15935–15941. [Google Scholar] [CrossRef]
  43. Stratiev, D.; Nenov, S.; Nedanovski, D.; Shishkova, I.; Dinkov, R.; Stratiev, D.D.; Stratiev, D.D.; Sotirov, S.; Sotirova, E.; Atanassova, V.; et al. Different Nonlinear Regression Techniques and Sensitivity Analysis as Tools to Optimize Oil Viscosity Modeling. Resources 2021, 10, 99. [Google Scholar] [CrossRef]
  44. Stratiev, D.; Nenov, S.; Sotirov, S.; Shishkova, I.; Palichev, G.; Sotirova, E.; Ivanov, V.; Atanassov, K.; Ribagin, S.; Angelova, N. Petroleum viscosity modeling using least squares and ANN methods. J. Pet. Sci. Eng. 2022, 212, 110306. [Google Scholar] [CrossRef]
  45. Sinha, U.; Dindoruk, B.; Soliman, M. Machine learning augmented dead oil viscosity model for all oil types. J. Pet. Sci. Eng. 2020, 195, 107603. [Google Scholar] [CrossRef]
  46. Sinha, U.; Dindoruk, B.; Soliman, M.Y. Physics augmented correlations and machine learning methods to accurately calculate dead oil viscosity based on the available inputs. SPE J. 2022, 27, 3240–3253. [Google Scholar] [CrossRef]
  47. Stratiev, D.; Marinov, I.; Dinkov, R.; Shishkova, I.; Velkov, I.; Sharafutdinov, I.; Nenov, S.; Tsvetkov, T.; Sotirov, S.; Mitkova, M.; et al. Opportunity to improve diesel fuel cetane number prediction from easy available physical properties and application of the least squares method and the artificial neural networks. Energy Fuels 2015, 29, 1520–1533. [Google Scholar] [CrossRef]
  48. Shishkova, I.; Stratiev, D.; Kolev, I.V.; Nenov, S.; Nedanovski, D.; Atanassov, K.; Ivanov, V.; Ribagin, S. Challenges in Petroleum Characterization—A Review. Energies 2022, 15, 7765. [Google Scholar] [CrossRef]
  49. D’Addona, D.M. Neural Network. In CIRP Encyclopedia of Production Engineering; Laperrière, L., Reinhart, G., Eds.; Springer: Berlin/Heidelberg, Germany, 2014. [Google Scholar] [CrossRef]
  50. Yang, Z.R.; Yang, Z. 6.01—Artificial Neural Networks. Compr. Biomed. Phys. 2014, 6, 1–17. [Google Scholar] [CrossRef]
  51. Hadavimoghaddam, F.; Ostadhassan, M.; Heidaryan, E.; Sadri, M.A.; Chapanova, I.; Popov, E.; Cheremisin, A.; Rafieepour, S. Prediction of dead oil viscosity: Machine learning vs. classical correlations. Energies 2021, 14, 930. [Google Scholar] [CrossRef]
Figure 1. Dependence of molecular weight on boiling point for petroleum fluids and individual hydrocarbons.
Processes 11 00426 g001
Figure 2. Structure of the neural network employed in this study.
Processes 11 00426 g002
Figure 3. Training process of the neural network.
Processes 11 00426 g003
Figure 4. Regression coefficients of the learning process of the ANN.
Processes 11 00426 g004
Figure 5. Parity graph for predicted versus measured molecular weight by Equation (20) (a) and by the ANN model (b).
Processes 11 00426 g005
Figure 6. Parity graph for predicted versus measured molecular weight by Equation (7) (Goosens correlation) (a) and by Equation (11) (API method, 2011) (b).
Processes 11 00426 g006
Figure 7. Parity graph for predicted versus measured molecular weight by Equation (9) (Riazi and Daubert correlation up to MW ≤ 700 g/mol) (a) and by Equation (8) (Riazi and Daubert correlation up to MW ≤ 300 g/mol) (b).
Processes 11 00426 g007
Figure 8. Parity graph for predicted versus measured molecular weight by Equation (2) (Kesler and Lee) (a) and by Equation (4) (Twu) (b).
Processes 11 00426 g008
Figure 9. Parity graph for predicted versus measured molecular weight by Equation (11) (Liñan et al.) (a) and by Equation (13) (Hosseinifar, and Shahverdi) (b).
Processes 11 00426 g009
Figure 10. Flow chart of the multylaer neural network.
Processes 11 00426 g010
Figure 11. Parity graph for predicted versus measured molecular weight by Equation (6) (Soreide) (a) and by Equation (12) (Lemus et al.) (b).
Processes 11 00426 g011
Table 2. Statistical analysis of studied methods to predict petroleum fluid molecular weight for the whole range of studied molecular weights.
Standard ErrorRel. St. ErrorSum of Squarred Errors%AADSRE
ANN23.07.21.64.3−126.8
New empirical correlation (this work)34.810.93.46.4695.5
Hosseinifar (2021) [10]84.426.68.69.4−1851.7
Goosens (1996) [9]44.113.94.57.61970.2
Riazi and Daubert MW ≤ 700 g/mol (2005) [18]48.315.23.96.3358.2
API (2011) [23]39.312.45.18.6−999.1
Liñan (2011) [23]54.417.110.211.3−2973.1
Twu (1984) [20]96.430.320.618.77840.0
Lee–Kesler (1976) [14]84.226.57.19.7345.9
Riazi and Daubert ≤ 300 g/mol (2005) [18]117.336.912.412.54155.7
Lemus et al. (2016) [2]103.032.414.010.8864.9
Soreide (1989) [12]84.126.512.29.4−598
Table 3. Statistical analysis of studied methods to predict molecular weight for petroleum fluids and individual components whose molecular weight ≤ 300 g/mol.
Standard ErrorRel. St. Error%AAD
ANN13.47.93.6
New empirical correlation (this work)16.59.75.1
Hosseinifar (2021) [10]18.110.78.1
Goosens (1996) [9]17.810.55.4
Riazi and Daubert MW ≤ 700 g/mol (2005) [18]16.09.44.0
API (2011) [23]17.010.05.4
Twu (1984) [20]38.822.913.0
Lee–Kesler (1976) [14]18.310.87.3
Riazi and Daubert MW ≤ 300 g/mol (2005) [18]11.56.84.6
Lemus et al. (2016) [2]29.417.38.0
Soreide (1989) [12]32.018.87.6
Table 4. Statistical analysis of the new empirical correlation developed in this work, and of the correlations of Goosens, Riazi and Daubert, and API with 124 data points not used in their development.
Standard ErrorRel. St. Error%AAD
New empirical correlation (this work, test data)42.111.68.8
Goosens (1996) [9]56.715.612.1
Riazi and Daubert MW ≤ 700 g/mol (2005) [18]52.714.58.7
API (2011) [23]47.113.09.0
Disclaimer/Publisher’s Note: The statements, opinions and data contained in all publications are solely those of the individual author(s) and contributor(s) and not of MDPI and/or the editor(s). MDPI and/or the editor(s) disclaim responsibility for any injury to people or property resulting from any ideas, methods, instructions or products referred to in the content.

