Article

Correlations of HTSD to TBP and Bulk Properties to Saturate Content of a Wide Variety of Crude Oils

1
LUKOIL Neftohim Burgas, 8104 Burgas, Bulgaria
2
Institute of Biophysics and Biomedical Engineering, Bulgarian Academy of Sciences, Georgi Bonchev 105, 1113 Sofia, Bulgaria
3
Intelligent Systems Laboratory, University Prof. Dr. Assen Zlatarov, Professor Yakimov 1 St., 8010 Burgas, Bulgaria
4
Department of Mathematics, University of Chemical Technology and Metallurgy, Kliment Ohridski 8, 1756 Sofia, Bulgaria
5
Department of Chemical Engineering, The University of Manchester, Oxford Rd, Manchester M13 9PL, UK
*
Author to whom correspondence should be addressed.
Processes 2023, 11(2), 420; https://doi.org/10.3390/pr11020420
Submission received: 6 January 2023 / Revised: 18 January 2023 / Accepted: 27 January 2023 / Published: 30 January 2023

Abstract

:
Forty-eight crude oils with variations in specific gravity (0.782 ≤ SG ≤ 1.002), sulphur content (0.03 ≤ S ≤ 5.6 wt.%), saturate content (23.5 ≤ Sat. ≤ 92.9 wt.%), asphaltene content (0.1 ≤ As ≤ 22.2 wt.%), and vacuum residue content (1.4 ≤ VR ≤ 60.7 wt.%) were characterized with HTSD, TBP, and SARA analyses. A modified SARA analysis of petroleum that allows for the attainment of a mass balance ≥97 wt.% for light crude oils was proposed, a procedure for the simulation of petroleum TBP curves from HTSD data using nonlinear regression and Riazi’s distribution model was developed, and a new correlation to predict petroleum saturate content from specific gravity and pour point with an average absolute deviation of 2.5 wt.%, maximum absolute deviation of 6.6 wt.%, and bias of 0.01 wt.% was developed. Intercriteria analysis was employed to evaluate the presence of statistically meaningful relations between the different petroleum properties and to evaluate the extent of similarity between the studied petroleum crudes. It was found that the extent of similarity between the crude oils based on HTSD analysis data could be discerned from data on the Kw characterization factor of narrow crude oil fractions. The results from this study showed that contrary to the generally accepted concept of the constant Kw characterization factor, the Kw factors of narrow fractions differ from that of crude oil. Moreover, the distributions of Kw factors of the different crudes were different.

1. Introduction

The characterization of petroleum is undoubtedly the most crucial element in petroleum engineering and processing. It provides information required by petroleum engineers to assess the behavior of petroleum during exploration operations and by oil-refining engineers to evaluate the performance of refining units while processing particular crude oils or crude oil blends [1,2,3,4]. True boiling point (TBP) distillation analysis and the measurement of specific gravity of narrow crude oil cuts are considered necessary for the petroleum engineering calculations of petroleum engineering and processing [5,6]. Unfortunately, TBP distillation analysis is tedious, time-consuming and costly, so other less expensive and faster methods to convert data into TBP information are desired. Some methods have been developed to convert American Society for Testing and Materials (ASTM) methods into TBP methods used for oil fractions [7,8]. Simulated distillation was found to be equivalent to the TBP of oil fractions boiled up to 360 °C [9]. Villalanti and Raia [10] showed an excellent agreement between high-temperature simulated distillation (HTSD) and ASTM D2892 [11] (TBP) and D 5236 [12] for reference oil boiled at 10% of 231 °C and at 90% of 495 °C. We also showed in our recent study [13] that HTSD (ASTM D7169) is equivalent to TBP for gas oil fractions boiled between 231 and 655 °C. Durand et al. [14] also reported a very good agreement between conventional simulated distillation, with the TBP for gas oils having aromatic content of between 2 and 75%. The agreement between HTSD and TBP for deasphalted oils with saturate contents of 8.5% and 45%, a vacuum distillate with a saturate content of 31.2%, and atmospheric residue with a saturate content of 59% was also very good [14]. Different studies in the literature have dealt with the simulated distillation and TBP analysis of petroleum fluids [15,16,17,18,19,20,21,22]. To the best of our knowledge, however, no reports have compared the HTSD and TBP of a wide variety of crude oils in the five main crude oil groups: extra light, light, medium, heavy, and extra heavy. In our previous research [23], we concluded that additional investigations for the development of a reliable method that allows for the conversion of simulated distillation data into TBP data for all crude oil types are still required. The current research compares HTSD and TBP distillation data for a wide range of crude oils in to the main five groups originating from all over the world.
Another important petroleum characterization method that is used in a number of state equations, forming the basis of thermodynamic models predicting sediment formation in the process of petroleum extraction and refining the saturates/aromatics/resins/asphaltenes (SARA) analyses [24,25,26,27,28,29,30,31,32,33,34,35,36]. However, the mass balance closure of the SARA analysis of crude oils with a specific gravity of less than 0.92, as reported in our previous paper [23], is an issue. Due to the higher content of highly volatile components, lighter crude oils are lost during the process of solvent recovery following column SAR (saturates, aromatics, and resins) separation. To avoid this loss, 48 crude oils in to the five main groups were distilled in a TBP apparatus to separate the naphtha fraction from the crude oil. Then, the naphtha fraction was analyzed with gas chromatography to determine the PIANO (paraffins, iso-paraffins, aromatics, naphthenes, and olefins) composition. The reduced crudes were analyzed for saturates, aromatics, resins and asphaltenes. Then, the results from both analyses were combined to obtain the whole crude oil SARA composition. In this way, we achieved a mass balance closure no lower than 97 wt.% and a saturate content of 92.2 wt.%. The higher saturate content reported in our earlier research [23] based on literature data was 88.9 wt.%. In this study, we investigated the possibility of predicting the saturate content in petroleum crudes from other easier, faster, and less expensive methods than SARA analysis.
The aims of this work were to research a procedure to simulate the TBP curves of all kinds of crude oils from HTSD data, to develop a method to predict the saturate content of all kinds of petroleum, and to evaluate the possibility of obtaining the specific gravity curves of the crude oils from HTSD and the bulk petroleum specific gravity.

2. Materials and Methods

Petroleum crudes from all over the world (Albania, Australia, Azerbaijan, Brunei, Egypt, Equatorial Guinea, Greece, Indonesia, Iraq, Italy, Kazakhstan, Kuwait, Libya, Mexico, Nigeria, the Netherlands, Russia, Saudi Arabia, Tunisia, Turkmenistan, the UK, the USA, and Venezuela) in the five main groups—extra light (API > 40), light (30 < API < 40), medium (20 < API < 30), heavy (10 < API < 20) and extra heavy crude oils (API ≈ 10)—were investigated in this research. They were analyzed in terms of their bulk properties: specific gravity in accordance with ASTM D4052 [37], sulphur content following ASTM D4294 [38] requirements, pour point according to ASTM D97 [39], and kinematic viscosity according to ASTM D445 [40].
The crude oils were analyzed for their true boiling point (TBP) distribution with the Euro Dist System from ROFA Deutschland GmbH, designed to perform according to ASTM D2892 [11] requirements at pressure drop from 760 to 2 mmHg. Its fractionation column is equipped with packing equivalent to 15 theoretical plates, and a condenser provides the standard mandatory reflux ratio of 5:1. The atmospheric residue from the TBP column was fractionated under vacuum from 1 to 0.2 mmHg in Potstill Euro Dist System from ROFA Deutschland GmbH according to ASTM D5236 [12] requirements.
In addition to the TBP analysis of the investigated crude oils, their distillation characteristics were also analyzed with gas chromatographic high-temperature simulated distillation (HTSD) according to ASTM D7169 requirements. The HTSD analyses were carried out with the Agilent Technologies GC System 7890B, which was equipped with a FID (flame ionization detector). Liquid nitrogen was used as a coolant. The carrier gas was helium of 99.9999% purity (14 mL/min), and the inlet pressure was 1.2 psi (8.27 kPa) with a total flow equal to 87 mL/min. Hydrogen was used as a fuel gas (40 mL/min) and nitrogen was used as a makeup gas (15 mL/min), both with high purity (99.999%). The installed column was 5 m long and 530 μm in diameter, and the film thickness was 0.15 μm. The oven operated under a program from −20 °C to 430 °C at a ramp rate of 15 °C/min and a 4 min hold time at the maximum temperature. The injector was programmed to operate from 50 °C to 450 °C at a rate of 15 °C/min, and the injected sample volume was 4 μL. Before the simulated distillation analyses, the studied oil samples were preliminarily stirred and accurately weighted to obtain 2 weight percent of the studied oils dissolved in carbon disulphide (0.03 g of each sample dissolved in 1.5 mL of CS2 (99.9%)). All prepared samples were stored at a temperature around 4 °C prior to analyses. The simulated distillation characteristics were automatically calculated with SIMDIS software, and the distillation curve boiling point in °C versus evaporate in wt. % was obtained. The minor intervention of the operator took place during the chromatogram processing. The HTSD GC was calibrated with a blend of normal paraffins with a carbon number between C5 and C120. The software (GC OpenLab CDS with Simdis program for ASTM D7169) used in this application of HTSD allowed for the estimation of the final boiling point of the residual oils higher than 750 °C.
The SARA (saturates, aromatics, resins, asphaltenes) analysis of the reduced crude oils (the crude oil fraction boiling above 220 °C) was performed following the procedure described in our earlier research [41]. Considering that the content of asphaltenes in crude oil is not an additive value, as reported in our recent study [23], it was determined for the whole not fractionated crude oil following the procedure described in our earlier research [42].
The PIANO (paraffins, iso-paraffins, aromatics, naphthenes olefins) analysis of the crude oil fraction boiled below 220 °C (naphtha fraction) was carried out with a gas chromatograph equipped with a flame ionization detector. To identify the compounds in the naphtha fraction, gas chromatography/mass spectrometry was utilized. The gas chromatograph with flame ionization detector was a model 5890 series II Hewlett Packard (Agilent Technologies, Inc., Santa Clara, CA, USA). An HP PONA capillary column (50 m length × 0.20 mm id × 0.5 μm film thickness) was used with a split injector. The instrument parameters were as follows: The initial oven column temperature was 35 °C, and then it increased at increments of 2 °C/min to 200 °C and held for 30 min at 200 °C; helium was used as a carrier gas at a flow rate of 0.5 mL/min; the injector and detector temperatures were 200 °C and 250 °C, respectively; and the volume that was injected and analyzed was 0.1 µL. Data acquisition parameters, instrument operation information, and chromatographic data were collected and recorded by means of Clarity 2.6. Gas chromatography/mass spectrometry analysis was performed with a 7890A GC System equipped with an HP PONA capillary column (50 length m × 0.2 mm id × 0.5 μm film thickness) and a 5975C Inert XL EI/CI mass selective detector (Agilent Technologies, Inc., Santa Clara, CA, USA). The oven column temperature conditions were identical to those used with the gas chromatograph with flame ionization detector. High-purity helium was used as the carrier gas at a flow rate of 0.8 mL/min. The injection port was held at 200 °C, and the injection volume was 0.1 µL of the sample. The mass selective detector was operated in the electron impact ionization mode (70 eV) with continuous scan acquisition from 15 to 250 m/z at a cycling rate of approximately 1.5 scan/s. The parameters were as follows: the electron multiplier was set to 1224 V, the source temperature was set to 230 °C, and the transfer line temperature was set to 150 °C. System control and data acquisition were achieved with HP G1033A D.05.01 MSD ChemStation revision E.02.00.493. The compounds were identified with the NIST MS Search version 2.0 library of mass spectra.
The Kw characterization factor of the studied crude oils and their narrow fractions was estimated with Equation (1).
K w = 1.8 T 50 % + 273.15 3 S G
where T50% = boiling point of 50% of evaporate according to the TBP (ASTM D292/D5236), °C, and SG = specific gravity at 15 °C.
The computer algebra system Maple and NLPSolve with the Modified Newton Iterative Method was used to develop nonlinear regression equations to transform the HTSD data into TBP data for the studied crude oils. Riazi’s distribution model, shown as Equation (2), was used to build the TBP curve from the HTSD data transformed into TBP data.
T i T 0 T 0 = A B L n 1 1 x i 1 B
where Ti = boiling point of i-weight fraction of distillation curve, K; T0 = initial boiling point, K; and xi = weight fraction of i-component.
Intercriteria analysis (ICrA) evaluation was employed to determine the degree of similarity between the studied crude oils based on distillation characteristics, Kw characterization factor variation through the whole crude oil distillation range, and sulphur variation through the whole crude oil distillation range. It was also used to determine the statistically meaningful relations between the different crude oil characteristics. The intercriteria analysis (ICrA) was developed in the Institute for Biophysics and Biomedical Engineering, Bulgarian Academy of Sciences (BAS) as a tool to support decision making in multi-object multicriteria problems [43,44,45]. It has been successfully applied in the fields of medicine, biology, economics, and physics, among others, and it can be considered a component of the artificial intelligence toolkit [43]. It was also successfully applied in several studies in the field of petroleum chemistry and technology [46,47,48]. A detailed explanation of the essence of ICrA applied in the field of petroleum processing can be found in [49]. μ = 0.75 ÷ 1.00 and υ = 0 ÷ 0.25 denote a statistically meaningful significant positive relation, where the strong positive consonance exhibits values of μ = 0.95 ÷ 1.00 and υ = 0 ÷ 0.05 and the weak positive consonance exhibits values of μ = 0.75 ÷ 0.85 and υ = 0.2515 ÷ 0.1525. The values of negative consonance with μ = 0.00 ÷ 0.25 and υ = 0.75 ÷ 1.00 indicate a statistically meaningful negative relation, where the strong negative consonance exhibits values of μ = 0.00 ÷ 0.05 and υ = 0.95 ÷ 1.00, and the weak negative consonance exhibits values of μ = 0.15 ÷ 0.25 and υ = 0.75 ÷ 0.85. All other cases are considered dissonance.

3. Results

3.1. HTSD and TBP of Crude Oils

The high-temperature simulated distillation data of extra light, light medium, heavy, and extra heavy 30 crude oils (boiling point at 1%) are presented in Table S1.
The same crude oil HTSD data in the TBP analysis format (evaporates at 70, 110, 130, 150, 170, 180, 200, 220, 240, 260, 280, 300, 320, 340, 360, 380, 390, 430, 470, 490, and 540 °C) are presented in Table S2.
The true boiling point distillation (TBP) data of the extra light, light medium, heavy, and extra heavy 29 crude oils are summarized in Table S3.
TBP data of 21 crude oils extracted from [47] are presented in Table S4.
HTSD data of 21 crude oils extracted from [47] are presented in Table S5.
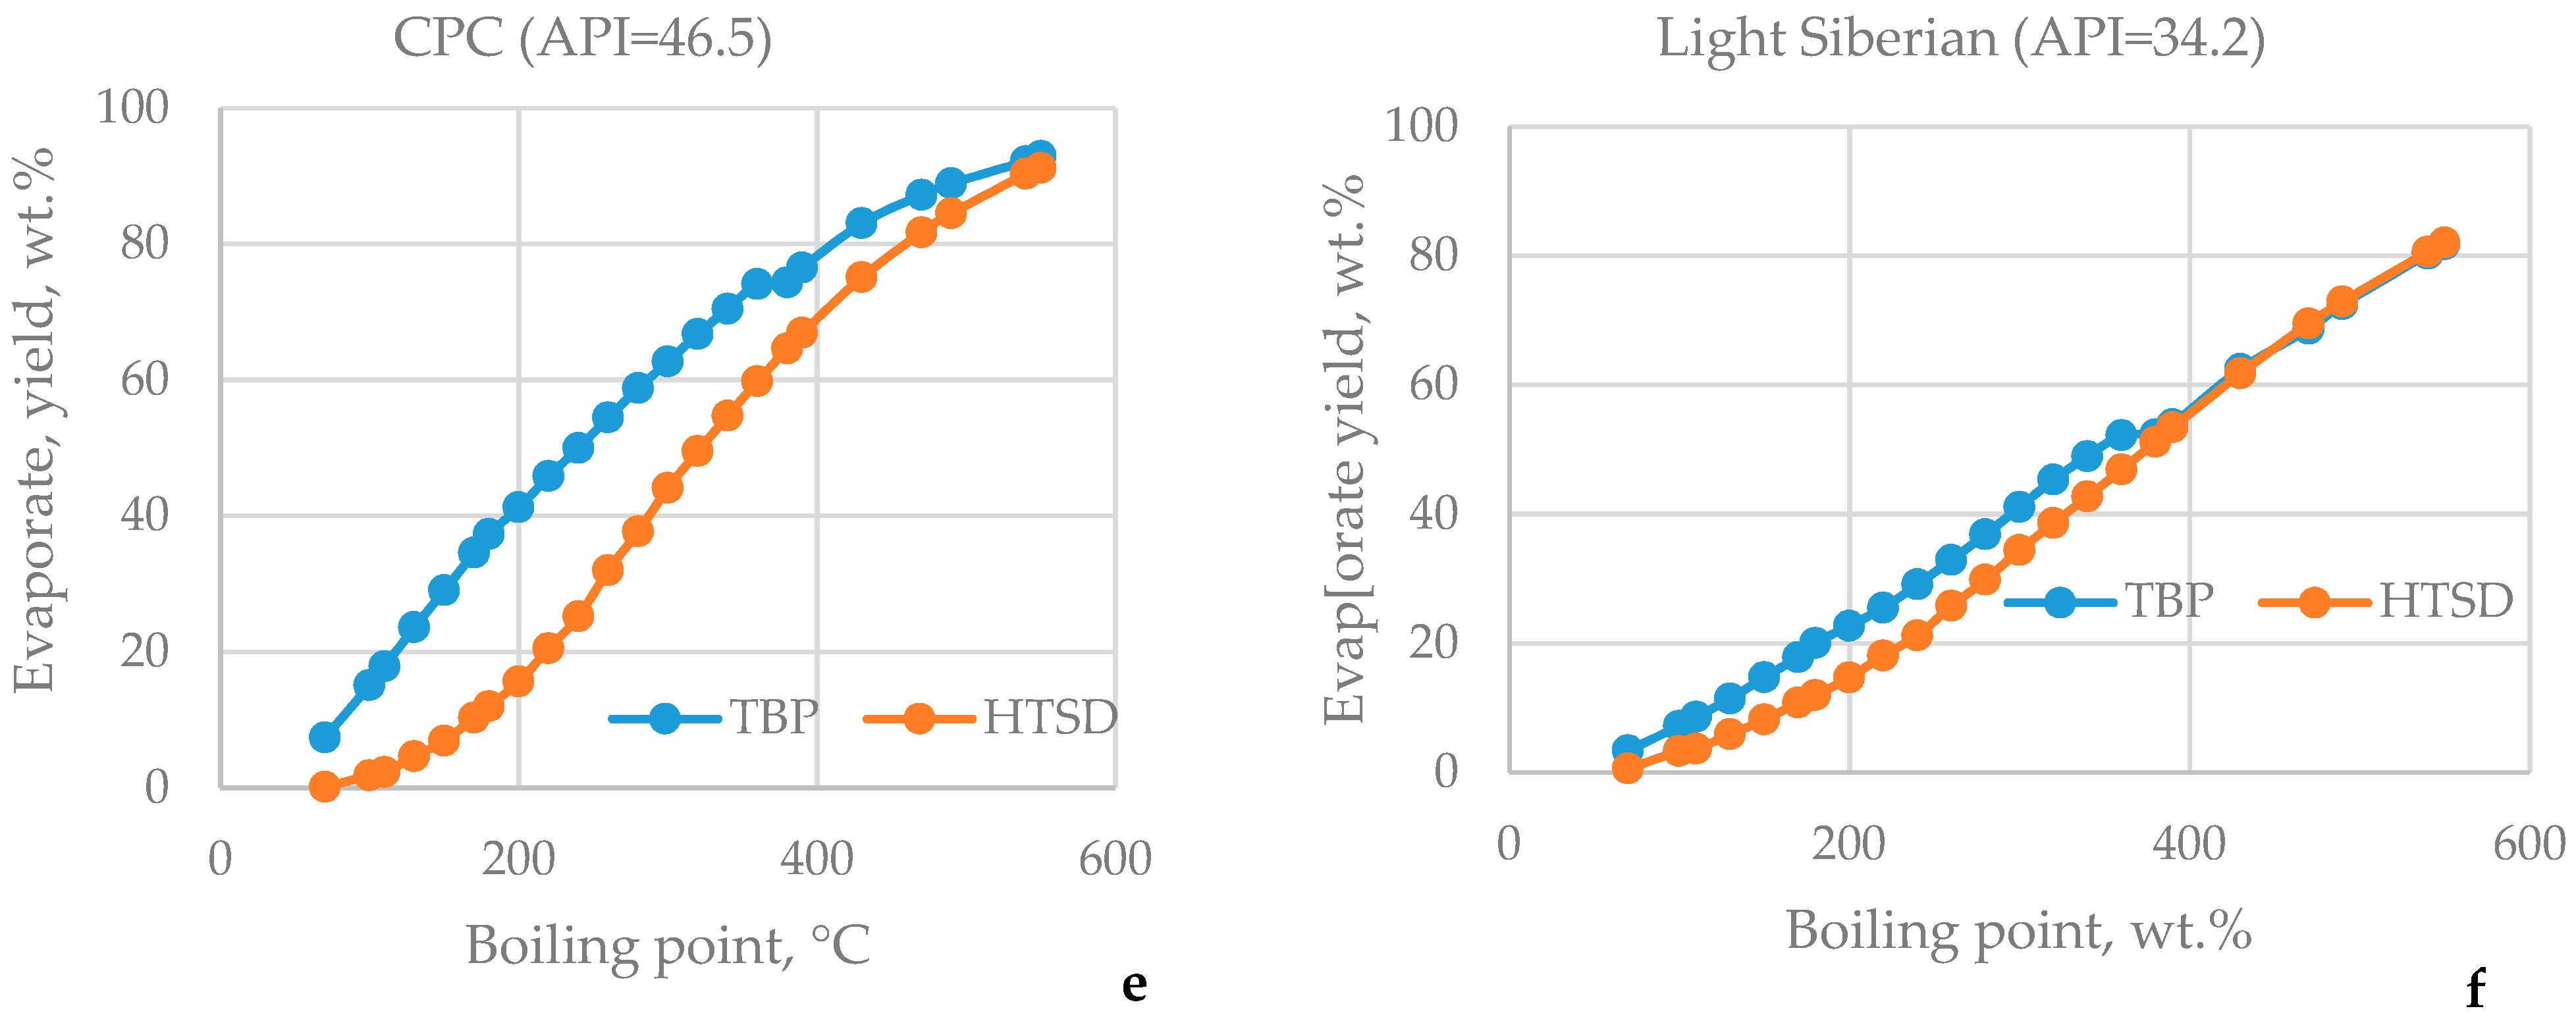
Figure 1 shows the TBP and HTSD distillation curves of the extra light, light, medium, and heavy crude oils. These data clearly show that both distillation curves do not coincide and that equations to convert HTSD into TBP are needed.
Crude oil specific gravity and HTSD data for the 110–180 °C; 180–240 °C; 240–360 °C; IBP—360 °C; IBP—540 °C; and T50% fractions were employed to develop conversion equations. With nonlinear regression and the computer algebra system Maple (and Global Optimization Toolbox), the following conversion equations were developed:
T B P 110 180 = 3592.34 × 8 S G 1.071599 × H T S D 110 180 4541.274 + 256.8781 × S G 2 + 14.0653 S G × H T S D 110 180 0.313177 × H T S D 110 180 2 13.06334 × S G 2 × H T S D 110 180 + 0.310779 × S G × H T S D 110 180 2 860.6919 × S G 3 + 0.000738 × H T S D 110 180 3 + 1557.6812 S G 5.286048 H T S D 110 180
where TBP110−180 = TBP yield of crude oil fraction 110–180 °C, wt.%; HTSD110−180 = HTSD yield of crude oil fraction 110–180 °C, wt.%; and SG = specific gravity of crude oil at 15 °C.
T B P 180 240 = 22042.5019 × S G 307.7052 × H T S D 180 240 + 10231.8034 + 18132.809451 × S G 2 + 558.8987 S G × H T S D 180 240 + 6.5239 × H T S D 180 240 2 261.4616 × S G 2 × H T S D 180 240 5.32183 × S G × H T S D 180 240 2 5209.1464 × S G 3 0.061063 × H T S D 180 240 3 1362.90998 S G 75.10173 H T S D 180 240
where TBP180−240 = TBP yield of crude oil fraction 180–240 °C, wt.%, and HTSD180−240 = HTSD yield of crude oil fraction 180–240 °C, wt.%.
T B P 240 360 = 124049.5808 × S G + 118.857 × H T S D 240 360 + 84179.95766 + 80735.579 × S G 2 261.2551 × S G × H T S D 240 360 + 0.02985 × H T S D 240 360 2 + 166.7441 × S G 2 × H T S D 240 360 0.503125 × S G × H T S D 240 360 2 19873.07896 × S G 3 + 0.0037714 × H T S D 240 360 3 21395.469 S G + 2207.4797 H T S D 240 360
where TBP240−360 = TBP yield of crude oil fraction 240–360 °C, wt.%, and HTSD240−360 = HTSD yield of crude oil fraction 240–360 °C, wt.%.
T B P I B P 360 = 1486302.4 × S G + 706.3558 × H T S D I B P 360 816751.6624 1177897.12 × S G 2 1308.126 S G × H T S D I B P 360 + 2.3461 × H T S D I B P 360 2 + 674.042 × S G 2 × H T S D I B P 360 + 1.41365 S G × H T S D I B P 360 2 + 343817.1466 × S G 3 + 0.0059531 × H T S D I B P 360 3 + 162215.444 S G + 26821.6259 H T S D I B P 360
where TBPIBP—360 = TBP yield of crude oil fraction IBP—360 °C, wt.% (IBP = initial boiling point), and HTSDIBP—360 = HTSD yield of crude oil fraction IBP—360 °C, wt.%.
T B P I B P 540 = 2232.1983 × S G 655.3758 × H T S D I B P 540 31682.394 + 18264.286 × S G 2 + 1125.409 × S G × H T S D I B P 540 + 1.9922 × H T S D I B P 540 2 + 495.3427 × S G 2 × H T S D I B P 540 1.66488 × S G × H T S D I B P 540 2 4936.8613 × S G 3 0.001997 × H T S D I B P 540 3 + 21798.8637 S G 23085.8313 H T S D I B P 540
where TBPIBP—540 = TBP yield of crude oil fraction IBP—540 °C, wt.%, and HTSDIBP—540 = HTSD yield of crude oil fraction IBP—540 °C, wt.%.
T B P 50 % = 936589.633 × S G + 116.4095 × H T S D 50 % + 533529.969 + 738502.444 × S G 2 195.3968 × S G × H T S D 50 % + 0.0007634 × H T S D 50 % 2 + 205.4164 × S G 2 × H T S D 0.227388 × S G × H T S D 50 % 2 238553.77 × S G 3 + 0.00014461 × H T S D 50 % 3 124986.531 S G + 1.993594 H T S D 50 %
where TBP50% = TBP boiling point at 50 wt.% evaporate, °C, and HTSDIBP—540 = HTSD TBP boiling point at 50 wt.% evaporate, °C.
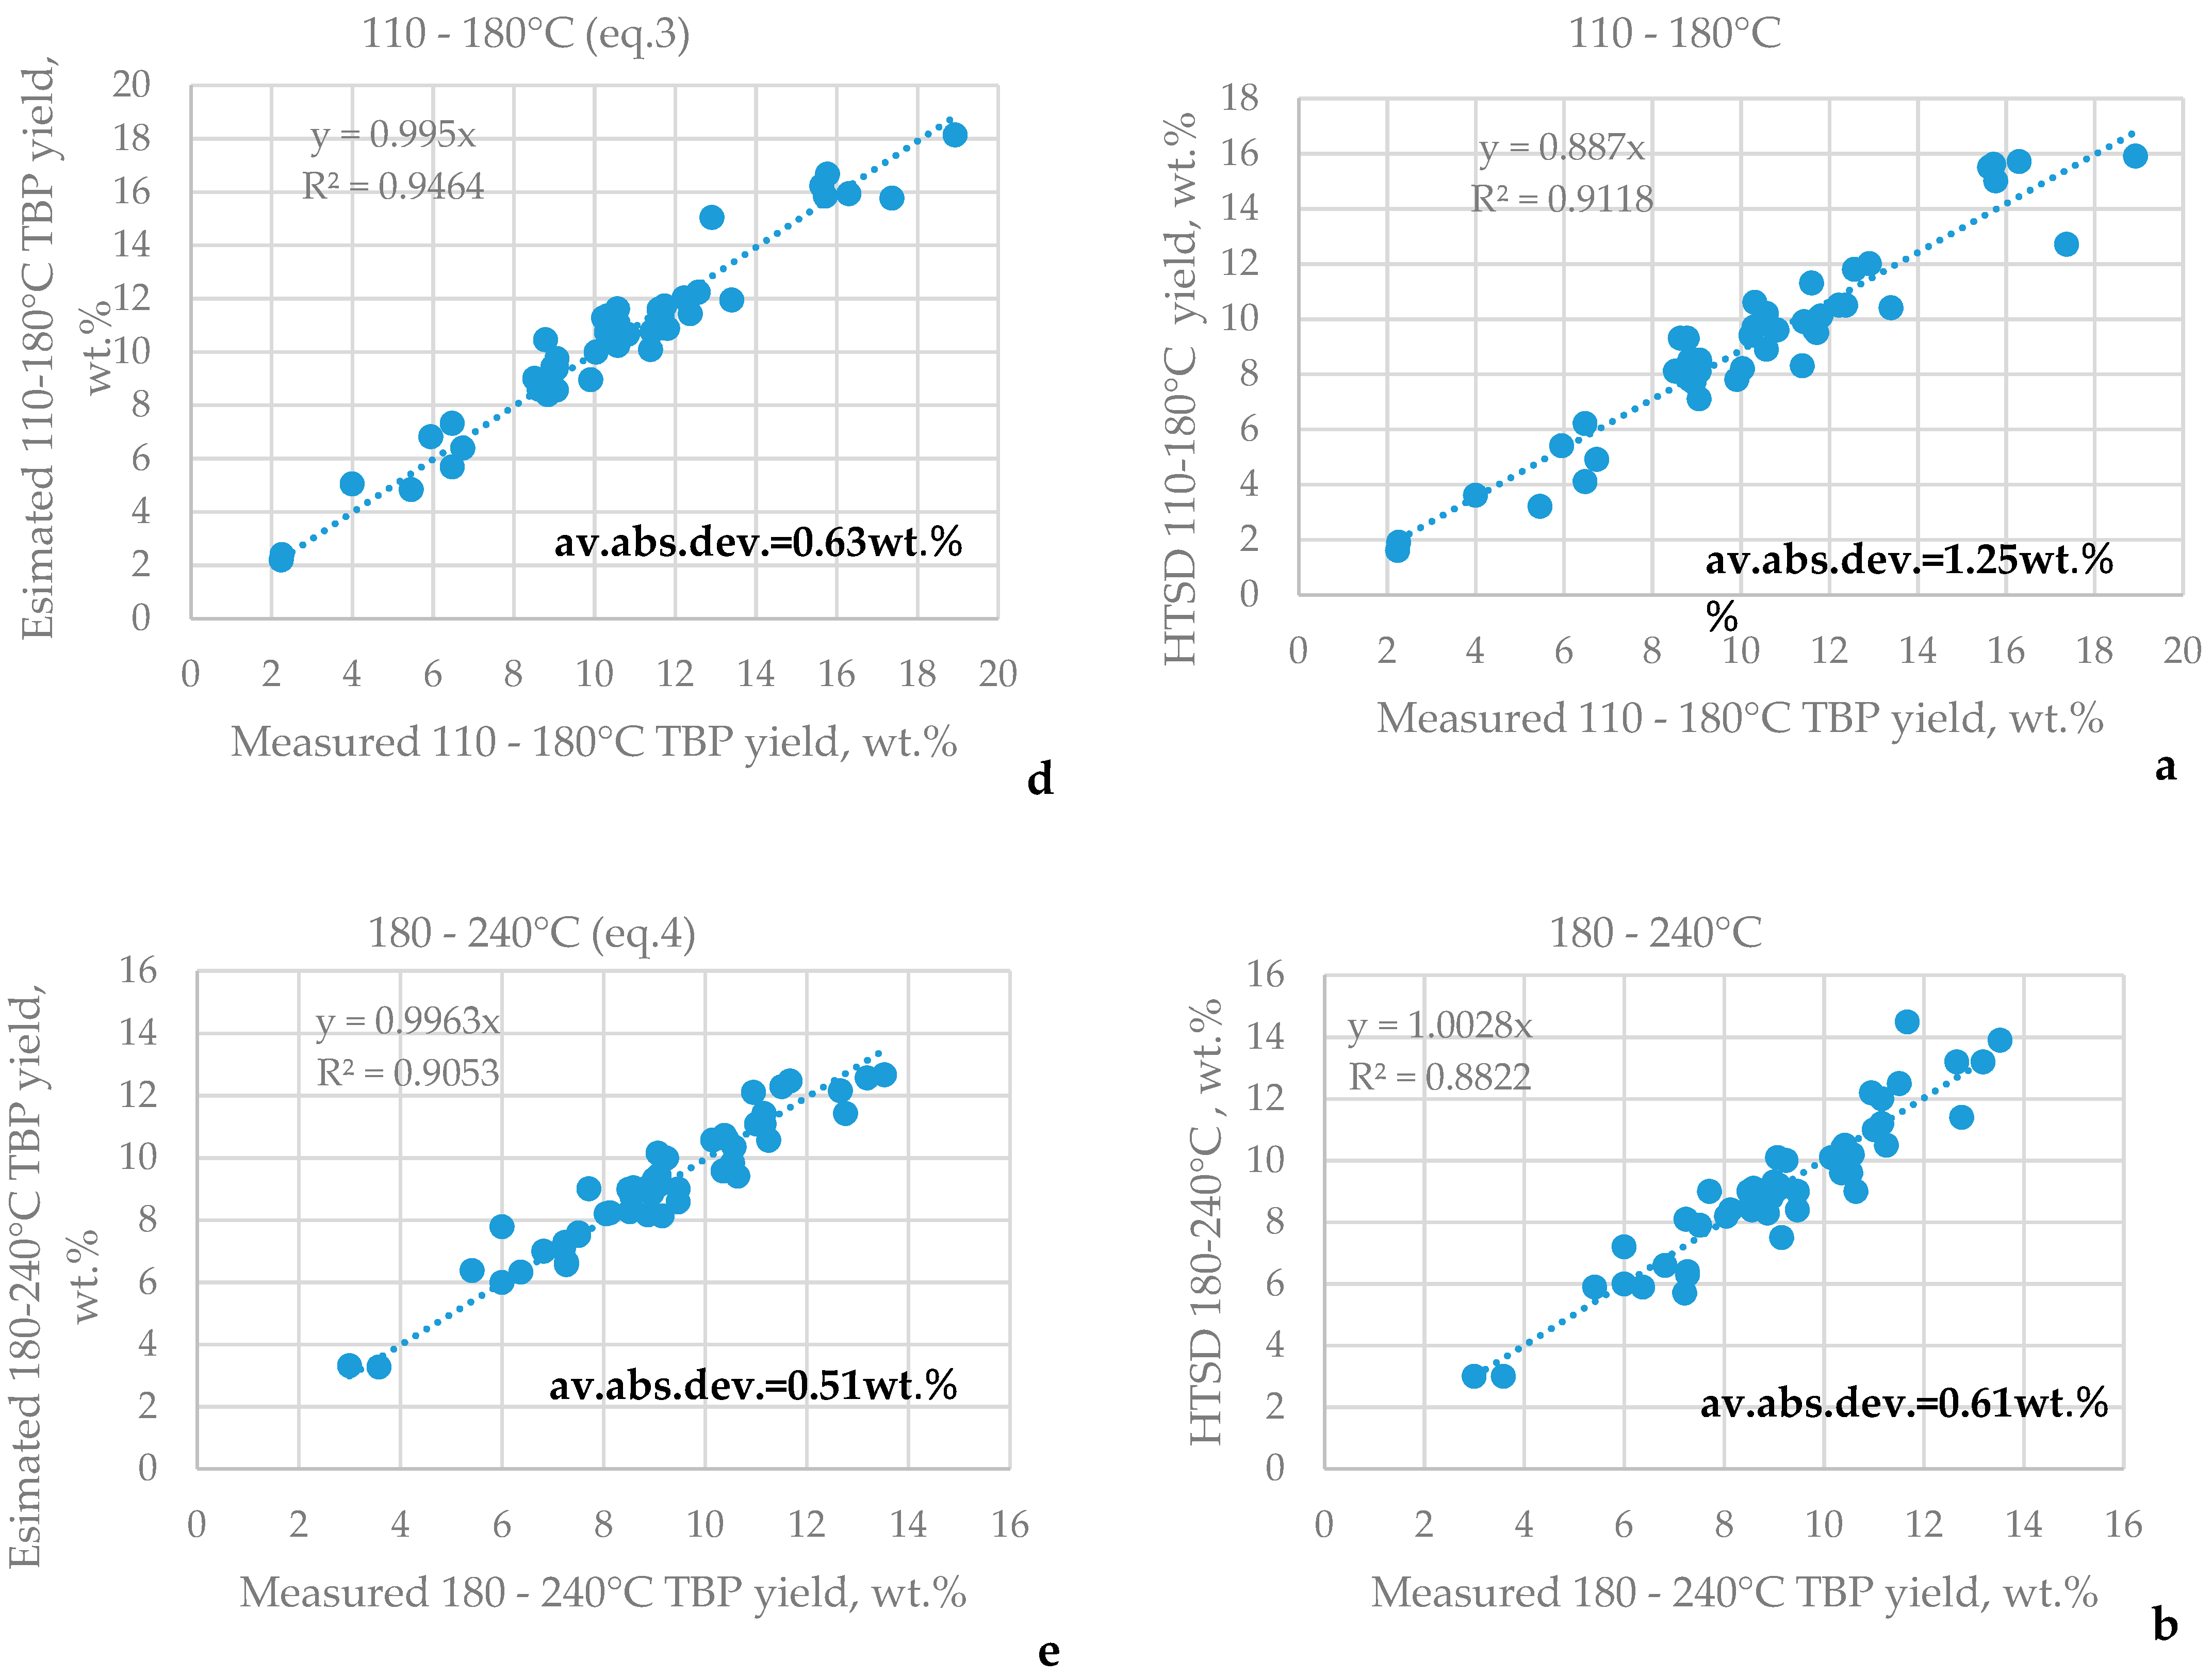
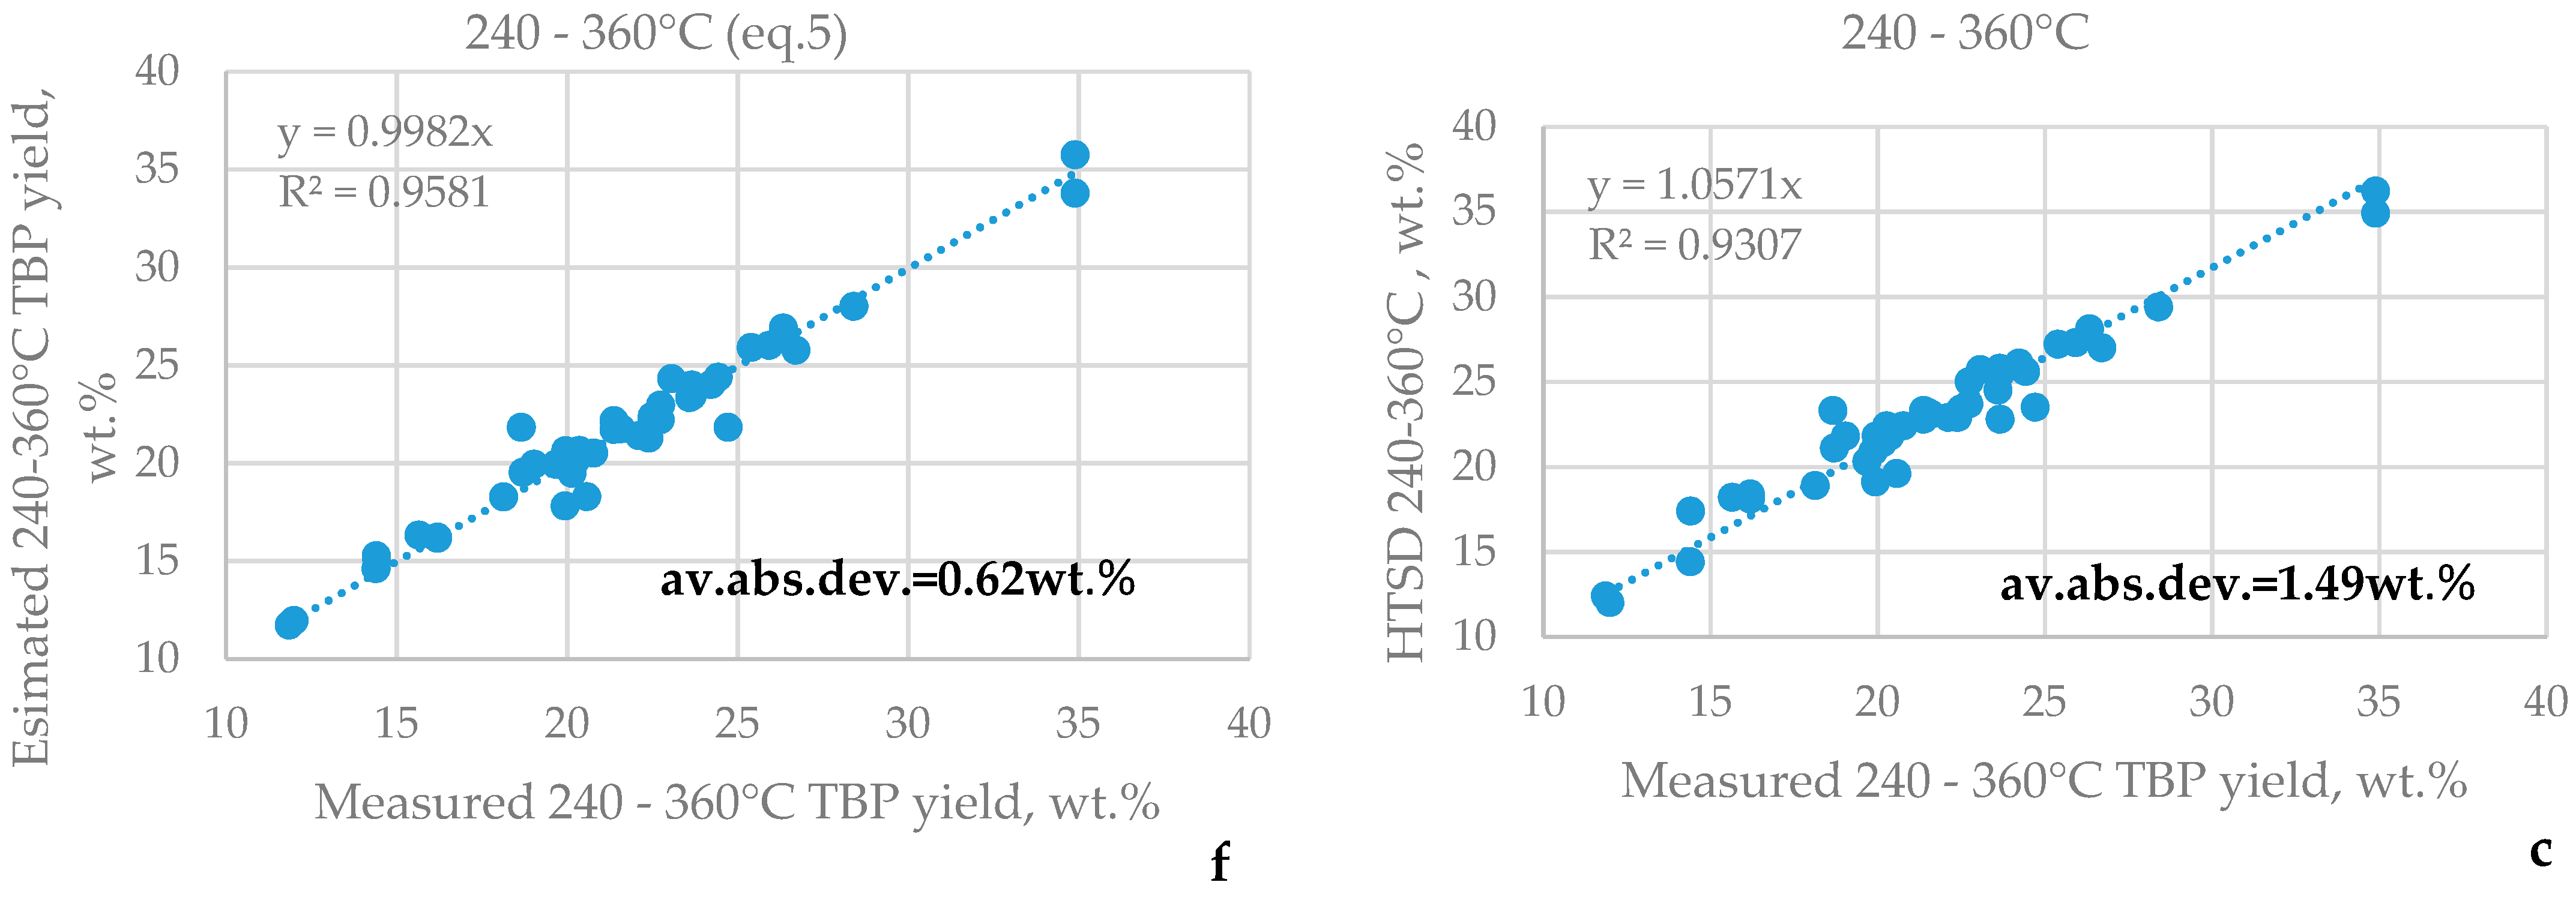
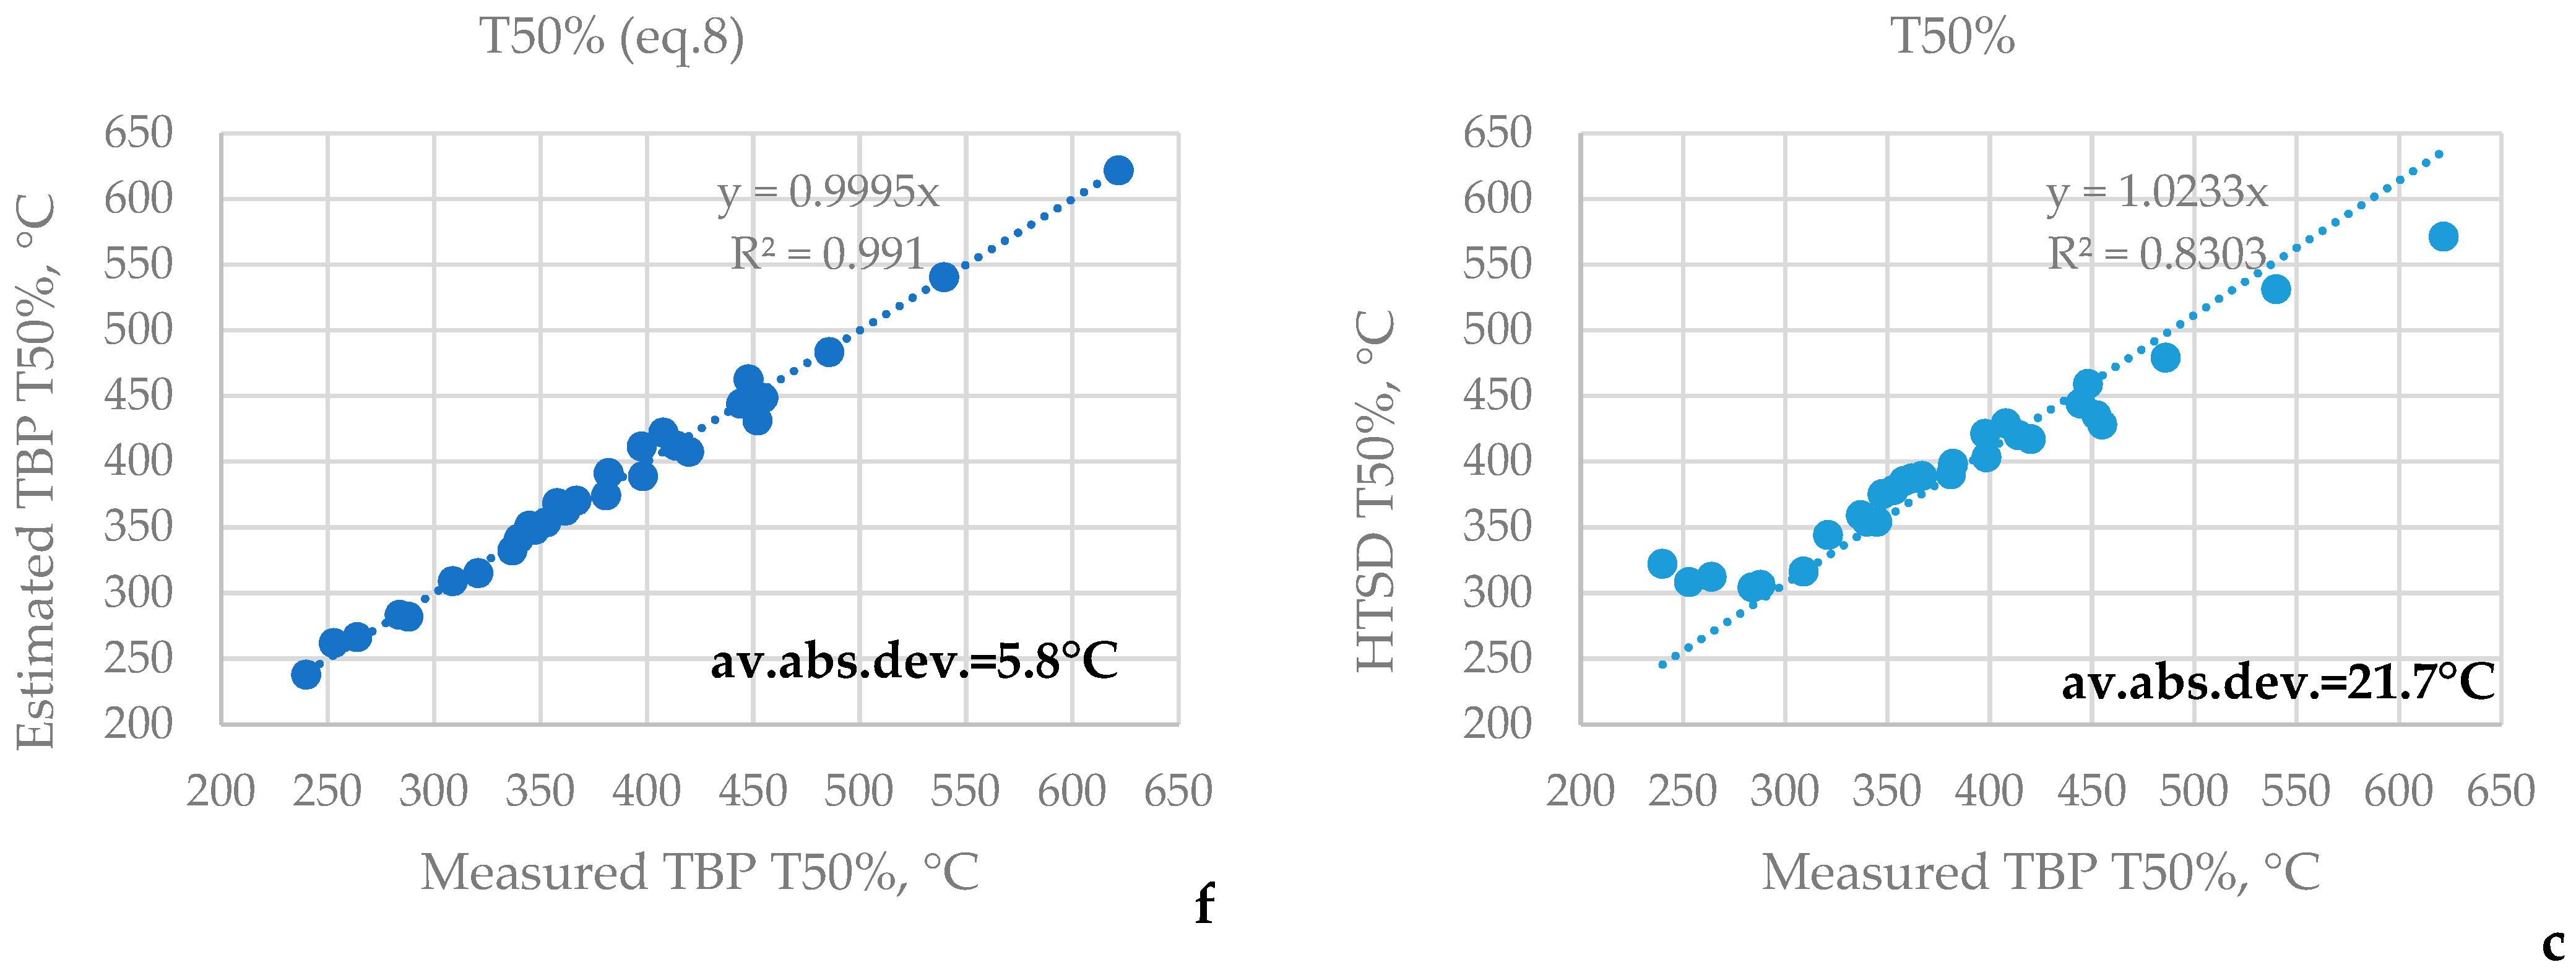
Figure 2 and Figure 3 juxtapose the TBP with HTSD yields for the 110–180 °C, 180–240 °C, 240–360 °C, IBP—360 °C, and IBP—540 °C, T50% fractions of TBP versus HTSD.
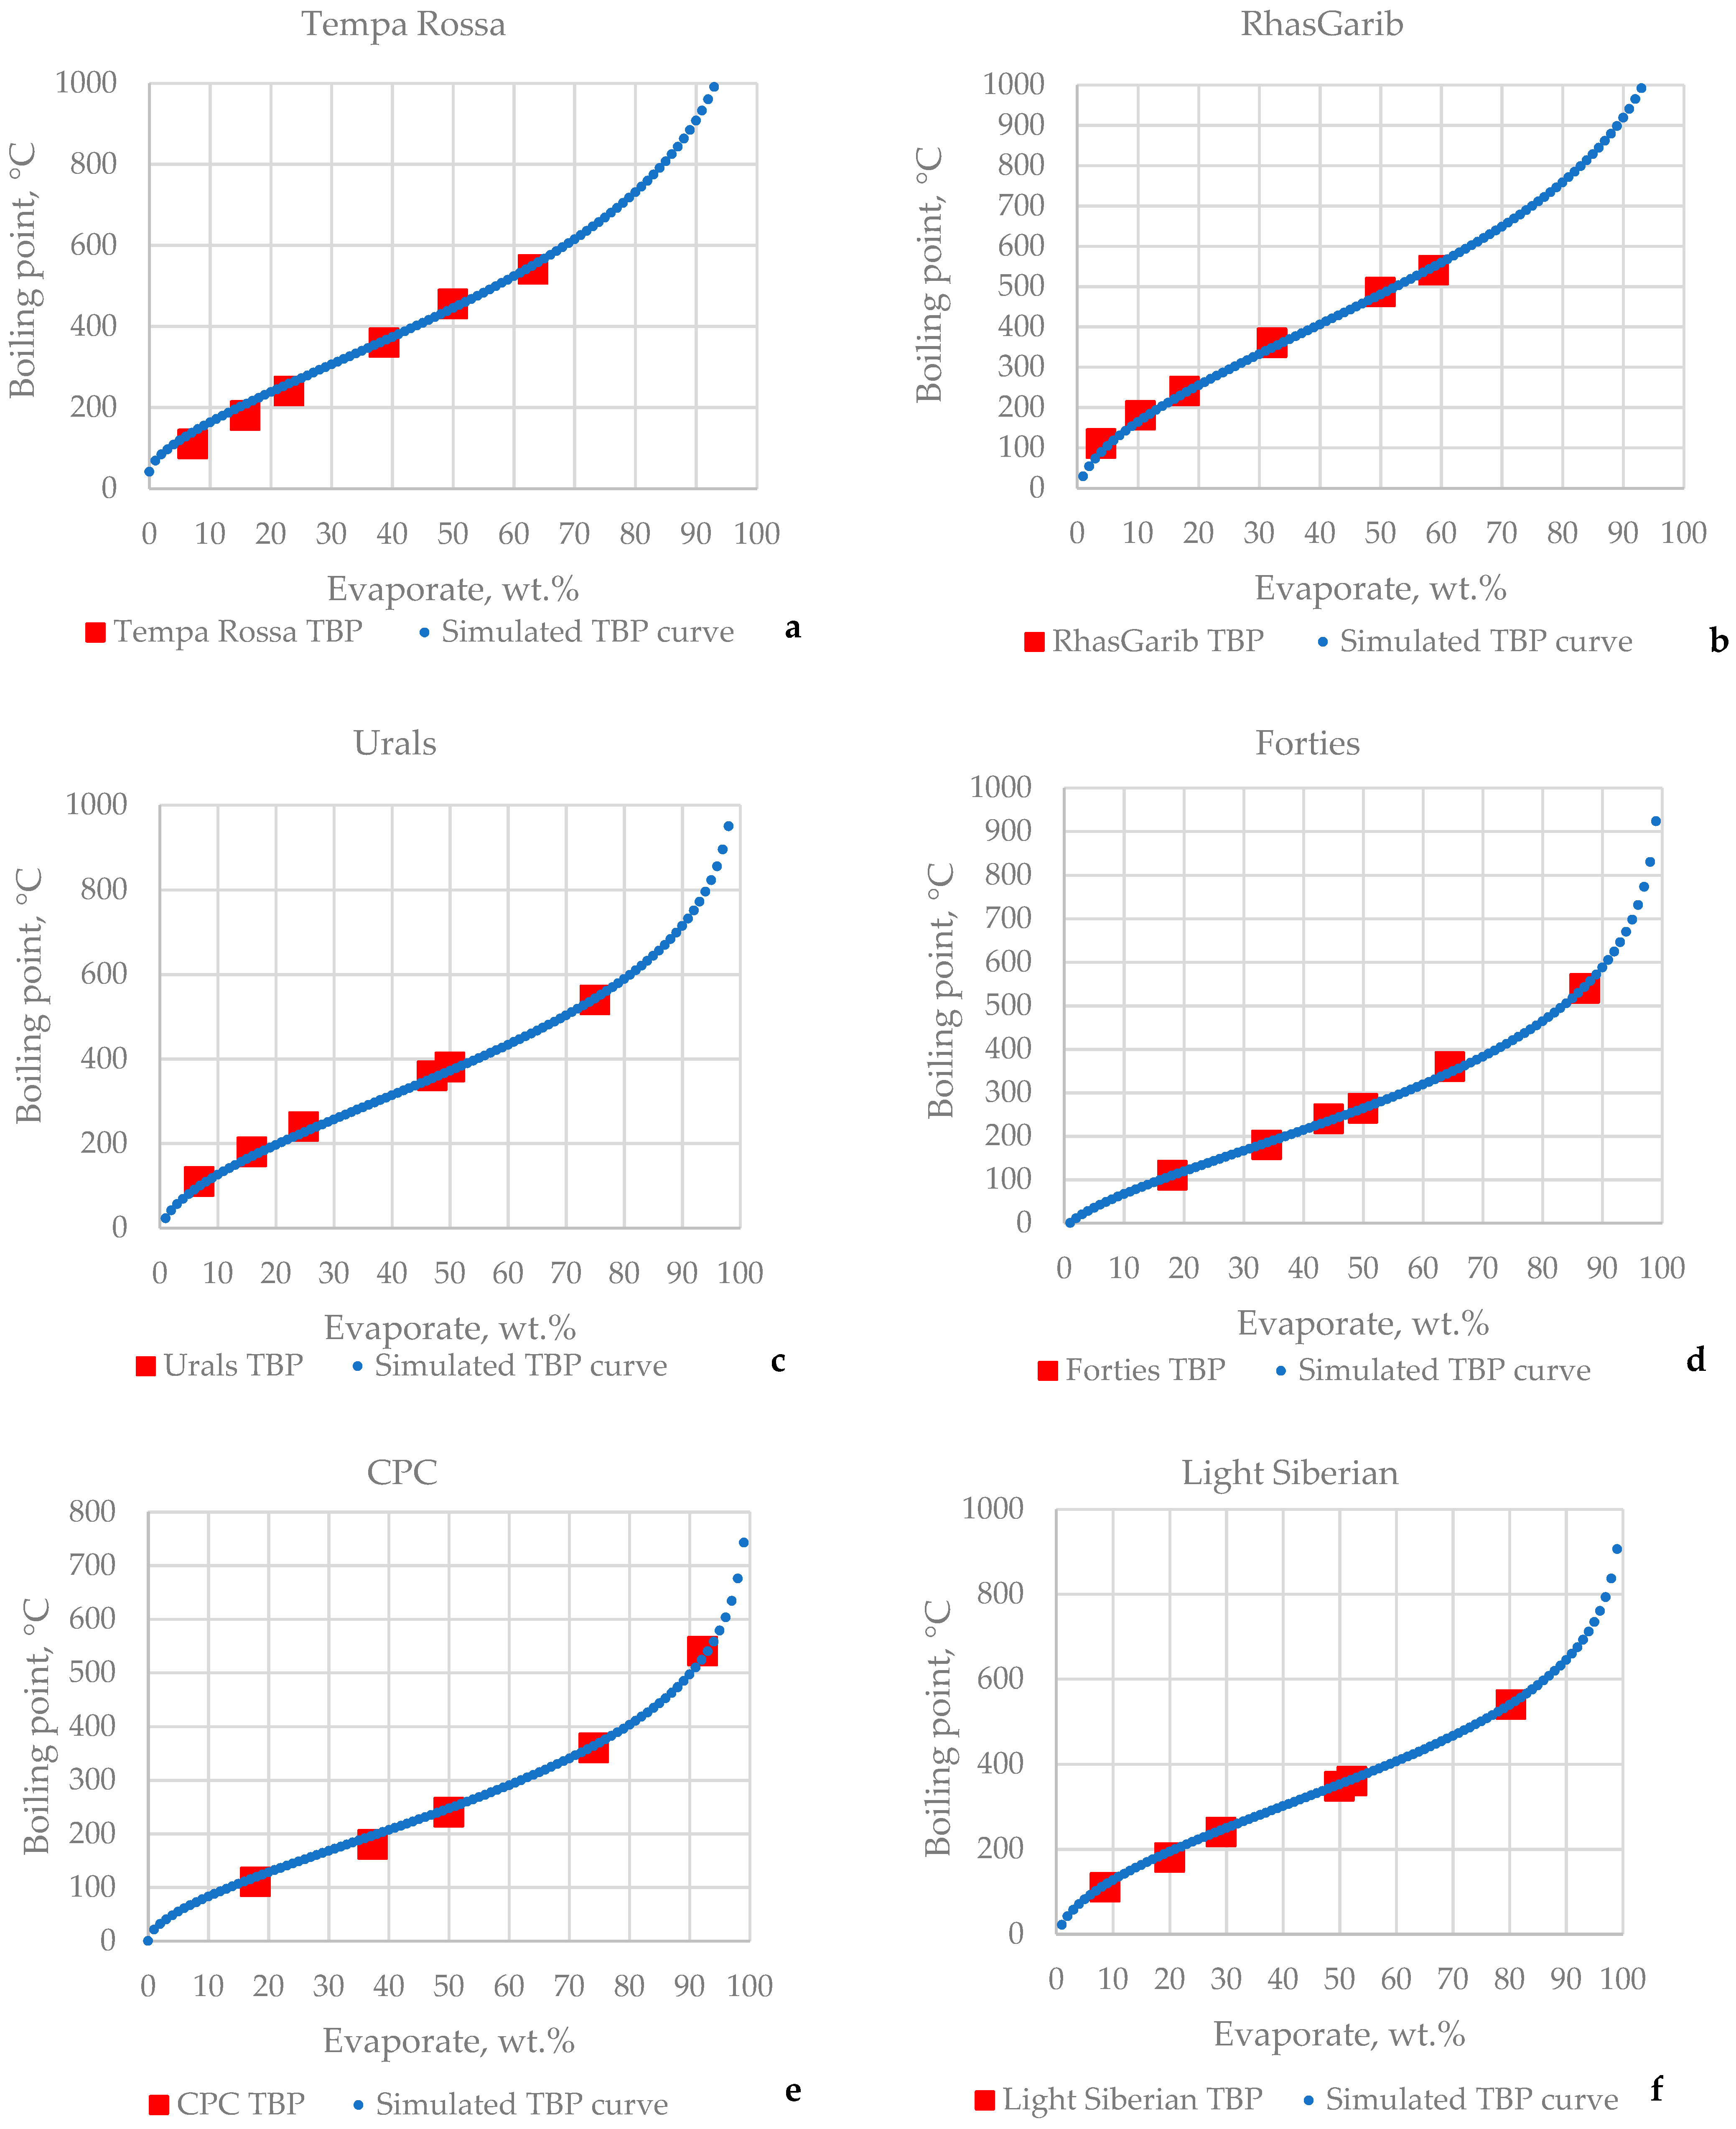
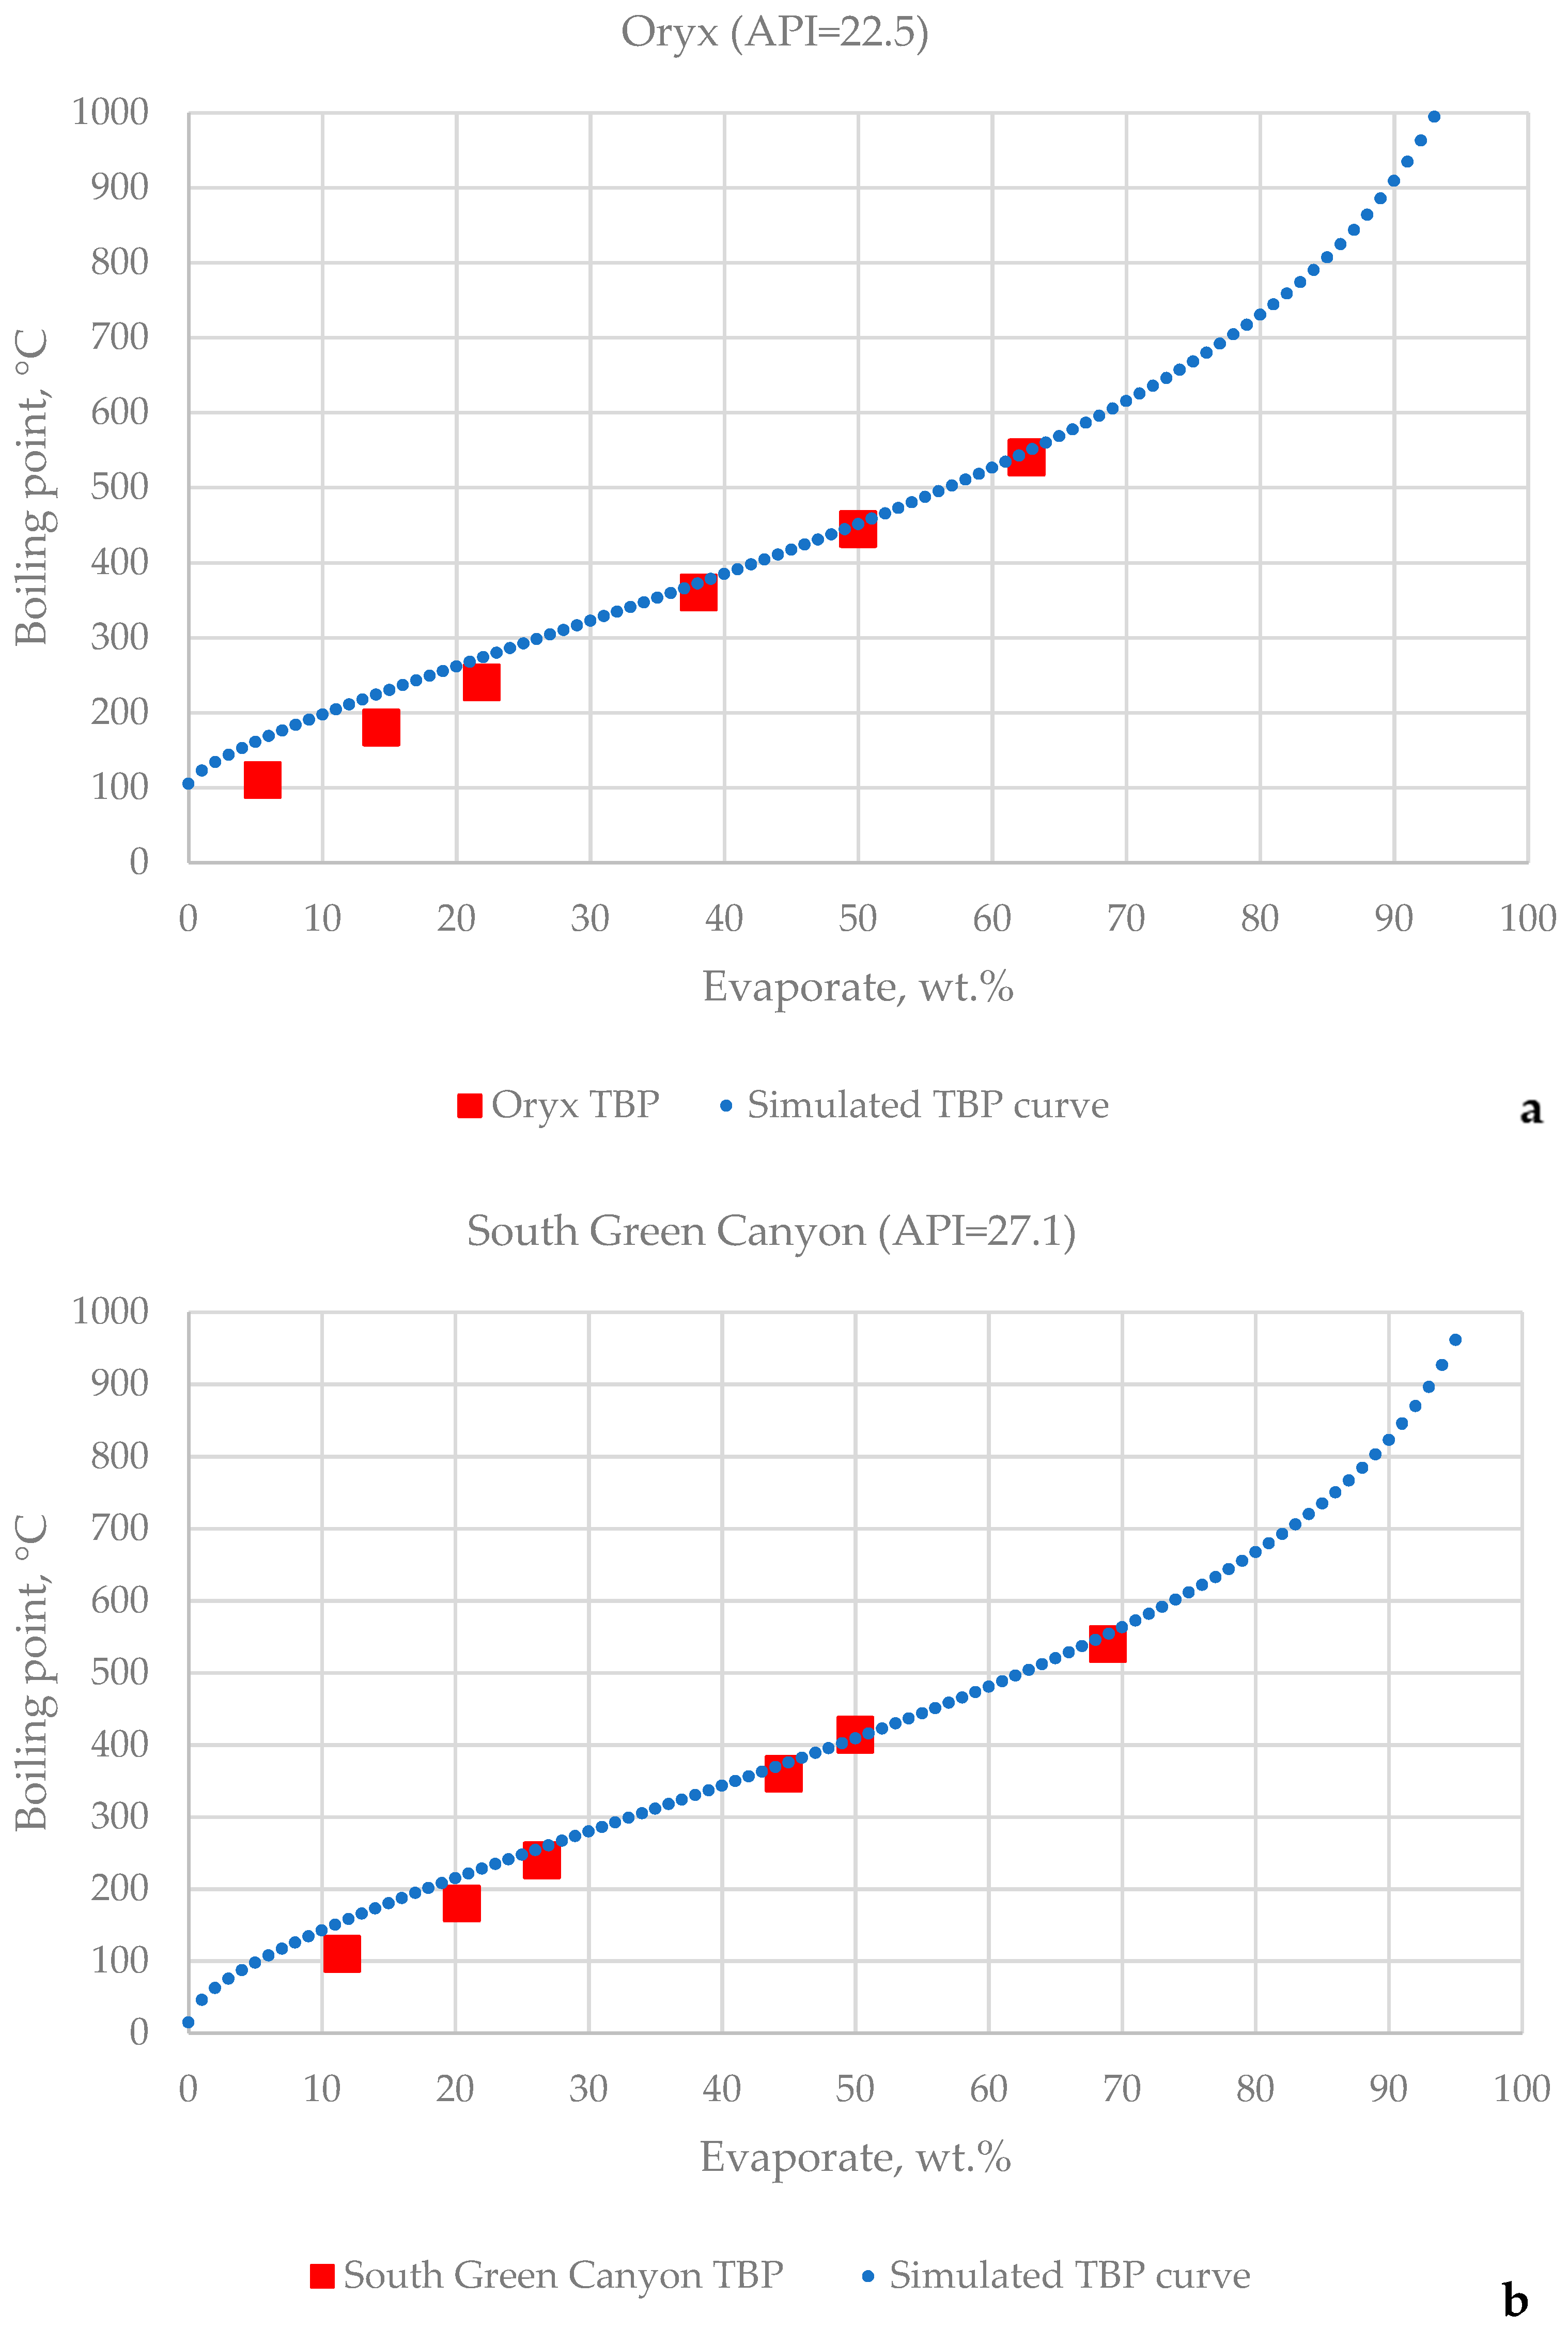
These data clearly show that the equations developed in this work provided a better match to the TBP data than the HTSD data themselves. Using Equations (3)–(8) and employing Riazi’s distribution model (Equation (2)), a full TBP curve could be established, as shown in Figure 4. The values of the A and B parameters from Equation (2) estimated with the distillation data of the studied crude oils are presented in Table S6. The studied crude oils enabled the satisfactory prediction of TBP data from HTSD and specific gravity data (deviation in predicted yields of lower than 1.4 wt.%, as required by ASTM D2892 [11]), except for two crude oils: Oryx (deviation = 3.5 wt.%) and South Green Canyon (deviation = 3.0 wt.%), whose simulated and actual TBP data are shown in Figure 5. The reason for the bigger deviations in TBP yield predictions for these crude oils lies in the poor forecast of the IBP—360 °C fraction yield that resulted in the inadequate prognosis of the lighter part of TBP curve. This is understandable for HTSD, which underpredicts the lighter ends of TBP because of the co-elution of C4–C8 crude oil hydrocarbons with the CS2 solvent, as stated in the ASTM D7169 standard [50]. Although the employment of Equations (3)–(8) and Riazi’s distribution model (Equation (2)) enabled the satisfactory prediction of TBP data from HTSD and specific gravity data for some crude oils, the deviations in predictions of the lighter part of the TBP curve were larger than the reproducibility of the ASTM D2892 method. Thus, as reported in [51], a combination of ASTM D7169 and ASTM D7900 can provide the accurate representation of full TBP curves for crude oils for minutes instead of the three days required to complete ASTM D2892 and ASTM D5236 analyses. Moreover, HTSD can more accurately represents the content of hydrocarbon fractions in heavy oils than the ASTM D5236 and ASTM D1160 physical distillation methods [13,52,53,54].

3.2. Kw Characterization Factor, and Sulphur Distributions of Narrow Fractions in the Crude Oils

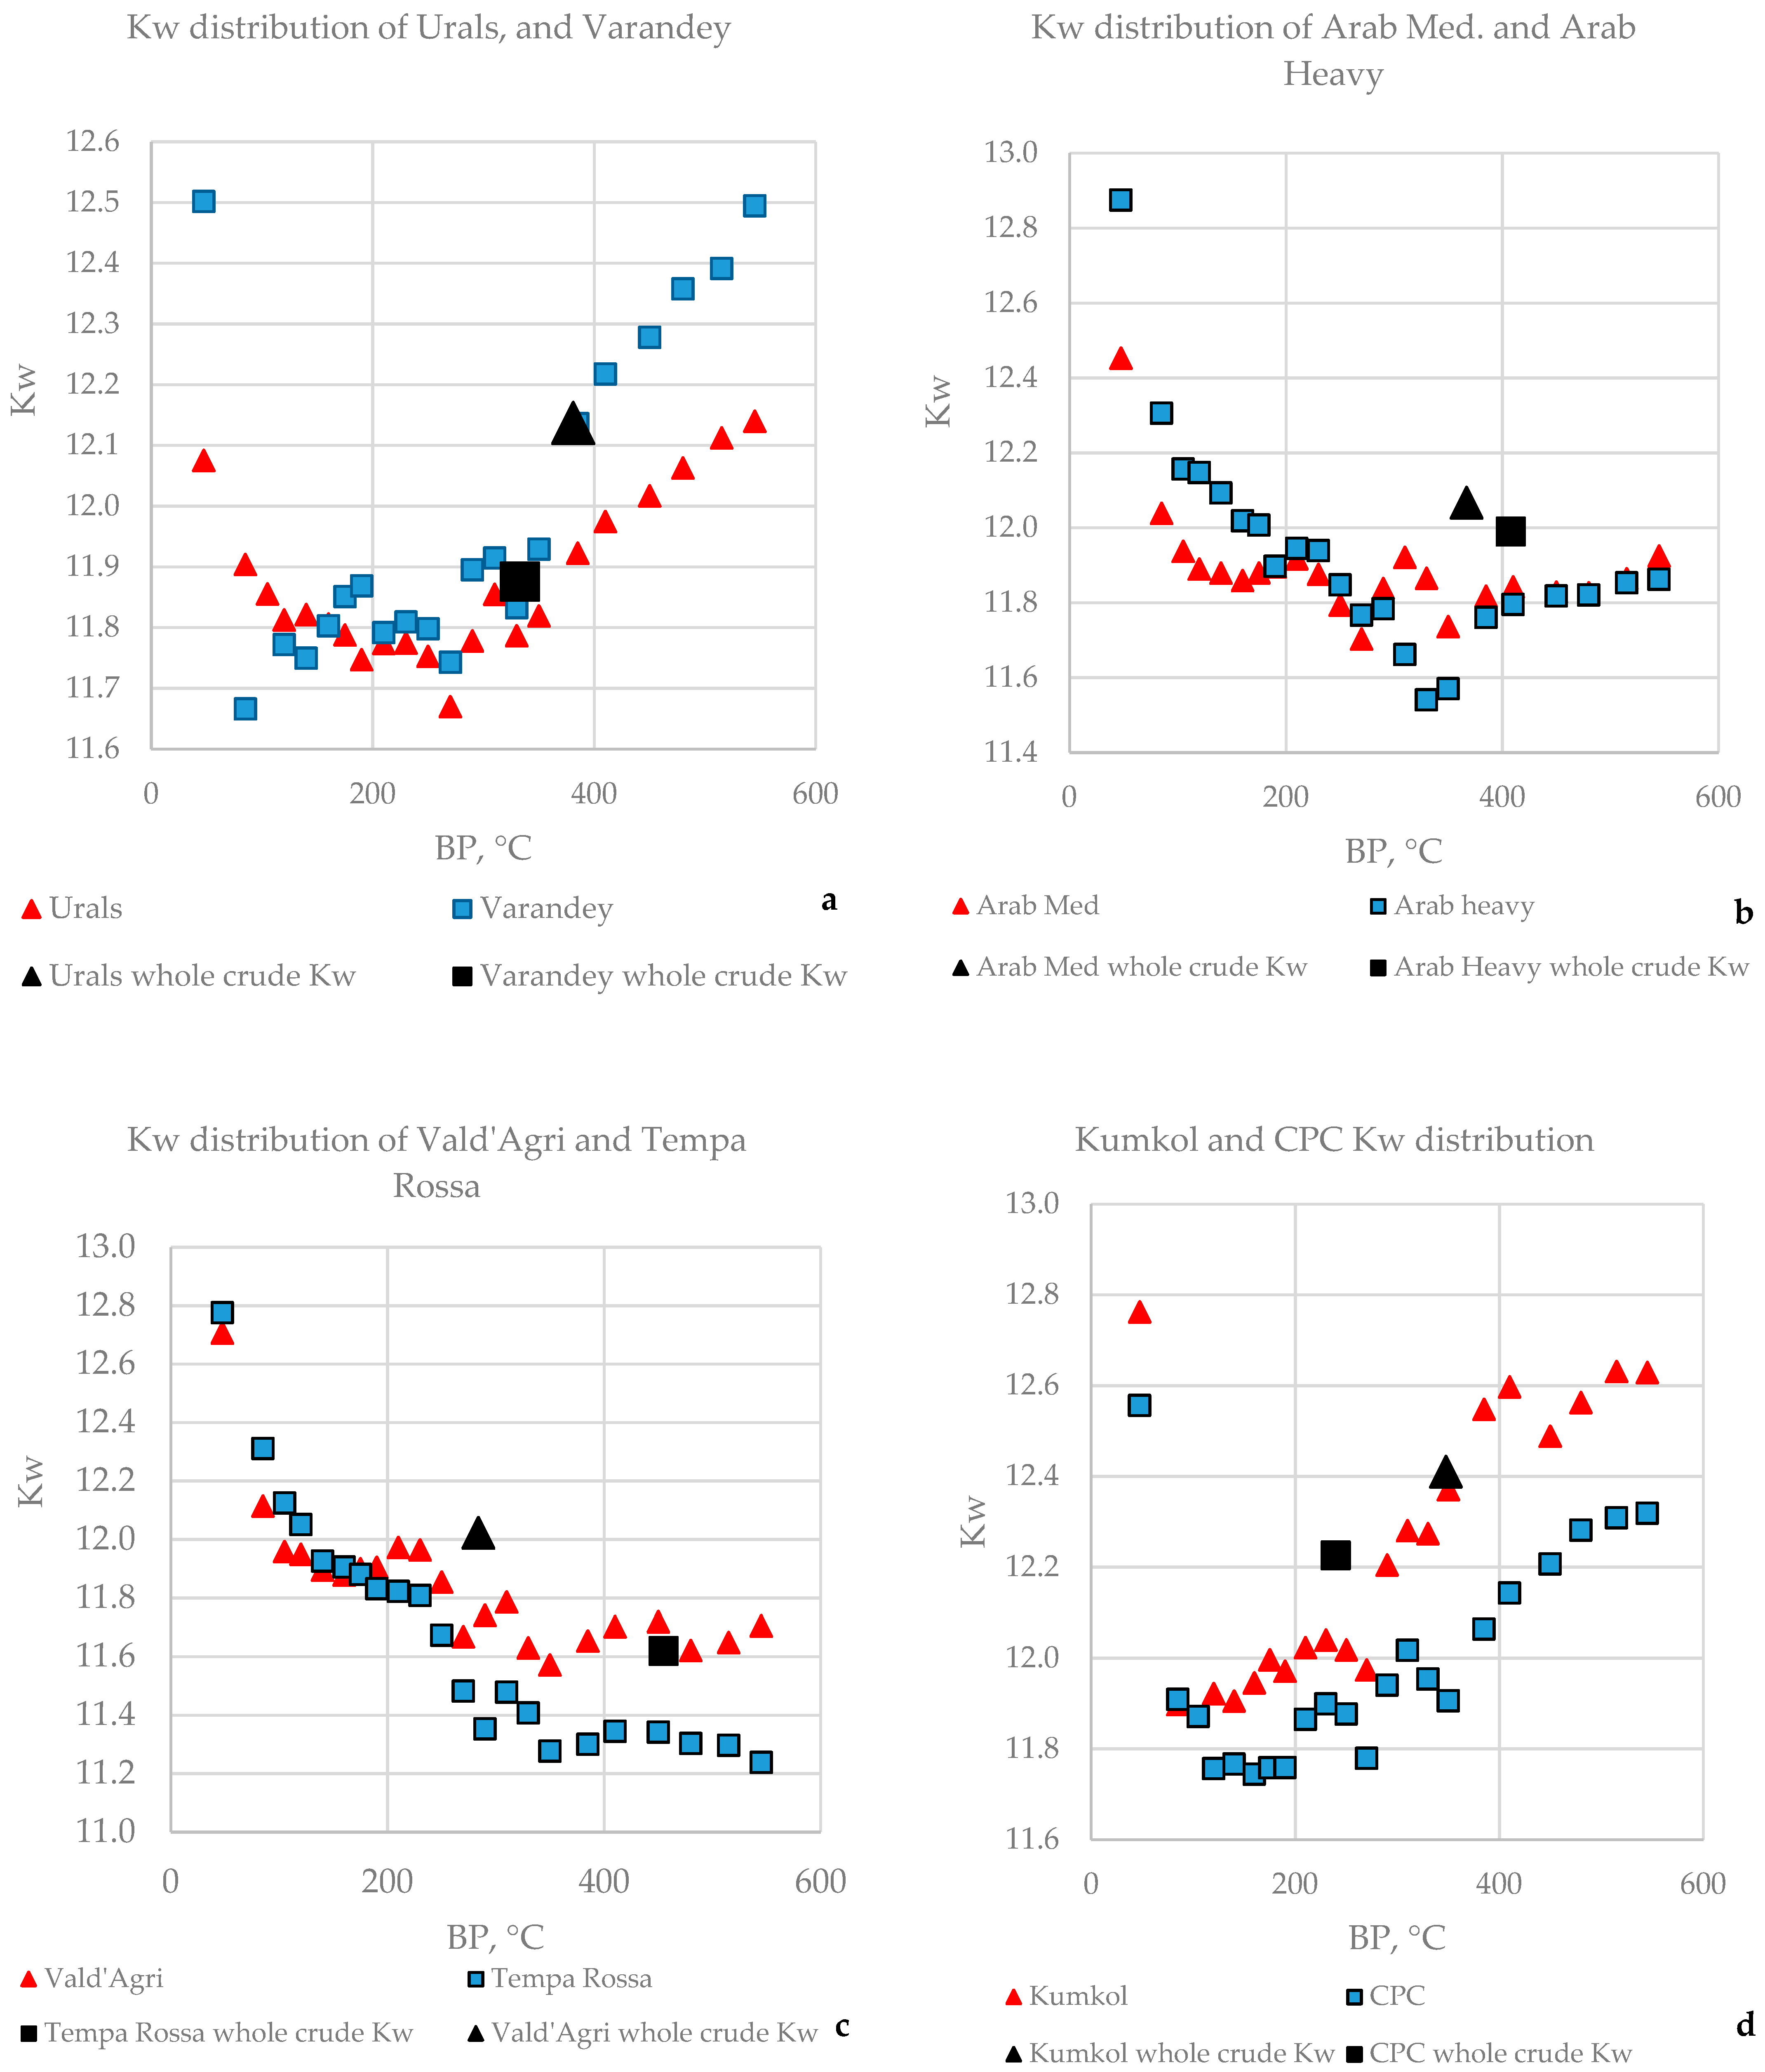
The TBP analysis of crude oil allowed us to measure the density (specific gravity) and sulphur content of the narrow crude oil fractions. Based on the middle boiling point of the narrow fractions (which in our study was assumed to be equal to T50%) and the specific gravity, the Kw characterization factor of each fraction and of the whole crude oil could be calculated using Equation (1). The Kw characterization factor of the narrow fractions of the 30 studied crude oils is shown in Table S7. It is evident from the data in Figure 6 that the distribution of the narrow fraction Kw characterization factor had different shapes for each crude oil and that the whole crude oil Kw factor could be derived from that of the narrow fractions. This is opposite to the generally accepted concept of the constant Kw factor of petroleum fluids [55,56,57]. According to this concept, the density of the narrow fractions can be calculated with Equation (9).
S G = 1.8 T 50 % + 273.15 3 K w
The data in Table S7 and Figure 6, however, indicate that the Kw factor varied depending on the boiling point range of the crude oil. For example, the Varandey crude oil exhibited a Kw factor of 12.50 of the lightest narrow fraction (T50% = 47.5 °C), then dropped to 11.67 for the narrow fraction with T50% = 85 °C, and started increasing to reach 12.49 for the narrow fraction with T50% = 545 °C. On the other hand, the Kw factor of the whole Varandey crude oil was 11.88. Considering Tempa Rossa crude oil, the Kw factor of the narrow fractions continually decreased from 12.78 for the lightest narrow fraction (T50% = 47.5 °C) to 11.24 for the heaviest narrow fraction with T50% = 545 °C. On the other hand, the whole Tempa Rossa crude oil Kw factor was 11.62. Using intercriteria analysis evaluation allowed us to quantify the extent of similarity in the pattern of Kw factor variation through the whole crude oil boiling range. Table 1 shows the degree of similarity quantified with ICrA evaluation on the basis of Kw factor variation through the whole boiling range of the crude oils. Normally in ICrA, the final matrix is nxn, where n is the number of objects being compared, but here, due to the large size of the matrix, only the part containing the most significant elements is shown. The data in Table 1 indicate that there was no strong statistically meaningful consonance (μ ≥ 0.95) between any of the studied crude oils, confirming the statement made by Abdel-AalMohammed and Alsahlawi [58] and Gary et al. [59] that no two crude oils are the same. These data also indicate that the patterns of Kw factor variation through the whole boiling range of the crude oils may be very different, as also indicated by the data shown in Figure 6. Therefore, the concept of a constant Kw factor may lead to the reporting of wrong values for the specific gravity curves of crude oils.
Just for comparison, Table 2 presents the degree of similarity between some of the investigated crude oils determined based on the application of intercriteria analysis and HTSD data, total sulphur content, and crude oil specific gravity. These data indicate the presence of strong positive consonance (μ ≥ 0.95) between, for example, the Tempa Rossa, Arab Heavy, Albanian, Arab Medium, Basrah Light, Oryx, and South Green Canyon crude oils that implies that these crude oils are similar in terms of their distillation characteristics, total sulphur content, and bulk specific gravity. The data in Table 1 and Table 2 suggest that the distillation characteristics of the crude oils cannot be used as an indicator of the Kw factor variation through the whole crude oil boiling range. Thus, while the TBP simulated with a gas chromatographic could be used to predict distillation, specific gravity curve simulation cannot be accurate applied the concept of a constant Kw factor. Additional investigations are needed to develop an appropriate procedure to simulate crude oil specific gravity curves.
The sulphur content data of 23 narrow fractions of the 34 studied crude oils are presented in Table S8. Figure 7 shows the distribution of sulphur among the boiling point range of some of the studied crude oils. These data show that the sulphur content generally increased with boiling point increases. However, the shape of the curve and the slope of increase were different for each crude oil. For the dataset in Table S8, ICrA evaluation was performed to assess the similarity of sulphur content variation through the whole boiling range of the studied crude oils. Table 3 presents the degree of similarity between some of the investigated crude oils determined based on the application of intercriteria analysis and sulphur content variation through the whole crude oil boiling range. The data in Table 3 indicate the presence of a higher degree of similarity between the studied crude oils than that observed in Table 1, where the Kw factor distribution was evaluated with ICrA. For example, the Iranian Heavy crude oil had a positive consonance μ = 0.9407 with Arab Medium crude oil. Although this value was higher than the highest positive consonance of μ = 0.9177 (between Bonga and RasGharib) observed in the ICrA evaluation of Kw factor distribution, it was much lower than the μ = 0.9863 (between Tempa Rossa and Oryx) observed in the ICrA evaluation of boiling point distribution.
This may imply that the crude oil boiling point distribution cannot be considered reliable enough for use it as a tool to predict specific gravity and sulphur distribution curves, which is in contrast with the conclusion of Swafford and McCarthy [60] that specific gravity, total sulphur content, and simulated distillation can be used to simulate a complete comprehensive assay of a crude oil. Indeed, some relations between the different crude oil properties may be found, as reported in our earlier study [47], but the limit of uncertainty for the prediction of density, for example, can be broad for some crude oils. This statement is completely in line with the conclusions reached by Abdel-AalMohammed and Alsahlawi [58] and Gary et al. [59] that no two crude oils are the same.

3.3. SARA Composition and Bulk Properties of Studied Crude Oils

The SARA analysis data and bulk properties of 48 extra light, light medium, heavy, and extra heavy crude oils are summarized in Table S9. Table 4 summarizes the range of variations in the SARA composition and crude oil bulk properties
Table 5 and Table 6 present the results of ICrA evaluation used for the determination of statistically meaningful relations between the SARA composition data and the bulk crude oil properties.
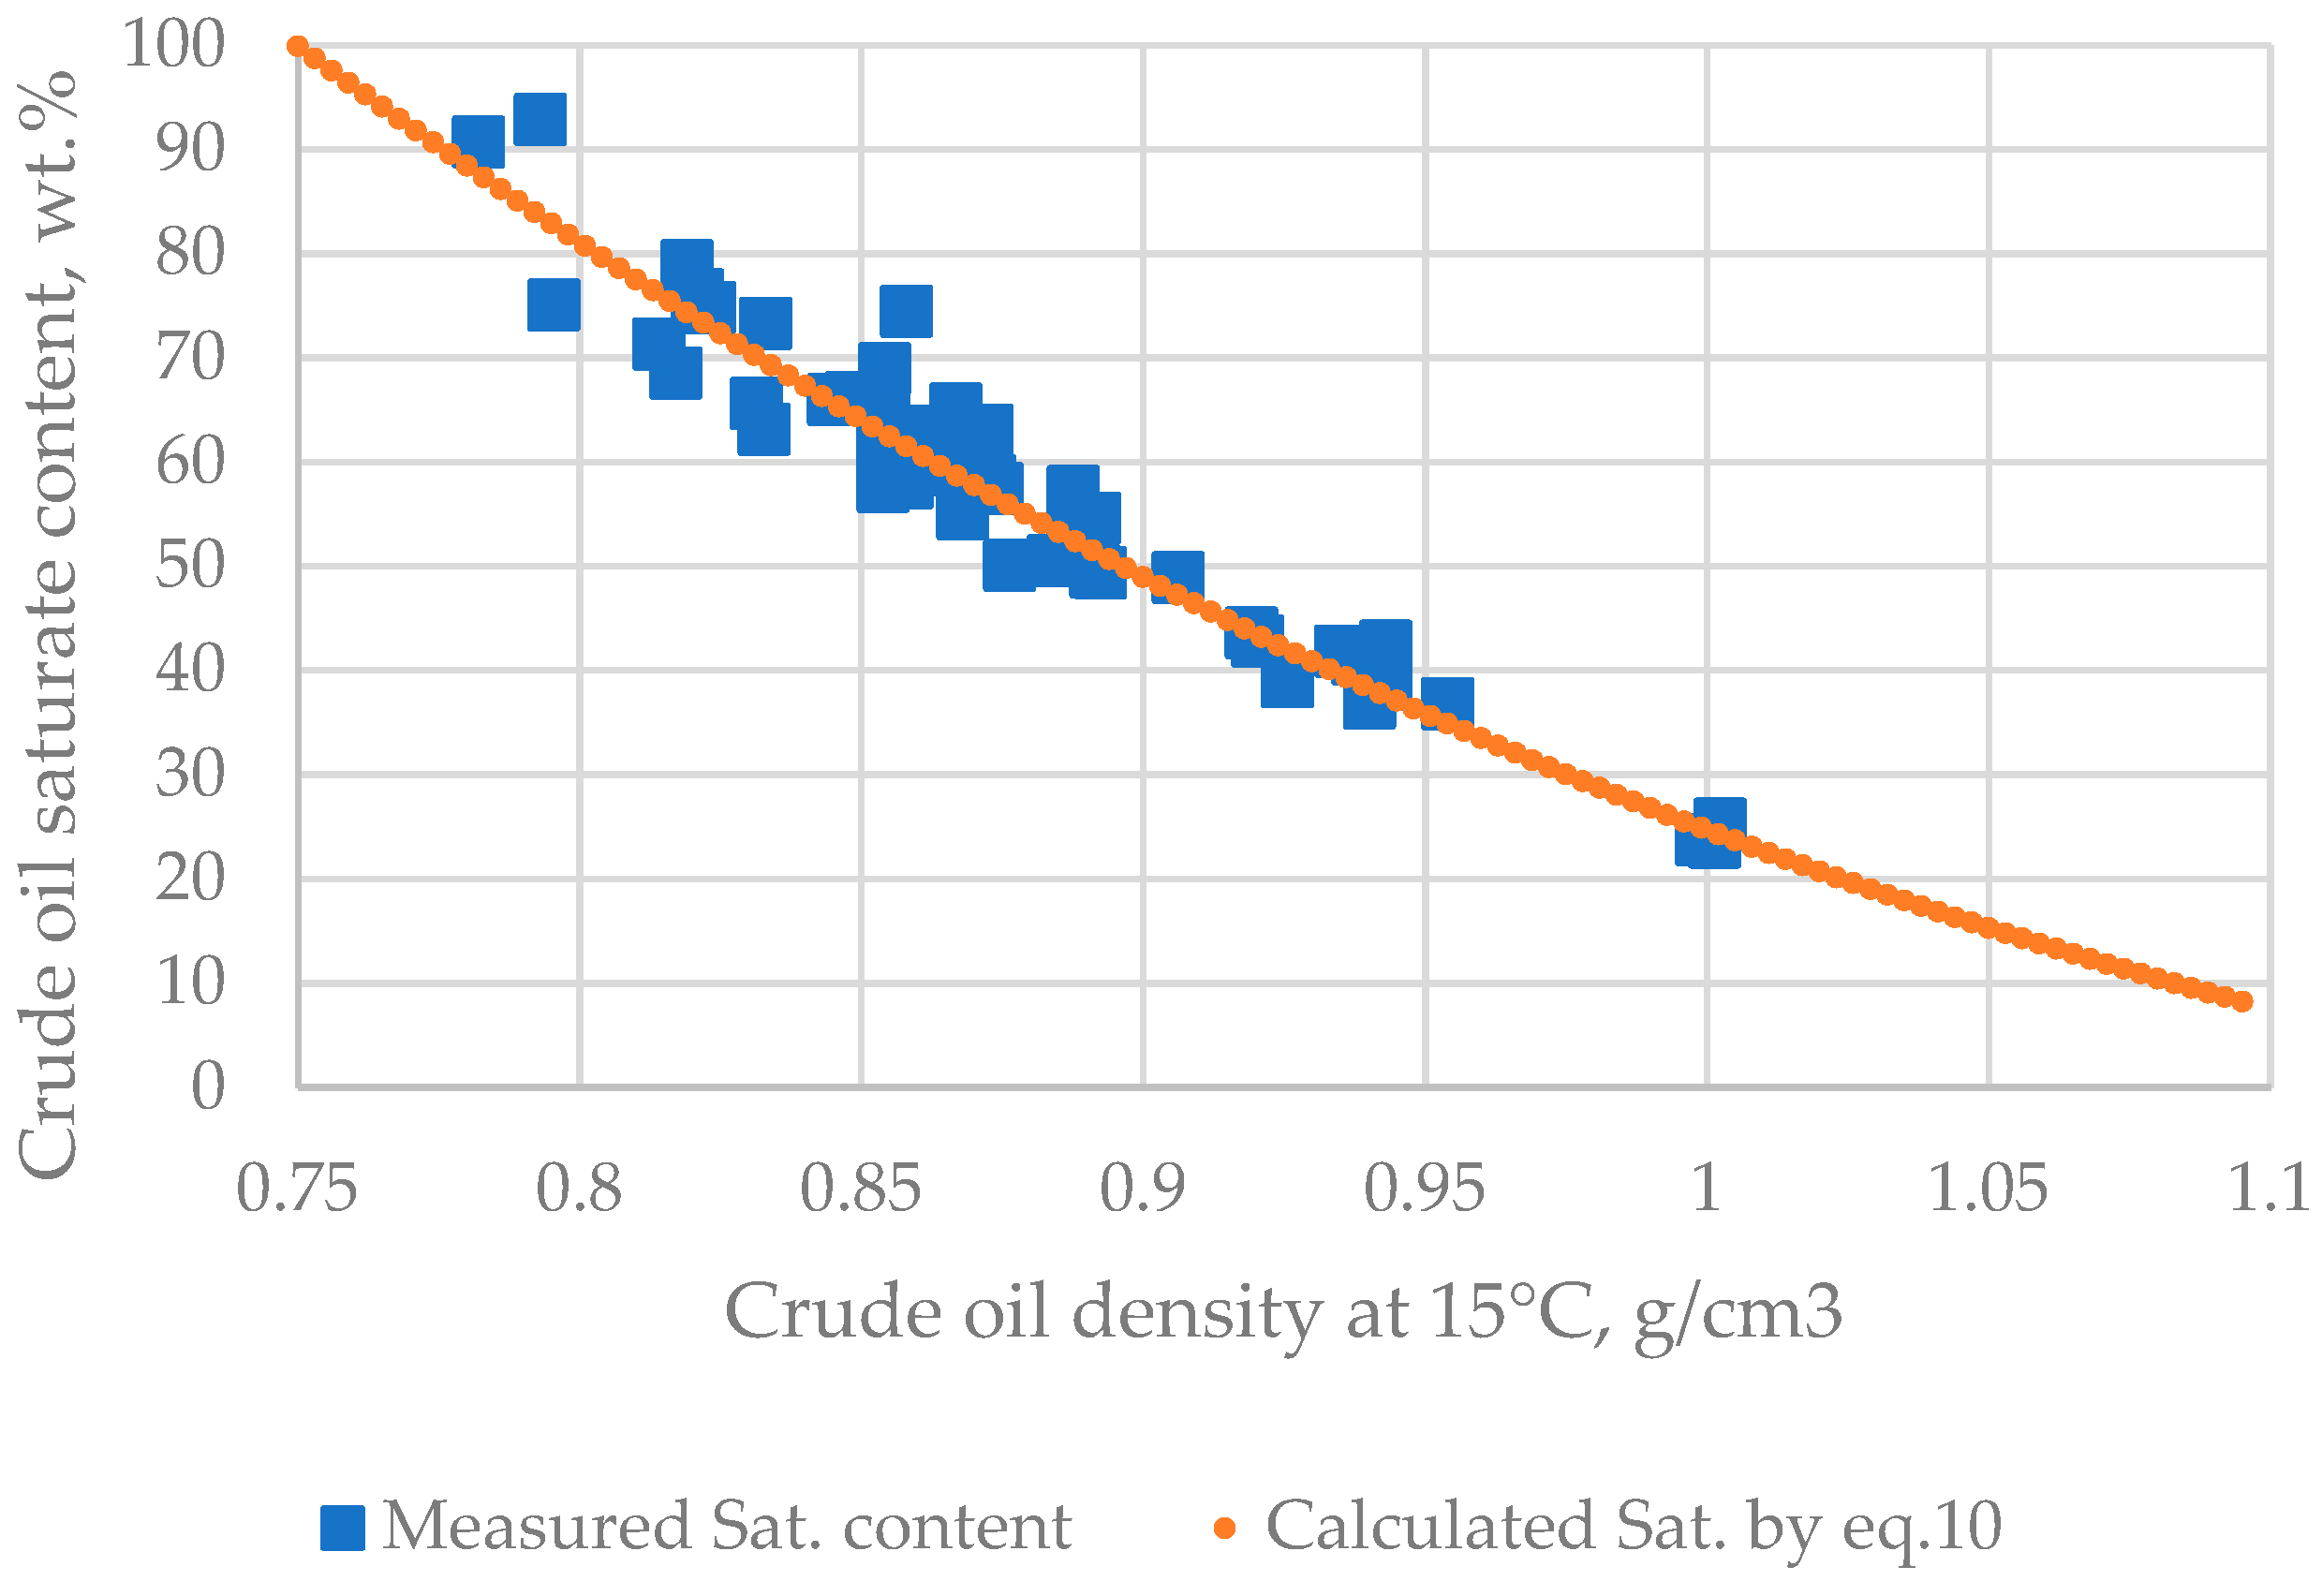
The data in Table 5 and Table 6 show similar relations as those observed for the vacuum residues from our recent study [61], with the specific gravity being the crude oil characteristic most related to saturate content. Based on the data of SARA composition for 308 crude oil samples measured in accordance with ASTM D2007, modified ASTM D4124, HPLC, TLC-FID (Iatroscan), and liquid chromatography in our recent research [23], a relation (Equation (10)) between crude oil saturate content and crude oil specific gravity was developed.
C r u d e   o i l   s a t u r a t e s   ( w t . % ) = 100 ( 100 0.2748 + 5.198 e 4.787 S G 239 )
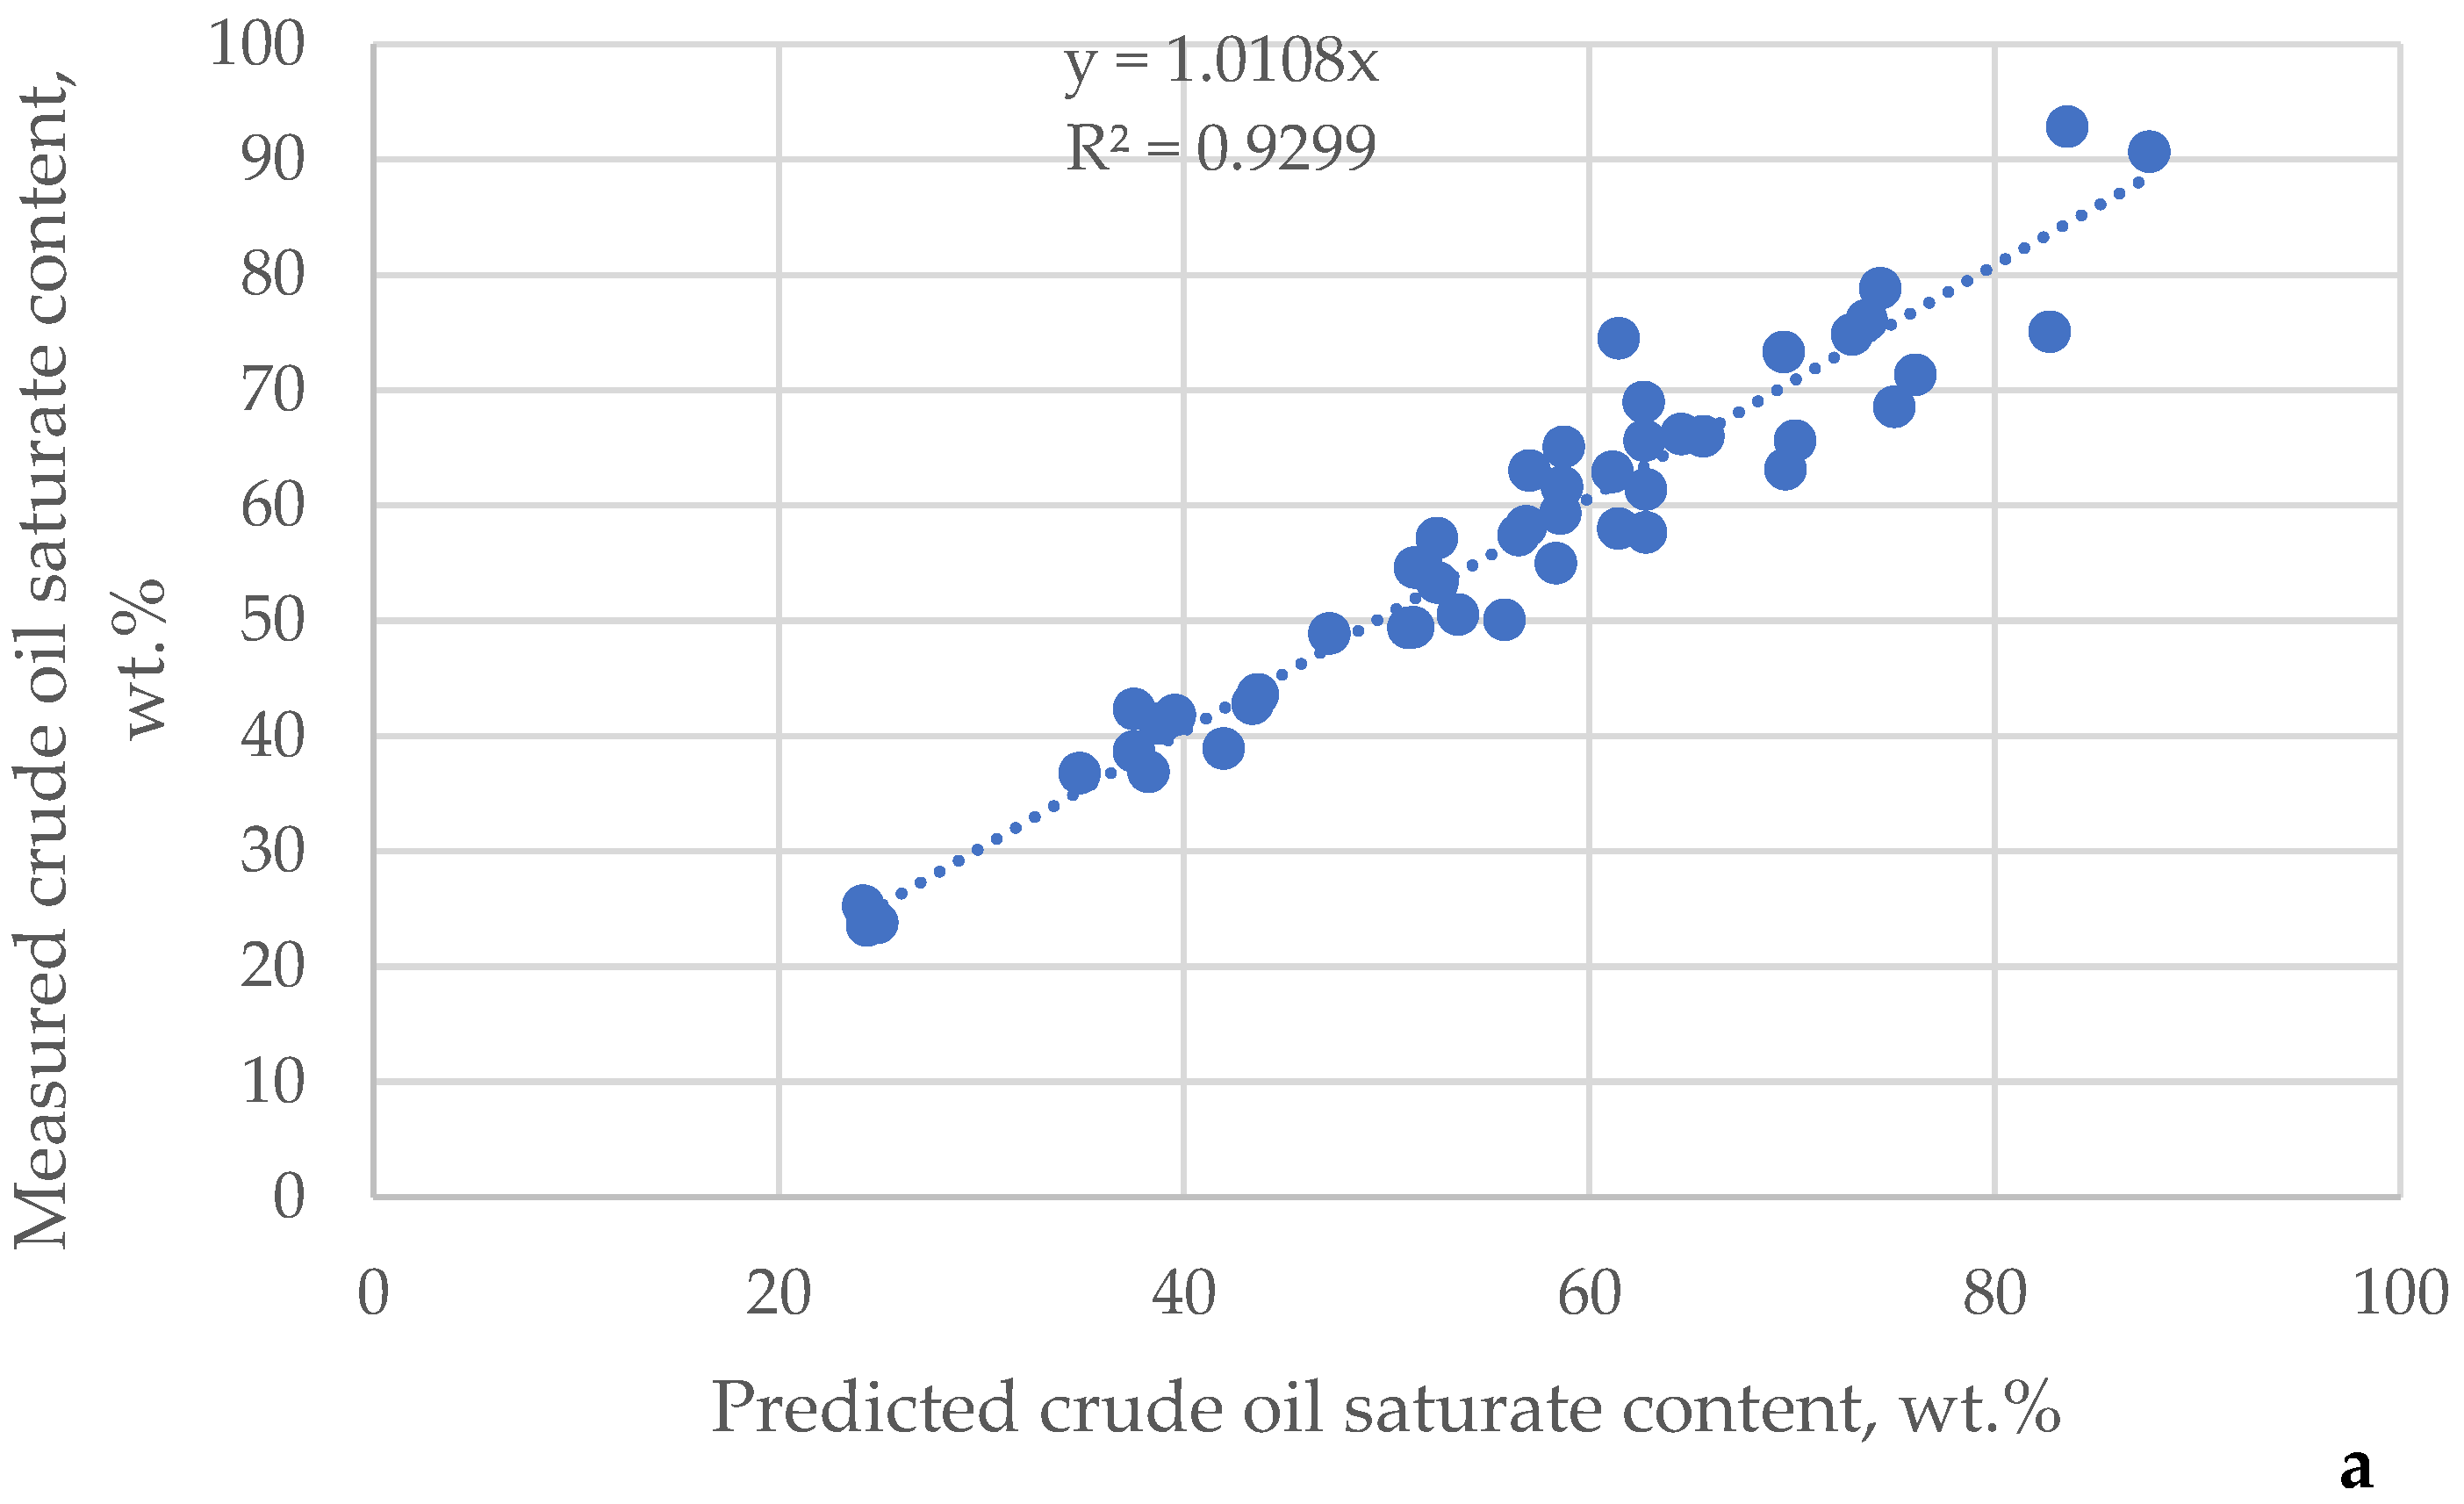
Figure 8 shows the relation of crude oil density to the saturate content estimated with Equation (10). The average absolute deviation of Equation (10) was found to be 3.3 wt.%. The maximum absolute deviation was 13.3 wt.%. The bias was −0.7 wt.%.
A more accurate prediction of crude saturate content was obtained by using nonlinear regression and employing the data generated with Equation (10), which relates saturate content to crude oil specific gravity and pour point. The new regression designated as Equation (11) is shown below.
C r u d e   o i l   s a t u r a t e s   ( w t . % ) = 0.30283 × S a t S G 0.25515 × P P + 31.45053 + 0.0052145 × S a t S G 2 + 0.0028855 × S a t S G × P P 0.0067996 × P P 2 + 0.00006159 × S a t S G 2 × P P + 0.000152899 × S a t S G × P P 2 441.77259 S a t ( S G )
where Sat(SG) = crude oil saturate content calculated with Equation (10) from SG, wt.%.
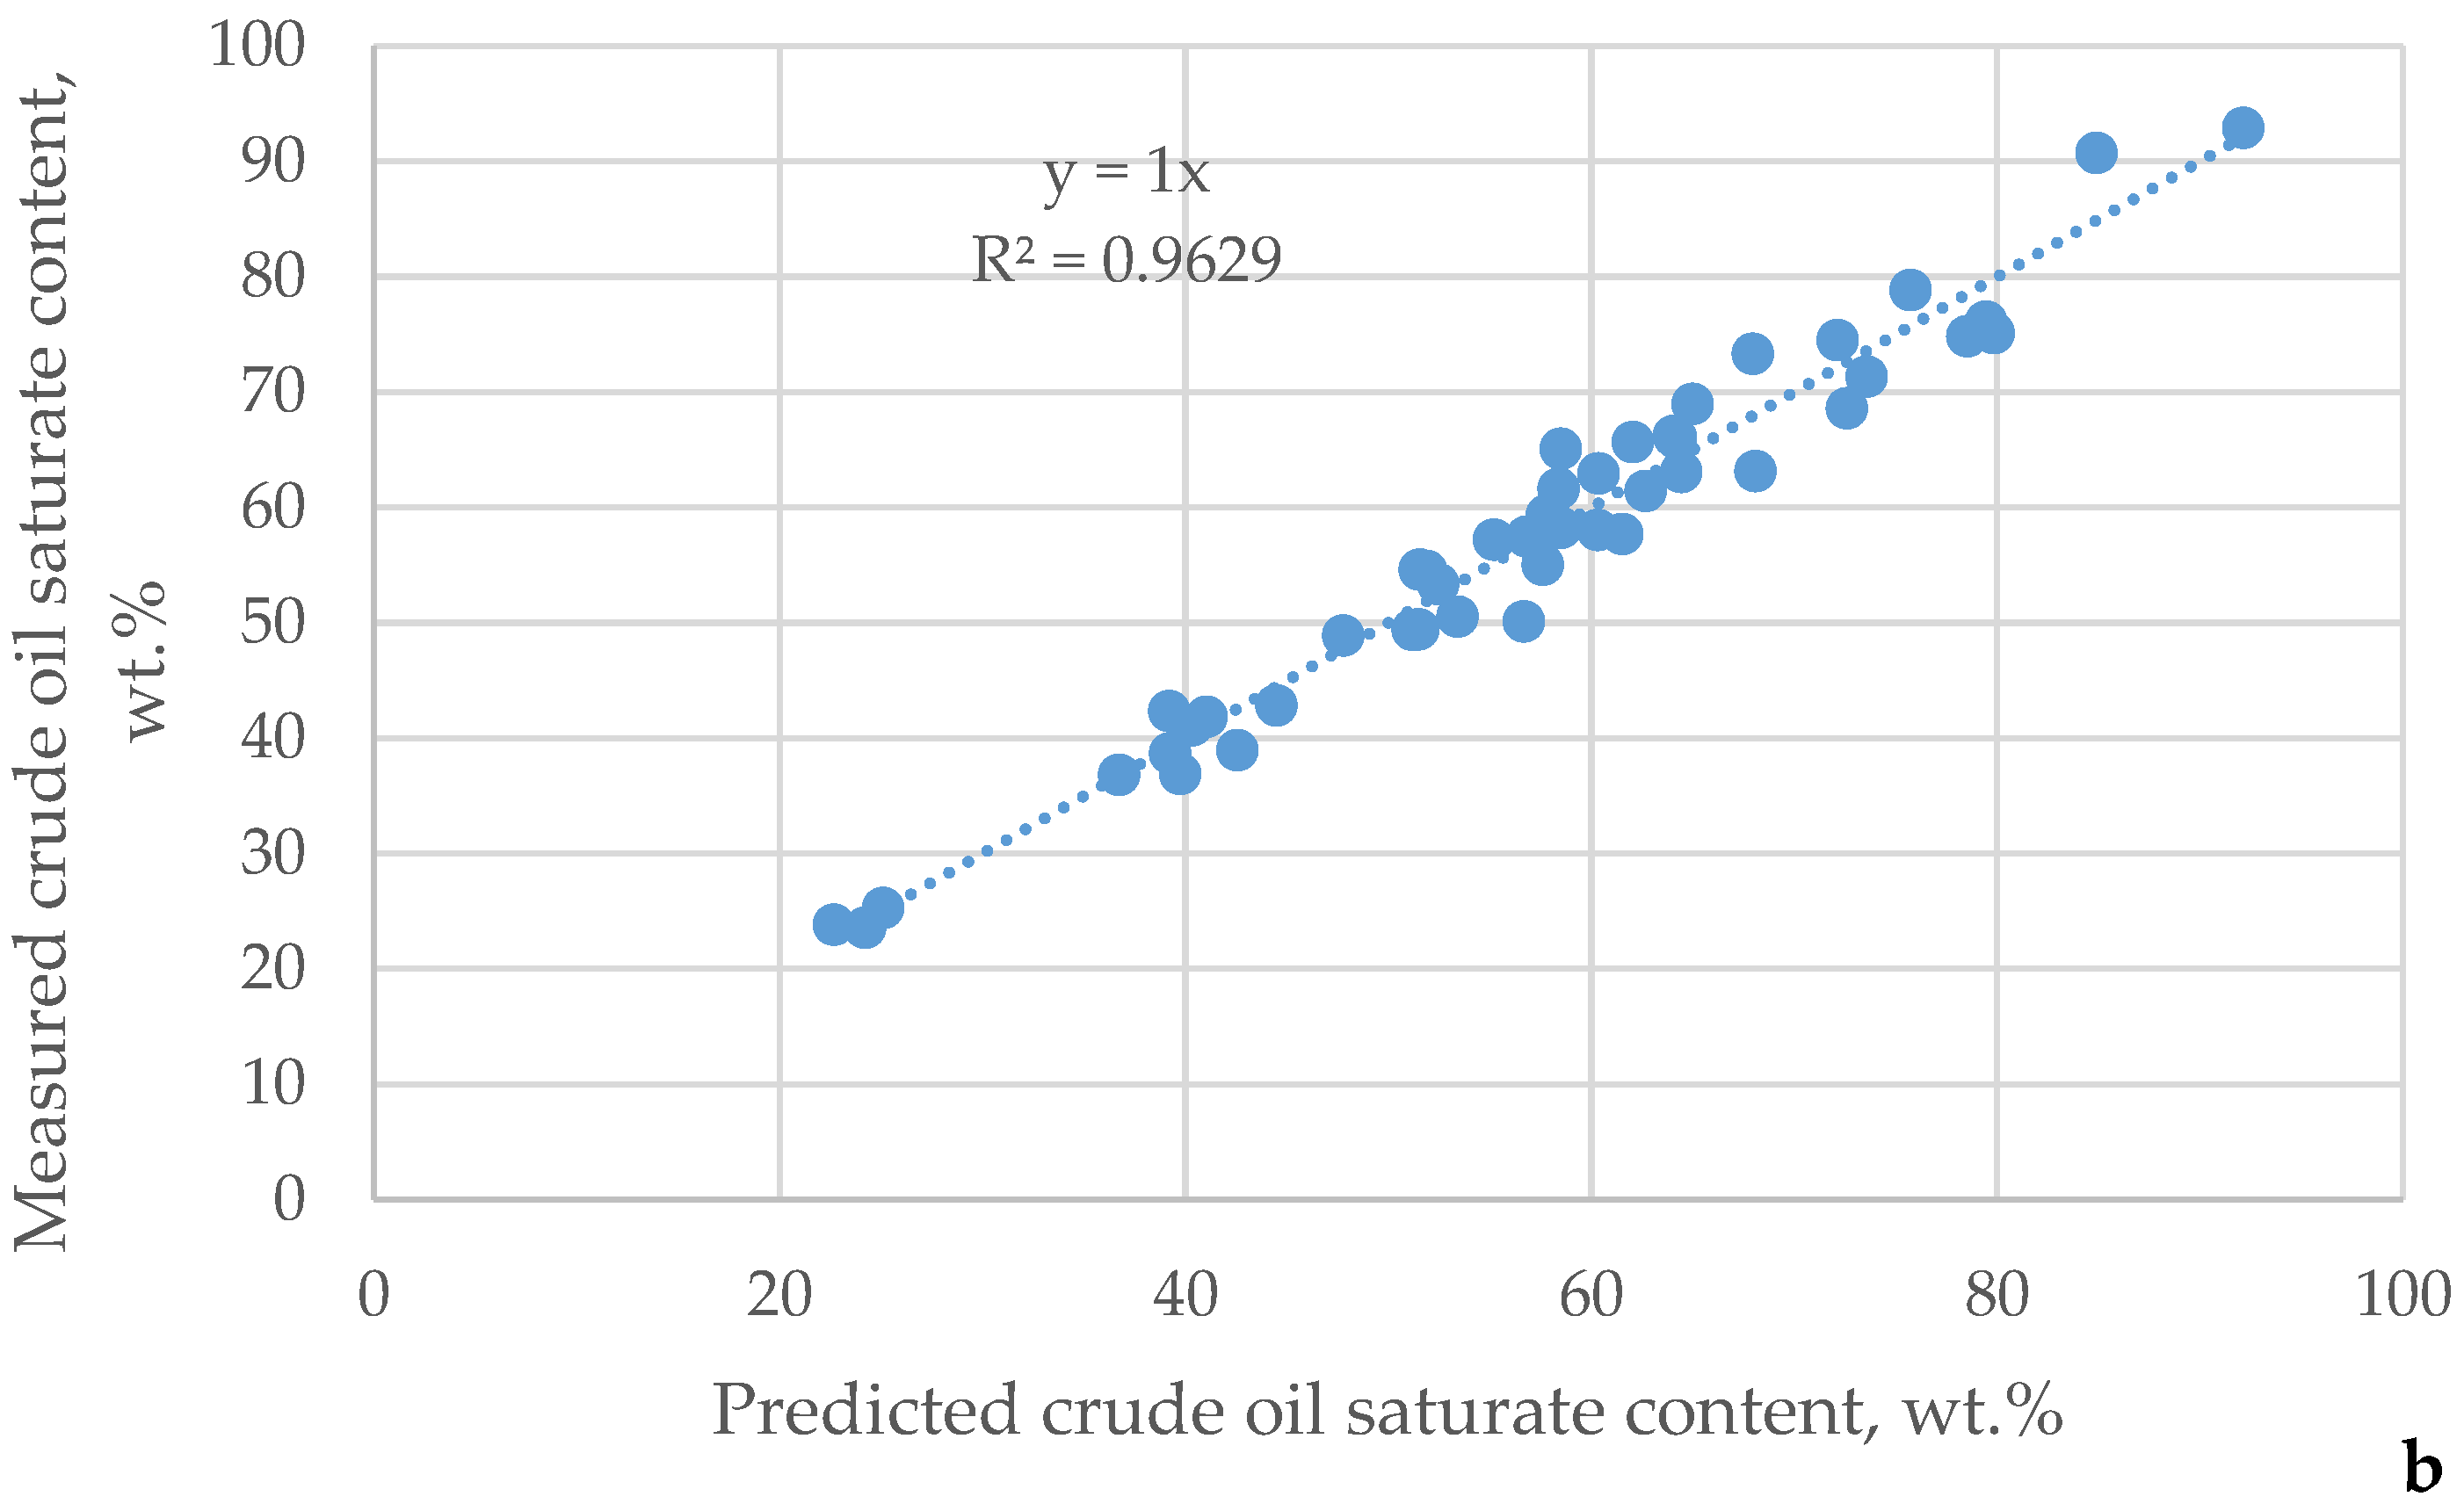
The average absolute deviation of Equation (11) was found to be 2.5 wt.%. The maximum absolute deviation was 6.6 wt.%. The bias was −0.01 wt.%. Figure 9 shows parity graphs of measured crude oil saturate content versus crude oil saturate content estimated with Equation (10) (Figure 9a) and Equation (11) (Figure 9b). The data in Figure 9 show that the new Equation (11) provided a lower prediction dispersion.

4. Discussion

The developed equations (Equations (3)–(8)) used to convert HTSD to TBP, as shown in Figure 2 and Figure 3, reasonably well-predicted the TBP yields and T50%. The data they generated were very well-described by the Riazi’s distribution model that allowed us to construct a full TBP curve from the HTSD data and specific gravity of each crude oil.
The direct juxtaposition of HTSD to TBP did not provide the satisfactory matching of HTSD with TBP. Despite the relatively good prediction of TBP curves via the simultaneously employment of Equations (3)–(8) with Equation (2) (Riazi’s distribution model), some crudes did not allow for the very accurate prediction of the lighter part of the TBP curve, as shown in Figure 5. This shortcoming could be overcome by simultaneously employing ASTM D7169 and ASTM D7900, as reported in [51]. HTSD was shown to be superior to physical vacuum distillation in our recent study [13], and it can be used to predict the TBP for heavy oils. HTSD is carried out over 40 min, while TBP analysis requires three days. However, the TBP analysis allows for the measurement of the specific gravity and sulphur content of narrow crude oil fractions, which (as shown in the previous section) are difficult to accurately predict from crude boiling point distributions. Therefore, the method developed in this work to build crude oil TBP curves from HTSD and crude specific gravity data can be used to control the quality of cargoes of known crude oils via a controlled crude assay. However, for crude oils that are not known, the use of TBP analysis along with specific gravity and sulphur content measurements of narrow fractions should be applied. The specific gravity of narrow fractions is a very useful characteristic that correlates with aromatic content, which is important for the evaluation of the cetane index of the middle distillates, and the crackability of heavy oil fractions. Thus, its correct determination affects the proper planning of yields in the conversion of oil-refining units. The sulphur content of narrow fractions is also an important characteristic when evaluations of HDS and sulphur recovery unit performance are performed. This can explain why TBP analysis is the best choice to characterize a new crude oil.
Regarding crude oil SARA analysis, the prediction of saturates was described by Yarranton [62] as a very important step in obtaining a full crude oil SARA composition. By predicting the saturate and asphaltene content of a vacuum residue with the method described in our recent research [63] and employing the relationship of vacuum residue asphaltene to crude oil asphaltene content determined in our previous study [23] and the relation between C5 and C7 asphaltenes established in [23], it is possible to simulate full crude oil SARA composition. Equation (11) (newly developed in this work), Equation (10), and the data of crude oil specific gravity and pour point can be used to obtain an average absolute deviation of 2.5 wt.%, maximum average deviation of 6.6 wt.%, and bias of −0.01 wt.% for 48 crude oils, while the method proposed by Yarranton showed an average absolute deviation of 2.7 wt.%, a maximum average deviation of 8.0 wt.%, and bias of −0.5 wt.% for 25 crude oils [62]. Therefore, our new method can be considered superior to the method of Yarranton [62]. The measurement of C5 and C7 asphaltenes enables the determination of C5 resins via the subtraction of C7 asphaltenes from C5 asphaltenes, and the aromatic content can be determined via the subtraction of saturate contents, C5 resins, and C7 asphaltenes from 100 wt.%.
The data in Table 5 and Table 6 indicate that viscosity was found to be significantly negatively related to saturates and positively related to specific gravity and vacuum residue content. These findings are in line with those observed in our recent studies on crude oil viscosity modelling [64,65].

5. Conclusions

HTSD, specific gravity, and the Riazi’s distribution model can be used to simulate the TBP of crude oils. For most studied crude oils, the TBP simulation from HTSD data, the correlations developed in this work, and Riazi’s distribution model showed satisfactory deviations within the uncertainty of TBP yield measurements according to the ASTM D2892 standard. For some crude oils, however, the lighter part of the TBP curve was predicted with a lower accuracy than that reported by the ASTM D2892 standard. This finding suggests that a combination of the ASTM D7169 and ASTM D7900 gas chromatographic methods could correctly simulate a whole crude oil TBP curve.
The concept of a constant Kw characterization factor was disproved in this study. The diverse crude oils exhibited distinct Kw factor distributions of narrow fractions that were difficult to predict from boiling point distribution and crude oil bulk properties. The same was found to be valid for the sulphur distribution of the narrow fractions of the different crude oils. While the degree of similarity of crude oils evaluated with ICrA based on the distillation characteristics could be high for some crude oils, those evaluated on the basis of the Kw characterization factor and sulphur distributions were not so high. The degree of similarity of the crude oils evaluated using ICrA based on the distillation characteristics differed from that evaluated on the basis of the Kw characterization factor and sulphur distributions. This suggests that the Kw characterization factor and sulphur distributions cannot be accurately predicted from distillation distribution data and crude oil bulk properties. Therefore, when accurate information about the density (Kw factor) and sulphur distribution of crude oil is needed, a TBP analysis is required.
Furthermore, crude oil saturate content can be predicted with a satisfactory accuracy with information about the density and pour point of crude oil.

Supplementary Materials

The following supporting information can be downloaded at: https://www.mdpi.com/article/10.3390/pr11020420/s1, Table S1: High-temperature simulated distillation of extra light, light medium, heavy, and extra heavy crude oils (boiling point at 1%); Table S2: High-temperature simulated distillation of extra light, light medium, heavy, and extra heavy crude oils (evaporates at 70, 110, 130, 150, 170, 180, 200, 220, 240, 260, 280, 300, 320, 340, 360, 380, 390, 430, 470, 490, and 540 °C); Table S3: True boiling point distillation of extra light, light medium, heavy, and extra heavy crude oils (evaporates at 70, 110, 130, 150, 170, 180, 200, 220, 240, 260, 280, 300, 320, 340, 360, 380, 390, 430, 470, 490, and 540 °C); Table S4: True boiling point distillation of extra light, light medium, heavy, and extra heavy crude oils (evaporates at 70, 110, 130, 150, 170, 180, 200, 220, 240, 260, 280, 300, 320, 340, 360, 380, 390, 430, 470, 490, and 540 °C) extracted from [48]; Table S5: High-temperature simulated distillation of extra light, light medium, heavy, and extra heavy crude oils (evaporates at 70, 110, 130, 150, 170, 180, 200, 220, 240, 260, 280, 300, 320, 340, 360, 380, 390, 430, 470, 490, and 540 °C) extracted from [37]; Table S6. Values of the parameters A and B from Riazi’s distribution model (Equation (2)) for the studied crude oils estimated using the distillation data; Table S7: Kw characterization factor of narrow fractions of 30 studied crude oils; Table S8: Sulphur content of TBP crude fractions of extra light, light, medium, and heavy crude oils; Table S9: SARA analysis data and bulk properties of extra light, light medium, heavy, and extra heavy crude oils.

Author Contributions

Conceptualization, D.S. and I.S.; methodology, R.D.; software, S.N., D.D.S. and S.R.; validation, S.S. (Sotir Sotirov), E.S. and S.S. (Stanislav Simeonov); formal analysis, D.P.; investigation, M.T., G.N.P. and V.B.; resources, K.A.; data curation, R.D.; writing—original draft preparation, D.S.; writing—review and editing, D.S.; visualization, G.N.P.; supervision, K.A.; project administration, K.A.; funding acquisition, S.S. (Sotir Sotirov). All authors have read and agreed to the published version of the manuscript.

Funding

This research received no external funding.

Data Availability Statement

Not applicable.

Acknowledgments

The authors Krassimir Atanassov and Simeon Ribagin acknowledge support from the Bulgarian National Science Fund under Grant Ref. No. KP-06-N22-1/2018 “Theoretical research and applications of InterCriteria Analysis”.

Conflicts of Interest

The authors declare no conflict of interest.

Nomenclature

APIAmerican Petroleum Institute gravity
AroAromatics
AsAsphaltenes
ASTMAmerican Society for Testing and Materials
FIDFlame ionization detector
GCGas chromatography
HPHewlett Packard
HPLCHigh-performance liquid chromatography
HTSDHigh-temperature simulated distillation
IBPInitial boiling point
ICrAIntercriteria analysis
KwWatson characterization factor
PIANOParaffins, iso-paraffins, aromatics, naphthenes, and olefins
PONAParaffins, olefins, naphthenes, and aromatics
PPPour point
SARASaturates, aromatics, resins, asphaltenes
Sat.saturates
SGSpecific gravity
SlopeSlope in Walther equation [65] for double logarithm dependence on logarithm of temperature
T0Boiling point at zero yield of distillate
TBPTrue boiling point
TiBoiling point of i-weight fraction of distillation curve
TLCThin-layer chromatography
VISKinematic viscosity
VRVacuum residue
xiWeight fraction of i-component.

References

  1. Liu, Y.; Chang, A.; Pashikanti, K. Petroleum Refinery Process Modeling: Integrated Optimization Tools and Applications; Wiley-VCH Verlag & Co. KGaA: Weinheim, Germany, 2018. [Google Scholar]
  2. Gao, C. Petroleum Production Technology; Science Press: Beijing, China, 2017. [Google Scholar]
  3. Hsu, C.S.; Robinson, P.R. Petroleum Science and Technology; Springer: Berlin/Heidelberg, Germany, 2019. [Google Scholar]
  4. Kaiser, M.J.; De Klerk, A.; Gary, J.H.; Handwerk, G.E. Petroleum Refining. Technology, Economics, and Markets, 6th ed.; CRC Press: Boca Raton, FL, USA, 2020. [Google Scholar]
  5. Lopes, M.S.; Savioli Lopes, M.; Maciel Filho, R.; Wolf Maciel, M.R.; Medina, L.C. Extension of the TBP curve of petroleum using the correlation DESTMOL. Procedia Eng. 2012, 42, 726–732. [Google Scholar] [CrossRef] [Green Version]
  6. Chapter 5. Heptanes Plus Characterization. Available online: http://www.ipt.ntnu.no/~curtis/courses/PVT-Flow/Plus-Characterization/Molar-Distribution/SPE-Phase-Behavior-Monograph-Ch-5.pdf (accessed on 23 December 2022).
  7. Riazi, M.R. Characterization and Properties of Petroleum Fractions; ASTM International: West Conshohocken, PA, USA, 2007. [Google Scholar]
  8. Speight, J. Rules of Thumb for Petroleum Engineers; John Wiley & Sons, Inc.: Hoboken, NJ, USA, 2017. [Google Scholar]
  9. Stratiev, D.S.; Marinov, I.; Nedelchev, A.; Velkov, I.; Stratiev, D.D.; Veli, A.; Mitkova, M.; Stanulov, K. Evaluation of approaches for conversion of ASTM into TBP distillation data of oil fractions. OGEM 2014, 40, 216–221. [Google Scholar]
  10. Villalanti, D.C.; Raia, J.C.; Maynard, J.B. High-temperature simulated distillation applications in petroleum characterization. In Encyclopedia of Analytical Chemistry; John Wiley & Sons, Ltd.: Hoboken, NJ, USA, 2006. [Google Scholar]
  11. ASTM D2892-20; Standard Test Method for Distillation of Crude Petroleum (15-Theoretical Plate Column). ASTM International: West Conshohocken, PA, USA, 2020.
  12. ASTM D5236-18a; Standard Test Method for Distillation of Heavy Hydrocarbon Mixtures (Vacuum Potstill Method). ASTM International: West Conshohocken, PA, USA, 2018.
  13. Stratiev, D.; Shishkova, I.; Ivanov, M.; Dinkov, R.; Argirov, G.; Vasilev, S.; Yordanov, D. Validation of diesel fraction content in heavy oils measured by high temperature simulated distillation and physical vacuum distillation by performance of commercial distillation test and process simulation. Appl. Sci. 2022, 12, 11824. [Google Scholar] [CrossRef]
  14. Durand, J.-P.; Bré, A.; Béboulène, J.-J.; Ducrozet, A.; Carbonneaux, S. Improvement of simulated distillation methods by gas chromatography in routine analysis. Oil Gas Sci. Technol. 1999, 54, 431–438. [Google Scholar] [CrossRef]
  15. Characterization of Crude Oil by Simulated Distillation. Patent WO2016111965A1, 14 July 2016.
  16. Diaz, O.C.; Yarranton, H.W. Applicability of simulated distillation for heavy Oils. Energy Fuels 2019, 33, 6083–6087. [Google Scholar] [CrossRef]
  17. Villalanti, D.C.; Raia, J.C.; Subramanian, M.; Williams, B. Application of high-temperature simulated distillation to the residuum oil supercritical extraction process in petroleum refining. J. Chromatogr. Sci. 2000, 38, 1–5. [Google Scholar]
  18. Jennerwein, M.K.; Eschner, M.S.; Wilharm, T.; Zimmermann, R.; Gröger, T.M. Proof of concept of high-temperature comprehensive two-dimensional gas chromatography time-of-flight mass spectrometry for two-dimensional simulated distillation of crude oils. Energy Fuels 2017, 31, 11651–11659. [Google Scholar] [CrossRef]
  19. Espinosa-Pena, M.; Figueroa-Gomez, Y.; Jimenez-Cruz, F. Simulated distillation yield curves in heavy crude oils: A comparison of precision between ASTM D-5307 and ASTM D-2892 physical distillation. Energy Fuels 2004, 18, 1832–1840. [Google Scholar] [CrossRef]
  20. Rodrigues, E.V.A.; Silva, S.R.C.; Romão, W.; Castro, E.V.R.; Filgueiras, P.R. Determination of crude oil physicochemical properties by high-temperature gas chromatography associated with multivariate calibration. Fuel 2018, 220, 389–395. [Google Scholar] [CrossRef]
  21. Coutinho, D.M.; França, D.; Vanini, G.; Gomes, A.O.; Azevedo, D.A. Understanding the molecular composition of petroleum and its distillation cuts. Fuel 2022, 311, 122594. [Google Scholar] [CrossRef]
  22. Azinfar, B.; Zirrahi, M.; Hassanzadeh, H.; Abedi, J. Characterization of heavy crude oils and residues using combined Gel Permeation Chromatography and simulated distillation. Fuel 2018, 233, 885–893. [Google Scholar] [CrossRef]
  23. Shishkova, I.; Stratiev, D.; Kolev, I.V.; Nenov, S.; Nedanovski, D.; Atanassov, K.; Ivanov, V.; Ribagin, S. Challenges in petroleum characterization—A review. Energies 2022, 15, 7765. [Google Scholar] [CrossRef]
  24. Abutaqiya, M.I.L.; Sisco, C.J.; Khemka, Y.; Safa, M.A.; Ghloum, E.F.; Rashed, A.M.; Gharbi, R.; Santhanagopalan, S.; Al-Qahtani, M.; Al-Kandari, E.; et al. Accurate Modeling of Asphaltene Onset Pressure in Crude Oils Under Gas Injection Using Peng−Robinson Equation of State. Energy Fuels 2020, 34, 4055–4070. [Google Scholar] [CrossRef]
  25. David Ting, P.; Hirasaki, G.J.; Chapman, W.G. Modeling of Asphaltene Phase Behavior with the SAFT Equation of State. Pet. Sci. Technol. 2003, 21, 647–661. [Google Scholar] [CrossRef]
  26. Panuganti, S.R.; Vargas, F.M.; Gonzalez, D.L.; Kurup, A.S.; Chapman, W.G. PC-SAFT characterization of crude oils and modeling of asphaltene phase behavior. Fuel 2012, 93, 658–669. [Google Scholar] [CrossRef]
  27. Punnapala, S.; Vargas, F.M. Revisiting the PC-SAFT characterization procedure for an improved asphaltene precipitation prediction. Fuel 2013, 108, 417–429. [Google Scholar] [CrossRef]
  28. Abutaqiya, M.I.L.; Sisco, C.J.; Wang, J.; Vargas, F.M. Systematic Investigation of Asphaltene Deposition in the Wellbore and Near-Wellbore Region of a Deepwater Oil Reservoir Under Gas Injection. Part 1: Thermodynamic Modeling of the Phase Behavior of Polydisperse Asphaltenes. Energy Fuels 2019, 33, 3632–3644. [Google Scholar] [CrossRef]
  29. Sisco, C.J.; Abutaqiya, M.I.L.; Wang, F.; Zhang, J.; Tavakkoli, M.; Vargas, F.M. Asphaltene Precipitation Modeling. In Asphaltene Deposition: Fundamentals, Prediction, Prevention, and Remediation, 1st ed.; CRC Press: Boca Raton, FL, USA, 2018; pp. 111–159. [Google Scholar]
  30. Klein, G.C.; Angström, A.; Rodgers, R.P.; Marshall, A.G. Use of saturates/aromatics/resins/asphaltenes (SARA) fractionation to determine matrix effects in crude oil analysis by electrospray ionization fourier transform ion cyclotron resonance mass spectrometry. Energy Fuels 2006, 20, 668–672. [Google Scholar] [CrossRef]
  31. Efimov, I.; Povarov, V.G.; Rudko, V.A. Comparison of UNIFAC and LSER models for calculating partition coefficients in the hexane–acetonitrile system using middle distillate petroleum products as an example. Ind. Eng. Chem. Res. 2022, 61, 9575–9585. [Google Scholar] [CrossRef]
  32. Efimov, I.; Povarov, V.G.; Rudko, V.A. Use of partition coefficients in a hexane–acetonitrile system in the GC–MS analysis of polyaromatic hydrocarbons in the example of delayed coking gas oils. ACS Omega 2021, 6, 9910–9919. [Google Scholar] [CrossRef]
  33. Benassi, M.; Berisha, A.; Romão, W.; Babayev, E.; Römpp, A.; Spengler, B. Petroleum crude oil analysis using low-temperature plasma mass spectrometry. Rapid Commun. Mass Spectrom. 2013, 27, 825–834. [Google Scholar] [CrossRef]
  34. Rakhmatullin, I.; Efimov, S.; Tyurin, V.; Gafurov, M.; Al-Muntaser, A.; Varfolomeev, M.; Klochkov, V. Qualitative and quantitative analysis of heavy crude oil samples and their sara fractions with 13C nuclear magnetic resonance. Processes 2020, 8, 995. [Google Scholar] [CrossRef]
  35. Afanasjeva, N.; González-Córdoba, A.; Palencia, M. Mechanistic approach to thermal production of new materials from asphaltenes of Castilla crude oil. Processes 2020, 8, 1644. [Google Scholar] [CrossRef]
  36. Zheng, F.; Shi, Q.; Vallverdu, G.S.; Giusti, P.; Bouyssiere, B. Fractionation and characterization of petroleum asphaltene: Focus on metalopetroleomics. Processes 2020, 8, 1504. [Google Scholar] [CrossRef]
  37. ASTM D4052-18a; Standard Test Method for Density, Relative Density, and API Gravity of Liquids by Digital Density Meter. ASTM International: West Conshohocken, PA, USA, 2018.
  38. ASTM D4294-21; Standard Test Method for Sulfur in Petroleum and Petroleum Products by Energy Dispersive X-ray Fluorescence Spectrometr. ASTM International: West Conshohocken, PA, USA, 2021.
  39. ASTM D97-12; Standard Test Method for Pour Point of Petroleum Products. ASTM International: West Conshohocken, PA, USA, 2015.
  40. ASTM D445-21e2; Standard Test Method for Kinematic Viscosity of Transparent and Opaque Liquids (and Calculation of Dynamic Viscosity). ASTM International: West Conshohocken, PA, USA, 2021.
  41. Stratiev, D.; Shishkova, I.; Nikolova, R.; Tsaneva, T.; Mitkova, M.; Yordanov, D. Investigation on precision of determination of SARA analysis of vacuum residual oils from different origin. Pet Coal. 2016, 58, 109–119. [Google Scholar]
  42. Stratiev, D.; Shishkova, I.; Tsaneva, T.; Mitkova, M.; Yordanov, D. Investigation of relations between properties of vacuum residual oils from different origin, and of their deasphalted and asphaltene fractions. Fuel 2016, 170, 115–129. [Google Scholar] [CrossRef]
  43. Atanassov, K.; Mavrov, D.; Atanassova, V. Intercriteria decision making: A new approach for multicriteria decision making, based on index matrices and intuitionistic fuzzy sets. Issues Intuit. Fuzzy Sets Gen. Nets 2014, 11, 1–8. [Google Scholar]
  44. Atanassov, K.; Atanassova, V.; Gluhchev, G. Intercriteria analysis: Ideas and problems. Notes Intuit. Fuzzy Sets 2015, 21, 81–88. [Google Scholar]
  45. Atanassov, K. Index Matrices: Towards an Augmented Matrix Calculus; Springer: Berlin/Heidelberg, Germany, 2014. [Google Scholar]
  46. Stratiev, D.S.; Sotirov, S.; Shishkova, I.; Nedelchev, A.; Sharafutdinov, I.; Anife, V.; Mitkova, M.; Yordanov, D.; Sotirova, E.; Atanassova, K.; et al. Investigation of relationships between bulk properties and fraction properties of crude oils by application of the Intercriteria analysis. Petrol. Sci. Technol. 2016, 34, 1113–1120. [Google Scholar] [CrossRef]
  47. Stratiev, D.; Shishkova, I.; Nedelchev, A.; Kirilov, K.; Nikolaychuk, E.; Ivanov, A.; Sharafutdinov, I.; Veli, A.; Mitkova, M.; Tsaneva, T.; et al. Investigation of relationships between petroleum properties and their impact on crude oil compatibility. Energy Fuels 2015, 29, 7836–7854. [Google Scholar] [CrossRef]
  48. Stratiev, D.; Nenov, S.; Shishkova, I.; Georgiev, B.; Argirov, G.; Dinkov, R.; Yordanov, D.; Atanassova, V.; Vassilev, P.; Atanassov, K. Commercial investigation of the ebullated-bed vacuum residue hydrocracking in the conversion range of 55–93%. ACS Omega 2020, 51, 33290. [Google Scholar] [CrossRef] [PubMed]
  49. Stratiev, D.; Shishkova, I.; Dinkov, R.; Kolev, I.; Argirov, G.; Ivanov, V.; Ribagin, S.; Atanassova, V.; Atanassov, K.; Stratiev, D.D.; et al. Intercriteria analysis to diagnose the reasons for increased fouling in a commercial ebullated bed vacuum residue hydrocracker. ACS Omega 2022, 7, 30462–30476. [Google Scholar] [CrossRef] [PubMed]
  50. ASTM D7169-20; Standard Test Method for Boiling Point Distribution of Samples with Residues Such as Crude Oils and Atmospheric and Vacuum Residues by High Temperature Gas Chromatography. ASTM International: West Conshohocken, PA, USA, 2020.
  51. Combining Simulated Distillation (ASTM D7169) and Detailed Hydrocarbon Analysis (ASTM D7900) for the Full Boiling Point Distribution of Crude Oils. Available online: https://www.petro-online.com/article/analytical-instrumentation/11/scion-instruments/combining-simulated-distillation-astm-d7169-and-detailed-hydrocarbon-analysis-astm-d7900-for-the-full-boiling-point-distribution-of-crude-oils/2943 (accessed on 4 January 2023).
  52. Golden, S.; Barletta, T.; White, S. Vacuum unit performance. Sour Heavy 2012, 11–15. Available online: www.digitalrefining.com/article/1000565 (accessed on 5 January 2023).
  53. Golden, S.; Barletta, T. Designing vacuum units. PTQ 2006, Q2, 105–110. [Google Scholar]
  54. Golden, S.; Villalanti, D.C.; Martin, G.R. Feed characterization and deep cut vacuum columns: Simulation and design. In Proceedings of the AIChE 1994, Spring National Meeting, Atlanta, GA, USA, 17–21 April 1994. [Google Scholar]
  55. He, P.; Ghoniem, A.F. A Group contribution pseudocomponent method for phase equilibrium modeling of mixtures of petroleum fluids and a solvent. Ind. Eng. Chem. Res. 2015, 54, 8809–8820. [Google Scholar] [CrossRef]
  56. Mlquel, J.; Hernandez, J.; Castells, F. A New method for petroleum fractions and crude oil characterization. SPE Reserv. Eng. 1992, 7, 265–270. [Google Scholar]
  57. Wauquier, J.-P. Crude Oil Petroleum Products. Process Flowsheets; Editions Technip: Paris, France, 1995. [Google Scholar]
  58. Abdel-AalMohammed, H.K.; Alsahlawi, A. Petroleum Economics and Engineering, 3rd ed.; Taylor & Francis Group: Abingdon, UK, 2014. [Google Scholar]
  59. Gary, J.H.; Handwerk, G.E.; Kaiser, M.J. Petroleum Refining Technology and Economics, 5th ed.; CRC Press: Boca Raton, FL, USA; Taylor & Francis Group: Abingdon, UK, 2007. [Google Scholar]
  60. Swafford, P.; McCarthy, R. Improving crude oil selection. PTQ 2008, Q3, 125–129. [Google Scholar]
  61. Stratiev, D.; Shishkova, I.; Palichev, G.N.; Atanassov, K.; Ribagin, S.; Nenov, S.; Nedanovski, D.; Ivanov, V. Study of bulk properties relations to SARA Composition data of various vacuum residues employing intercriteria analysis. Energies 2022, 15, 9042. [Google Scholar] [CrossRef]
  62. Yarranton, H. Prediction of crude oil saturate content from a simdist assay. Energy Fuels 2022, 36, 8809–8817. [Google Scholar] [CrossRef]
  63. Stratiev, D.; Nenov, S.; Nedanovski, D.; Shishkova, I.; Dinkov, R.; Stratiev, D.D.; Stratiev, D.D.; Sotirov, S.; Sotirova, E.; Atanassova, V.; et al. Empirical modeling of viscosities and softening points of straight-run vacuum residues from different origins and of hydrocracked unconverted vacuum residues obtained in different conversions. Energies 2022, 15, 1755. [Google Scholar] [CrossRef]
  64. Stratiev, D.; Nenov, S.; Sotirov, S.; Shishkova, I.; Palichev, G.; Sotirova, E.; Ivanov, V.; Atanassov, K.; Ribagin, S.; Angelova, N. Petroleum viscosity modeling using least squares and ANN methods. J. Pet. Sci. Eng. 2022, 212, 110306. [Google Scholar] [CrossRef]
  65. Stratiev, D.; Shishkova, I.; Dinkov, R.; Nenov, S.; Sotirov, S.; Sotirova, E.; Kolev, I.; Ivanov, V.; Ribagin, S.; Atanassov, K.; et al. Prediction of petroleum viscosity from molecular weight and density. Fuel 2023, 331, 125679. [Google Scholar] [CrossRef]
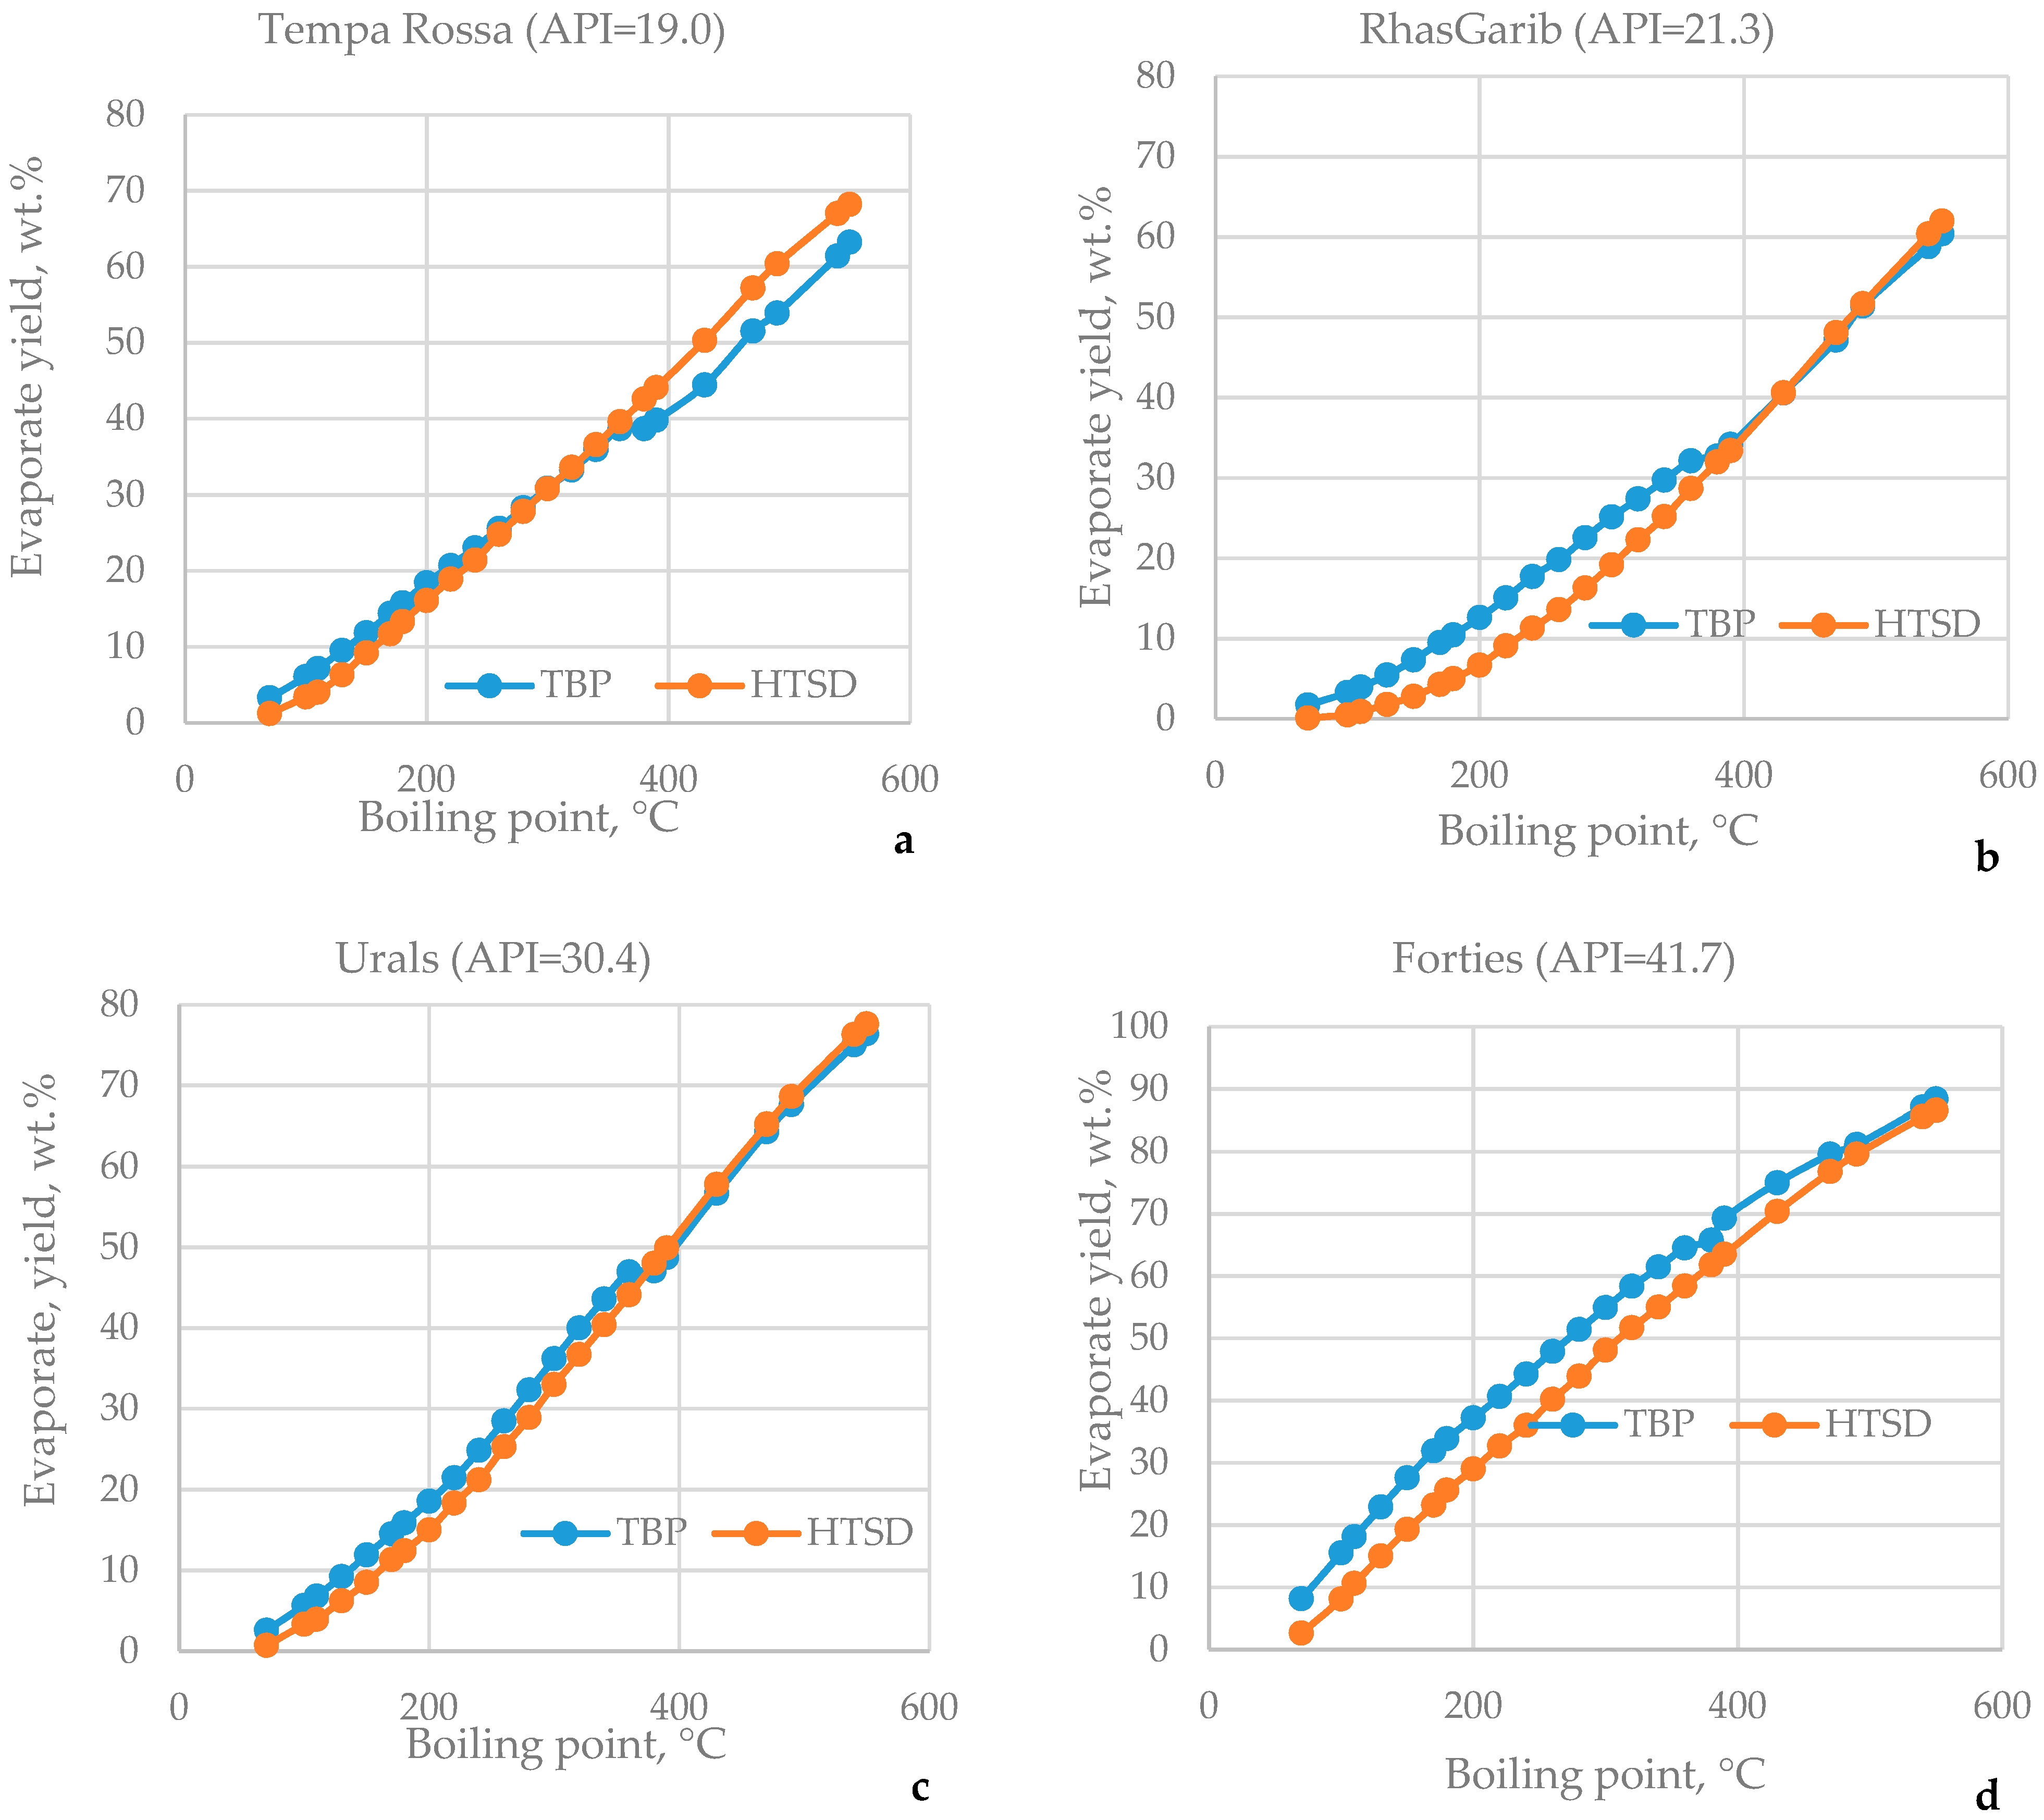
Figure 1. TBP and HTSD curves of extra light (d,e), light (f), medium (b,c), and heavy (a) crude oils.
Processes 11 00420 g001aProcesses 11 00420 g001b
Figure 2. Juxtaposition of the TBP with HTSD yields of the 110–180 °C (a), 180–240 °C (b), and 240–360 °C (c) fractions; the estimated TBP yields according to Equation (3) (d), Equation (4) (e), and Equation (5) (f).
Processes 11 00420 g002aProcesses 11 00420 g002b
Figure 3. Juxtaposition of the TBP with the HTSD yields of the IBP—360 °C (a), IBP—540 °C (b), and T50% (TBP versus HTSD) (c) fractions; the estimated TBP yields according to Equation (6) (d) and Equation (7) (e); the estimated TBP T50% according to Equation (8) (f).
Processes 11 00420 g003aProcesses 11 00420 g003b
Figure 4. TBP curves of extra light (d,e), light (f), medium (b,c), and heavy (a) crude oils simulated with Equations (3)–(8) and Riazi’s distribution model (Equation (2)).
Processes 11 00420 g004
Figure 5. TBP curves of Oryx (a) and South Green Canyon (b) crude oils simulated with Equations (3)–(8) and Riazi’s distribution model (Equation (2)).
Processes 11 00420 g005
Figure 6. Kw characterization factor of narrow fraction distributions and the whole crude oil Kw characterization factor for the different crude oils studied in this work (ad).
Processes 11 00420 g006
Figure 7. Distribution of sulphur in the boiling point range of some of the studied crude oils (a,b).
Processes 11 00420 g007
Figure 8. Relation of crude oil saturate content to specific gravity.
Processes 11 00420 g008
Figure 9. Parity graphs of measured crude oil saturate content versus crude oil saturate content predicted with Equation (10) (a) and Equation (11) (b).
Processes 11 00420 g009aProcesses 11 00420 g009b
Table 1. Degree of similarity between some of the investigated crude oils determined based on the application of intercriteria analysis and Kw factor variation through the whole boiling range of the crude oils.
μUralsArab MArab HVald’AgriBasrah LBasrah HKirkukIranian HKEBEl Bouri
Urals10.56280.57140.43720.54110.45020.60170.74890.55410.8398
Arab M0.562810.710.76190.79650.70130.82680.70560.76190.5671
Arab H0.57140.7110.80520.84850.86580.78790.61040.73590.5628
Vald’Agri0.43720.76190.805210.87010.83120.79650.60610.6970.4632
Basrah L0.54110.79650.84850.870110.80950.87010.6580.77490.5455
Basrah H0.45020.70130.86580.83120.809510.75760.54980.74460.4719
Kirkuk0.60170.82680.78790.79650.87010.757610.72730.78350.5844
Iranian H0.74890.70560.61040.60610.6580.54980.727310.67970.7619
KEB0.55410.76190.73590.6970.77490.74460.78350.679710.5671
El Bouri0.83980.56710.56280.46320.54550.47190.58440.76190.56711
Kazakh0.89610.55840.57580.45450.54980.47190.60610.74890.61040.7965
CPC0.78350.50650.42420.39390.49780.3550.52380.68830.53250.7532
LSCO0.87010.51950.47190.38960.49780.37660.54550.68830.51520.7922
Rhem.0.75760.42860.38960.32030.42860.30740.47190.60610.48050.7013
Prinos0.55410.59740.54550.62770.65370.59740.63640.63640.59310.5411
Azeri L0.71860.41130.3290.290.38960.25970.41990.62770.43720.7056
SGC0.6970.53680.54110.49350.59310.45450.6190.72730.54550.71
Oryx0.41990.68830.79220.83980.77060.86580.72290.51520.6840.4242
Okwuib0.65370.68830.82680.6580.73590.71860.72730.66670.74030.6494
RasGharib0.83550.61470.6320.51520.59740.53680.65370.72730.6450.8139
Varandey0.74030.47620.39390.34630.42420.28570.46320.66670.47620.7446
Arab L0.54980.74460.84420.81820.84420.81390.82680.6450.76190.5541
Tempa Rossa0.38530.6710.78350.81820.71430.84850.66670.47620.6450.3896
Note: Green color denotes statistically meaningful positive relation; red color denotes statistically meaningful negative relation. The intensity of the color designates the strength of the relation. The higher the color intensity, the higher the strength of the relation. Yellow color denotes dissonance.
Table 2. Degree of similarity between some of the investigated crude oils determined based on the application of intercriteria analysis and HTSD data, total sulphur content, and crude oil specific gravity.
μTempa RossaForties Kuwait LightArabian lightKumkolArabian HeavyAlban CrudeRas Gharib
Tempa Rossa10.82610.38520.9160.60250.96830.97170.9076
Forties 0.826110.41680.78990.47250.82550.8050.7588
Kuwait Light0.38520.416810.44010.57450.38540.39080.3908
Arabian light0.9160.78990.440110.6560.9230.91150.8863
Kumkol0.60250.47250.57450.6560.97650.62210.61120.6711
Arabian heavy0.96830.82550.38540.9230.622110.95070.9092
Alban crude0.97170.8050.39080.91150.61120.950710.8992
Ras Gharib0.90760.75880.39080.88630.67110.90920.89921
Boscan0.00340.10060.0120.01040.0210.01570.00080.0381
Aseng0.22970.14480.56050.30.54990.24430.23890.2793
El Sharara0.41260.34850.77590.48490.69940.4280.42020.4619
Helm C.O.0.51650.46670.79160.58740.66610.52770.5230.5759
Arab Medium0.96830.82550.39660.92720.60870.96360.95490.9028
Azeri light0.50110.43220.79520.55240.73750.49830.50280.5095
Basrah Light0.95490.82770.39050.91370.61570.95880.94650.9017
Bozachi0.45550.45830.81650.53250.62490.47450.46670.523
Cheleken0.25210.26860.79410.32180.58990.26440.25690.3112
CPC0.14030.1880.72460.20840.49360.15320.14370.2034
El Bouri0.85910.73250.46750.87310.7090.86750.8510.851
Kazakh0.29920.21230.66690.37250.65550.31570.31230.3745
Kirkuk0.96690.83050.40.92580.60390.95940.9490.8947
Kuwait Export Blend0.96950.83220.38150.91510.60310.9630.94760.9039
Okwibome0.10060.09330.60530.16160.4190.10140.11120.1367
Oryx0.98630.830.37840.92160.60590.97560.96640.9134
Urals0.86050.73870.46720.88740.67620.86950.85880.8454
Rhemoura0.90140.80620.42970.88630.59410.89360.8980.8723
Sib. Light0.54760.45850.70730.61850.82160.56270.55010.6123
South Green Canyon0.970.81850.36720.91090.61680.97370.94850.9283
Prinos0.95970.80280.40640.92210.62460.94430.95740.9154
ValD’Agri0.59660.56950.69190.61990.50530.58350.59830.5745
Note: Green color denotes statistically meaningful positive relation; red color denotes statistically meaningful negative relation. The intensity of the color designates the strength of the relation. The higher the color intensity, the higher the strength of the relation. Yellow color denotes dissonance.
Table 3. Degree of similarity between some of the investigated crude oils determined based on the application of intercriteria analysis and sulphur content variation through the whole crude oil boiling range.
μUralsArab MArab HVald’AgriBasrah LBasrah HKirkukIranian HKEBEl Bouri
Urals10.63240.4980.55730.51380.45850.56130.60470.54940.4269
Arab M0.632410.84980.90910.8340.77870.88930.94070.90910.7628
Arab H0.4980.849810.88540.8340.87350.87350.86170.9170.8656
Vald’Agri0.55730.90910.885410.86960.82210.89330.90510.92890.7826
Basrah L0.51380.8340.8340.869610.89720.92090.84580.85380.7549
Basrah H0.45850.77870.87350.82210.897210.85770.79840.83790.7945
Kirkuk0.56130.88930.87350.89330.92090.857710.9170.90910.7708
Iranian H0.60470.94070.86170.90510.84580.79840.91710.90510.751
KEB0.54940.90910.9170.92890.85380.83790.90910.905110.8063
El Bouri0.42690.76280.86560.78260.75490.79450.77080.7510.80631
Kazakh0.68380.71150.62450.65610.62060.55340.6640.70360.67980.5455
CPC0.80630.45450.34390.39530.39920.35970.42290.45060.38740.3281
LSCO0.81420.71540.62060.6640.62850.54940.69170.71150.6640.5099
Rhem.0.75490.77470.6640.71540.65610.59290.72730.77080.73120.5613
Prinos0.82610.56920.46250.51780.47830.43080.54940.5850.51780.4032
Azeri L0.62850.30040.18180.23320.18180.12650.24510.29640.2490.2055
SGC0.69570.87350.79450.81420.75490.72330.8340.86960.82210.6838
Oryx0.4190.76280.89720.81420.85380.89330.83790.77870.83790.7866
Okwuib0.56520.22920.11070.16210.12650.07910.1660.21740.170.2055
RasGharib0.30040.32020.40710.35570.39130.46250.36760.32410.35570.4941
Varandey0.68380.51380.40320.44660.46640.45060.4980.48620.44660.4506
Arab L0.70750.86170.73520.81820.73520.65610.79050.84190.78660.6245
KBT0.56520.84580.80630.85770.88540.79840.92490.85770.84980.7036
Tempa Rossa0.01580.22130.32410.27270.32020.36760.28850.23320.27270.3281
Note: Green color denotes statistically meaningful positive relation; red color denotes statistically meaningful negative relation. The intensity of the color designates the strength of the relation. The higher the color intensity, the higher the strength of the relation. Yellow color denotes dissonance.
Table 4. Range of variations in the SARA composition and bulk properties of the studied crude oils.
Sat, wt.%Aro, wt.%Resins, wt.%As, wt.%SGSulphur, wt.%VR Yield, wt.%Pour Point, °CVIS at 40 °C, mm2/sSlopeKw
min23.57.10.00.10.7820.031.4−45.60.92.911.33
max92.962.17.722.21.0025.6460.737.819430.05.212.67
Table 5. μ-value of the ICrA evaluation of relations between crude oil SARA composition data and bulk properties.
μSatAroResinsAsSGSulphurVR YieldPPVIS
Sat10.16870.14040.17270.06770.15250.1010.46670.1283
Aro0.168710.75350.75660.77270.77070.76260.45150.7646
Resins0.14040.753510.82020.7970.83940.82120.45660.7889
As0.17270.75660.820210.78280.82730.80810.45960.7475
SG0.06770.77270.7970.782810.79190.90.48790.8626
Sulphur0.15250.77070.83940.82730.791910.82420.4040.7778
VR yield0.1010.76260.82120.80810.90.824210.50810.9091
PP0.46670.45150.45660.45960.48790.4040.508110.5141
VIS0.12830.76460.78890.74750.86260.77780.90910.51411
Note: Green color denotes statistically meaningful positive relation; red color denotes statistically meaningful negative relation. The intensity of the color designates the strength of the relation. The higher the color intensity, the higher the strength of the relation. Yellow color denotes dissonance.
Table 6. υ-value of the ICrA evaluation of relations between crude oil SARA composition data and bulk properties.
υSatAroResinsAsSGSulphurVR YieldPPVIS
Sat00.82730.83940.81920.92020.83940.8970.47370.8677
Aro0.827300.22630.23540.21310.22120.23540.48890.2313
Resins0.83940.226300.15560.17270.13640.16060.47170.1909
As0.81920.23540.155600.1990.16060.18590.47680.2444
SG0.92020.21310.17270.19900.18990.08790.44240.1232
Sulphur0.83940.22120.13640.16060.189900.16970.53230.2141
VR yield0.8970.23540.16060.18590.08790.169700.43430.0889
PP0.47370.48890.47170.47680.44240.53230.434300.4263
VIS0.86770.23130.19090.24440.12320.21410.08890.42630
Note: Green color denotes statistically meaningful positive relation; red color denotes statistically meaningful negative relation. The intensity of the color designates the strength of the relation. The higher the color intensity, the higher the strength of the relation. Yellow color denotes dissonance.
Disclaimer/Publisher’s Note: The statements, opinions and data contained in all publications are solely those of the individual author(s) and contributor(s) and not of MDPI and/or the editor(s). MDPI and/or the editor(s) disclaim responsibility for any injury to people or property resulting from any ideas, methods, instructions or products referred to in the content.