Article

Influence of Loading Rate on the Cohesive Traction for Soft, Rubber-Like Adhesive Layers Loaded in Modes I and III

Institute of Mechanics and Materials, Technische Hochschule Mittelhessen, University of Applied Sciences, Wiesenstraße 14, 35390 Gießen, Germany
*
Author to whom correspondence should be addressed.
These authors contributed equally to this work.
Processes 2023, 11(2), 356; https://doi.org/10.3390/pr11020356
Submission received: 15 December 2022 / Revised: 11 January 2023 / Accepted: 18 January 2023 / Published: 22 January 2023
(This article belongs to the Special Issue Design of Adhesive Bonded Joints)

Abstract

:
To date, the fracture behaviour of soft, polyurethane-based adhesive joints has rarely been investigated. This work contributes to the experimental investigation of such joints in modes I and III by performing double cantilever beam (mode I) and out-of-plane loaded double cantilever beam (mode III) tests at various loading rates. The tests were evaluated using a J-integral method, which is well established for testing stiff adhesive layers and is conventionally used to determine the cohesive traction at the crack tip. Additionally, fibre-optics measurements were conducted to provide crack extension, process zone length, and cohesive traction from the measured backface strain of the adherends. It was found that the energy release rate seems to be largely independent of the loading mode. However, differences were observed regarding process zone length and resistance curve behaviour. Furthermore, the backface strain measurement allows the determination of the cohesive traction along with the complete adhesive layer as well as separation and separation rate, yielding rate-dependent cohesive laws. A comparison indicated that the cohesive traction obtained from the J-integral method does not match the measured benchmark from the backface strain measurements because the underlying theoretical assumptions of the J-integral method are likely violated for soft, rubber-like adhesive joints.

1. Introduction

The literature contains a large number of studies investigating the fracture behaviour of epoxy-based adhesives but comparatively few works investigating soft, rubber-like polyurethane-based adhesives. However, many authors agree that polyurethane adhesives have various advantages in terms of the more even load distribution of peel loads, higher elongation at break, good damping properties and fatigue resistance, and energy consumption during impact [1,2,3]. The latter is of particular importance in passenger protection, as increased fracture energy leads to a greater amount of energy being absorbed by the adhesive layer in the event of a crash accompanied by finite deformations in the adhesive layer, which could potentially help to minimise personal injuries. Despite these important factors, only a few studies have investigated the fracture behaviour of polyurethane-based adhesive joints, whereas numerous studies have been conducted on polyurethane adhesives in their bulk form. It is assumed that this lack of research may be due to issues such as large process zones and energy dissipation through viscoelastic or viscoplastic effects, as well as creep processes complicating both the experimental investigation of the fracture behaviour and the extraction of fracture mechanical parameters.
The determination of cohesive laws is of particular importance for the design of adhesively bonded joints, because from these, by use of cohesive zone modelling, the behaviour of the joint can be predicted efficiently in finite element analyses. The aim of cohesive zone modelling is to reproduce the macroscopic fracture behaviour of the adhesive layer by the use of traction separation relations, which, in the best-case scenario, can be evaluated directly from mechanical fracture experiments such as, e.g., the double cantilever beam (DCB) test, the end-notched flexure test, or the out-of-plane loaded double cantilever beam (ODCB) test in modes I, II, and III, respectively. Commonly, an evaluation method based on the J-integral according to Rice [4], in which the cohesive laws are obtained by taking the derivative of the externally measured J-integral with respect to the crack opening displacement (COD), is used for this purpose in the single mode testing of both stiff, epoxy-based, e.g., [5,6,7,8,9,10,11], and soft, rubber-like adhesives, e.g., [12,13,14]. The approach assumes a purely non-linear elastic material behaviour, with the crack tip being the only inhomogeneity in the body, which, however, could be a problematic assumption for testing soft, rubber-like adhesive systems because the effects of the loading rate and energy dissipation outside of the crack tip, i.e., in the process zone, may not be taken into account accordingly. For pure mode I loading, Rosendahl et al. [14] showed that the approach can, indeed, approximately be used for thick, hyperelastic adhesive layers under quasi-static conditions using finite element analyses. However, this finding remains to be verified experimentally. Furthermore, in the mode III testing of rubber-like adhesives, in which the process zones are significantly larger than in mode I [15], the approach has not yet been used. To experimentally investigate the applicability of the J-integral method, the aim of our study is to propose an alternative methodology for determining cohesive laws based on the deflection curve of the adherends in DCB and ODCB tests to circumvent the underlying assumptions of the J-integral approach, e.g., rate-independent material behaviour and negligible effects of the process zone. As we will show, this novel method also has some additional advantages in accounting for rate-dependent fracture behaviour, as it can also be used to directly measure rate-dependent cohesive laws.
The dependency on loading rate and mode on the energy release rate (ERR) of rubber-like adhesives has also been investigated in some recent studies: In pure mode I testing, Schmandt and Marzi [12,13] investigated the effect of loading rate and adhesive thickness on the fracture energy, cohesive strength, and joint stiffness of polyurethane-based adhesives with DCB tests using the above-mentioned method of evaluation and found that fracture energy and cohesive strength show dependencies on both the loading rate and layer thickness. Boutar et al. [16] investigated the quasistatic single mode I and mode II fracture of a polyurethane-based adhesive system and found a significant dependency of the obtained fracture energy on the loading mode, with the mode II fracture energy being over three times larger than the mode I fracture energy at a layer thickness of 1 mm. In contrast, Loh and Marzi [15] investigated the mixed-mode I+III behaviour at a layer thickness of 3 mm and found that there could be an indication that the critical fracture energy of thick polyurethane-based joints does not depend on the mode-mix ratio. However, they also stated that the experimental scatter in their results did not allow a definitive statement about this issue. Furthermore, because of a pronounced resistance curve behaviour, they were unable to determine the cohesive traction in the adhesive layer with the J-integral approach, which also indicates that finding another methodology that allows the determination of the cohesive traction for such soft, rubber-like adhesive layers is an important advance in the state of research.
As hinted at earlier, the determination of process zone length and crack tip position is also of interest for the investigation of the fracture behaviour of adhesive joints: considering the determination of crack length, Schrader et al. [17] found that the crack extension measurement for rubber-like adhesive joints proved to be a difficult task with both optical methods of crack length measurement and the enhanced simple beam theory approach according to Škec et al. [18], leading to the conclusion that other methods for determining an equivalent crack tip position could be advantageous. Hence, as an alternative, we rely on an approach based on measurements on the adherends’ backface strain (BFS) within this study, as the measurement of the BFS also allows the determination of the deflection curve of the adherends, which is crucial for our aim of determining the cohesive traction without underlying J-integral assumptions. Similar approaches have already been established in some other studies with a focus on the pure mode I testing of stiff adhesive systems: Ben Salem et al. [19] used several strain gauges along the top surface of a DCB specimen bonded by a structural adhesive joint for crack tip detection and identified the crack tip position from the position of the maximum bending strain. Similarly, Bernasconi et al. [20] and Lima et al. [21] used optical backscatter reflectometry to obtain the adherends’ BFS. Truong et al. [22] also calculated the resistance curve for a composite specimen from BFS measurements. To obtain a deflection curve during DCB experiments, Reiner et al. [23] and Sun and Blackman [24] used digital image correlation (DIC) to obtain the displacement profiles, enabling the calculation of the ERR from the obtained displacement data. Additionally, especially for the investigation of soft adhesive systems, a measurement of strain along the adherends allows the investigation of the process zone shape, as performed, e.g., by Jumel et al. [25]. Schrader and Marzi [11] recently investigated a stiff, epoxy-based adhesive system in mode III loading and also calculated both crack length and process zone length from the measured BFS of the adherends. They also noted that the investigation of the process zone using BFS measurements could be of particular interest for investigating soft, rubber-like adhesive layers. Hence, the state of research indicates that BFS measurements seem to offer valuable data for determining cohesive laws from the experimental results.
Building on the mentioned studies, the present work aims to, for the first time, holistically investigate the effects of crack opening velocity and loading mode on a soft, rubber-like polyurethane-based adhesive joint, especially considering the determination of cohesive laws. Differences between the different evaluation methods, i.e., the J-integral method and BFS measurements, shall be investigated, highlighted, and discussed in order to gain insight into the applicability of the J-integral approach for soft, rubber-like adhesive layers, because, as hinted at earlier, some of its underlying assumptions may be violated for such adhesive systems. Furthermore, measuring the BFS along with the adhesive layer offers the hitherto unprecedented opportunity to investigate whether the cohesive law measured at the crack tip is at least similar to the cohesive traction separation relations along with the complete adhesive layer.
For this reason, we performed DCB and ODCB experiments on a soft, polyurethane-based adhesive system (Wiko Ultimate Elongation GLUETEC Industrieklebstoffe GmbH & Co. KG, Greußenheim, Germany) in both DCB and ODCB tests at different loading rates, i.e., 0.05 mm/s, 0.5 mm/s, and 5 mm/s in mode I and 0.05 deg/s, 0.5 deg/s, and 5 deg/s in mode III. In each of the test series, one experiment with a fibre-optics-based BFS measurement was performed to investigate the deformation behaviour of the adherends and to compare the results with the conventionally used evaluation methods for the determination of cohesive laws based on the J-integral.
We shall begin by briefly presenting the necessary theoretical background on the evaluation methods based on the J-integral and BFS measurements of the DCB and ODCB experiments. After stating the materials and methods, we shall present and thoroughly discuss the most important experimental findings. This includes the observed fracture patterns, the bending strain measured by the optical fibres, the rate-dependency of the ERR in modes I and III, the obtained resistance curves, the measured process zone lengths, and the cohesive laws. Furthermore, the BFS measurements are compared to the globally measured data to verify the used evaluation approaches. As we will show, the determination of cohesive laws from the deflection curve of the adherends is a valuable addition to fracture mechanical testing, as the conventional J-integral method of determining the cohesive traction may be prone to error because the underlying assumptions could be violated for soft, rubber-like adhesive layers. Additionally, the presented method based on the BFS measurement allows the determination of a rate-dependent cohesive law, which, to the authors’ knowledge, has not been achieved elsewhere.

2. Theory

2.1. J-Integral and Cohesive Traction

The J-integral of an arbitrarily shaped, non-linear elastic body—following the notation of Rice [4]—is defined as
J = S W d y t i Δ i x d s ,
where S describes an arbitrary path circumscribing the crack tip in a counter-clockwise direction, t i are components of the (nominal) traction vector, Δ i are components of the displacement vector, and W is the strain energy density; see Figure 1. The integration is performed in the reference configuration and, per the definition, provides the sum of all inhomogeneities in the body. As the above equation is written in index notation, it shall be summed over i = 1 , . . . , 3 to compute the total value of the J-integral.
Considering the testing of adhesive layers, determining the traction vector is of special interest for modelling the fracture behaviour of adhesive joints using cohesive zone models. Briefly, if the integration path is chosen around the boundary between the adherend and adhesive layer parallel to the x-axis ( d y = 0 ) and exploiting the symmetry of a specimen (i.e., identical adherends), the above equation can be expressed as
J ( loc ) = 2 x end x t t i ( x ) Δ i x d x = x end x t t i ( x ) δ i ( x ) x d x
where δ i = 2 Δ i are the components of the separation vector, i.e., the relative displacement of the upper and lower boundary, x end is the (unloaded) end of the adhesive layer, and x t is the crack tip position. The assumption of the elastic behaviour of the adhesive layer implies that, given single mode loading, the traction depends solely on the deformation state, t I ( δ I ( x ) ) and t I I I ( δ I I I ( x ) ) , respectively. Inserting this into the above equation and substituting δ i ( x ) x d x = d δ i ( x ) then yields
J I ( loc ) = 0 δ I ( x t ) t I δ I x d δ I ( x ) and J I I I ( loc ) = 0 δ I I I ( x t ) t I I I δ I I I x d δ I I I ( x )
under the assumption that the end of the adhesive layer x end is unloaded. It should be noted that a transition between Equations (2) and (3) is only possible under the condition of integrability, × t = 0 . This integrability condition is automatically fulfilled if the cohesive traction depends only on the separation in the respective loading mode (decoupled behaviour), i.e., t I ( δ I ( x ) ) and t I I I ( δ I I I ( x ) ) ; a dependence on, e.g., the separation rate would violate the integrability condition and a conversion from Equation (2) to (3) would not be feasible. Using the mode I and mode III COD, δ I , t = δ I ( x t ) and δ I I I , t = δ I I I ( x t ) , the equation can be rewritten in differential form and rearranged for the cohesive traction,
t I ( δ I , t ) = d J I ( loc ) d δ I , t and t I I I ( δ I I I , t ) = d J I I I ( loc ) d δ I I I , t ,
thus yielding the so-called cohesive laws in the individual loading modes I and III.
It shall be noted that the Equations (2)–(4) apply locally in the vicinity of the crack tip. For the experimental evaluation, it is demanded that J ( loc ) is in equilibrium with the sum of contributions from external loads, which should apply as long as no energy is dissipated outside of the adhesive layer. This method is straightforward, as by measuring the J-integral over external loads (cf. Section 2.2) and the COD, cohesive laws can be determined directly by the derivation of the measured quantities.
It should be highlighted, however, that it may be difficult to justify the validity of the assumptions behind Equation (4) for a soft, polyurethane-based, rubber-like adhesive. For such adhesives, the assumption of purely elastic behaviour behind the presented derivations is deemed problematic: firstly, the implication that the cohesive traction solely depends on the separation may neglect the effects of loading rate on the material behaviour, wherefore the integrability condition for transitioning between Equations (2) and (3) would be violated. Secondly, the assumption of a non-linear elastic body implies that the crack tip is the only material inhomogeneity in the body. This could also be deemed problematic, as soft adhesive layers may develop process zones of finite length before ultimate failure. As the J-integral provides the sum of all inhomogeneities in the elastic body, inhomogeneities in the process zone, e.g., plastic effects, viscoelasticity, and damage, could also contribute to the value of the externally measured J-integral and could, hence, falsely be ascribed to the crack tip when calculating the cohesive traction from Equation (4).
Because the assumptions behind Equation (4) may be violated during the testing of soft, rubber-like adhesives, it can already be assumed that the approach of taking the derivative of the externally measured value of J for the COD could be error-prone. However, as this approach to the determination of cohesive laws is deemed very pragmatic and was already used successfully in studies investigating the mode I fracture of polyurethane-based adhesive joints [12,13,14], it is worthwhile to check this approach as it could at least provide a good approximation for the traction at the crack tip. This work aims to assess the quality of the approximation by using additional methods of measurement, i.e., BFS measurements, which allow a determination of the nominal traction along with the adhesive layer.

2.2. Determination of the ERR in DCB and ODCB Experiments

Consider the DCB and ODCB specimens displayed schematically in Figure 2. Briefly, if the specimen of width b is loaded in pure mode I during a DCB test, as found by Paris and Paris [26], the J-integral according to Equation (2) reduces to
J I = F y θ 1 + θ 2 b .
For pure mode III loading during ODCB tests, Loh and Marzi [9] derived that the J-integral yields
J I I I = M y 2 b 1 E I y
with the applied moment M y and the bending stiffness E I y of the adherends. Loh and Marzi [27] found in a later study that unintended contributions to J can occur during testing in mode III, which result from a mode I contribution due to the specimen twisting under an out-of-plane deformation, J I * , and a contribution in modes I and II due to the finite width of the adhesive layer, J I + I I :
J I * = 1 2 b 1 M x 2 + 2 M x 2 μ I y z and J I + I I = 2 M z 2 2 b 1 E I z
Here, μ denotes the shear modulus of the adherends, and I y z and I z denote the torsional second moment of area and the second moment of area of the adherend around the bending axis z, respectively. From this, the total value of the J-integral is obtained from the sum of mode III and unintended contributions:
J = J I I I + J I * + J I + I I
It should be noted that in the subsequent studies by Loh and Marzi [9,27,28] and Schrader and Marzi [10], the contributions J I * and J I + I I were found to be negligible at the point of fracture during pure mode III investigations of both epoxy-based and polyurethane-based adhesive systems, i.e., J J I I I . Hence, the cohesive law can then be determined from Equation (4) as the externally measured value of J from the outer loads is in equilibrium with the value of J in the adhesive layer given that the adherends do not deform plastically.

2.3. Determination of ERR and Cohesive Traction from BFS Measurements

To gain better insight into the deformation behaviour of the specimen in each loading configuration, a measurement of the adherends’ BFS ε at discrete measuring points along with the specimen is used to determine the deflection curve at different times during the experiment. For each measurement in time, from the distance c between the position of strain measurement and the neutral axis of the adherend, which is assumed to be a Euler–Bernoulli beam, the beam curvature κ is obtained via κ ( x ) = ε ( x ) / c , ultimately yielding the bending moment
M b ( x ) = κ ( x ) E I
from the bending stiffness E I around the bending axis of interest (y-axis in the ODCB and z-axis in the DCB tests, respectively). From this, transverse force Q ( x ) and line load q ( x ) are obtained by the differentiation of the bending moment for the x-position along the adherends, giving
Q ( x ) = d M b ( x ) d x and q ( x ) = d 2 M b ( x ) d x 2 .
Furthermore, integrating the curvature along the beam provides the slope φ ( x ) of one lever arm and the separation δ ( x ) between the two adherends via
φ ( x ) = x end x t κ ( x ) d x and δ ( x ) = 2 x end x t φ ( x ) d x .
It should be mentioned that, for a specimen with an unloaded end, it can be reasonably assumed that the integration constants for slope and deflection become nought, allowing the calculation of both quantities without further restrictions. As a result, a measurement of the beam curvature provides an additional possibility of obtaining cohesive traction at discrete measuring points along with the length of the beam via
t ( x ) = q ( x ) b
under the assumption that the load is distributed equally on the width of the adhesive layer for both peel and shear loads. Thus, a comparison can be made to check the applicability of Equation (4) with this measurement. Furthermore, considering Equation (2), from the stress in the cohesive zone according to Equation (12) and the relationship Δ i / x = φ , the J-integral is obtained via
J = 2 x end x t t ( x ) φ ( x ) d x .
It is therefore evident that the measurement of the elongation at the marginal fibres of the adherends can be used to gain better insight into the fracture behaviour of the adhesive layer. By investigating the deformation behaviour at different times during the experiment and points along with the specimen, the traction, separation, and separation rate can be obtained at each discrete measuring point along with the specimen.

3. Materials and Methods

3.1. Specimen Manufacturing

Within this study, both DCB and ODCB tests were performed on the polyurethane-based adhesive system Wiko Ultimate Elongation (GLUETEC Industrieklebstoffe GmbH & Co. KG, Greußenheim, Germany) at various loading velocities. The tested adhesive system is a one-component, moisture-curing adhesive that exhibits a high elongation at a break of about 800%, according to the manufacturer’s data. The substrates of the used specimens were made of the high-strength aluminium alloy AlZn5,5MgCu (material grade number 3.4365, E = 70 GPa). The used specimens are displayed in Figure 3 with the corresponding dimensions. The adherends had a T-shaped cross-section to achieve a smaller adhesive layer width compared to the width of the adherends, avoiding plastification in the aluminum during the experimental investigation. Furthermore, the length of the specimens was chosen to be shortly below a meter, ensuring that the process zone did not reach the end of the specimen during the crack initiation phase, even in the case of finite deformations at the crack tip, ensuring an unloaded end of the specimen.
Before applying the adhesive, the bonding surfaces of the substrates were sandblasted with corundum (grain size of 100–150 µm) and degreased with isopropyl alcohol. The adhesive was then applied with an electric caulking gun. To define the layer thickness, PTFE spacers with a nominal thickness of 1 mm were placed at the beginning and the end of the adhesive layer and removed after curing. Screw clamps were used to hold the substrates in place during the curing procedure. The specimens were cured in a lab for 1–2 weeks under laboratory conditions, i.e., at a room temperature of (23 ± 3) C and relative humidity of about (50 ± 5)%, in line with the manufacturer’s data of the moisture-curing adhesive system. Before testing, a sharp pre-crack was introduced at the beginning of the adhesive layer by inserting a thin razor blade in the middle of the adhesive layer parallel to the bonding surfaces. This was done to achieve a fracture mechanical specimen, provoke cohesive failure, and define a sharp initial pre-crack for the evaluation of the COD. With the described procedure, an initial crack length of (135.7 ± 1.2) mm, i.e., the distance between the initial crack tip and the axis of load introduction, and an adhesive layer thickness of (0.88 ± 0.08) mm were achieved.

3.2. Experimental Setups and Test Matrix

The DCB and ODCB tests were performed in a biaxial tension-torsional servo-hydraulic test machine (MTS Landmark Bionix, MTS Systems, Eden Prairie, USA). The experimental setups are displayed in Figure 4. To measure the rotations θ 1 and θ 2 of the specimens at the load introduction points in the DCB tests, incremental rotary encoders (BDH 1P.05A320000-L0-5, Baumer AG, Frauenfeld, Switzerland) with a resolution of 320,000 steps per full turn were used. The applied force was measured below the lower clamping device with a six-axis load cell (K6D110 4 kN/250 Nm, ME-Messsysteme GmbH, Hennigsdorf, Germany). To examine the rate-dependency of the adhesive, the DCB tests were performed at external loading rates of 0.05 mm/s, 0.5 mm/s, and 5 mm/s.
During the ODCB tests, the applied moments were measured using two of the above-mentioned six-axis load cells, one at each load introduction point of the specimen. To avoid lateral forces on the specimen, the bottom clamping of the specimen was mounted on two orthogonally placed linear slides. Throughout the ODCB tests, the axial force was controlled to be nought by the used testing machine. At the time of carrying out the experiments, it was assumed that the floating support would ensure that the transverse forces would not influence the experimental results akin to the results of Schrader and Marzi [10], wherefore the measurement of the transverse forces was omitted. As we will show later, however, it was found during the post-processing of the BFS measurement that this assumption is problematic for the tested soft, rubber-like adhesive layer. The ODCB tests were performed at external loading rates of 0.05 deg/s, 0.5 deg/s, and 5 deg/s, respectively.
To investigate the deflection curve, the BFS along with the specimen was measured using a fibre-optics system (ODiSI-B 5500, Luna Innovations Inc., Roanoke, VA, USA, positional resolution of 2.5 mm). The fibre was bonded to the adherends along the upper and lower surface of the adherends for the DCB tests and on the tensile-loaded outer surface of the adherends for the ODCB tests. As the experimental effort largely increases with the additional use of this measuring system, we refrained from increasing sample sizes with BFS measurements for this pilot study. The results were evaluated following the procedure described in Section 2.3. It must be stated that numerically taking the derivative of the measured curvature for the x-position along the beam produces numerical noise. To counteract this, the measurements were filtered with a Savitzky–Golay filter before each derivation step.
The COD was measured with stereo camera systems in all cases. To evaluate the COD, the relative distance between two measuring points at the position of the initial pre-crack was determined through DIC measurements, with one point being on the lower and one on the upper substrate. In the mode III experiments, the measurement of the COD was adjusted for the rigid body rotation of the specimens. Two DIC systems were used based on the desired rate of image acquisition: for the experiments at lower image acquisition rates between 1 and 20 fps, a 12 MP ARAMIS 3D Motion and Deformation Sensor with the corresponding evaluation software (GOM Aramis, GOM GmbH, Braunschweig, Germany) was used. For the tests with image acquisition rates between 30 and 125 fps, two 1 MP Photron FASTCAM Nova S6 (Photron USA, San Diego, CA, USA) and the evaluation software VIC-3D 8 (Correlated Solutions, Irmo, SC, USA) were used. Within the course of this study, to reduce numerical errors during differentiation, the experimental results of t i ( δ t ) were obtained with the procedure proposed by Biel [29], in which the experimental results of J vs. δ t were fitted with a Prony series before taking the derivative.
It shall be stated that the external loading rates were selected so that, starting with a quasi-static loading rate of 0.05 mm/s in mode I and 0.05 deg/s in mode III, the rates increased by powers of ten with each test series. Although higher loading rates could have been achieved with the given test setups and the used servo-hydraulic test machine, testing at larger rates was refrained from because the fibre-optics system could not provide a sufficient temporal resolution.
For a better overview, the number of the performed experiments is summarized in Table 1 with the external loading rate, sample size, used DIC systems, and image acquisition rates. As stated earlier, in each of the conducted test series, one BFS measurement was conducted using the fibre-optics system.

3.3. Determination of Crack Extension and Process Zone Length

From the BFS measurement, the crack extension and the length of the loaded region within the adhesive layer can also be determined using the Euler–Bernoulli beam theory (cf. Figure 5). It can reasonably be assumed that the transverse force in the lever arms of the adherends is constant during the DCB experiments, yielding a linear increase in the measured strain along with the optical fibre. Hence, to measure the crack extension, linear regression can be performed in the linear region of the measured strain, where the point of 0.5% deviation from linearity is defined as the crack tip position x t .
To determine the length of the loaded region within the adhesive layer, similarly to the method of Schrader and Marzi [11], the maximum fibre strain in the pressure zone was used. For the sake of brevity, we will refer to this loaded region within the adhesive layer with the term “process zone” in the context of this study. It shall be highlighted that the wording should not be confused with the term “fracture process zone”, i.e., the region in the adhesive layer in which the material exhibits plastic deformations, damage, etc. The end position of the process zone is defined as the fibre position at which the threshold of 10% below the maximum fibre strain in the pressure zone is undercut. The process zone length l p is then computed from the difference between the current crack tip position and the end position of the process zone. As stated by Schrader and Marzi [11], the definition of the process zone length will likely overestimate the length of the fracture process zone due to, e.g., bondline elastic deformations and early non-linear shear stress-strain behaviour, but give a reasonably accurate measurement of the length of the loaded region within the adhesive layer.
The procedure in the mode III experiments is analogous, with the difference that the beam curvature (and, hence, the bending strain in the optical fibre) in the lever arms before the crack tip is assumed to be constant under pure mode III loading from an external bending moment. Hence, linear regression is performed in the region of constant beam curvature. In this case, the crack tip position is defined as the point of 1% deviation from linearity.
Additionally, the crack length is also calculated analytically under the assumption of simple beam theory, i.e., the assumption of the adherends being Euler–Bernoulli perfectly clamped at a point-like crack tip. A comparison is deemed worthwhile as the ERR for stiffer adhesive layers is often calculated from the crack length (e.g., akin to the methods standardised in ISO 25217 [30]), and analytically determining the crack length for soft, rubber-like adhesive layers instead of measuring it with great experimental effort could be beneficial in practice. For the DCB experiments, the crack length was calculated from the load-point separation s and the rotational angle θ at the load introduction points via
a I = 3 s 4 θ .
In the mode III ODCB experiments, the crack length was computed analytically via
a I = α E I y 2 M y
with α being the rotational angle of the biaxial testing machine.

4. Results and Discussion

4.1. General Observations and Fracture Surfaces

In all cases, large displacements at the initial crack tip are observed before the crack starts to propagate. During quasi-static mode I loading, the crack travels directly to the nearby interface, followed by adhesive failure, which is commonly observed regarding the quasi-static peeling of adhesive joints [
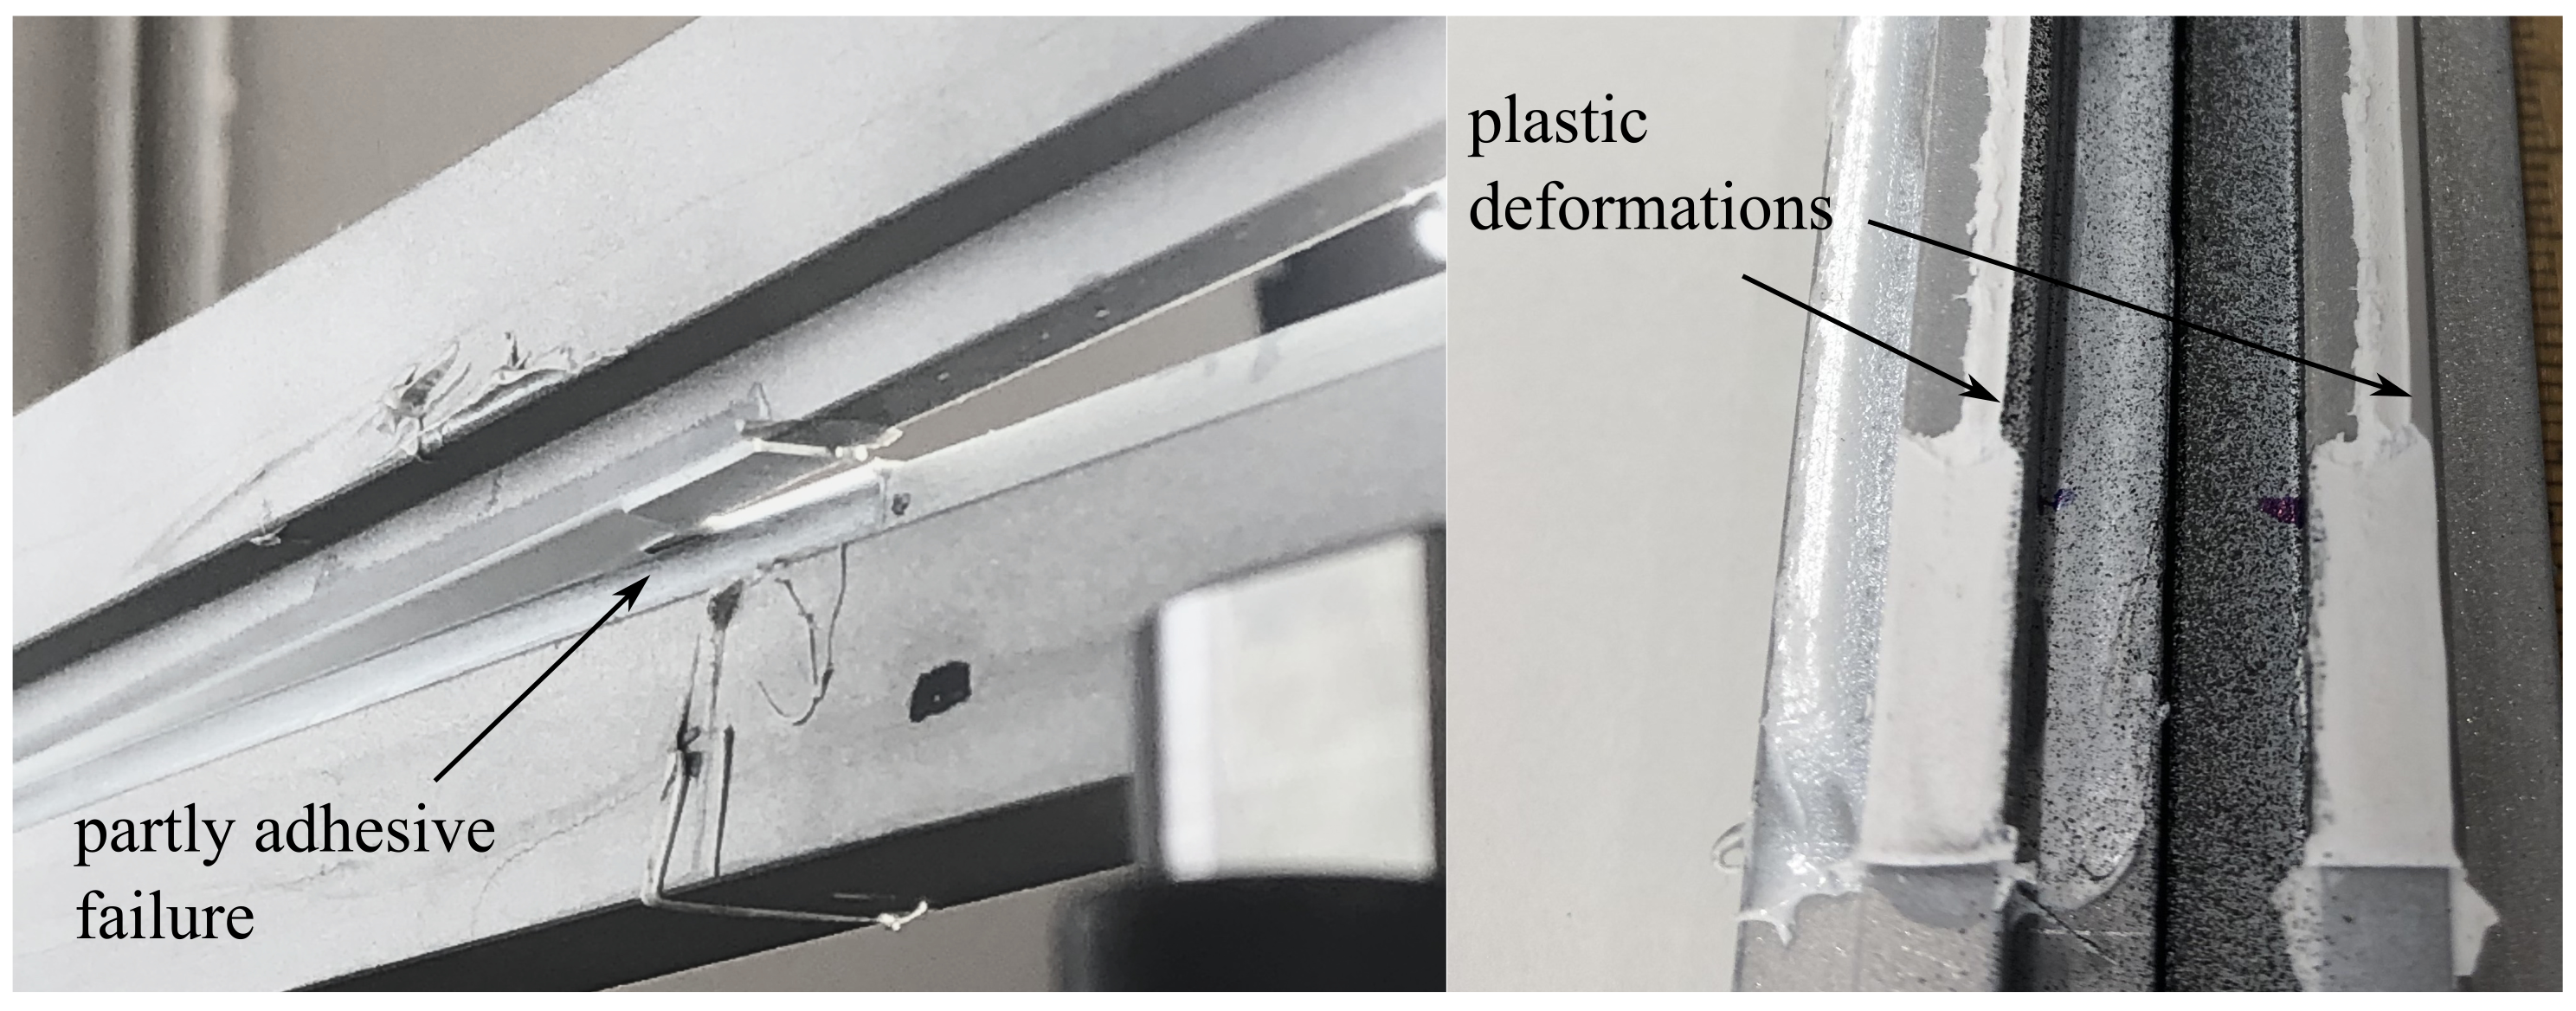
12]. With increasing loading rate, the mode I failure becomes more cohesive (cf. Figure 6). In the ODCB experiments, due to finite deformations at the crack tip, the mode III shear transitions into a peel load accompanied by partly adhesive failure at highly stretched parts of the joint (cf. Figure 7). Interestingly, the large displacement aspect during mode III loading indicates crack propagation perpendicular to the actual bonding surface, accompanied by partly adhesive failure at the outer edges of the adhesive layer. This is probably related to the general tendency of the adhesive to fail adhesively at particularly slow rates. It is assumed that during loading, highly stretched parts of the joint at the outer boundary fail adhesively, hence, reducing its effective width before an ultimate cohesive failure occurs. However, this behaviour ceases at an increased rate of 5 deg/s, as the fracture surfaces show a tilted fracture surface with purely cohesive failure. In Figure 7, it can also be observed that the outer edges of the adhesive layer opposing the side of partly adhesive failure are tilted and plastically deformed.

4.2. BFS Obtained from the Fibre-Optics Measurements

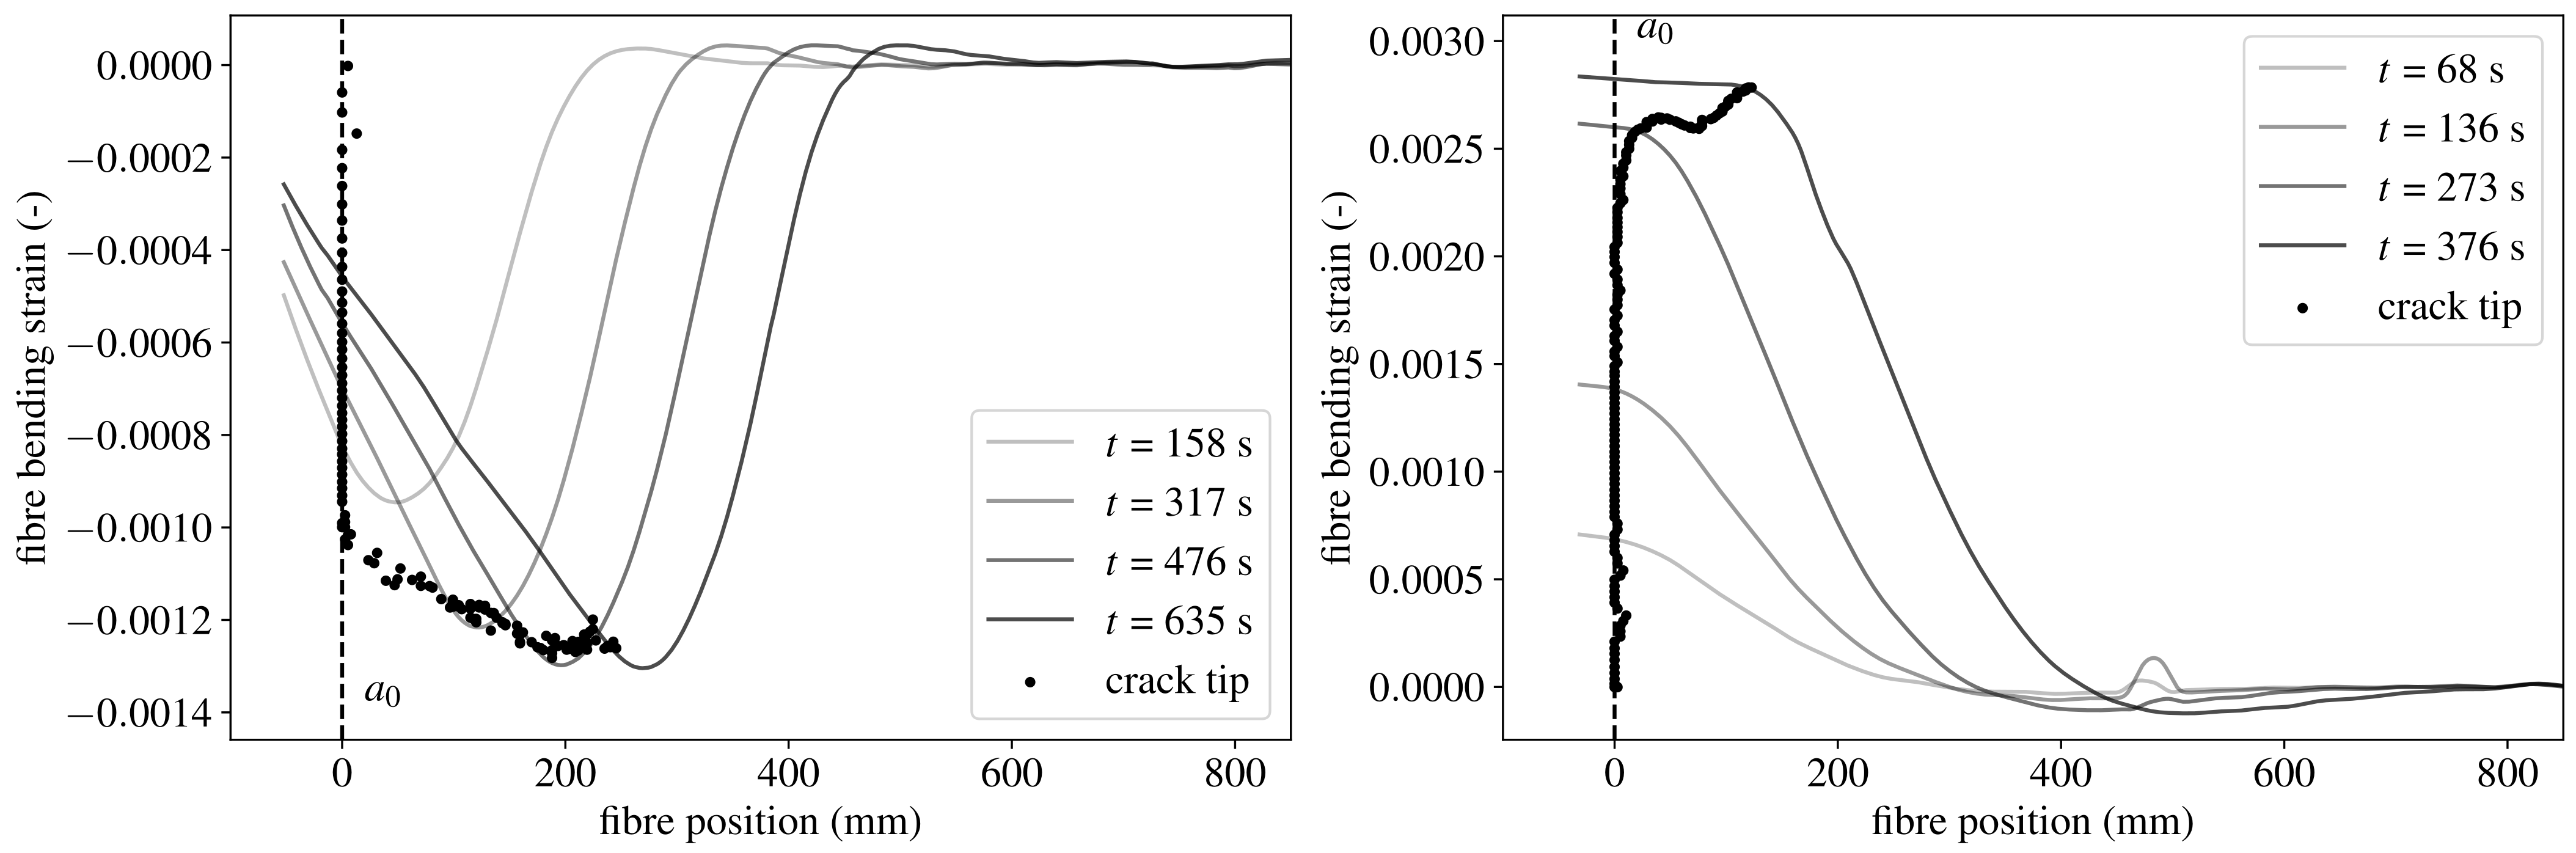
Figure 8 shows the development of the bending strain in the optical fibre over the runtime of a DCB and an ODCB test at different selected times during the measurement. For better visualization, the zero value of the abscissa is set at the initial crack tip position. Independently from the loading mode, the process zone is already quite large at the beginning of the crack propagation, strongly indicating that the assumption of an infinitesimally small process zone is violated.
In the mode I experiments, the maximum strain first increases with the applied load and then begins to shift along with the specimen as the crack progresses. Furthermore, the bending strain behaves linearly in front of the crack tip, indicating that a constant transverse force is applied in the lever arm. Deviations from linearity can hence be ascribed to the adhesive layer, indicating that the selected criterion for the detection of the crack tip position delivers satisfactory results.
In the mode III experiments, although one would expect a constant bending strain in the region of the lever arms because of the applied bending moment M y 
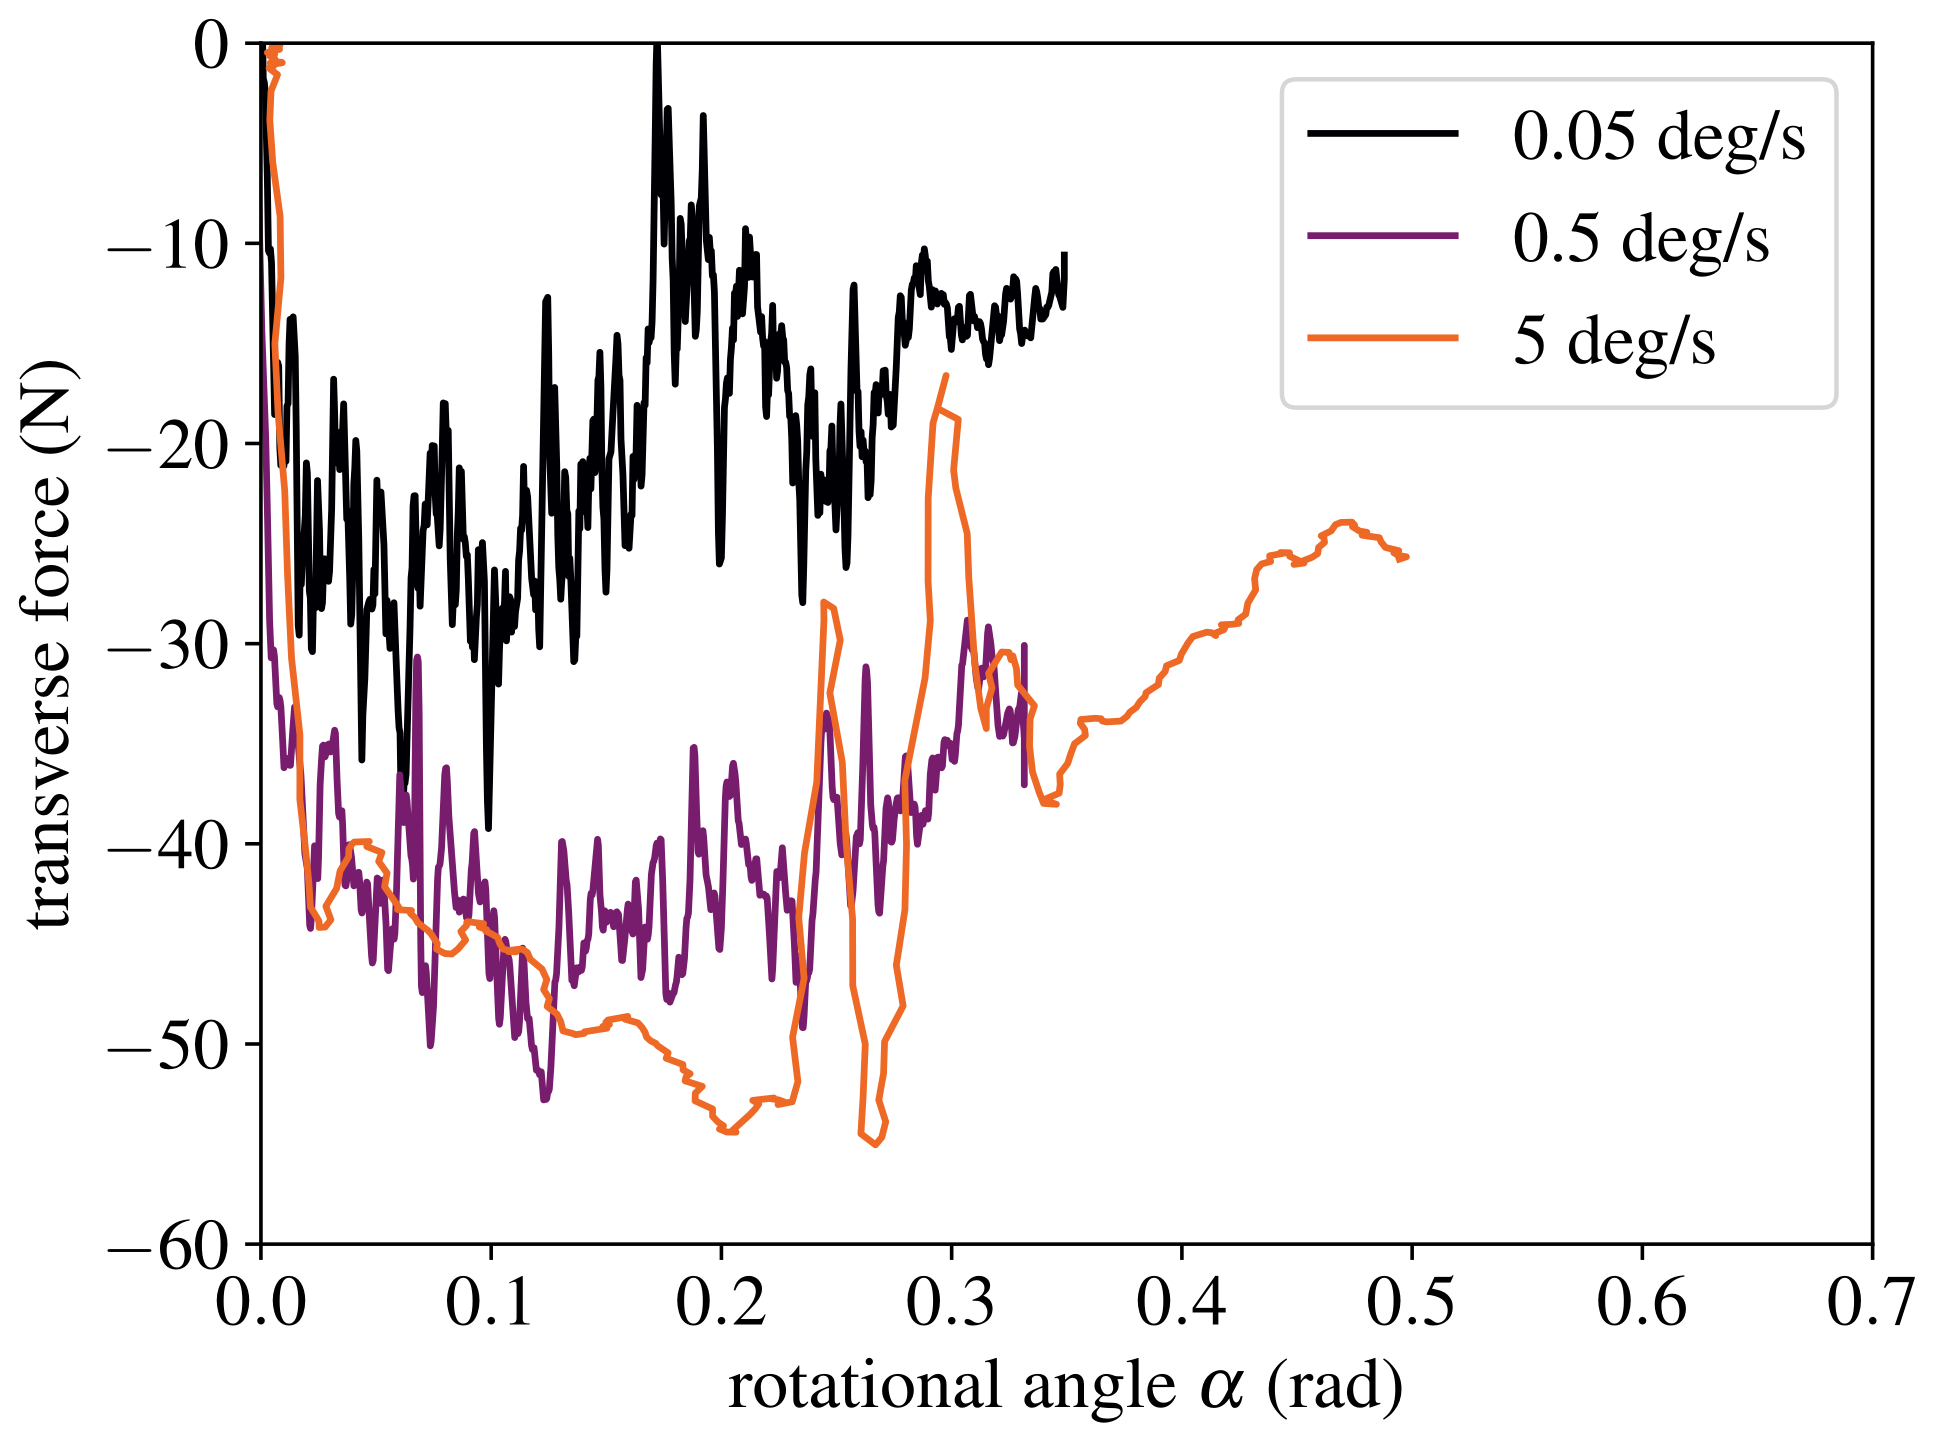
, a linear growth of the measured strain can be observed, indicating that an additional transverse force, probably due to friction in the lateral slides below the lower clamping device, acts on the specimen. The transverse force obtained from the BFS measurement, i.e., the slope of the measured strain in the region of the lever arms, is displayed in Figure 9 for the different loading rates. As the slope is determined through the numerical differentiation of the strain data, the measurement noise is amplified, yielding the observed fluctuations in the displayed transverse force. The assumption of friction being the main reason for the transverse forces is supported by the fact that the resisting force is relatively constant after a certain break-away force of the linear slides is reached. Because this resisting force is counter-directed to the applied moment component M y , it will inevitably reduce the traction and the value of J in the adhesive layer. This result, which unfortunately only became apparent during post-processing, was rather unexpected. While this will not influence the BFS evaluation, it must be assumed that the influence has a significant impact on the evaluation of J from the external measurements, as it cannot be considered with the used method of evaluation for the ODCB tests.

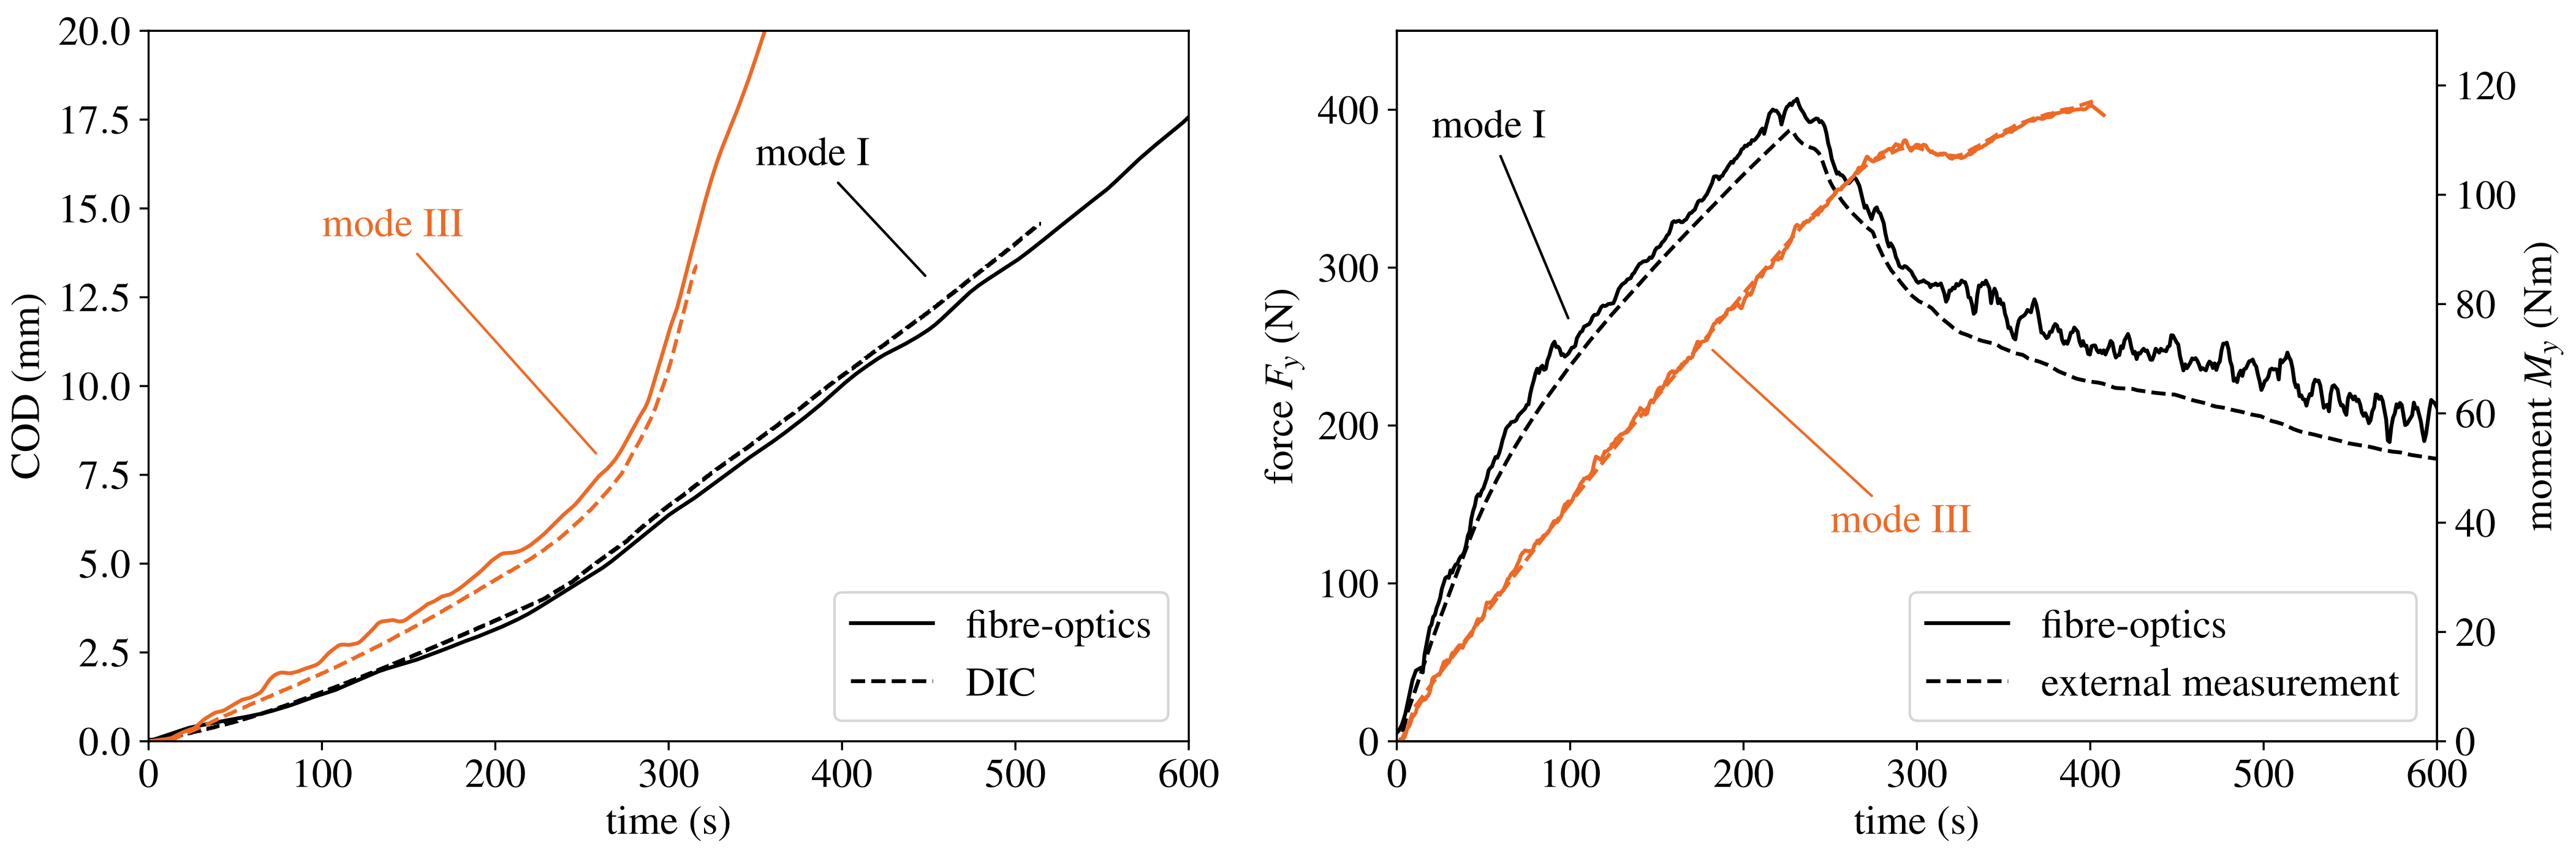
4.3. Comparison between BFS, Load, and DIC Measurements

Before further investigating the fracture behaviour of the tested adhesive joints with the BFS measurements, it shall be investigated whether the results can be verified with the globally measured data of the COD and applied load. In Figure 10, the results for two representative specimens (nominal adhesive layer thickness of 1 mm at the lowest loading rate) are shown for both the mode I and the mode III experiments. As can be observed, the separation at the initial crack tip obtained from both the DIC measurement as well as the values from the BFS measurement show a good agreement, indicating that the separation of the adherends can be determined from the BFS measurement with good accuracy. As the measurement data of the BFS measurements are integrated along with the complete specimen to obtain the COD at the position of the crack tip x t , cf. Equation (11), this means that the separation at each measurement point along the adhesive layer can be determined reliably. As the shear force in mode I is constant in the lever arms in front of the crack tip, the values obtained by the BFS measurement may be compared with the values measured on the external load cells as well, also showing a very good agreement. To compare the moments in mode III, the observed slope in the fibre bending strain in front of the crack tip is extrapolated to the point of load introduction. Here, the external moment measurement also agrees well with the moment obtained from the BFS measurement. Overall, the good agreement of the external measurement of COD and applied load with the BFS measurements indicate that the methodology proposed in Section 2.3 delivers valid results.

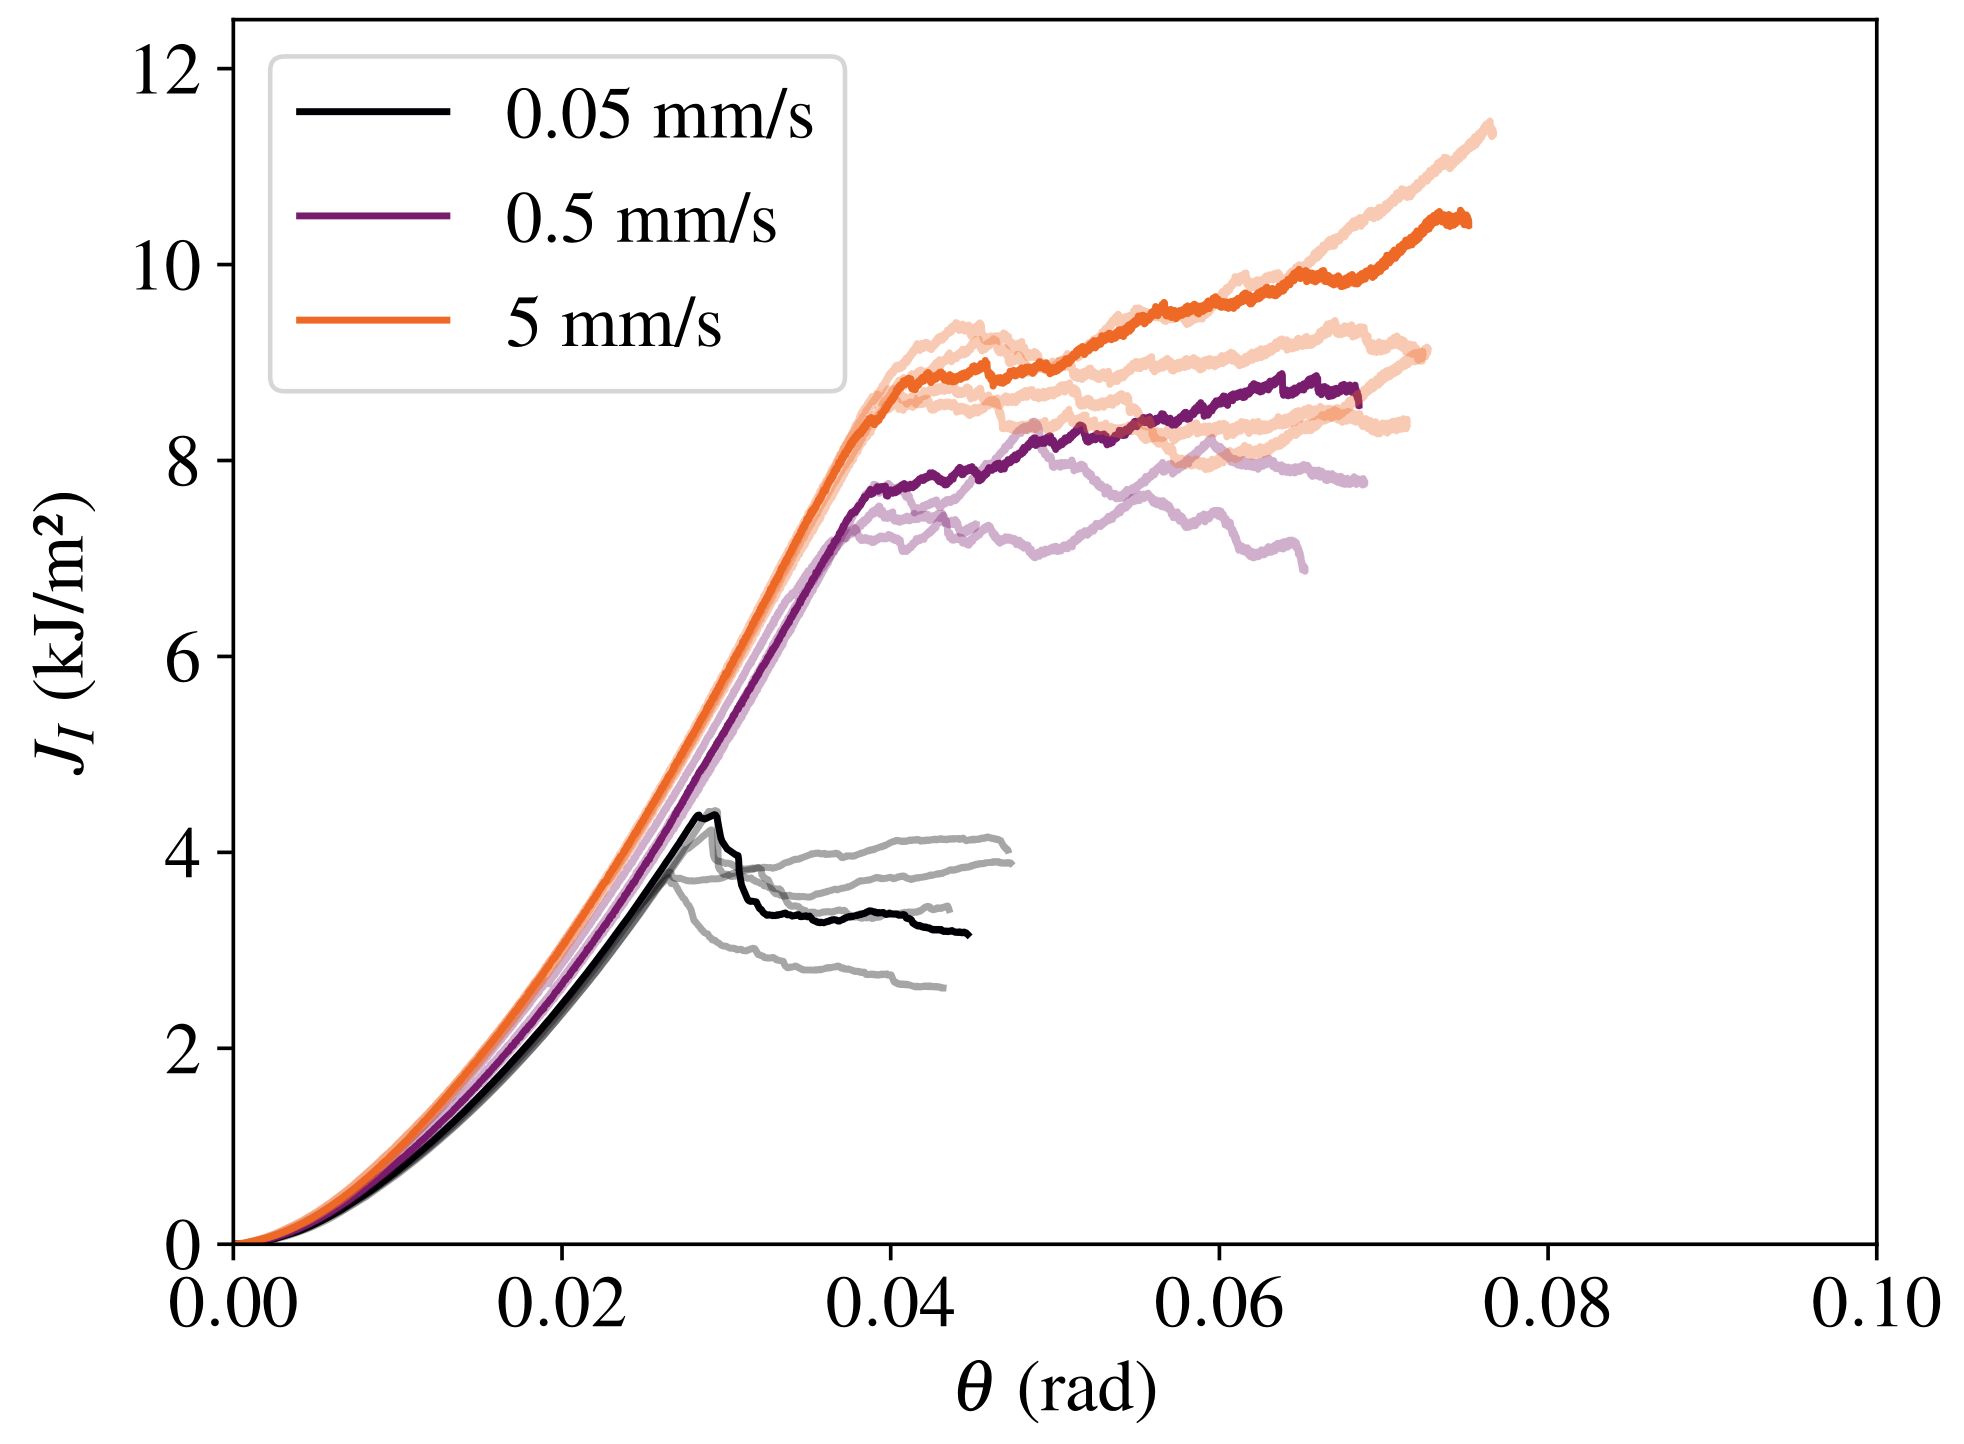
4.4. Influence of Loading Mode and Loading Velocity on the ERR

The mode I ERR obtained from Equation (5) is shown in Figure 11 over the measured rotational angle θ ; for a better overview, the tests conducted with BFS measurements are highlighted. As expected, the measured values for J at fracture initiation increase with the loading rate. The large discrepancy between the obtained ERR at 0.05 mm/s and 0.5 mm/s can be related to the adhesive failure observed during the quasi-static experiments.
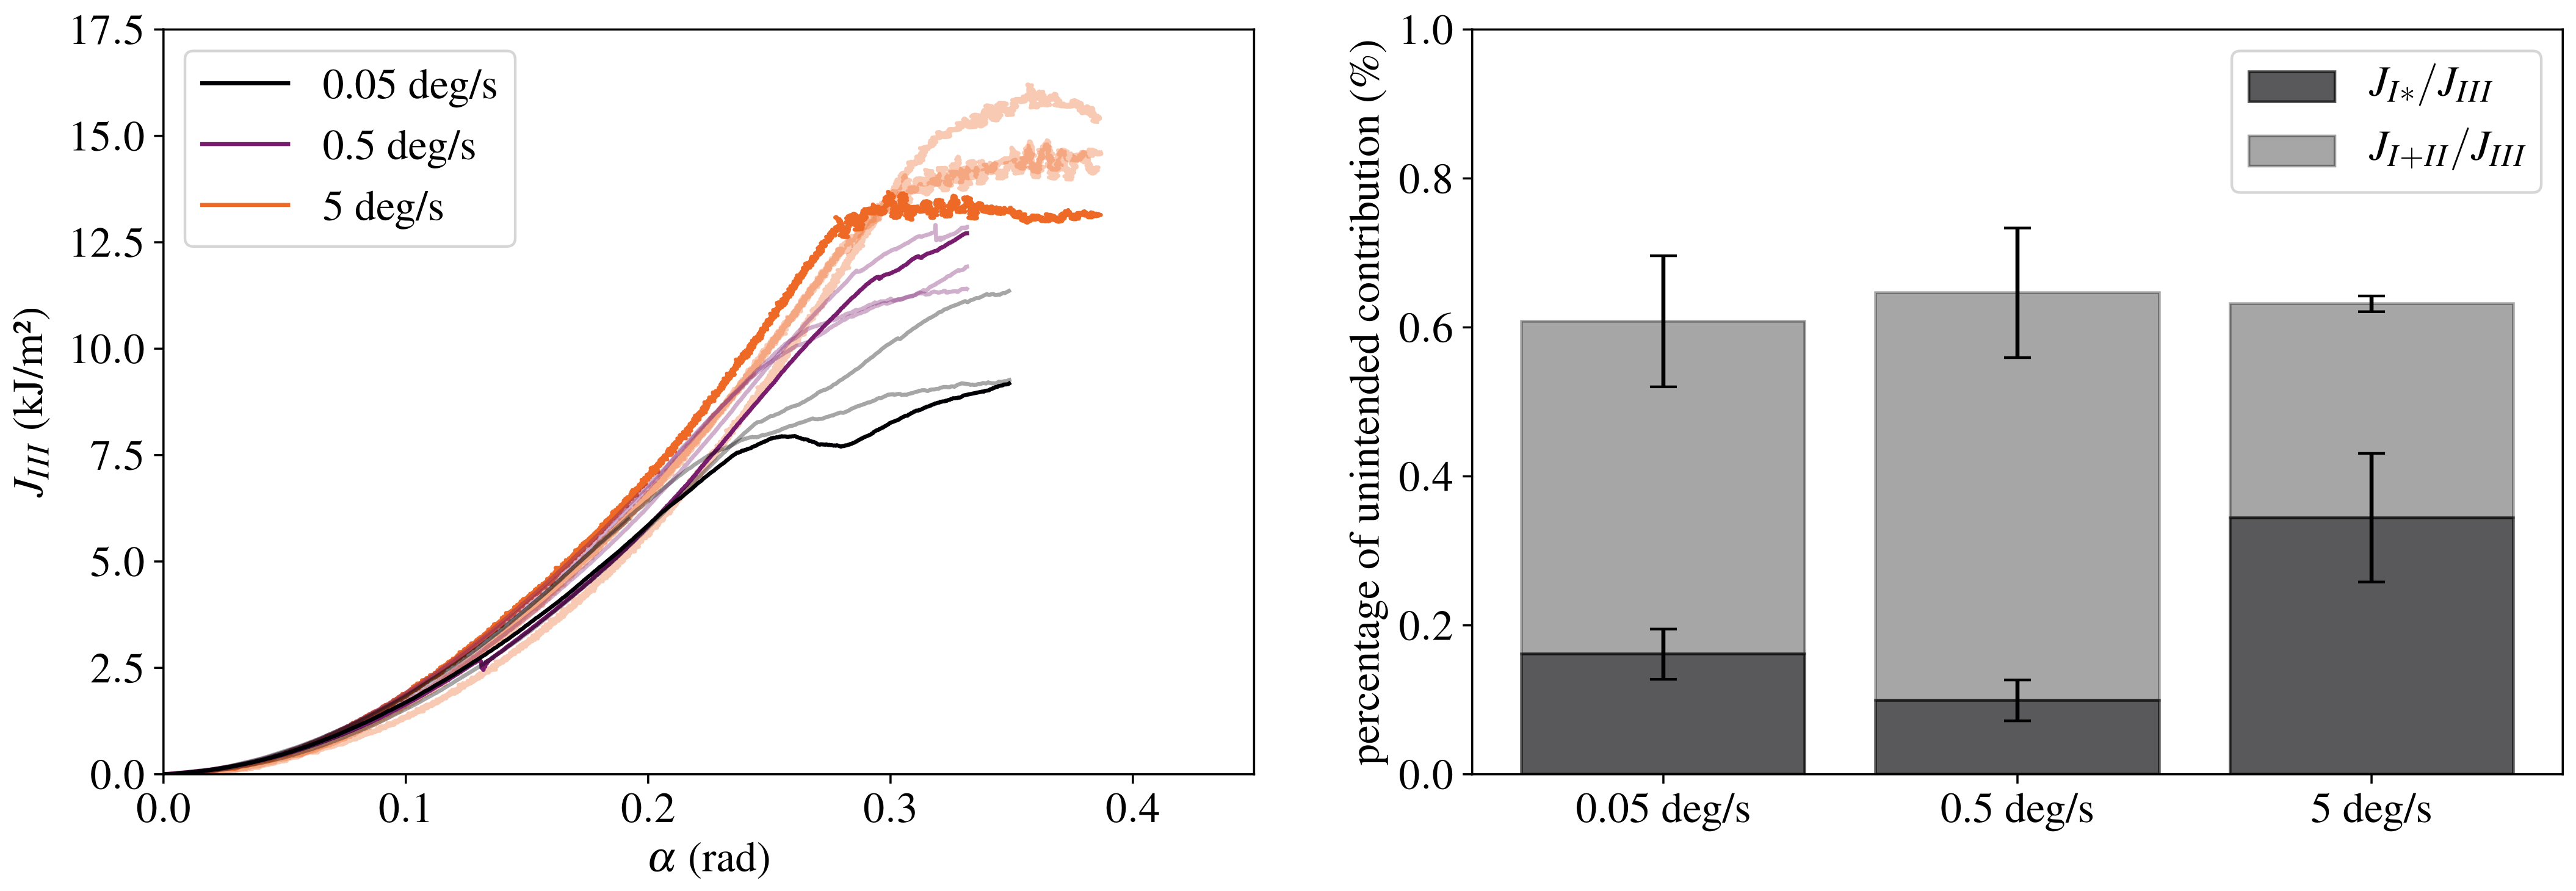
In Figure 12, the mode III ERR according to Equation (6) over the rotational angle α and the relative influence of the unintended contributions to J at the onset of fracture according to Equation (7) are displayed for each loading rate. Here, it can be observed that, during the experiments at 0.05 deg/s and 0.5 deg/s, the ERR does not reach a steady plateau throughout the experimental investigation, already indicating that the ERR is rising with crack propagation, yielding a resistance curve (cf. Section 4.5). It can also be observed that the unintended contributions from the transverse moments are indeed negligible at the point of fracture, which is in good agreement with the results of prior investigations [10,15,27,28]. This also allows the conclusion that the BFS measurement, although affected by a transverse force, is not influenced significantly by the moment components responsible for the unintended contributions to J.
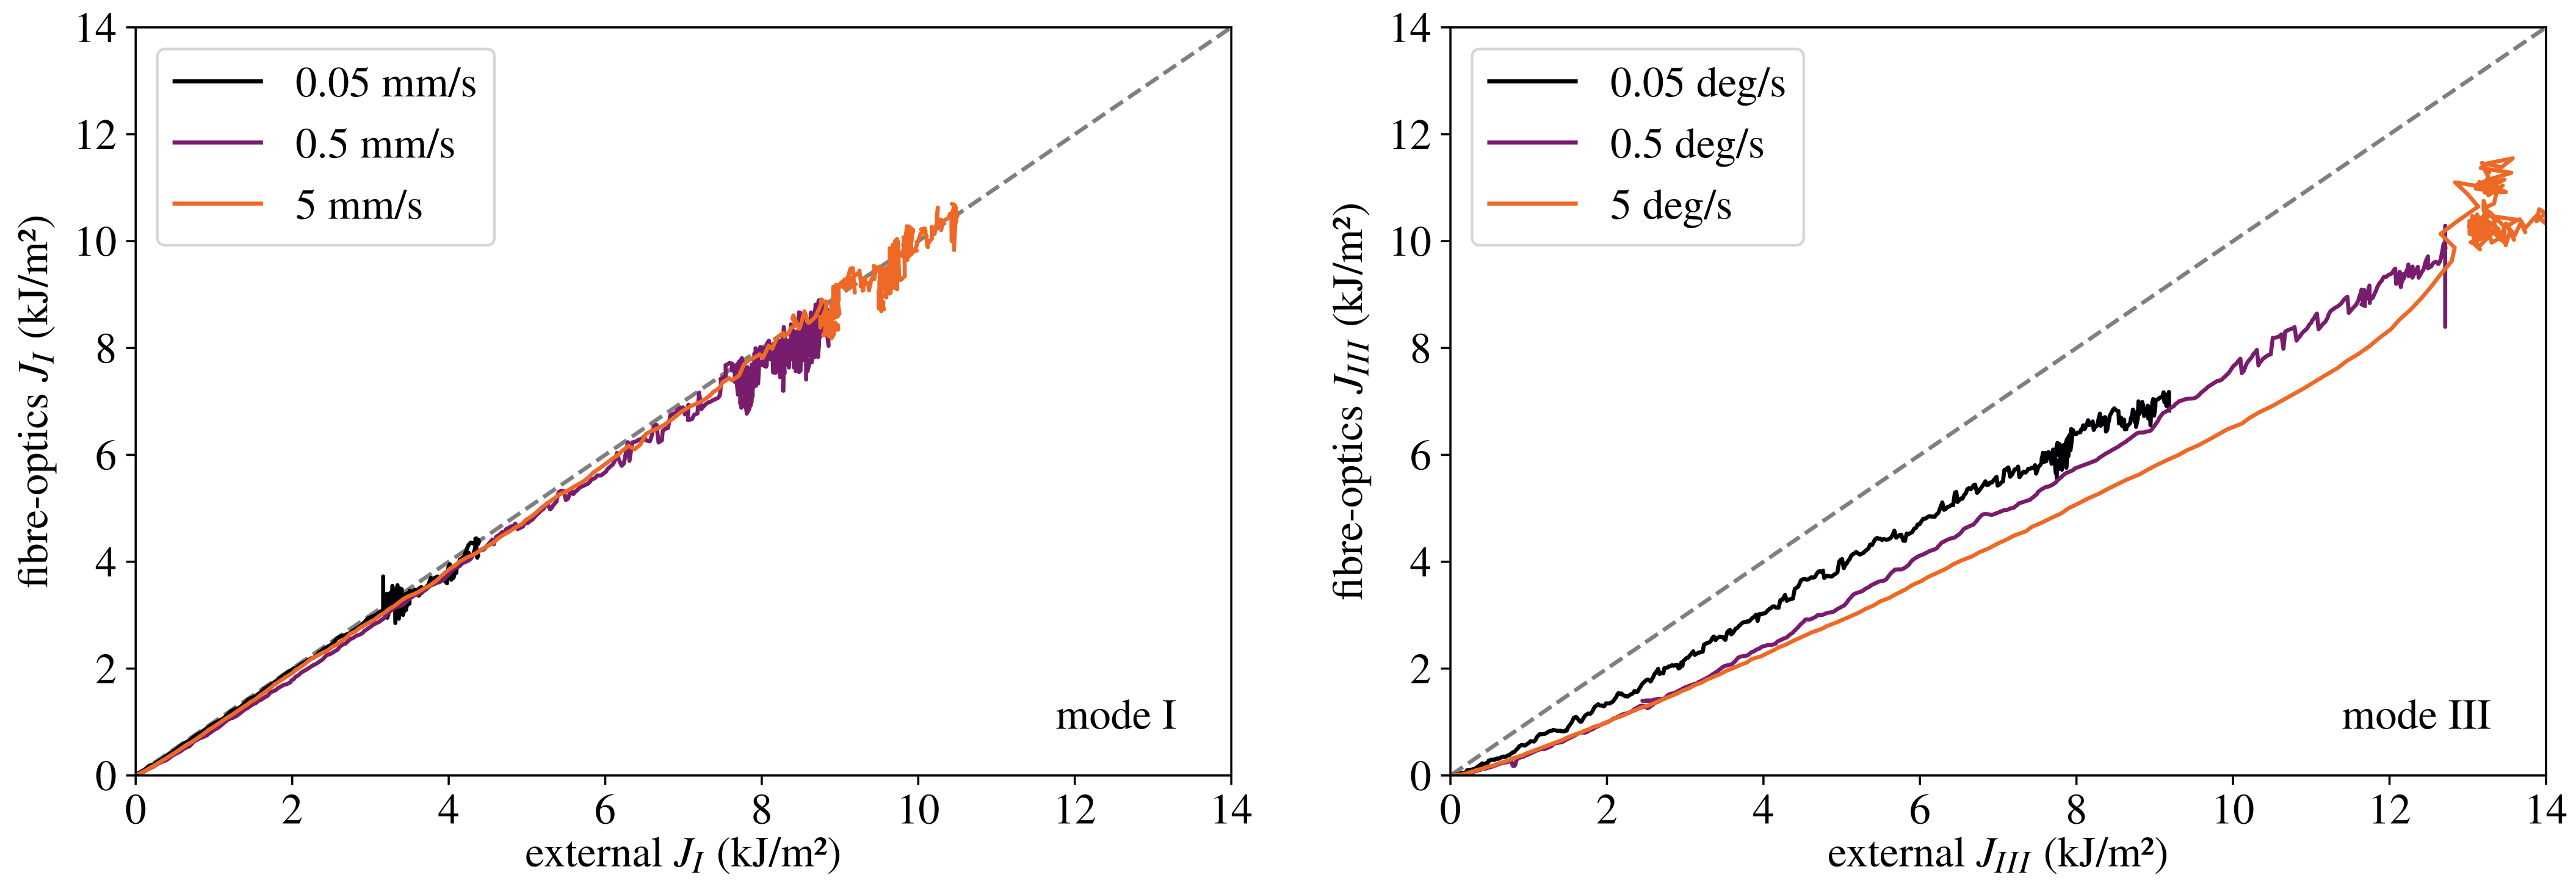
Figure 13 presents the values for J obtained from Equation (5) and (6) in comparison to the value obtained from the BFS measurement according to Equation (13) for the mode I and mode III experiments. Here, a good correspondence between both methods of evaluation can be seen for pure mode I loading. For the mode III experiments, however, it can be observed that the value for J according to Equation (6) and the BFS measurement differ greatly from another, with the BFS J, Equation (13), being approx. 20% lower than the externally measured value throughout the experiments. As hinted at earlier, this is likely due to the transverse force (cf. Figure 9), which was observed during the post-processing of the BFS measurements but not recorded during the experiments. This is also undermined by the fact that both the transverse force and the difference between the evaluation methods are the smallest at the loading rate of 0.05 deg/s; for the tests at 0.5 deg/s and 5 deg/s, in which the transverse force is larger, the difference also increases. As the external measurement seems to be strongly influenced by the friction within the lateral slides, the results from the BFS measurements clearly show that the evaluation of the ODCB test has to be revised for the testing of soft, rubber-like adhesive layers in future investigations.
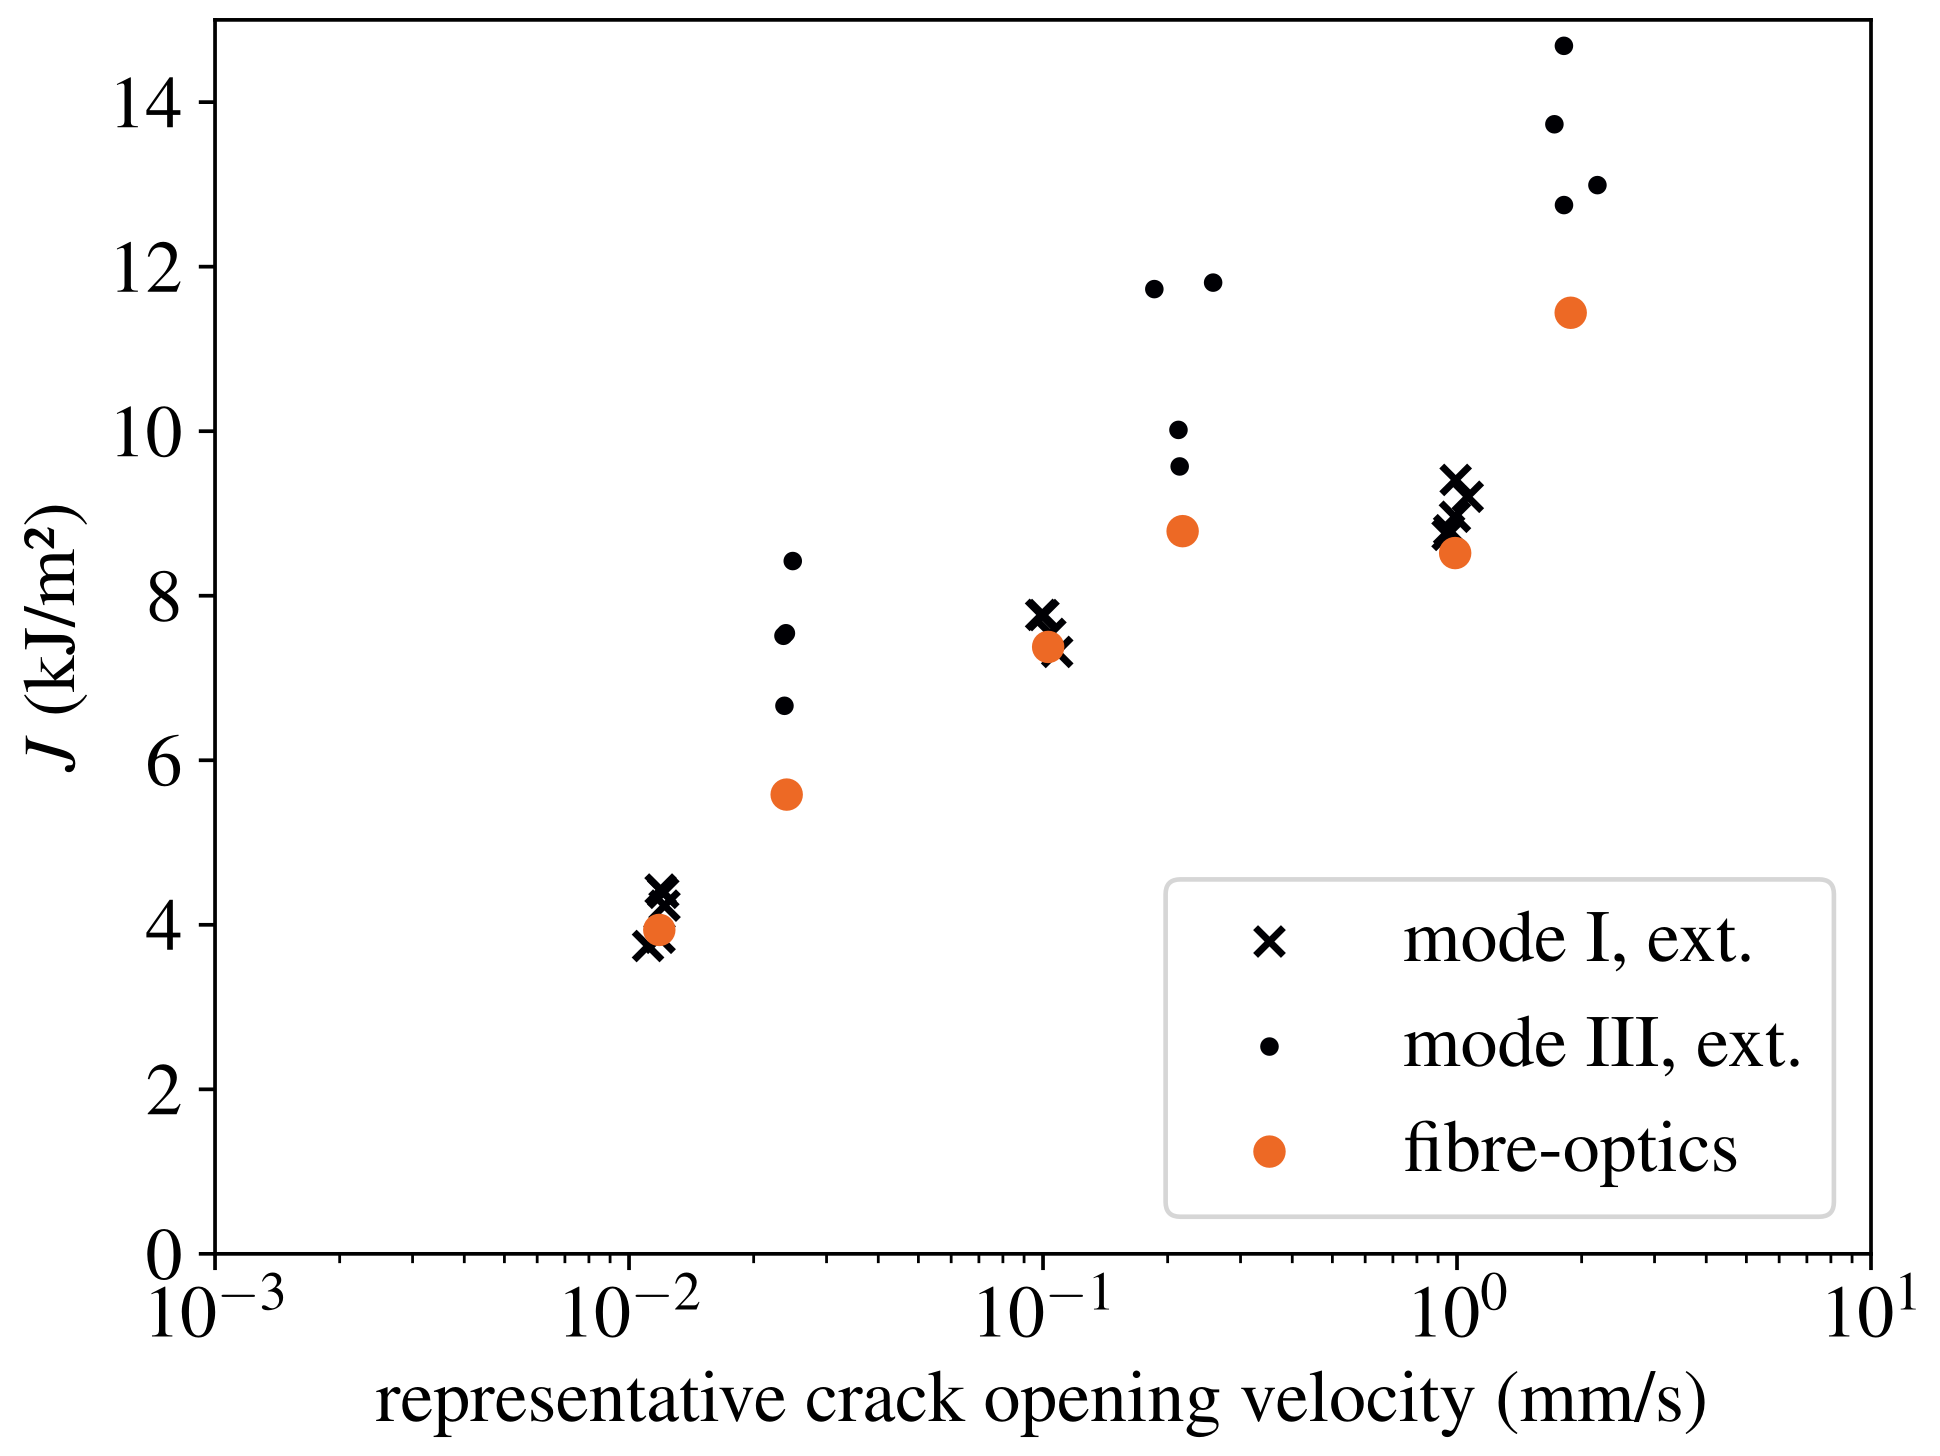
To estimate the dependency of J on the loading rate and loading mode, the values of J at crack initiation are displayed over the representative crack opening velocity in Figure 14. The representative crack opening velocity was determined from a linear regression of the COD vs. time in the initial linear region of d J / d δ i , t , akin to the approaches of Schmandt and Marzi [13] and Schrader and Marzi [10], respectively. Hence, it shall be highlighted that the representative crack opening velocity is determined locally at the crack tip from the COD measurements and cannot be easily assessed from the external loading rates before testing. Generally, a large discrepancy between the mode I and mode III results is visible if the externally measured values for J I and J I I I are considered. However, the values obtained from the BFS measurements indicate that the differences between mode I and mode III mainly result from neglecting the transverse forces due to friction in the lateral slides. Hence, given the limitations of this study, a similar rate-dependency is obtained for both modes I and III, indicating that the ERR could be independent of loading mode, as was also hypothesised by Loh and Marzi in [15]. This also correlates with the large deformations at the crack tip observed during the mode III experiments, which ultimately yield a local peel load at the crack tip at fracture initiation.

4.5. Crack Propagation, Resistance Curve Behaviour and Process Zone Length

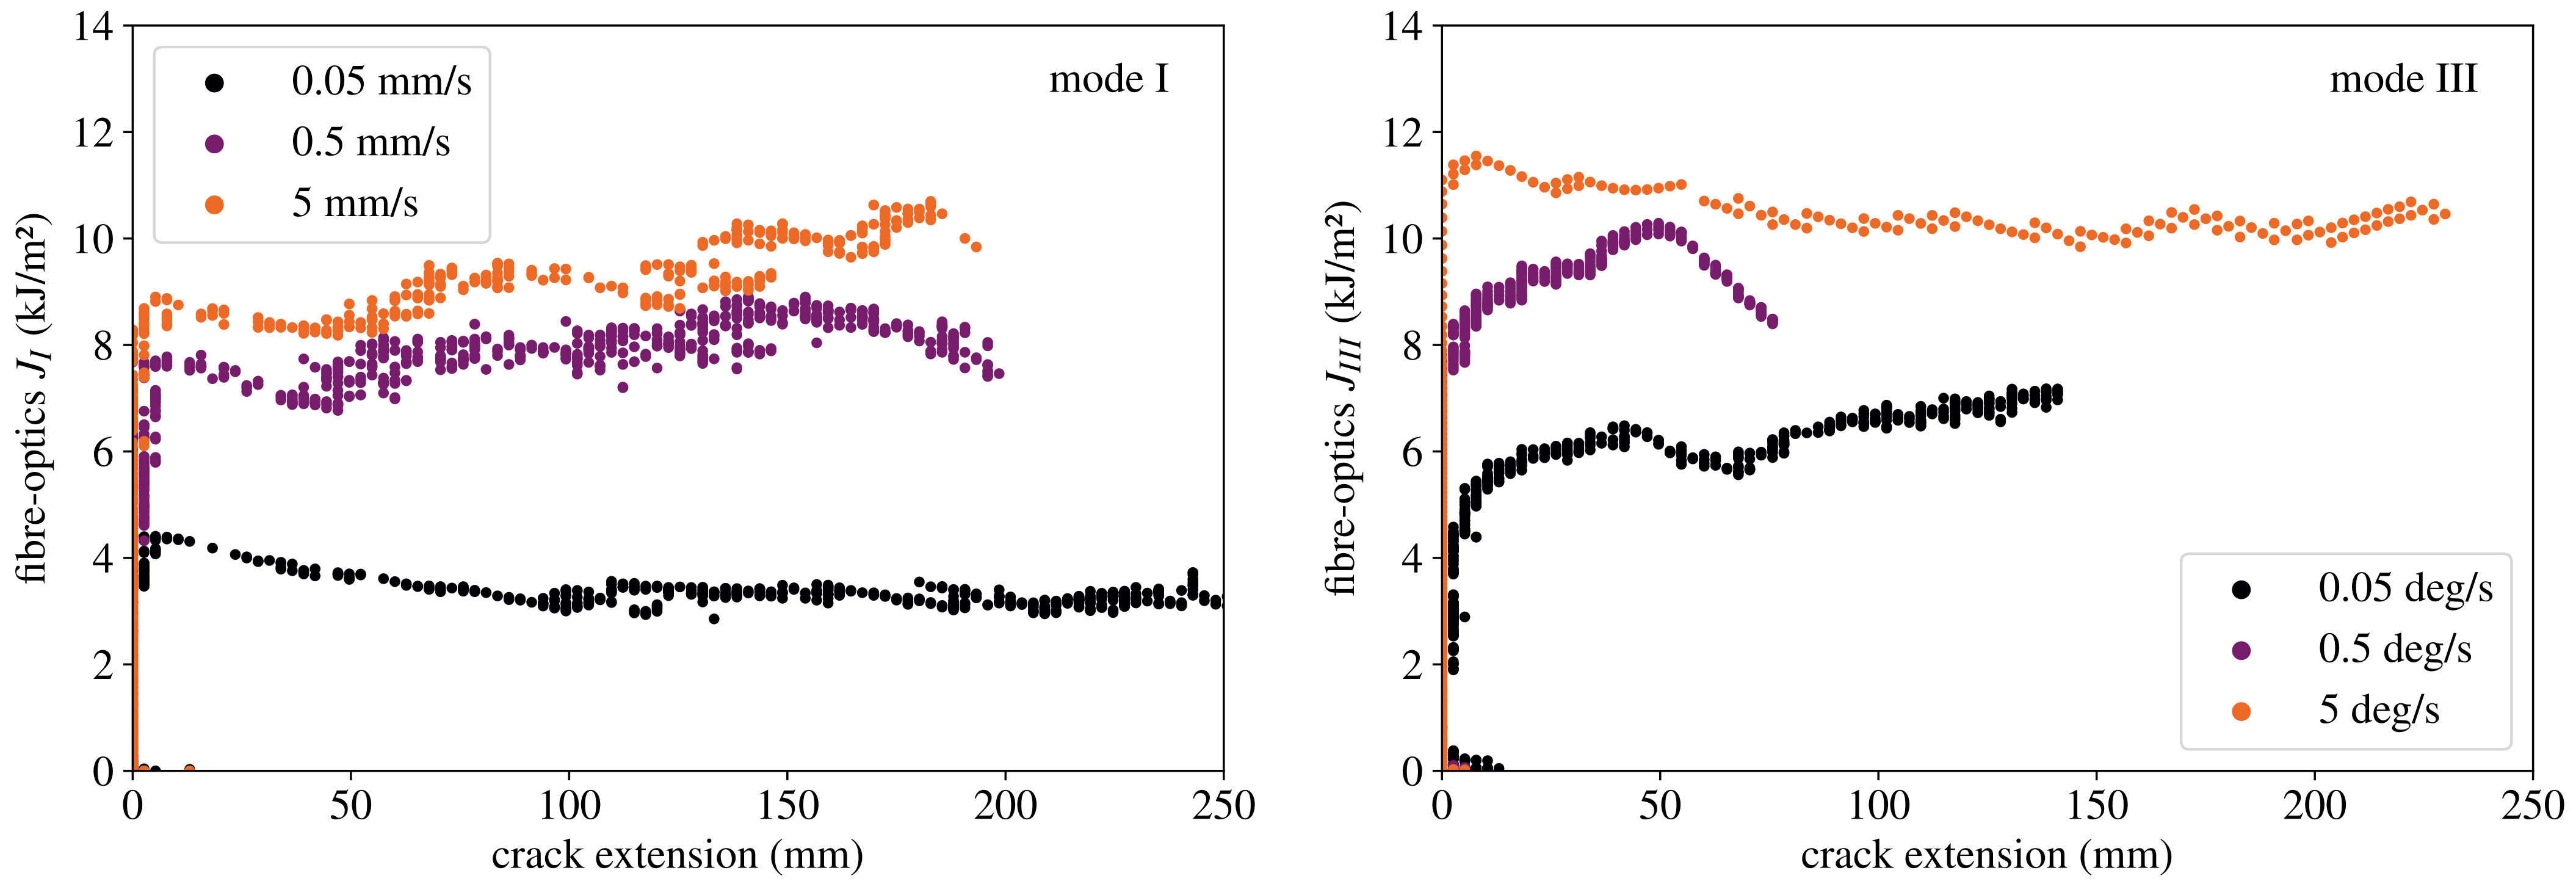
The resistance curves for all tested specimens are shown in Figure 15. Whereas a constant ERR can be observed in the mode I experiments during crack propagation, the ERR increases with crack extension in the mode III experiments at the lower loading rates of 0.05 deg/s and 0.5 deg/s. Due to the presence of crack extension before reaching the critical value of J, the cohesive traction cannot be calculated from d J / d δ I I I , t , Equation (4), for these experiments, as although the crack already started to propagate, the cohesive traction would be unequal to nought until the J-plateau was reached.
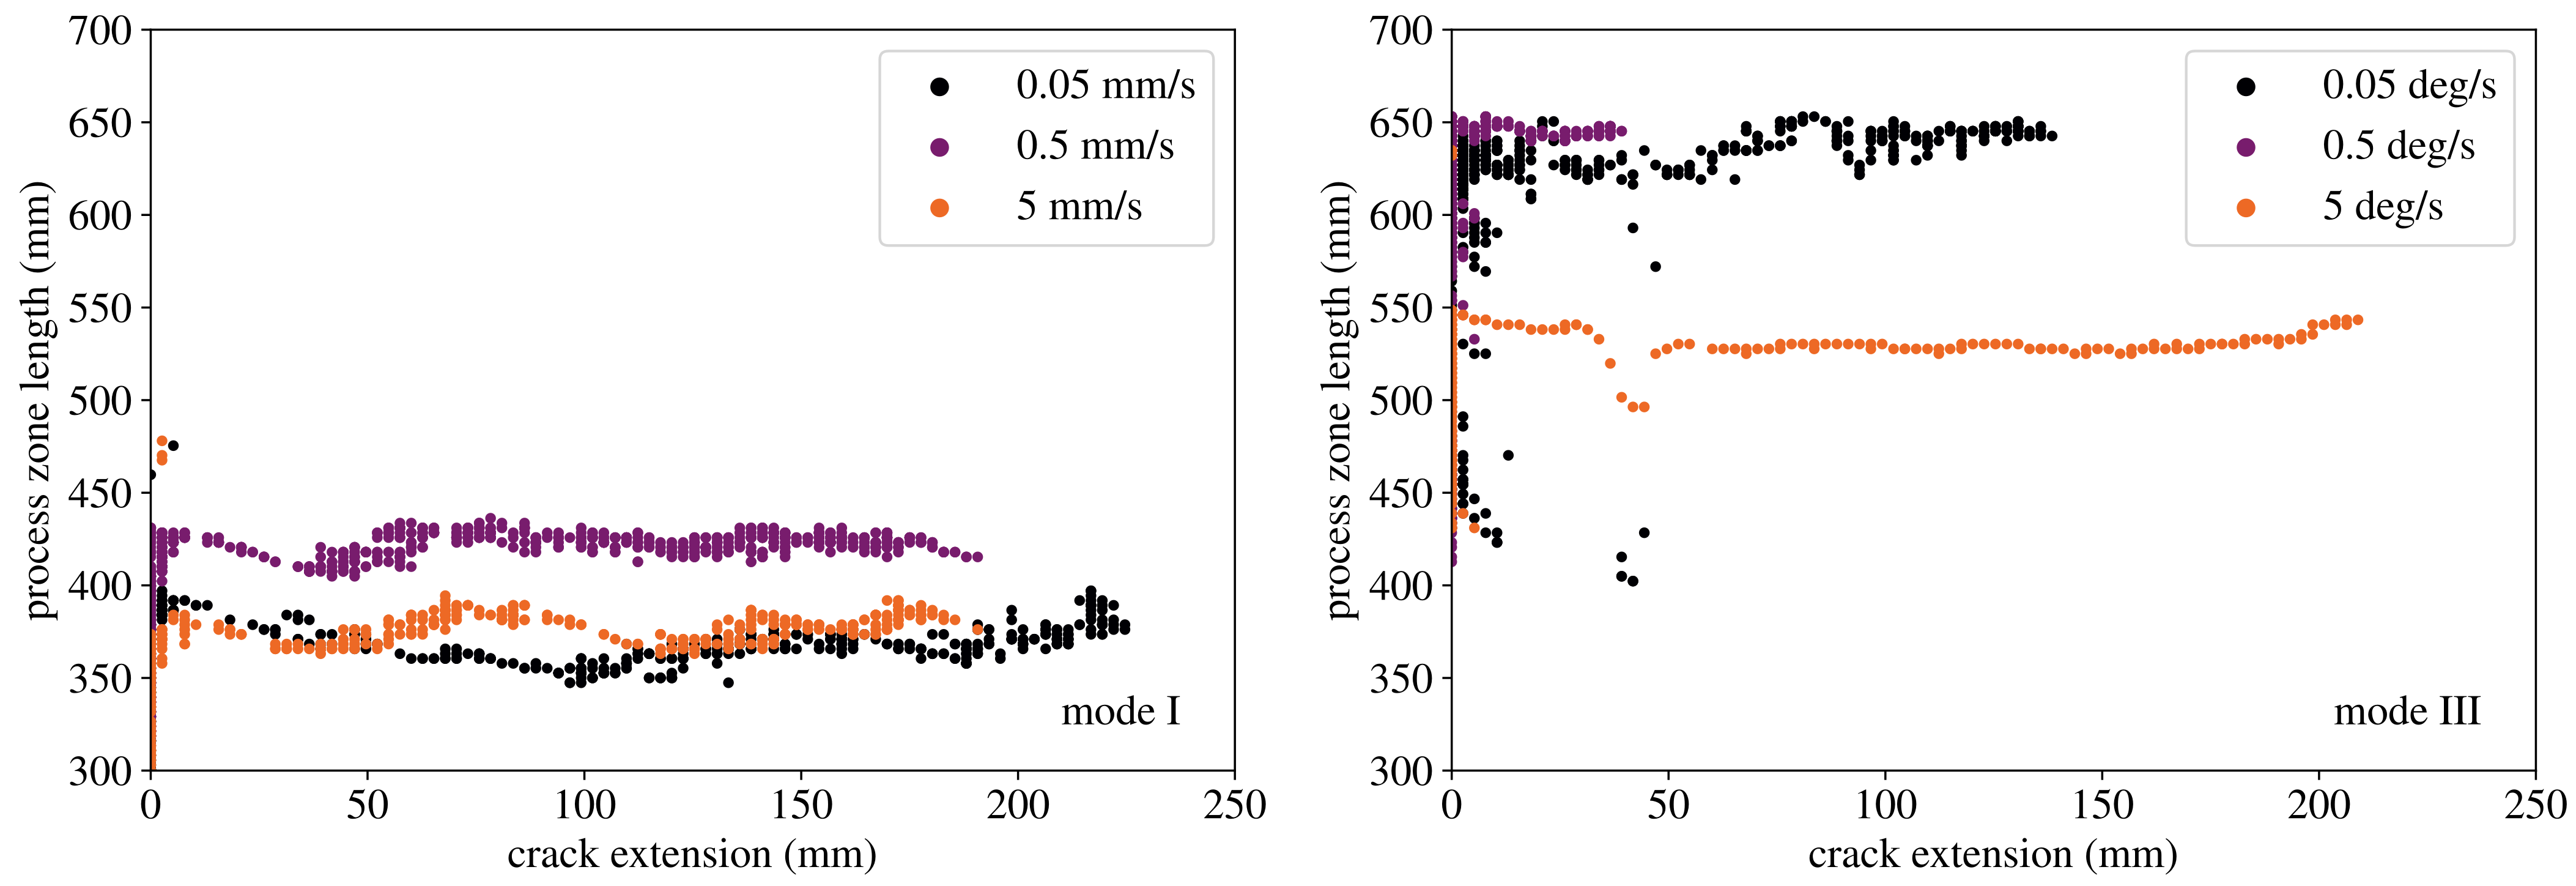
The process zone lengths obtained from the BFS measurements are shown in Figure 16 over the measured crack extension. Generally, the length of the process zone increases until the start of crack propagation and remains constant over the experiment in good approximation in all cases, indicating stationary conditions behind the crack tip even in the case of an observed resistance curve. During mode I testing, the process zone length seems to be largely independent of the loading rate. In the mode III experiments, however, it is noticeable that the process zone length drastically decreases at the loading rate of 5 deg/s, which can likely be ascribed to the partly adhesive failure during the experiments at 0.05 deg/s and 0.5 deg/s. In these experiments, the partly adhesive failure before cohesive crack propagation causes a decrease in the stiffness of the joint and, hence, larger process zones. Additionally, it should be noted that the process zone lengths in mode III are significantly larger than in mode I at the start of crack propagation, which can generally be related to a lower stiffness of the adhesive in shear than in peel.
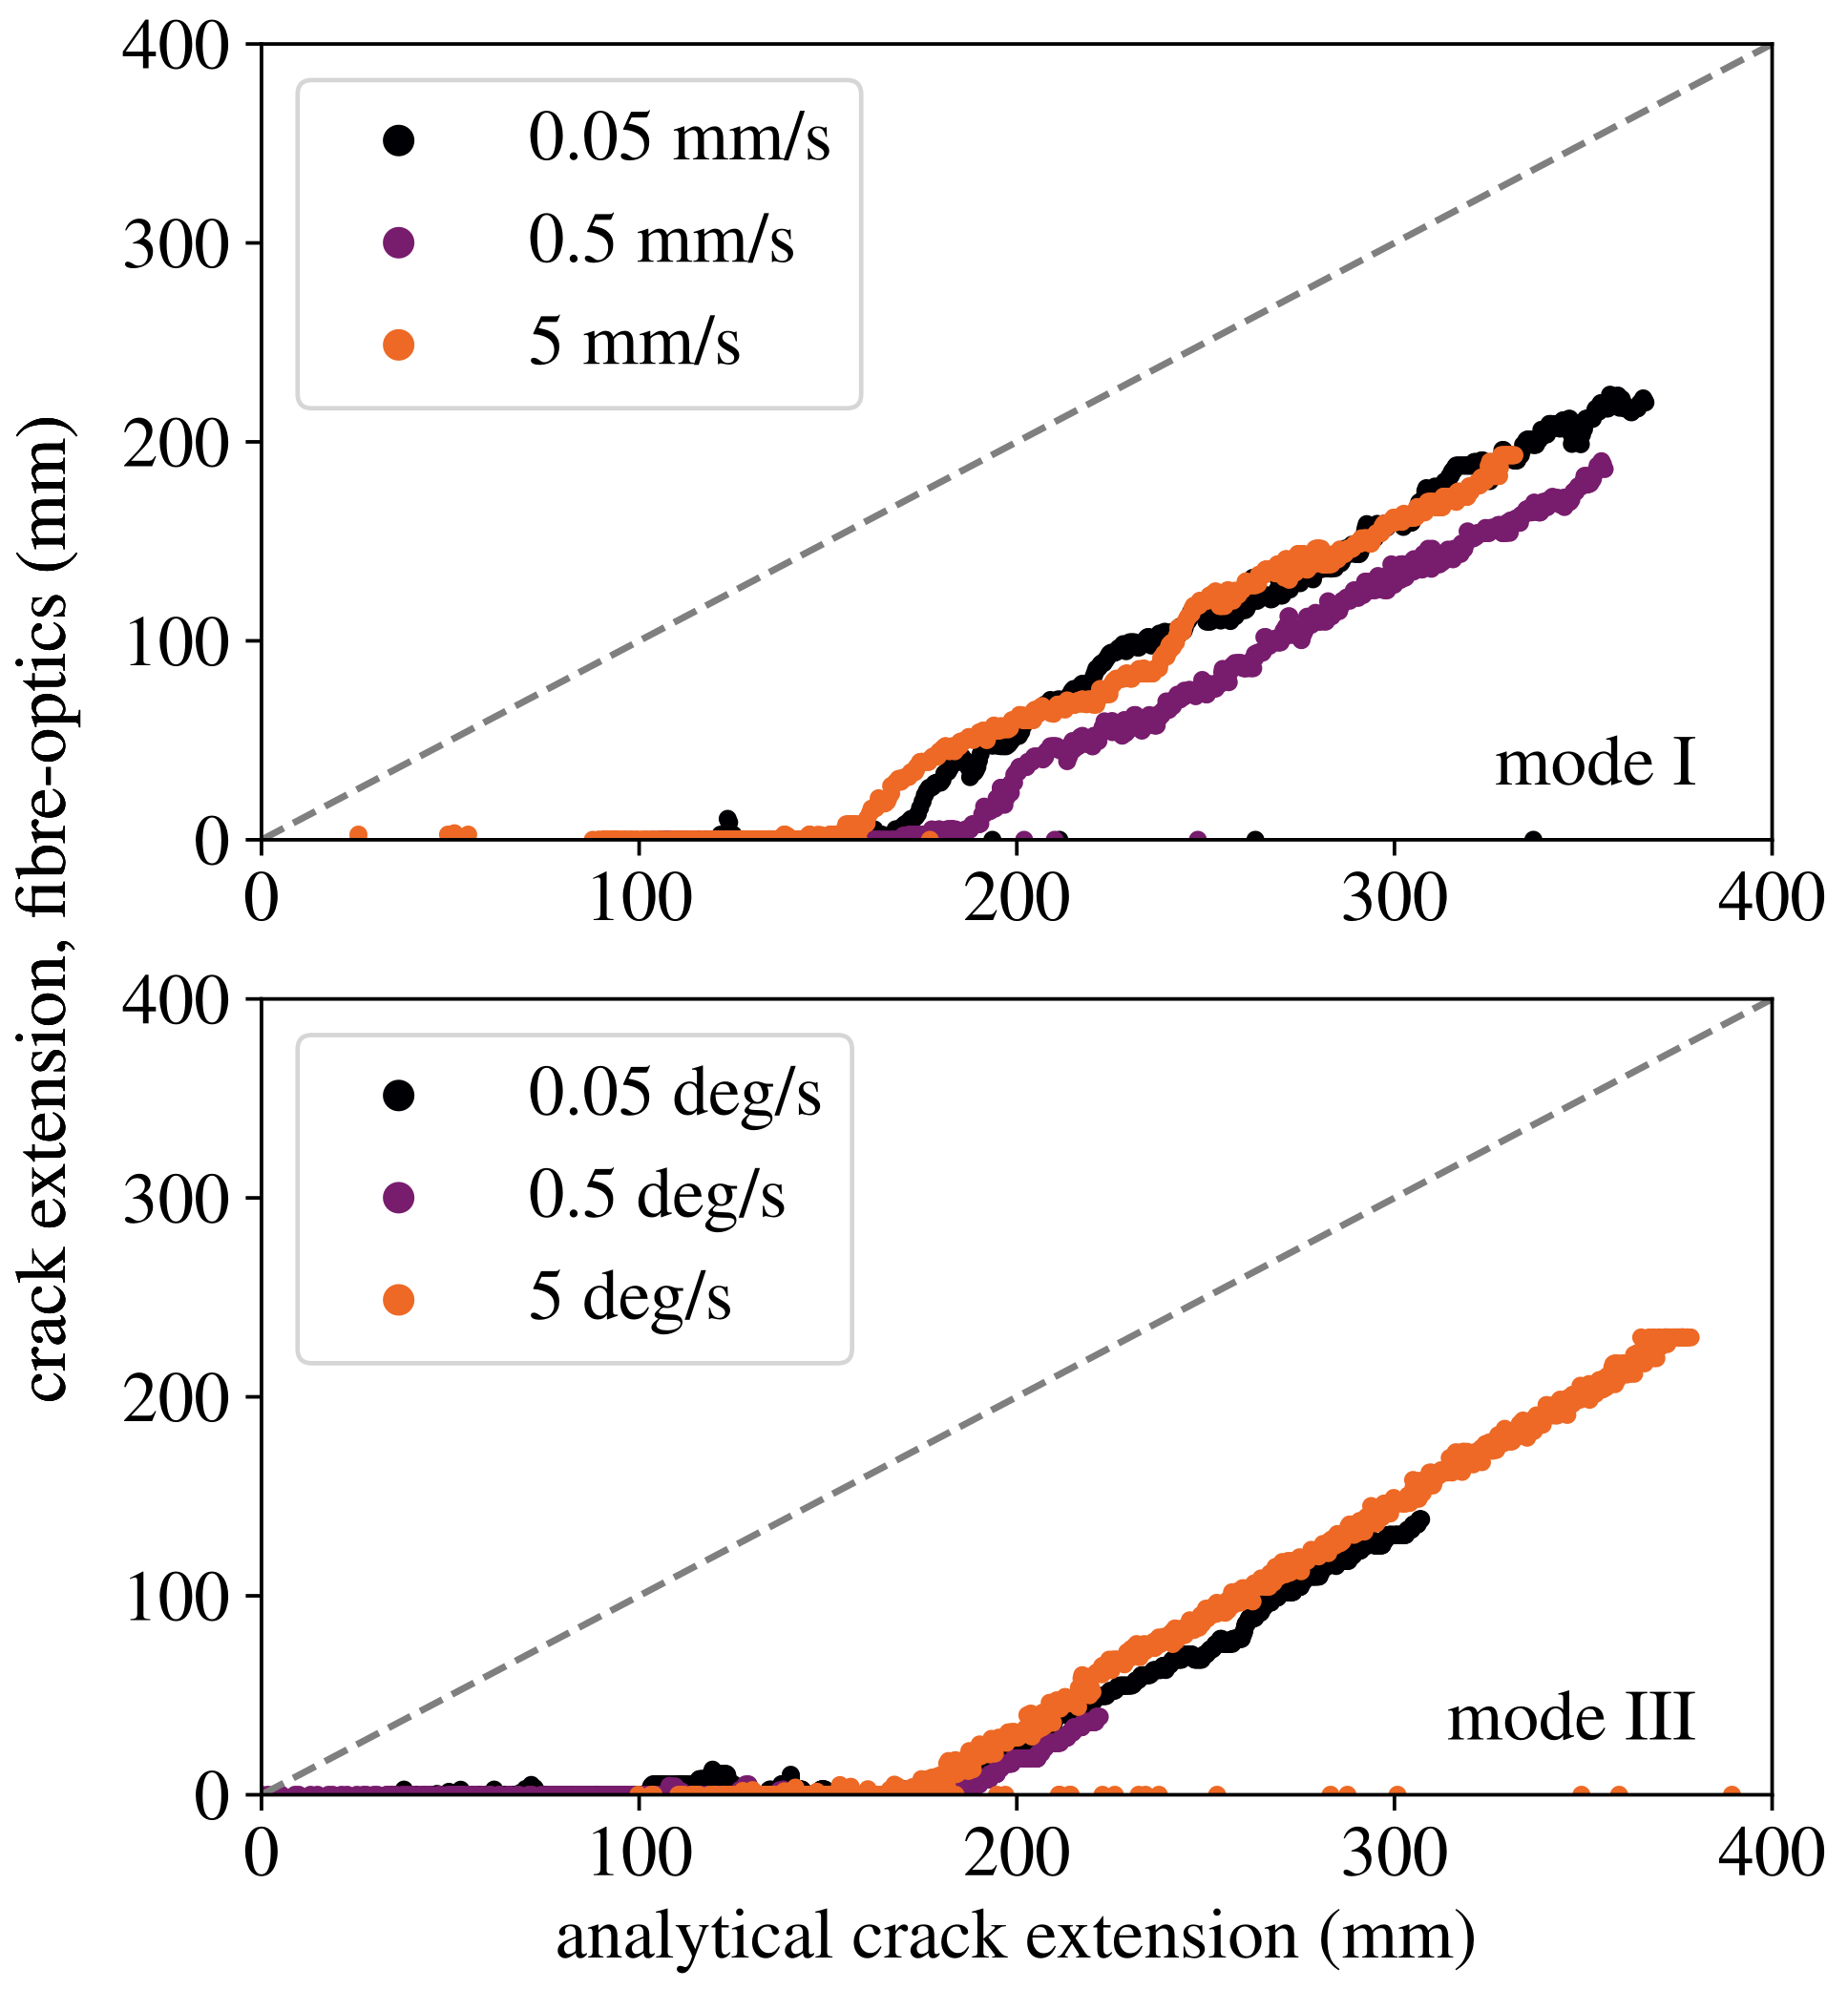
As stated earlier, a comparison between the crack length obtained from the BFS measurement and the analytical crack length according to simple beam theory is sought. In Figure 17, the crack extension according to the BFS measurement is displayed over the analytical crack extension during crack propagation. It can be observed that the slope of the curves is relatively close to one in the range of crack propagation in both modes I and III, which correlates with the results of Schrader et al. [17], who also found that the crack extension can be approximated for soft, rubber-like adhesive systems with simple beam theory assumptions. Figure 17 also shows that the initial crack length is heavily overestimated by the analytical approach, with the error being around 160 mm in mode I and 180 mm in mode III, which, in all cases, is significantly larger than the initial crack length. As this offset seems to be constant, however, it could be argued that analytically calculating the equivalent crack length would be possible for the given soft, rubber-like adhesive system if the crack length were corrected for the determined offset. Hence, it could be argued that G-based evaluation methods relying on a corrected beam theory approach could also pose an option for the determination of the ERR for soft, rubber-like adhesive systems. However, it shall be stated that using the J-integral approach of determining the ERR is likely still favourable in this case, as it allows determining the ERR without the necessity of inferring virtual crack extensions or similar correction factors.
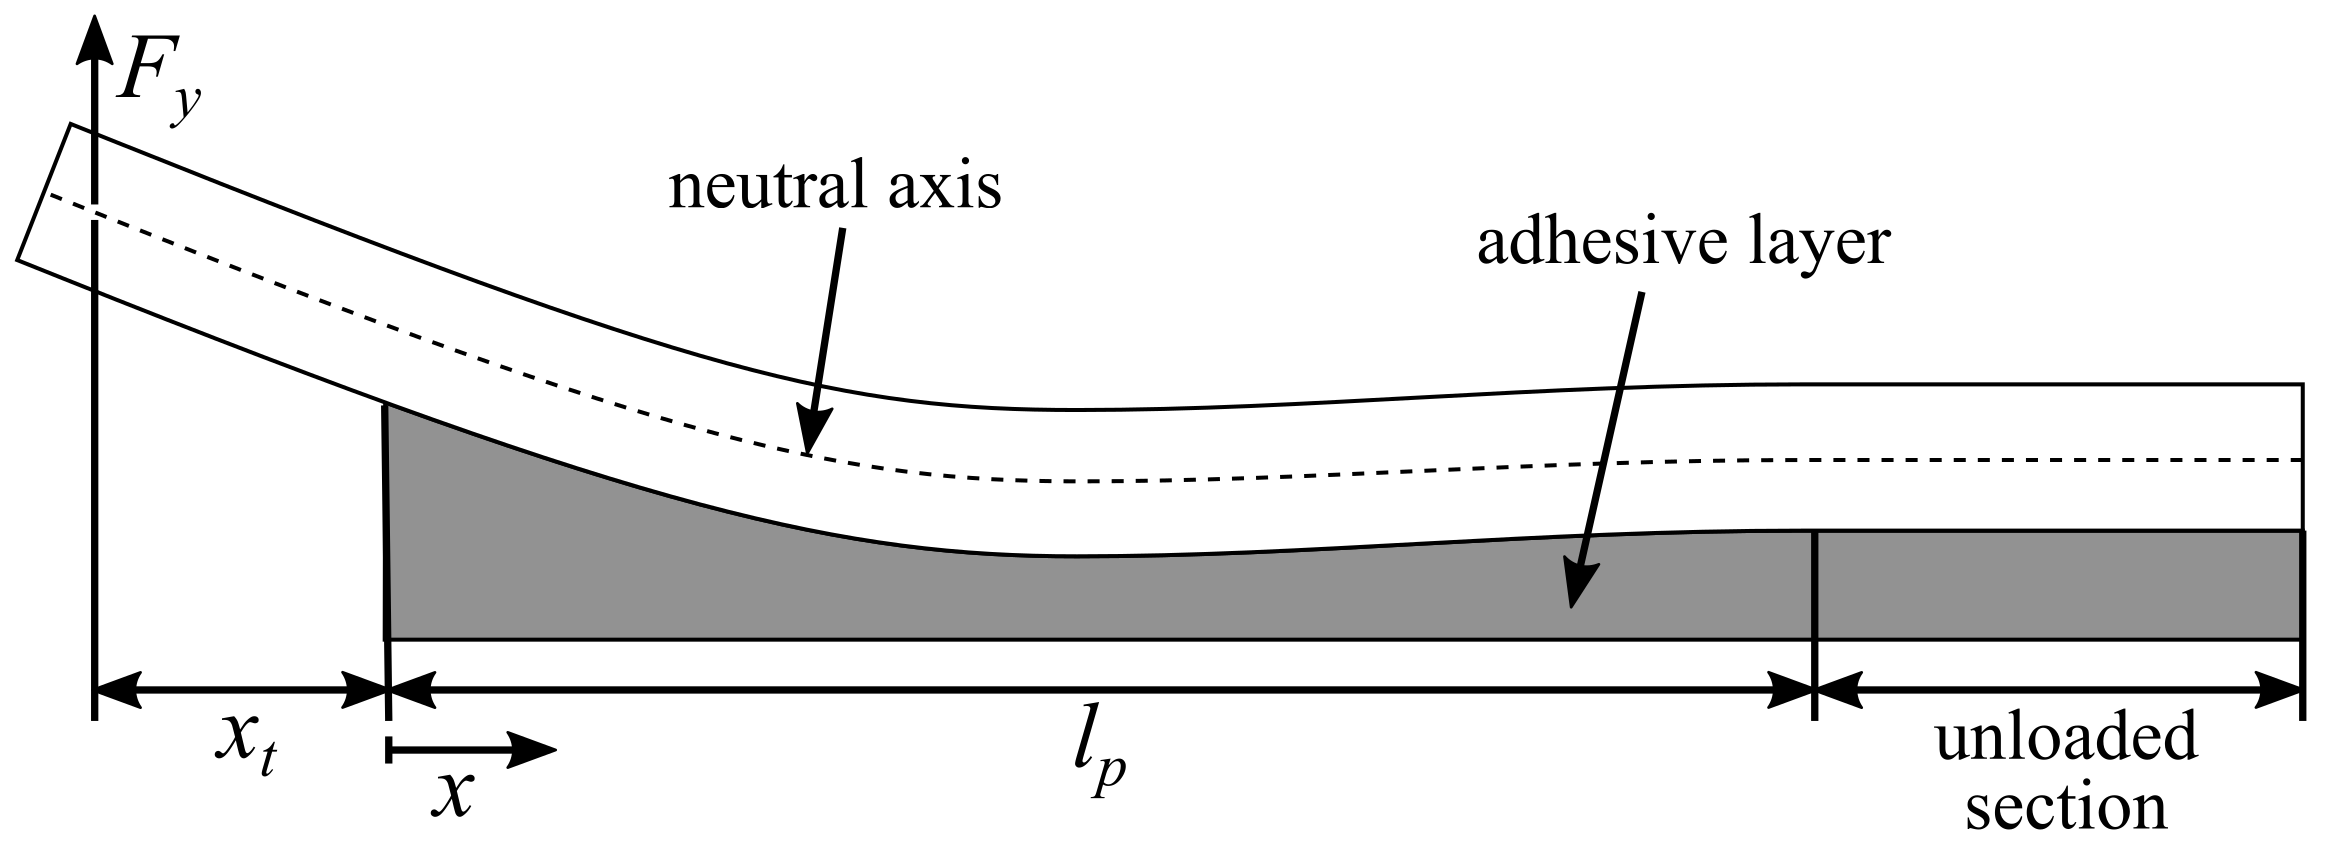
It is advised that future studies investigate the influence of the specimen geometry on the process zone length and crack propagation more closely. As stated earlier, if the process zone reaches the end of the specimen, the assumption of an unloaded end behind the J-integral evaluation of the cohesive traction is violated (cf. Equation (3)). A future experimental investigation could, hence, be valuable, especially for the practical design of joints with shorter adhesive layers.

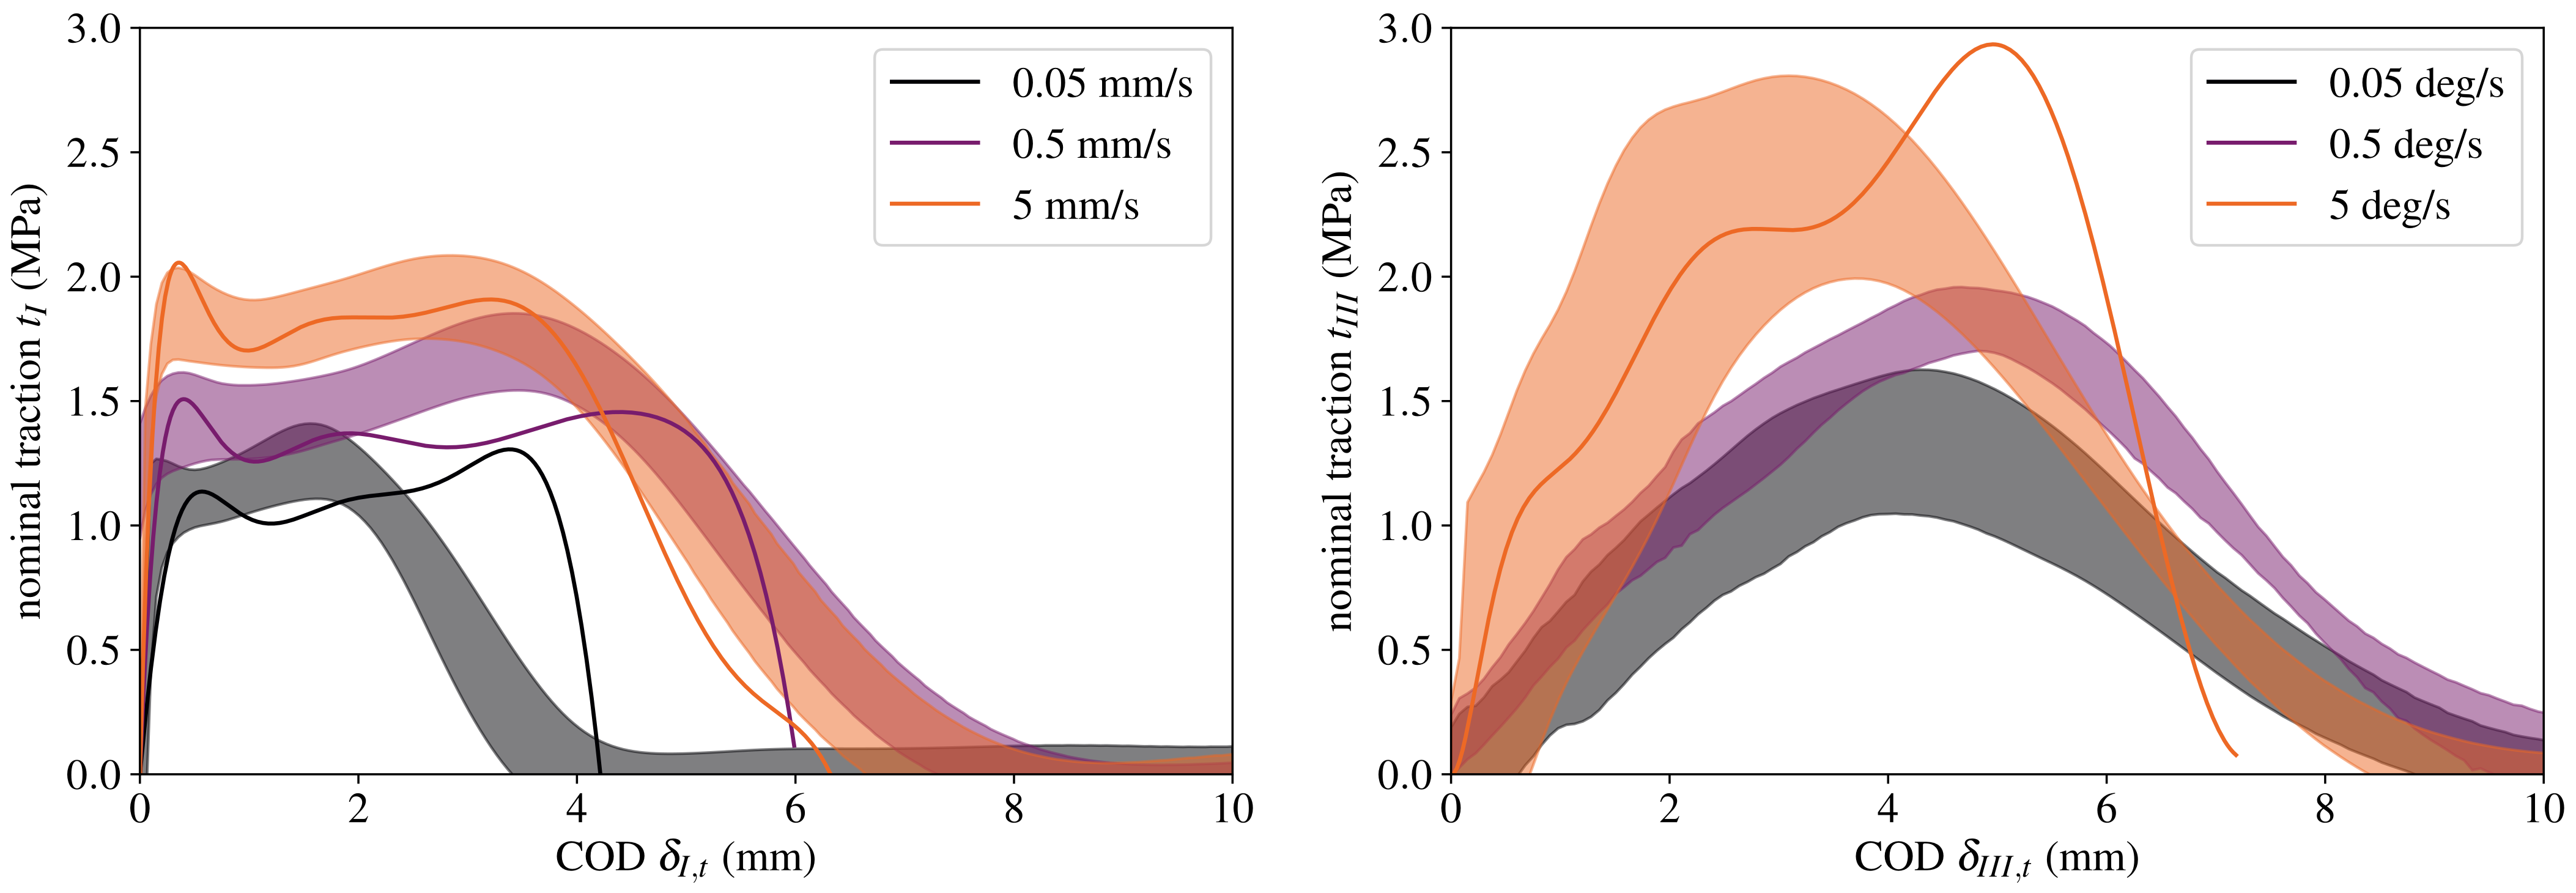
4.6. Cohesive Traction in the Adhesive Layer

The traction at the initial crack tip obtained from the “conventional” method according to Equation (4) (bold lines) as well as the mean cohesive traction in the complete adhesive layer according to the BFS measurements, cf. Equation (12), (scatter bands) is shown in Figure 18 for both modes I and III. It can already be observed that the measured cohesive traction changes with loading mode, as the initial stiffness of the joint is significantly lower in mode III than in mode I. Furthermore, the measured cohesive traction is dependent on the loading rate in both cases, already violating the underlying assumption of Equation (4) that the cohesive traction must strictly depend only on the deformation and not on the deformation rate. As can be observed, the traction obtained from d J / d δ I , t approximately correlates with the BFS measurement in pure mode I, as both the stiffness of the adhesive layer and the plateau stress fit well with each other. For the lowest loading velocity, however, a clear discrepancy in the range of falling traction can be observed, which can probably be related to an increased influence of material inhomogeneities or creep effects in the process zone on the material behaviour. At the loading rates of 0.5 mm/s and 5 mm/s, their influence may be less pronounced in the process zone, which could explain the better agreement between the BFS measurement and d J / d δ I , t . Overall, the rough correspondence between methods of traction determination correlates with the investigations of Rosendahl et al. [14], who also found that calculating d J / d δ I , t can be used to approximate the cohesive traction of soft, rubber-like adhesive layers in pure mode I.
For the mode III experiments at 0.05 deg/s and 0.5 deg/s, as hinted at earlier, the cohesive traction cannot be calculated from d J / d δ I I I , t due to the observed resistance curve behaviour. In contrast, the BFS measurement can still be used to calculate the cohesive traction within the adhesive layer in these experiments, which is a clear methodological advantage. Additionally, at the highest mode III loading rate of 5 deg/s, the traction obtained from d J / d δ I I I , t differs greatly from the BFS measurements, allowing the conclusion that the determination of the cohesive traction from d J / d δ I I I , t is not feasible in mode III for such soft, rubber-like adhesive layers.
It is generally assumed that the differences between both methods of evaluation arise from violating the underlying theoretical assumptions behind the J-integral method. The BFS measurement, however, can circumvent these assumptions and, by capturing the deformation behaviour of the complete specimen, allows the determination of the traction at the crack tip and along the complete cohesive zone from beam theory without neglecting the influences of energy dissipation in the process zone or influences of the loading rate on the cohesive traction. It can therefore be assumed that the determination of cohesive stresses using Equation (4), i.e., d J / d δ i , t , for such soft, rubber-like adhesive layers is prone to error and can, within the limitations of this study, only be considered an approximation in pure mode I loading. Furthermore, the goodness of the approximation cannot be estimated a priori, as neither the rate development nor the influence of dissipative effects in the process zone on the material behaviour is known if the traction is calculated from Equation (4).
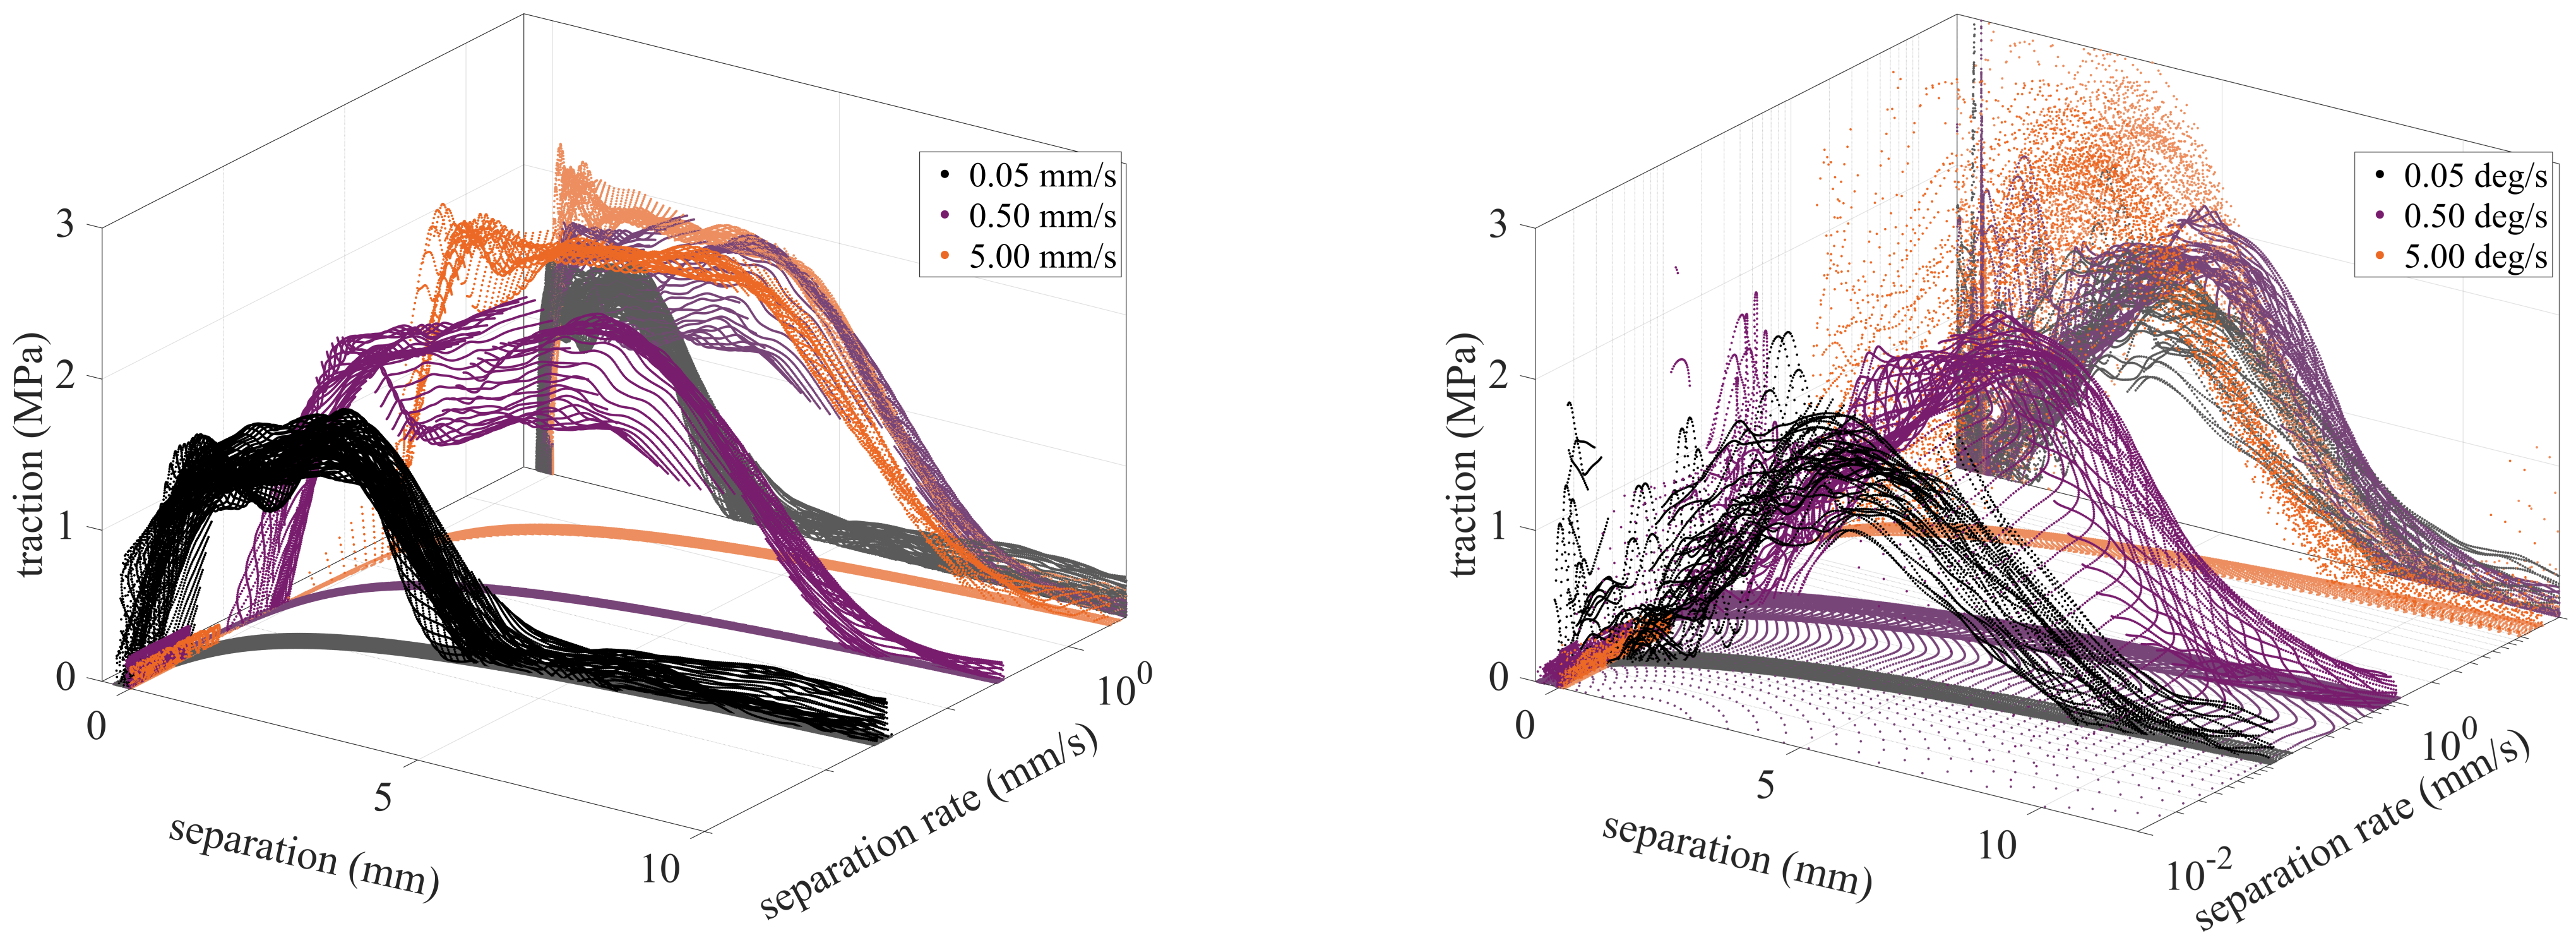
Another benefit of the BFS measurement shall be noted: As stated earlier, the BFS measurement also allows determining the separation of the adherends at each point of the optical fibre from the curvature of the adherends at discrete measurements in time. Hence, by calculating the time derivative of the measured separation at each measuring point along with the specimen, the separation rate within the complete adhesive layer is obtained, also allowing the investigation of the rate-dependency of the joint’s behaviour. In Figure 19, the cohesive traction at each point of measurement is displayed over the separation and separation rate. Interestingly, the differences between the measurements at each measurement point seem to be very small, indicating that the cohesive traction is, in good approximation, independent of the position along with the specimen and that separation and separation rate are relatively similar for each point along with the specimen throughout the measurement. Hence, it can be concluded that the modelling of the joint can theoretically be performed relatively straightforwardly with a rate-dependent cohesive law.
Although we were unable to implement the traction obtained from the BFS measurement into a cohesive zone model within the scope of this study, a future implementation is deemed worthwhile. With a rate-dependent cohesive zone model formulated from the measured values, it might be possible to better reproduce the behaviour of the adhesive joint. It is also assumed that, if observed, it might even be possible to approximately reproduce stick-slip or resistance curve behaviour due to the accurate determination of cohesive traction and separation rate from the BFS measurement. However, these assumptions remain to be addressed in the context of a future simulative study.

4.7. Methodological Critique

As discussed earlier, a distinctive feature of the presented methodology using BFS measurements for the investigation of the fracture behaviour of adhesive layers is that both the nominal traction within the adhesive layer as well as the current separation and the separation rate can be obtained for a large amount of measuring points along with the complete specimen. This is particularly important for the numerical modelling of the fracture behaviour using cohesive zone models, as the conventional method of using the J-integral to obtain the cohesive traction cannot be used for the soft, rubber-like adhesive layer under investigation because, as shown, the fundamental assumptions of the method are violated. Hence, the results of this study heavily imply that the use of BFS measurements for the investigation of adhesive joints may serve as a window to a better understanding of their fracture behaviour.
However, it has to be stated that the use of BFS measurements, especially for the almost 1 m long adherends used in this study, requires a very high experimental effort for specimen preparation and investigation. As there are separate measured values for each measurement point on the optic fibre, a large amount of data has to be evaluated. Furthermore, the numerical derivation of the measurement data to obtain cohesive traction produces large amounts of numerical noise, which must carefully be removed using suitable filters before processing the data. As a result, the evaluation of the measurement data is very complex and time-consuming.
As just described, filtering the BFS measurement data for further processing is a major challenge in evaluation. It could therefore be appropriate to first approximate the measured beam curvature using an analytical relationship (polynomials, exponential functions, etc.) to facilitate numerical integration and differentiation. We have refrained from this in the context of this study to introduce as few assumptions as possible into the evaluation of the data a priori. In future studies, however, it is argued that the evaluation process could be simplified by carefully selecting appropriate fit functions, e.g., [24,31].
Finally, we would like to state that the determination of the beam curvature with BFS offers additional possibilities in other areas of application within fracture mechanics testing, which have not—or only to a limited extent—been addressed in this study: it is argued that besides the primary focus of this work, i.e., the determination of the cohesive traction, changes in the beam curvature due to damage evolution behind the crack tip as observed by Schrader et al. [17] could be detected by fibre-optics measurements, allowing the researcher to gain better insight in the damage processes within the adhesive layer behind the major crack tip.
Especially for G-based approaches to determining the fracture energy of an adhesive layer, the current crack length must be measured with good accuracy. As stated earlier, for stiff adhesive layers, crack length measurements using BFS measurement techniques have already been successfully applied in various studies in both modes I and III, e.g., [11,19,20,21,22]. The determination of an equivalent crack length from the BFS measurements was also shown to be possible in this study for soft, rubber-like adhesive layers in both modes I and III, which could allow the determination of crack tip position and crack propagation rate for adhesive systems or test setups in which optical methods for the evaluation of crack length fail due to a lack of space or lack of visibility of the current crack tip position. Furthermore, compared to analytical methods for the determination of the equivalent crack length from load point displacement and/or applied loads, the approach presented here does not require any assumptions to be made about the boundary conditions of the substrates’ beam bending, such as cantilever beams that are perfectly clamped at the crack tip, which, considering the finite length of the process zone, was shown to be problematic in this work.
It was also shown within the course of this study that, in theory, fibre-optics measurements could even eliminate the need for other COD measurement systems, such as DIC systems or COD gauges, as the system can also provide information about these quantities. Particularly if the entire process zone is to be examined, measurement employing DIC is very difficult, as a very large measurement window is required to cover the entire length of the specimen, which will negatively affect the accuracy of the DIC measurement. Furthermore, considering the mode III investigation, the large out-of-plane deformations are difficult to capture with DIC measurements due to the limited depth of focus. A calculation of the COD from the beam deflection curve is, therefore, a worthwhile option for evaluation when investigating adhesive layers that exhibit finite deformations before ultimate failure.
Overall, we believe that implementing the use of fibre-optics for the mechanical fracture investigation of adhesive joints could be a valuable addition to current research practice, because, as was shown in this study under mode I and III loading, the BFS measurement provides detailed insight into the behaviour of the adhesive. The novel approach we presented based on the BFS measurement allows the determination of rate-dependent traction separation relations directly from DCB and ODCB experiments, which provides a valuable database for inputting into cohesive zone models. Hence, in future investigations, these experimental results could be used to develop new or improve existing cohesive zone models for predicting the fracture of soft, rubber-like adhesive joints, which is crucial for the design of adhesively bonded components.

5. Conclusions

In our study, we investigated the effects of loading rate and mode on the fracture behaviour of a soft polyurethane adhesive joint subjected to peel and shear loading. The rate-dependency was investigated at external loading rates over three orders of magnitude in peel and shear. Next to the conventional evaluation methods employing the J-integral, crack extension, process zone length, and cohesive traction were determined from BFS measurements. Within the limitations of this study, the following conclusions can be drawn:
  • The results indicate that the ERR of the tested adhesive system may be largely independent of loading mode in pure modes I and III. This is probably due to the shear loads in mode III testing ultimately transitioning into a peel load at finite deformations.
  • The process zone can be investigated thoroughly by the use of BFS measurements. It was observed that the process zone is fully developed at the start of crack propagation in all cases. During the mode III investigations, the process zones are significantly larger than in mode I, which is probably related to the stiffness of the adhesive being lower in shear than in peel.
  • The BFS measurements allow the determination of cohesive laws along with the complete adhesive layer based on the Euler–Bernoulli beam theory. Differences between the evaluation method using the proposed BFS and the J-integral method were observed, which is likely due to a violation of the underlying theoretical assumptions of the J-integral method when investigating soft, rubber-like adhesive layers. Furthermore, from the BFS measurement, the rate development along with the complete adhesive layer can be measured, which enables determining a rate-dependent cohesive law.
  • As the cohesive laws could not be determined reliably from the J-integral method in the mode III experiments, a determination of cohesive traction with BFS measurements or similar methods is deemed mandatory for soft, rubber-like adhesive layers subjected to mode III loading.
  • Although the ERR remains relatively independent of loading mode, the measured cohesive laws are not. Users should bear this in mind when designing and numerically investigating soft, rubber-like adhesive layers and must not assume that the cohesive laws in modes I and III are equivalent.
We were able to show that the investigation of the fracture behaviour of soft, rubber-like adhesive joints using the J-integral method involves complications that require investigation in more detail in future studies. For the time being, the BFS measurements were used as proof of concept, from which, in future investigations, further insights can certainly be gained. Hence, we advise that further research is undertaken in the following areas:
  • It became apparent from the BFS measurements during the mode III investigations that transverse forces in the lateral slides influence the external determination of the ERR for the tested soft, rubber-like adhesive system. If ODCB experiments are conducted on similar adhesive systems in the future, the transverse forces should be included in the external evaluation of the J-integral.
  • Although it was not possible to implement the measured cohesive laws in finite element analyses in the scope of this study, an implementation using cohesive zone models is deemed worthwhile. A simulative study could investigate whether the experimental results (and especially the observed resistance curve behaviour) can be reproduced with the rate-dependent model.
  • It should be investigated whether local effects, i.e., damage behind the crack tip in creep tests or geometric influences due to defects in the adhesive layer, can be investigated more thoroughly using the proposed methodology from BFS measurements.

Author Contributions

Conceptualization, P.S. and D.D.; methodology, P.S. and D.D.; formal analysis, P.S. and D.D.; investigation, P.S. and D.D.; writing—original draft preparation, P.S. and D.D.; writing—review and editing, P.S. and D.D.; visualization, P.S. and D.D.; supervision, S.M.; funding acquisition, S.M. All authors have read and agreed to the published version of the manuscript.

Funding

This project is supported by the Federal Ministry for Economic Affairs and Climate Action (BMWK) on the basis of a decision by the German Bundestag [grant number ZB-ZF4283703]. The financial support is gratefully acknowledged.

Data Availability Statement

The raw and processed data required to reproduce these findings are shown in the present manuscript or cited in the reference section where taken from literature and are available from the corresponding author on request.

Acknowledgments

This article is part of P. Schrader’s doctoral thesis at the Doctoral Center for Engineering Sciences of the Research Campus of Central Hessen under the supervision of the Justus-Liebig-University Giessen in cooperation with the University of Applied Sciences of Central Hessen (Technische Hochschule Mittelhessen). The authors would like to thank Maike Sapotta (GLUETEC Industrieklebstoffe GmbH & Co. KG, Germany) for supplying the tested adhesive. Furthermore, we want to thank Jens Minnert and the Institute of Civil Engineering (Technische Hochschule Mittelhessen) for kindly lending us their fibre-optics system for the experimental investigation.

Conflicts of Interest

The authors declare no conflict of interest.

Abbreviations

The following abbreviations are used in this manuscript:
CODCrack opening displacement
DCBDouble cantilever beam
ODCBOut-of-plane loaded double cantilever beam
BFSBackface strain
ERREnergy release rate
DICDigital image correlation

References

  1. Loureiro, A.L.; Da Silva, L.F.M.; Sato, C.; Figueiredo, M.A.V. Comparison of the Mechanical Behaviour Between Stiff and Flexible Adhesive Joints for the Automotive Industry. J. Adhes. 2010, 86, 765–787. [Google Scholar] [CrossRef]
  2. Banea, M.D.; Da Silva, L.F.M.; Campilho, R.D.S.G. The Effect of Adhesive Thickness on the Mechanical Behavior of a Structural Polyurethane Adhesive. J. Adhes. 2015, 91, 331–346. [Google Scholar] [CrossRef]
  3. Banea, M.D.; Da Silva, L.F.M. Mechanical Characterization of Flexible Adhesives. J. Adhes. 2009, 85, 261–285. [Google Scholar] [CrossRef]
  4. Rice, J.R. A Path Independent Integral and the Approximate Analysis of Strain Concentration by Notches and Cracks. J. Appl. Mech. 1968, 35, 379–386. [Google Scholar] [CrossRef] [Green Version]
  5. Andersson, T.; Stigh, U. The stress–elongation relation for an adhesive layer loaded in peel using equilibrium of energetic forces. Int. J. Solids Struct. 2004, 41, 413–434. [Google Scholar] [CrossRef]
  6. Leffler, K.; Alfredsson, K.S.; Stigh, U. Shear behaviour of adhesive layers. Int. J. Solids Struct. 2007, 44, 530–545. [Google Scholar] [CrossRef] [Green Version]
  7. Marzi, S.; Biel, A.; Stigh, U. On experimental methods to investigate the effect of layer thickness on the fracture behavior of adhesively bonded joints. Int. J. Adhes. Adhes. 2011, 31, 840–850. [Google Scholar] [CrossRef]
  8. Stigh, U.; Biel, A.; Svensson, D. Cohesive zone modelling and the fracture process of structural tape. Procedia Struct. Integr. 2016, 2, 235–244. [Google Scholar] [CrossRef] [Green Version]
  9. Loh, L.; Marzi, S. An Out-of-plane Loaded Double Cantilever Beam (ODCB) test to measure the critical energy release rate in mode III of adhesive joints: Special issue on joint design. Int. J. Adhes. Adhes. 2018, 83, 24–30. [Google Scholar] [CrossRef]
  10. Schrader, P.; Marzi, S. Mode III testing of structural adhesive joints at elevated loading rates. Int. J. Adhes. Adhes. 2022, 113, 103078. [Google Scholar] [CrossRef]
  11. Schrader, P.; Marzi, S. Novel mode III DCB test setups and related evaluation methods to investigate the fracture behaviour of adhesive joints. Theor. Appl. Fract. Mech. 2022, 123, 103699. [Google Scholar] [CrossRef]
  12. Schmandt, C.; Marzi, S. Effect of crack opening velocity on fracture behavior of hyperelastic semi-structural adhesive joints subjected to mode I loading. Procedia Struct. Integr. 2018, 13, 799–805. [Google Scholar] [CrossRef]
  13. Schmandt, C.; Marzi, S. Effect of crack opening velocity and adhesive layer thickness on the fracture behaviour of hyperelastic adhesive joints subjected to mode I loading: Special issue on joint design. Int. J. Adhes. Adhes. 2018, 83, 9–14. [Google Scholar] [CrossRef]
  14. Rosendahl, P.L.; Staudt, Y.; Odenbreit, C.; Schneider, J.; Becker, W. Measuring mode I fracture properties of thick-layered structural silicone sealants. Int. J. Adhes. Adhes. 2019, 91, 64–71. [Google Scholar] [CrossRef]
  15. Loh, L.; Marzi, S. Mixed-mode I+III tests on hyperelastic adhesive joints at prescribed mode-mixity. Int. J. Adhes. Adhes. 2018, 85, 113–122. [Google Scholar] [CrossRef]
  16. Boutar, Y.; Naïmi, S.; Mezlini, S.; da Silva, L.F.; Ben Sik Ali, M. Characterization of aluminium one-component polyurethane adhesive joints as a function of bond thickness for the automotive industry: Fracture analysis and behavior. Eng. Fract. Mech. 2017, 177, 45–60. [Google Scholar] [CrossRef]
  17. Schrader, P.; Schmandt, C.; Marzi, S. Mode I creep fracture of rubber-like adhesive joints at constant crack driving force. Int. J. Adhes. Adhes. 2022, 113, 103079. [Google Scholar] [CrossRef]
  18. Škec, L.; Alfano, G.; Jelenić, G. Enhanced simple beam theory for characterising mode-I fracture resistance via a double cantilever beam test. Compos. Part B Eng. 2019, 167, 250–262. [Google Scholar] [CrossRef]
  19. Ben Salem, N.; Budzik, M.K.; Jumel, J.; Shanahan, M.; Lavelle, F. Investigation of the crack front process zone in the Double Cantilever Beam test with backface strain monitoring technique. Eng. Fract. Mech. 2013, 98, 272–283. [Google Scholar] [CrossRef]
  20. Bernasconi, A.; Kharshiduzzaman, M.; Comolli, L. Strain Profile Measurement for Structural Health Monitoring of Woven Carbon-fiber Reinforced Polymer Composite Bonded joints by Fiber Optic Sensing Using an Optical Backscatter Reflectometer. J. Adhes. 2016, 92, 440–458. [Google Scholar] [CrossRef]
  21. Lima, R.; Perrone, R.; Carboni, M.; Bernasconi, A. Experimental analysis of mode I crack propagation in adhesively bonded joints by optical backscatter reflectometry and comparison with digital image correlation. Theor. Appl. Fract. Mech. 2021, 116, 103117. [Google Scholar] [CrossRef]
  22. Truong, H.T.; Martinez, M.J.; Ochoa, O.O.; Lagoudas, D.C. Mode I fracture toughness of hybrid co-cured Al-CFRP and NiTi-CFRP interfaces: An experimental and computational study. Compos. Part A Appl. Sci. Manuf. 2020, 135, 105925. [Google Scholar] [CrossRef]
  23. Reiner, J.; Torres, J.P.; Veidt, M. A novel Top Surface Analysis method for Mode I interface characterisation using Digital Image Correlation. Eng. Fract. Mech. 2017, 173, 107–117. [Google Scholar] [CrossRef]
  24. Sun, F.; Blackman, B. A DIC method to determine the Mode I energy release rate G, the J-integral and the traction-separation law simultaneously for adhesive joints. Eng. Fract. Mech. 2020, 234, 107097. [Google Scholar] [CrossRef]
  25. Jumel, J.; Budzik, M.K.; Shanahan, M.E. Process zone in the Single Cantilever Beam under transverse loading. Theor. Appl. Fract. Mech. 2011, 56, 7–12. [Google Scholar] [CrossRef]
  26. Paris, A.J.; Paris, P. Instantaneous evaluation of J and C. Int. J. Fract. 1988, 38, R19–R21. [Google Scholar] [CrossRef]
  27. Loh, L.; Marzi, S. A Mixed-Mode Controlled DCB test on adhesive joints loaded in a combination of modes I and III. Procedia Struct. Integr. 2018, 13, 1318–1323. [Google Scholar] [CrossRef]
  28. Loh, L.; Marzi, S. A novel experimental methodology to identify fracture envelopes and cohesive laws in mixed-mode I + III. Eng. Fract. Mech. 2019, 214, 304–319. [Google Scholar] [CrossRef]
  29. Biel, A. Constitutive Behaviour and Fracture Toughness of an Adhesive Layer. Doctoral Dissertation, Chalmers University of Technology, Göteborg, Sweden, 2005. [Google Scholar]
  30. ISO 25217; Adhesives—Determination of the Mode 1 Adhesive Fracture Energy of Structural Adhesive Joints Using Double Cantilever Beam and Tapered Double Cantilever Beam Specimens. International Organization for Standardization: Geneva, Switzerland, 2009.
  31. Mao, J.; Nassar, S.; Yang, X. An improved model for adhesively bonded DCB joints. J. Adhes. Sci. Technol. 2014, 28, 613–629. [Google Scholar] [CrossRef]
Figure 1. Schematic representation of the line J-integral around a notch for a plane problem.
Processes 11 00356 g001
Figure 2. Schematical representation of the used specimens with applied loads: (left) DCB specimen, (right) ODCB specimen.
Processes 11 00356 g002
Figure 3. Dimensions of the tested specimens; E I y = 2.98 × 10⁸ Nmm², E I z = 4.56 × 10⁸ Nmm², μ I y z = 2.75 × 10⁸ Nmm².
Processes 11 00356 g003
Figure 4. Experimental setups: (left) mode I DCB setup, (right) mode III ODCB setup.
Processes 11 00356 g004
Figure 5. Determination of crack tip position and process zone length.
Processes 11 00356 g005
Figure 6. Representative fracture surfaces observed in the experiments.
Processes 11 00356 g006
Figure 7. Partly adhesive failure and plastically deformed, tilted side surfaces observed during mode III loading at the loading rates of 0.05 deg/s and 0.5 deg/s.
Processes 11 00356 g007
Figure 8. Development of the bending strain measured by the optical fibre: (left) quasi-static DCB test, (right) quasi-static ODCB test.
Processes 11 00356 g008
Figure 9. Transverse forces obtained from the bending strain of the optical fibre during the ODCB tests.
Processes 11 00356 g009
Figure 10. Comparison between externally measured values and BFS measurement: (left) separation of the adherends at the crack tip, (right) applied external force/bending moment.
Processes 11 00356 g010
Figure 11. Measured ERR during the mode I experiments; experiments with additional BFS measurements are highlighted.
Processes 11 00356 g011
Figure 12. Results of the ODCB experiments: (left) measured ERR and (right) relative influence of the unintended contributions to J at the start of crack propagation. Experiments with additional BFS measurement are highlighted.
Processes 11 00356 g012
Figure 13. Comparison between externally measured values and BFS measurement of J: (left) mode I DCB tests, (right) mode III ODCB tests.
Processes 11 00356 g013
Figure 14. Influence of loading mode and representative crack opening velocity on the externally measured ERR.
Processes 11 00356 g014
Figure 15. Resistance curves obtained from the fibre-optics measurements: (left) mode I DCB tests, (right) mode III ODCB tests.
Processes 11 00356 g015
Figure 16. Development of the process zone during the experiments: (left) mode I DCB tests, (right) mode III ODCB tests.
Processes 11 00356 g016
Figure 17. Comparison between BFS crack extension and analytical crack extension.
Processes 11 00356 g017
Figure 18. Comparison between traction at the crack tip obtained from d J / d δ i , t , Equation (4), (bold lines) and mean and standard deviation curves from the BFS measurements (scatter bands): (left) mode I DCB tests, (right) mode III ODCB tests.
Processes 11 00356 g018
Figure 19. Traction in the cohesive zone over current separation and separation rate: (left) mode I DCB tests, (right) mode III ODCB tests.
Processes 11 00356 g019
Table 1. Test matrix and used DIC systems.
External Loading RateSample SizeDIC SensorsImage Acquisition Rate
Mode I (mm/s)0.055Aramis 3D Sensor 11 fps
0.54Photron FASTCAM 230 fps
55Photron FASTCAM 2125 fps
Mode III (deg/s)0.054Aramis 3D Sensor 11 fps
0.54Aramis 3D Sensor 120 fps
54Photron FASTCAM 2125 fps
Referrals for DIC setups: 1 ARAMIS 3D Motion and Deformation Sensor, GOM Correlate (GOM GmbH, Braunschweig, Germany). 2 Photron FASTCAM Nova S6 (Photron USA, San Diego, USA), VIC-3D 8 (Correlated Solutions, Irmo, USA).
Disclaimer/Publisher’s Note: The statements, opinions and data contained in all publications are solely those of the individual author(s) and contributor(s) and not of MDPI and/or the editor(s). MDPI and/or the editor(s) disclaim responsibility for any injury to people or property resulting from any ideas, methods, instructions or products referred to in the content.

