Article

Thermodynamic and Heat Transfer Performance of the Organic Triangle Cycle

1
Key Laboratory of New Materials and Facilities for Rural Renewable Energy of Ministry of Agriculture and Rural Affairs, College of Mechanical & Electrical Engineering, Henan Agricultural University, Zhengzhou 450002, China
2
Henan International Joint Laboratory of Biomass Energy and Nanomaterials, Henan Agricultural University, Zhengzhou 450002, China
3
Key Laboratory of Low-Grade Energy Utilization Technologies and Systems of Ministry of Education, College of Power Engineering, Chongqing University, Chongqing 400030, China
4
Key Laboratory of Cryogenics, Technical Institute of Physics and Chemistry, Chinese Academy of Sciences, Beijing 100190, China
*
Author to whom correspondence should be addressed.
Processes 2023, 11(2), 357; https://doi.org/10.3390/pr11020357
Submission received: 29 November 2022 / Revised: 13 January 2023 / Accepted: 20 January 2023 / Published: 22 January 2023
(This article belongs to the Section Energy Systems)

Abstract

:
Compared to the organic Rankine cycle (ORC), the organic triangle cycle (TC) is simpler in structure and is not limited by pinch point temperature differences. TC has been studied to some extent by previous researchers, such as the selection of working fluid, application, and the design of the expander. However, system optimization and parameter analysis of TC are still rare. The thermodynamic performance of TC internal circulation and TC heat recovery systems are investigated by theoretical analysis and numerical simulation, respectively. The results indicate that the expander inlet temperature T3 and heater inlet temperature T2 are key elements impacting the thermodynamic performance of the TC internal circulation. For the TC heat recovery system, an optimal value of the average heat-capacity flow rate of working fluid Cwf is discovered to output the maximum net power output Wnet. Moreover, the total heat transfer coefficients for the heater (kA)h and condenser (kA)c are discussed in relation to Cwf variations. The findings will provide critical guidance for system investment and optimization.

1. Introduction

In today’s world, the environment and development are both mutually constrained and interdependent. How to balance development and environment is a hot issue today. Researchers have studied the development and utilization of many clean, renewable energy sources, such as wind [1,2], solar [3,4], and geothermal [5,6] energy. Nowadays, geothermal water is mostly used for energy generation via direct heating, flash geothermal power generation, total flow geothermal power generation, binary cycle power generation, and total flow-binary cycle combined power generation [7,8]. Additionally, the organic triangle cycle (TC) [9] can be applied to recover geothermal energy, and it has gained much attention due to its advantages, such as its simple system and high exergy efficiency. Besides, TC is suitable for lower temperature heat sources compared to ORC, and TC has the potential to generate electricity even from heat sources below 80 °C in cases where ORC is not economically feasible [10,11]. As a result, several studies have been undertaken in this sector. Smith et al. [12,13,14] investigated the construction concept, use of mixed mixture working fluids, and two-phase expansion working principle of a Lysholm double screw expander, laying a solid platform for future TC research. Bryson [15] compared TC to the traditional double cycle and discovered that the TC had significant advantages when the expander adiabatic efficiency reached certain values. Steffen et al. [16] compared TC with ORC. The exergy efficiency of TC using water as working fluid was 35 to 70% higher than that of the supercritical ORC at heat source temperatures up to 450 K. Fischer et al. [17,18] compared the thermodynamic performances of single-stage TCs with water as the working fluid, the organic Rankine cycle (ORC), and other improved TCs. It was discovered that the efficiency of TC was always greater than that of ORC under the same conditions; however, water was not a suitable working fluid. Arbab et al. [19] compared the performance of ORC and TC power generation systems. The results showed that TC power generation system could utilize up to 70% of available power and had about 50% more power generation capability than ORC. Ajimotokan [20] conducted preliminary elections and intensive studies on the appropriate working fluid for the trilateral flash cycle and discovered that light hydrocarbons were more suitable as working fluids, and n-pentane was eventually chosen as the working fluid. The comparison of the thermodynamic performance of TC and three improved TCs was reported. The effects of expander inlet temperature and expander adiabatic efficiency on cycle performance were investigated. Antonopoulou et al. [21] simulated the trilateral flash cycle with Aspen Plus and compared the net output power, thermal efficiency, and exergy efficiency for different working fluids. The thermodynamic results showed that HFO-1234yf had the best power production and thermal efficiency at a heat source temperature of 90 °C, while HFC-245fa had a stronger exergy potential. Chang et al. [22] screened the working fluid from the perspective of the heat source and expander, finding that when the heat source temperature is close to the critical temperature of the working fluid, the system performance is better.
Moreover, geothermal energy thermodynamic cycles have been extensively reported in China [23,24]. Wang et al. [25] evaluated the thermo-economic performance of a dual-pressure ORC system powered by geothermal heat. A comparison of single and dual-pressure systems was performed. The effects of the annual loan interest rate, on-grid electricity price, and carbon tax on the system’s economic performance were also discussed. Zhang et al. [26] studied the impacts of superheat and internal heat exchangers on the thermo-economic performance of ORCs based on fluid type and heat source.
As a bottom cycle, the TC is also able to recycle low-grade thermal energy from other scarce heat sources, including industrial waste heat or engine waste heat, in addition to recovering geothermal energy. Hays et al. [27] drove the TC system with waste heat from ship engines and conducted sea trials, confirming the reliability of TC applications for ships. Zeynali et al. [28] investigated the performance of modified trilateral flash cycles assisted by a solar pond and compared them with modified organic Rankine cycles. With the emergence of high-efficiency two-phase screw expanders, the application of TC has great development prospects.
In recent years, research of TC has made great progress, mainly in the selection of working fluid, application cases, the comparison between TC and traditional technology and the modeling and design of expander. However, the basic thermodynamic performance simulation and calculation methods, system optimization, and parameter analysis of TC are still rare. A deeper understanding of the fundamental thermodynamic performance of TC is required. Therefore, n-pentane is used as the working fluid and a twin-screw expander is chosen as the two-phase expander in the present work. Numerical simulations of the thermodynamic processes of TC are conducted. The influence of the system’s main parameters on the cycle’s thermodynamic performance is analyzed. The research is expected to make a significant addition to the study of TC’s thermodynamic performance and provides guidance for the design and optimization of the TC waste heat recovery system.

2. Model Description and Conditions

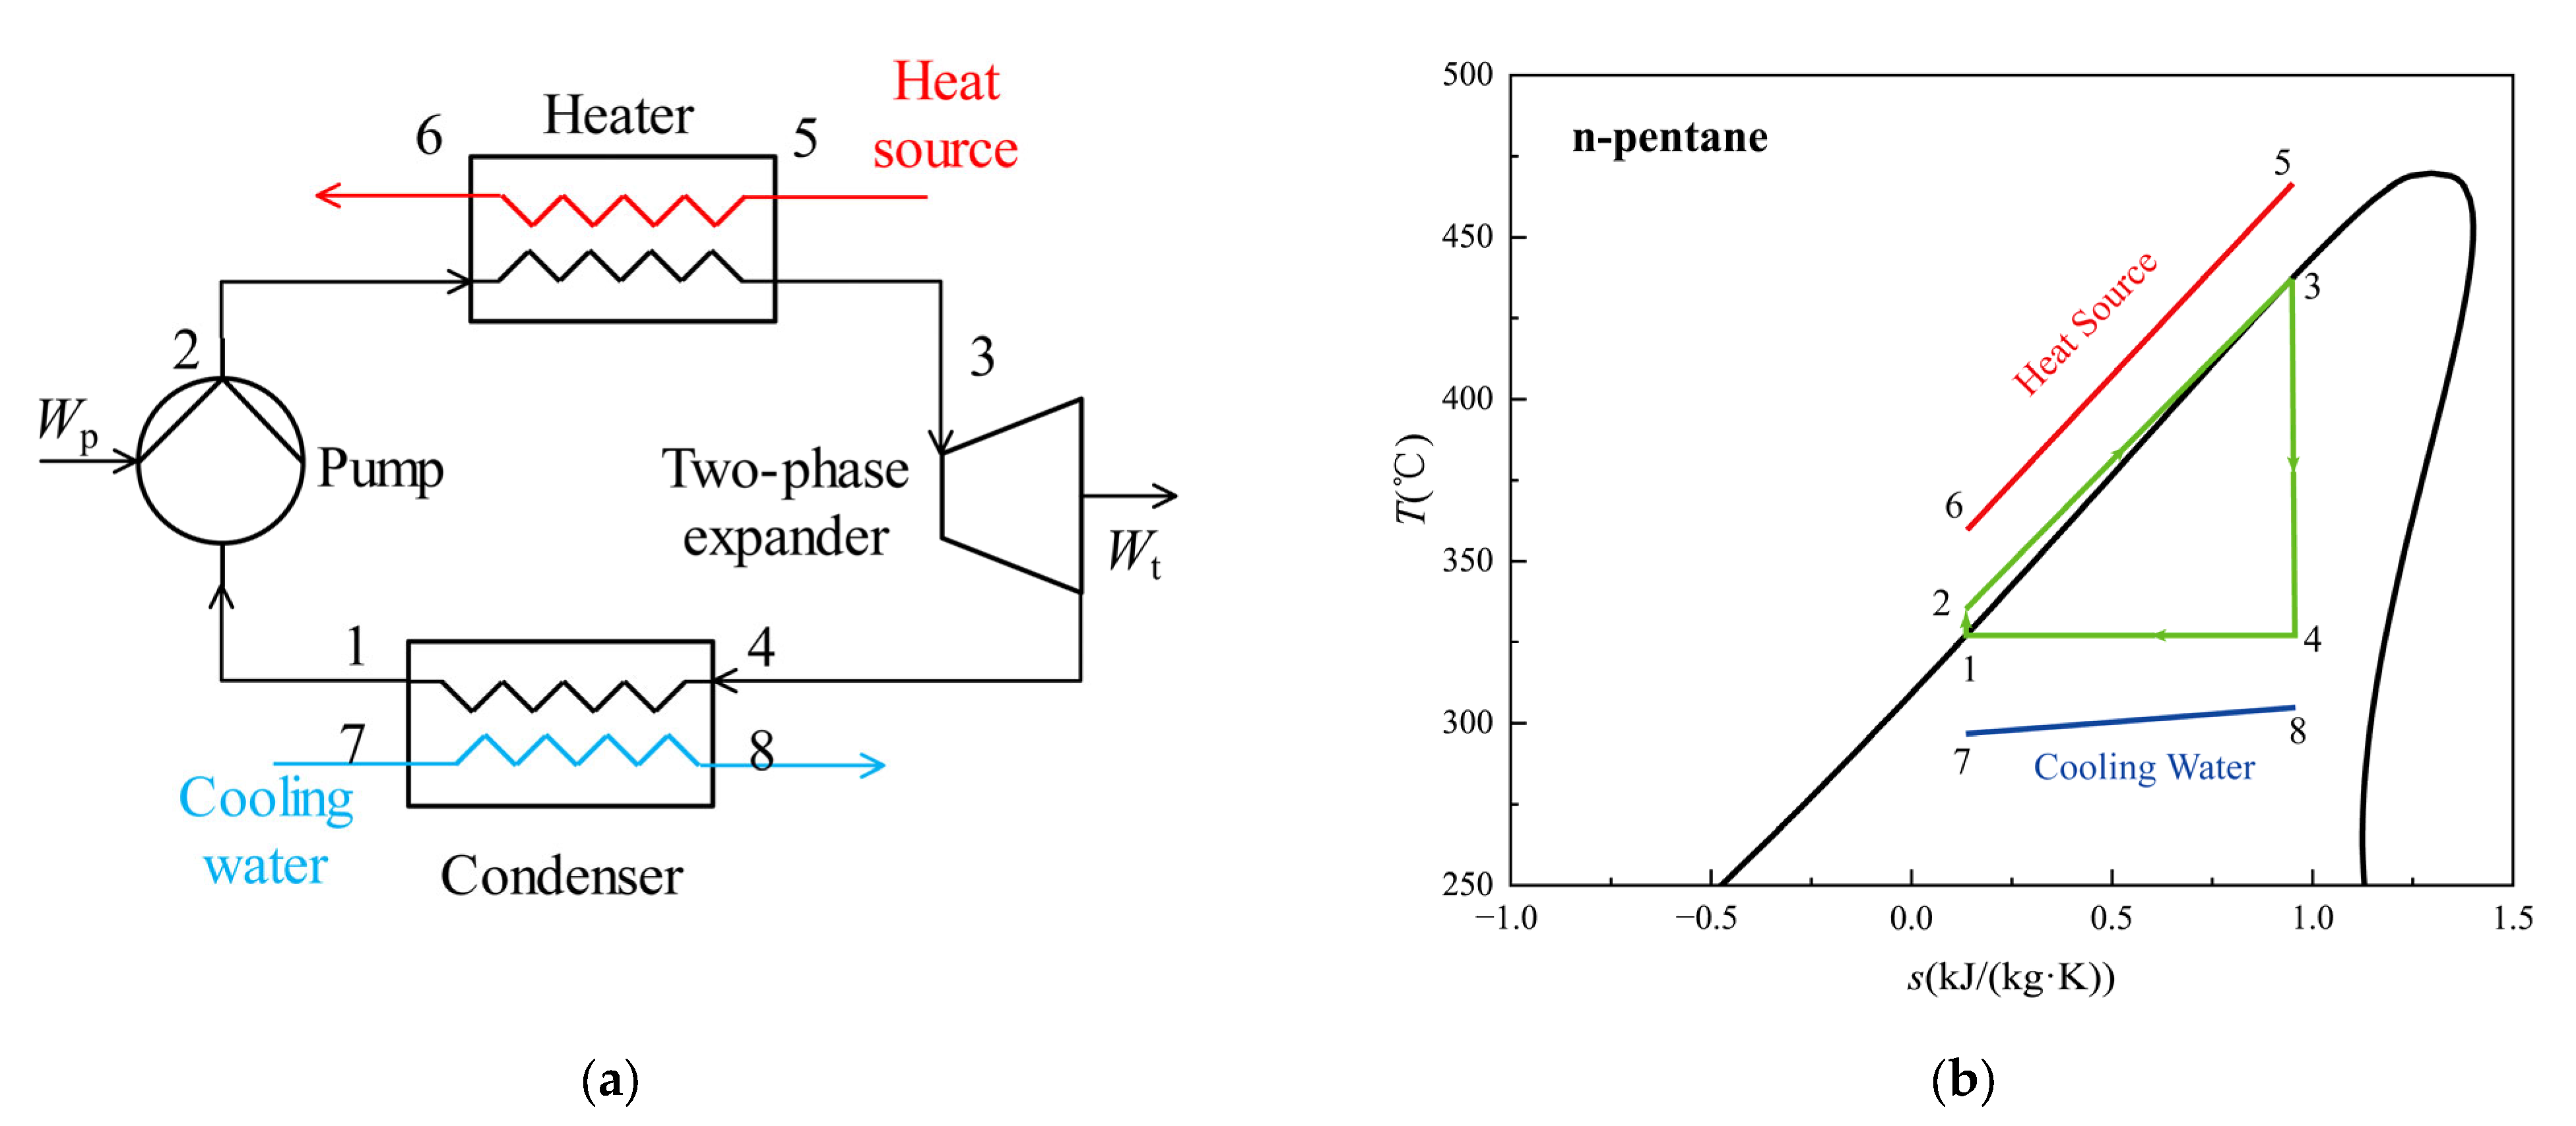
2.1. System Specifications

Figure 1 shows the schematic diagram and temperature-enthalpy diagram of the TC system. The system is composed of a heater, a working fluid pump, a two-phase expander, and a condenser. The ideal TC includes four reversible processes: the isentropic compression process (1–2), constant pressure heating process (2–3), isentropic expansion process (3–4), and constant pressure exothermic process (4–1). In reality, the isentropic process is impossible to achieve in the pump and expander. The working fluid in the saturated liquid state (point 1) is compressed in the pump by the condensing pressure to the heating pressure and then delivered to the heater. Point 2 indicates the state of the working fluid at the heater inlet. In the heater, the working fluid is heated to the saturated liquid condition (point 3). Afterward, the working fluid is sent to the two-phase expander and go through the expansion process. At the same time, the working fluid’s internal energy is turned into expander shaft power. The working fluid at the outlet of the expander (point 4) is in a gas-liquid two-phase state. The working fluid is then transported to the condenser, where the saturated vapor is converted to saturated liquid. Meanwhile, the latent heat of condensation of the working fluid is transferred to the condensing fluid. Finally, the working fluid returns to the saturated liquid condition (point 1). All the above processes constitute the whole cycle.

2.2. Model Establishment

2.2.1. Thermodynamic Model of TC Internal Circulation

Some hypotheses are presented below to simplify the calculations. (1) The system is in the steady state. (2) The law of conservation of energy is followed by all system components. (3) Kinetic and potential energy changes of the working fluid are neglected. (4) Heat exchanger pressure drop and heat loss are not taken into account.
For the actual process, the compression process in the pump and the expansion process in the expander are both incomplete adiabatic processes, which cannot be precisely represented in the software. As a result, the adiabatic efficiency of the pump and expander are taken as empirical values. The detailed thermodynamic description of TC is summarized as follows:
Process 1–2: the power consumed by the pump:
w pump = h 2 h 1 = h 2 , s h 1 η pump
where h2,s is the specific enthalpy after the process of the adiabatic compression of the working fluid. ηpump is the adiabatic efficiency of the pump.
Process 2–3: the heat absorbed from the heat source:
q h = h 3 h 2
Process 3–4: the power output of the expander:
w exp = h 3 h 4 = η exp ( h 3 h 4 , s )
where h4,s is the specific enthalpy of the working fluid after adiabatic expansion. ηexp is the adiabatic efficiency of the expander.
Process 4–1: the heat released by the working fluid in the condenser:
q c = h 4 h 1
The net power output of the system:
w net = w exp w pump
The thermal efficiency of the system:
η th = w net / q h
The exergy of the working fluid at the state point i:
e x , i = ( h i h 0 ) T 0 ( s i s 0 )
where T0 is the ambient temperature. h0 and s0 are the specific enthalpy and specific entropy of the working fluid at ambient temperature, respectively.
The heat exergy of the working fluid in the process 2–3:
e x , Q = e x , 3 e x , 2
By substituting Equation (7) into Equation (8), the heat exergy of the working fluid can be expressed as follows:
e x , Q = ( h 3 h 2 ) T 0 ( s 3 s 2 )
The description of the exergy efficiency of TC is the following:
η ex = w net / e x , Q

2.2.2. Heat Transfer Model of the Heater

The ε-NTU method [29] is adopted in the present work since the ε-NTU method can overcome the problem that multiple iterations should be conducted for the logarithmic mean temperature difference (LMTD) method [30]. Additionally, the ε-NTU method is commonly employed in the computation of low-temperature heat exchangers. The heat transfer model of the heater is established under the conditions of a given heat source, working fluid inlet temperature, and heat source fluid average heat-capacity flow rate.
To evaluate the performance of a heat exchanger, the parameter effectiveness of heat exchanger ε is utilized. It is defined as follows:
ε = | T out T in | max T 5 T 2
where |ToutTin|max is the maximum temperature difference between the inlet and outlet of the heat source fluid and the working fluid. T5 is the inlet temperature of the heat source fluid. T2 is the inlet temperature of the working fluid.
According to the energy balance:
Q h = C hc ( T 5 T 6 ) = C wf ( T 3 T 2 )
where Chc is the average heat-capacity flow rate of the heat source fluid. Cwf is the average heat-capacity flow rate of the working fluid.
The actual heat transfer in the heater:
Q h = C min ε ( T 5 T 2 )
By substituting Equation (13) into Equation (12), the outlet temperatures of the heat source fluid and working fluid in the heater can be described as the following, respectively:
T 6 = T 5 C min ε C hc ( T 5 T 2 )
T 3 = T 2 + C min ε C wf ( T 5 T 2 )
The effectiveness of the counter-flow heat exchanger:
ε = 1 exp [ ( NTU ) ( 1 R C ) ] 1 R C exp [ ( NTU ) ( 1 R C ) ]
where NTU is the number of transfer units. RC is the ratio of heat-capacity flow rate.
NTU = ( k A ) h C min
R C = C min / C max
where (kA)h is the total heat transfer coefficient of the heater.
The average specific heat capacity of the working fluid during the heating process is defined as the following:
c p , wf = h 3 h 2 T 3 T 2
The mass flow rate of the working fluid:
m wf = C wf / c p , wf

2.2.3. Heat Transfer Model of the Condenser

Assuming that the cooling water inlet temperature T7 is constant, the heat transfer in the condenser Qc can be obtained from the heat balance equation [31]:
Q c = C ca ( T 8 T 7 ) = m wf ( h 4 h 1 )
The outlet temperature of cooling water:
T 8 = T 1 Δ T P
where ΔTp is the condenser pinch temperature difference.
The average heat-capacity flow rate of cooling water:
C c a = m wf ( h 4 h 1 ) ( T 8 T 7 )
When the specific heat capacity of the cooling water cp,ca is regarded as a constant, the mass flow rate of the cooling water mca is depicted as follows:
m c a = C ca / c p , ca
The total heat transfer coefficient in the heater and condenser is described as follows:
k A i = Q ˙ i / Δ T i
where ΔTi is the logarithmic mean temperature difference of heat transfer. ΔTi can be obtained in the following form:
Δ T i = Δ T i , max Δ T i , min ln ( Δ T i , max / Δ T i , min )
The total heat transfer coefficient of the system:
( k A ) tot = ( k A ) h + ( k A ) c
where (kA)c is the total heat transfer coefficient of the condenser.

2.2.4. Model of the Second Law for the Thermodynamic Performance of the TC Heat Recovery and Power Conversion System

The heat exergy absorbed by the working fluid:
E x , Q , wf = m wf ( e x 3 e x 2 )
The heat exergy released by the heat source fluid:
E x , Q , hc = m hc ( e x 5 e x 6 )
The heat exergy released by the working fluid:
E x , c , wf = m wf ( e x 4 e x 1 )
The heat exergy absorbed by the cooling water:
E x , c , ca = m ca ( e x 8 e x 7 )
Among Equations (28)–(31), ex1ex8 indicate the exergy of per unit quality of working fluid, heat source fluid, or cooling water in each state point, respectively. Ex,Q,wf and Ex,c,wf represent the heat exergy absorbed by the working fluid during heating and released during condensation, respectively. Ex,Q,hc and Ex,c,ca represent the heat exergy released by the heat source fluid during the heating process and the heat exergy absorbed by the cooling water during the condensation process, respectively.
The exergy efficiency of the system:
η ex = W net E x , Q , hc
The objective functions considered in the present paper are shown as follows.
For the TC internal circulation, the thermal efficiency of the system ηth, exergy efficiency ηex, net power output Wnet and heat absorption qh are selected as the objective functions. To match the real conditions, the variation of the expansion ratio Rexp and the dryness at the outlet of the expander x3 with the cycle parameters is calculated.
For the TC heat recovery and power conversion system, the performance of the system depends not only on the thermal efficiency of the cycle, but also greatly on the heat transfer efficiency of the heat source to the system. Furthermore, it is also related to the heat release of the system to the environment. Hence, the thermal efficiency ηth, exergy efficiency ηex, net power output Wnet and heat absorption qh are considered as objective functions. Besides, taking the economic efficiency into consideration, the total heat transfer coefficient of the heater and condenser of the system, i.e., (kA)h and (kA)c, is calculated.

2.3. Model Validation

Comparisons of thermodynamic performance between TC and ORC were made by Fischer et al. [17,18], who used the exergy efficiency as the objective function. The minimum heat-capacity flow rate of heat source fluid for 1MW net power output is obtained through the optimization calculation under five preset conditions. The theoretical model established in the previous section is verified under the same conditions as the first set of parameters.
Since water is the working fluid in Refs. [17,18], the adiabatic efficiency of the pump and the expander are set at 0.65 and 0.85, respectively. The net power output is 1 MW. The goal is to obtain the minimum heat-capacity flow rate of the heat source fluid via system optimization and determine the parameters at each state point of the cycle. In the present work, the thermal efficiency is calculated based on the parameters at each state point in Refs. [17,18].
Comparisons of the thermal efficiency between the results in the reference and the present work are listed in Table 1. It is shown that the thermal efficiency of the present model is less than that of Fischer’s work. This is because the pump power consumption is considered in the present work while it is ignored in Fischer’s work. Therefore, the pump power consumption is responsible for the difference.

2.4. Calculation Conditions

Since n-pentane is the working fluid, the critical pressure and temperature of n-pentane are 3.37 MPa and 469.5 K, respectively. According to the properties of the working fluid, the boundary parameters of the cycle are listed in Table 2.

3. Theoretical Analysis and Numerical Simulation Results of the TC Internal Circulation

3.1. Thermodynamic Performance of the TC Internal Cycle: A Theoretical Analysis

Under the condition of ignoring the power consumed by the pump, the thermal efficiency of the ideal TC is derived in Refs. [17,18] as the following form:
η th = 1 T 1 · ln ( T 3 / T 1 ) T 3 T 1
In the present work, the pump power consumption is considered, and the derivation process is similar to that in Ref. [17]. Therefore, more details can be seen in Ref. [17]. Based on the established model, the thermal efficiency of the ideal TC that ignores the pump power consumption could be described as follows:
η th = 1 T 1 · ln ( T 3 / T 2 ) T 3 T 2
The exergy efficiency of the ideal TC could be written as:
η ex = w net / e x , Q = T 3 T 2 T 1 ln ( T 3 / T 2 ) T 3 T 2 T 0 ln ( T 3 / T 2 )
It is known that the thermal efficiency is only related to T1, T2, and T3 in Equation (34). Since T1 can be determined by the parameters at state point 2 and the adiabatic efficiency of the pump, the thermal efficiency is actually related to T2 and T3.
The first-order derivatives of ηth to T2 and T3 for Equation (34) are calculated, respectively. When T3 > T2, the following results can be obtained.
d η th d T 2 = T 1 [ 1 / T 2 ln ( T 3 / T 2 ) ] ( T 3 T 2 ) 2 < 0
d η th d T 3 = T 1 [ ln ( T 3 / T 2 ) ( 1 T 2 / T 3 ) ] ( T 3 T 2 ) 2 > 0
From Equations (36) and (37), it can be predicted that the ηth decreases with the increase of T2 but increases with the increase of T3.
Through similar conduction to Equation (35) with that to Equation (34), Equations (38) and (39) are obtained when T3 > T2, the following results can be obtained.
d η ex d T 2 < 0
d η ex d T 3 > 0
It is predicted that ηex decreases with the increase of T2 and increases with the increase of T3.

3.2. Analysis of Numerical Simulation Results of the TC Internal Circulation

In this section, the heat absorption of the cycle Qh, the net power output Wnet, the thermal efficiency ηth, and the exergy efficiency ηex are regarded as objective functions to determine the effect of T2 and T3 on the thermodynamic performance of the cycle by EES. What’s more, the thermal efficiency and exergy efficiency by numerical simulation are compared with those by theoretical analysis.

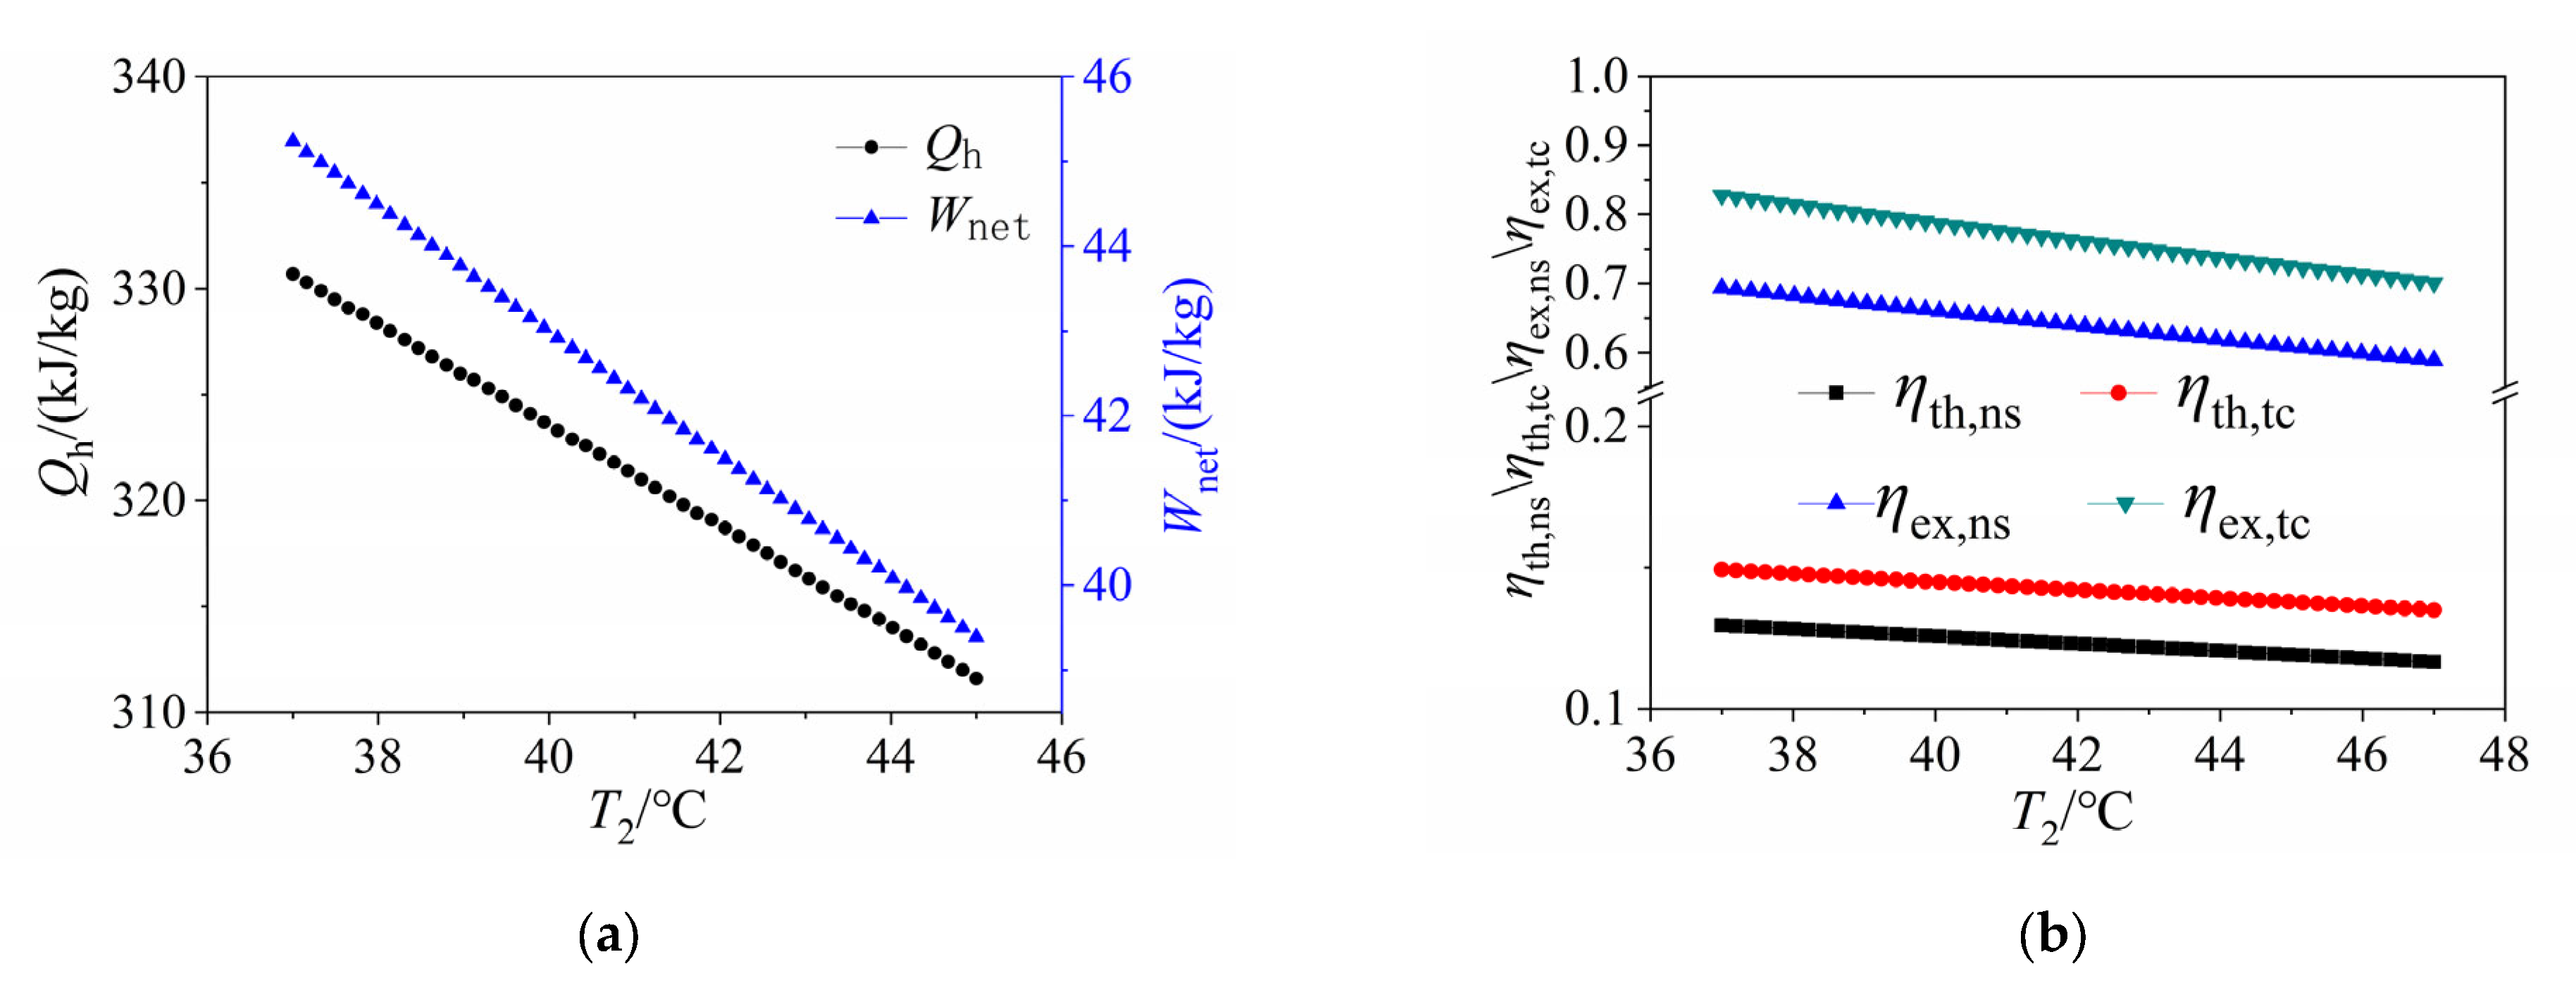
3.2.1. Effect of the Heater Inlet Temperature on Thermodynamic Performance

Given that the expander inlet temperature T3 is set at 150 °C and the expander inlet pressure P3 is set at 1591 kPa (the saturation pressure at 150 °C), the variation trends of the thermodynamic performance are varied with the increase of the temperature T2, as depicted in Figure 2. It is obvious that the heat absorption of the cycle and the power output of the expander show increasing trends, and the pump power consumption is reduced with the decrease of T2 when the expander inlet temperature T3 is constant, which means Wnet, ηth, and ηex are all increased with the decrease of T2. However, the variation trend of T1 behaves the opposite, and the corresponding saturation pressure (expander outlet pressure) drops. When P1 = 101 kPa and T1 = 35.78 °C, a smaller T2 will result in a lower expander outlet pressure, which will increase the condenser power consumption for vacuuming. According to Figure 2b, ηth and ηex by numerical simulations are lower than those by theoretical calculations. The reason is due to the irreversibility of the actual process and the change in specific heat capacity with temperature.

3.2.2. Effect of the Expander Inlet Temperature on Thermodynamic Performance

In this section, the heater inlet temperature T2 is held constant at 38 °C and T3 is varied in the range of 125–195 °C. The variation trend of the objective functions with T3 is displayed in Figure 3. The results show that as T3 increased, as did Qh, Wnet, ηth, and ηex. This is because the higher T3 is, the higher the corresponding saturation pressure P3 is, but the lower T1 and P1 are. Consequently, the power output of the expander and the power consumed by the pump are increased. ηth and ηex ranged between 10–20% and 50–90%, respectively. ηth and ηex obtained by numerical simulation were less than those obtained by theoretical calculation. More explanations can be found in the above section.

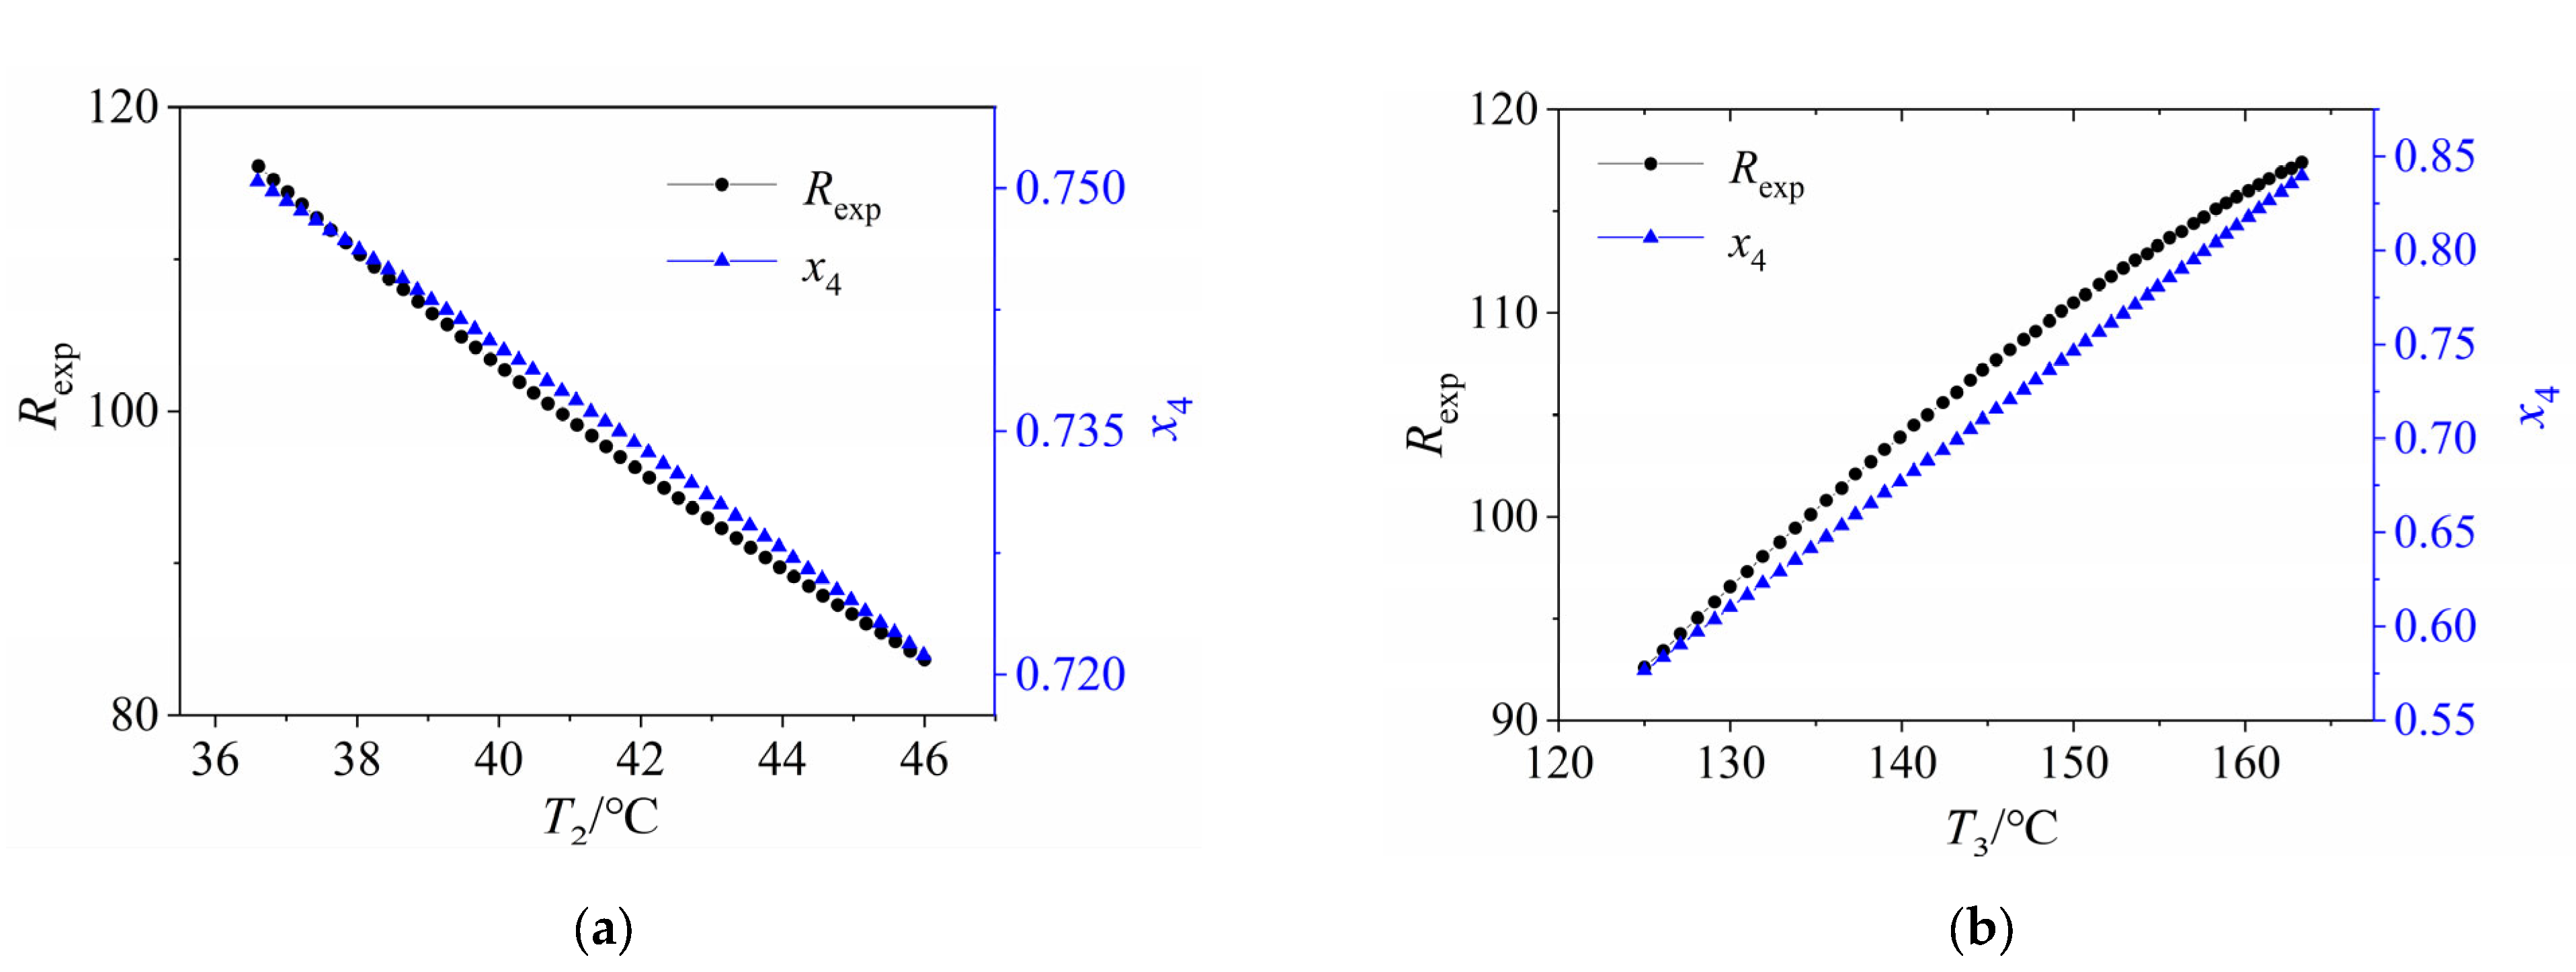
3.2.3. Effect of the Heater Inlet Temperature and Expander Inlet Temperature on the Expansion Ratio and Dryness at the Outlet of the Expander

As shown in Figure 4a, when T3 = 150 °C, the expansion ratio Rexp rose from 83.66 to 116.1 as T2 reduced from 46 to 36.61 °C. As described in Figure 4b, when T2 = 38 °C, Rexp rose from 92.59 to 117.4, with T3 rising from 125 to 163.3 °C. As Rexp increased, the dryness at the expander outlet x4 increased. Because the screw expander can expand with liquid, the dryness has slight damage to the expander. However, an excessive Rexp requires a large expander size, which leads to too much investment. As a result, the suitable Rexp should be determined by the actual production level before deciding the cycle parameters.

4. Simulation Results and Analysis of the TC Heat Recovery and Power Conversion System

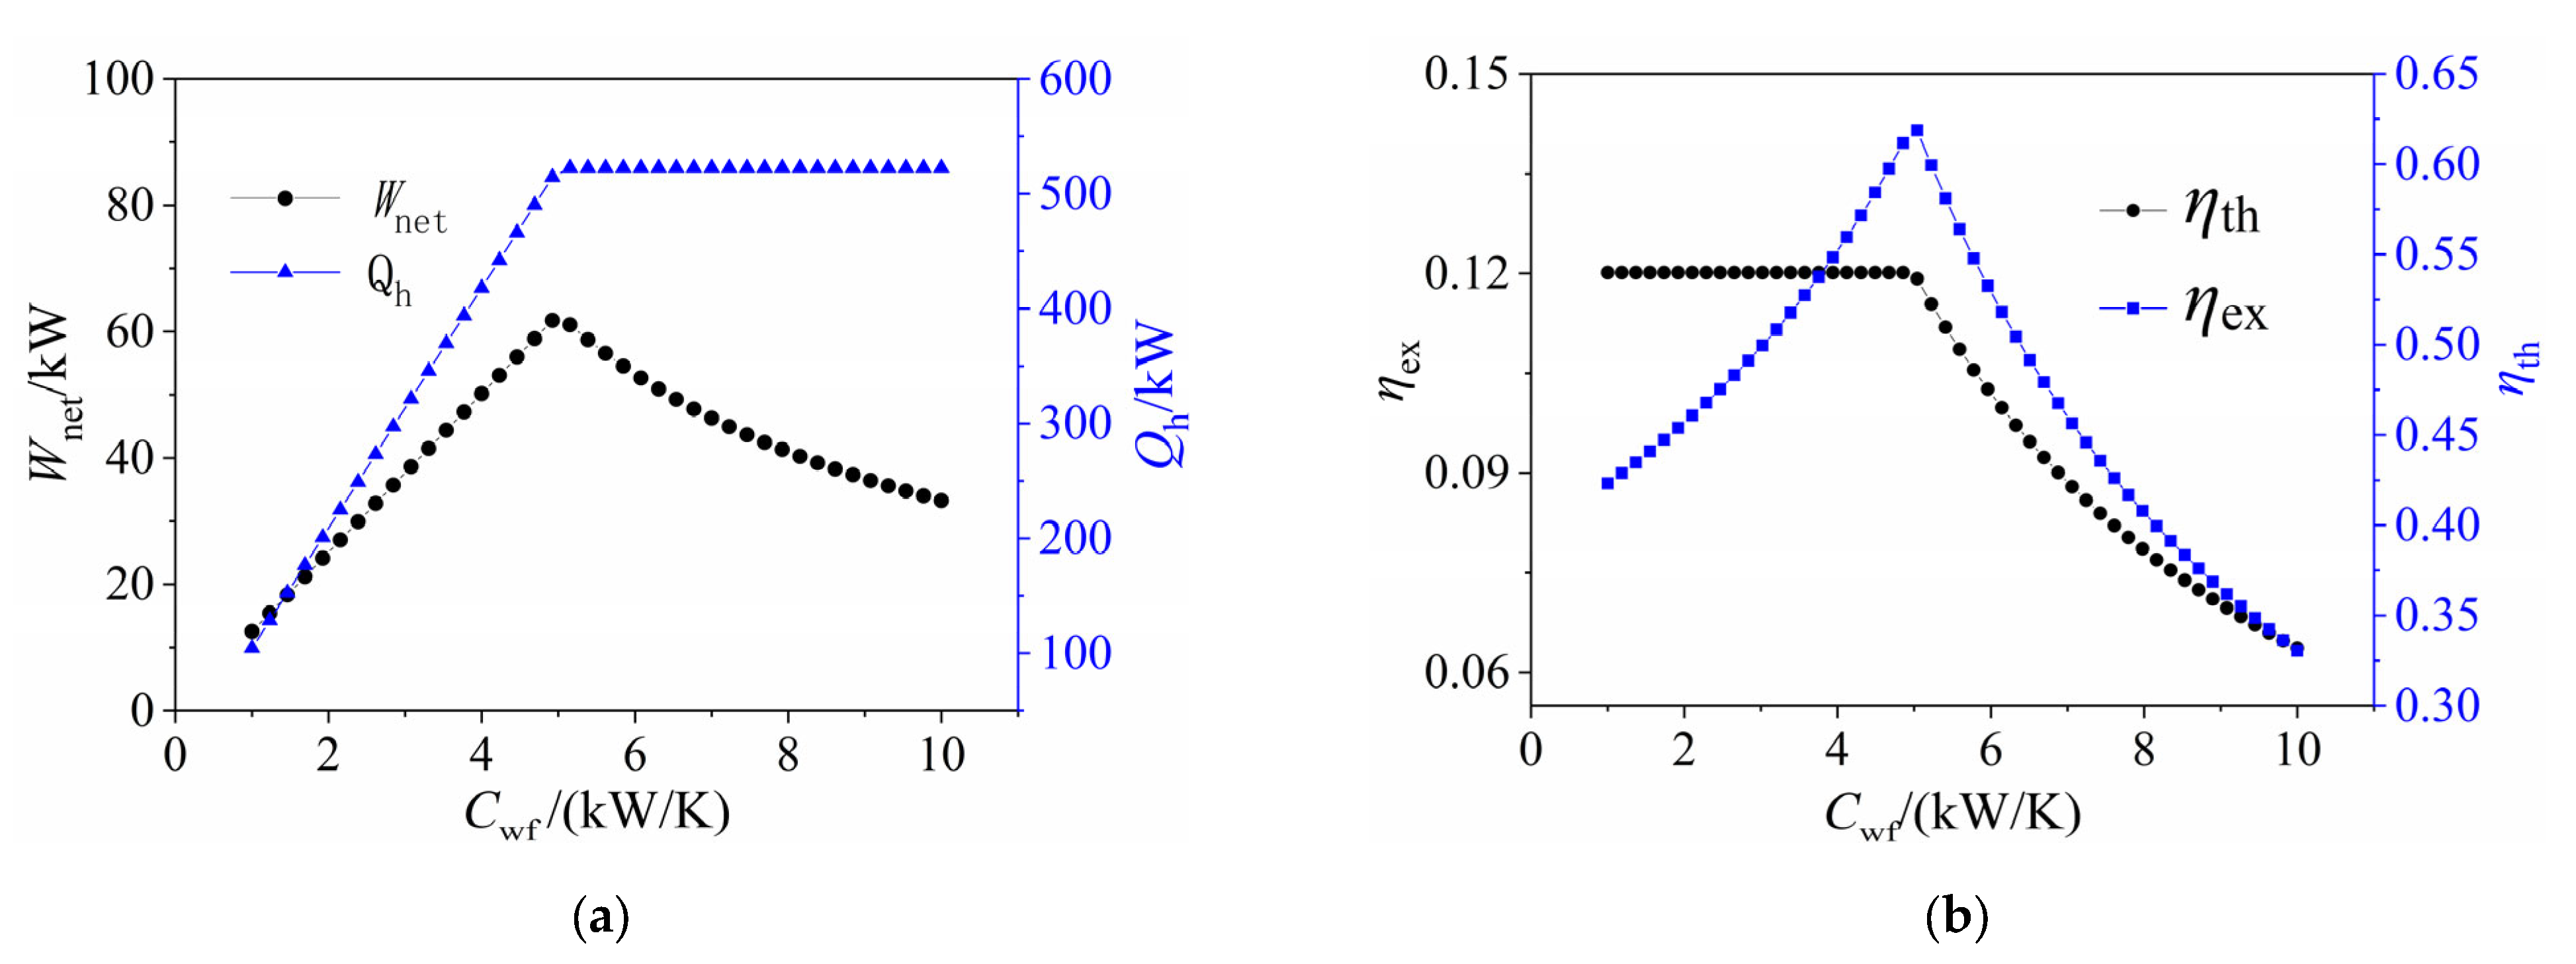
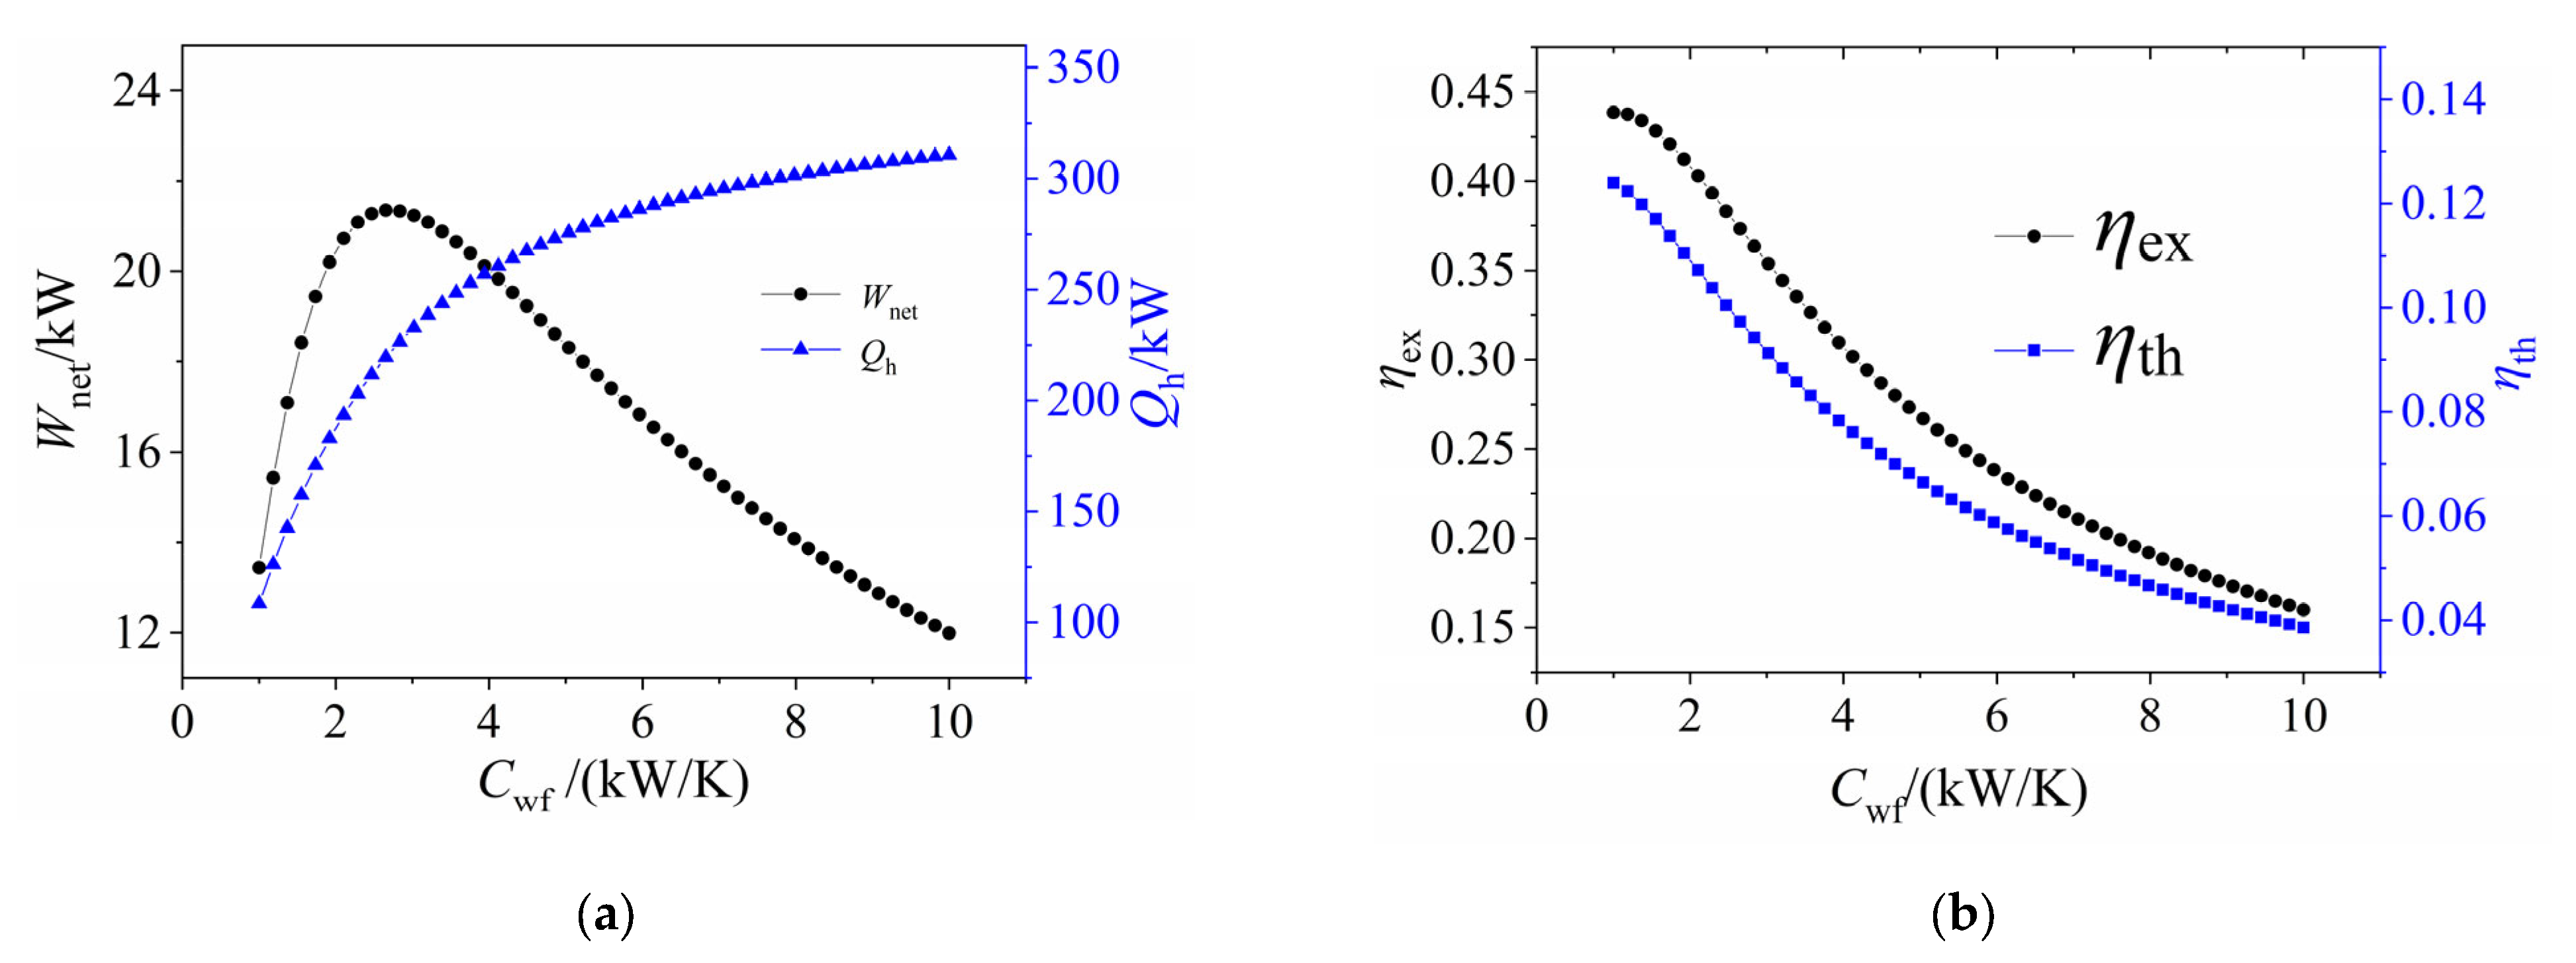
4.1. Effect of the Average Heat-Capacity Flow Rate of the Working Fluid on Thermodynamic Performance

As depicted in Figure 5, when the effectiveness of the heater ε was 0.95, T2 was 313 K, and the average heat-capacity flow rate of the heat source fluid Chc was 5 kW/K, the system performance varied with the variation of the average heat-capacity flow rate of the working fluid Cwf. Under the condition of Cwf < Chc, the heat absorption, heat release, and the net power output of the system increase with the increase of Cwf. At the same time, ηth maintained invariableness, and ηex increased. According to Equation (15), it is known that Cmin = Cwf at this time, so T3 remained unchanged. The condensing temperature T1 was also calculated as a constant value according to the condenser model. Thus (h3-h2) and (h3-h4) were constant and Qh and Wnet increased as Cwf (i.e., mwf) increased. Therefore, ηth remained constant. Cwf increased the need to change the heat exchanger model, the NTU also increased, and the (kA)h also increased, when Cwf and Chc were equal, the Wnet reached the maximum and (kA)h also reached the maximum. When Cwf > Chc, with the increase of Cwf, T3 decreased, evaporation pressure P3 decreased, T1 increased, heat source fluid outlet temperature T6 remained unchanged, circulating heat absorption was the maximum value and remained unchanged, circulating heat release increased, Wnet decreased, ηex decreased, NTU and (kA)h both decreased.
Under the condition of Cwf higher than Chc, heat absorption of the cycle keeps constant and reaches its maximum even if Cwf increased. At the same time, the heat release of the cycle increased. Contrarily, Wnet, ηex, NTU, and (kA)h showed the opposite variety. When Cwf changes between 1 kW/K and 10 kW/K, the highest ηth and the lowest ηth of the cycle were 12.8 and 6.63%, respectively. By calculating the power output of the expander Wexp and the power consumed by the pump Wpump, it was found that with the increase of Cwf, the ratio of Wpump to Wexp rose from 0.07 to 0.08, which means the power consumed by the pump in the system cannot be ignored.
When the total heat transfer coefficient of the heater (kA)h was kept at 20 kW/K, the performance of the system was varied with Cwf, as shown in Figure 6. It was demonstrated that with the increase of Cwf, ηth, and ηex decreased gradually. Meanwhile, Qh increased gradually, and Wnet increased first and then decreased. In other words, there was a maximum Wnet. This is because, with the increase of Cwf, T3 decreased while T4 was basically unchanged, which led to a reduction in Wexp by unit working fluid. When the working fluid flow rate was within a suitable range, the increase in the flow rate of the working fluid can make up for the decrease of Wexp, which leads to a rise in the overall output power. The maximum net power output was obtained when the working fluid flow rate reachedthe critical value. Subsequently, the increase in the working fluid flow rate cannot compensate for the decrease in Wexp per unit mass of the working fluid. Consequently, Wnet decreased. Similarly, Wexp first increased and then decreased with the increase of Cwf.

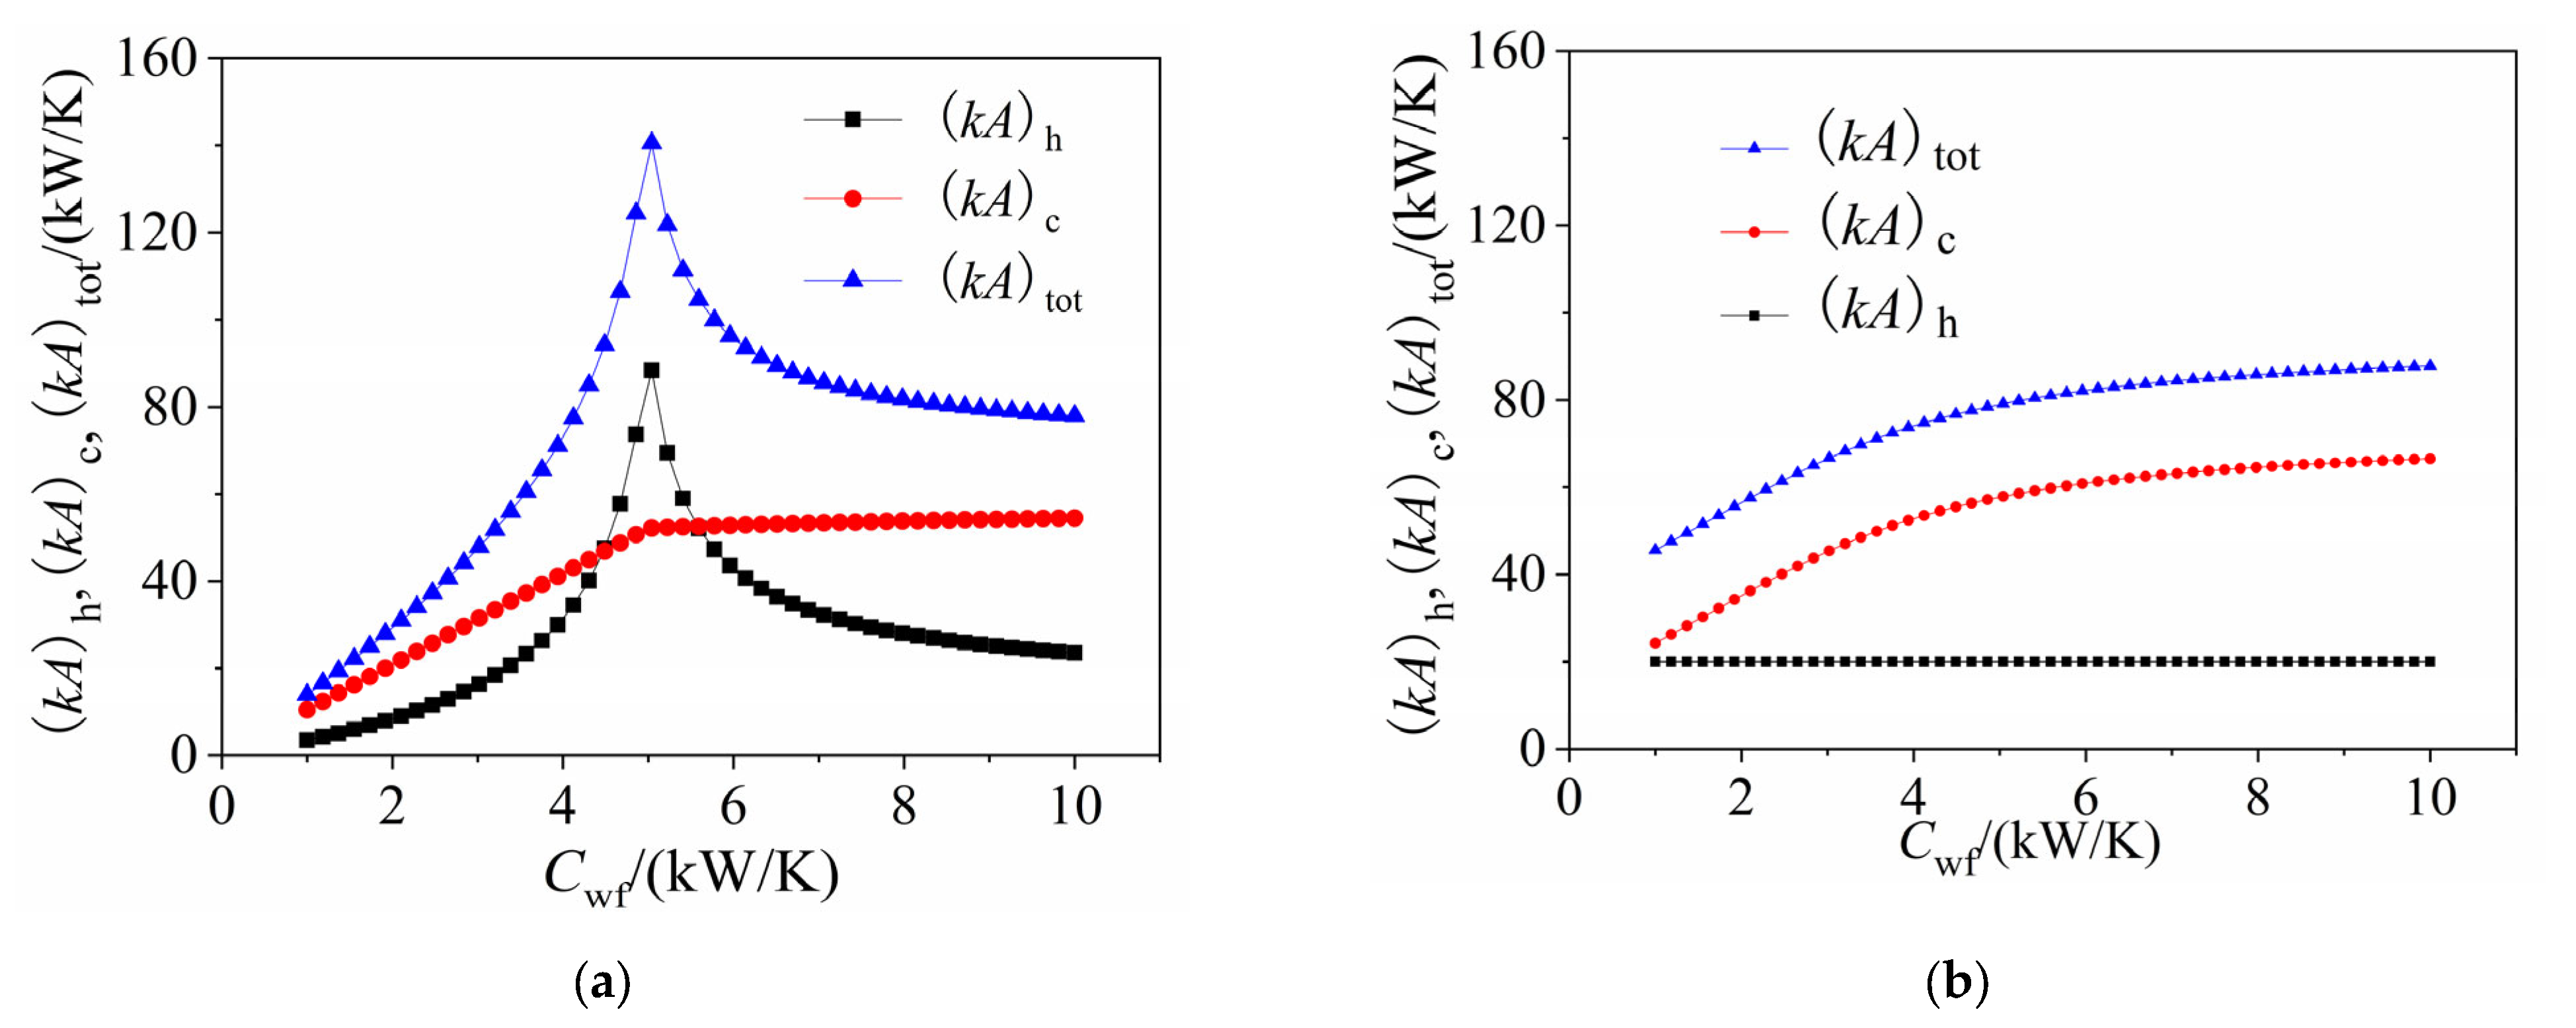
4.2. Effect of the Average Heat-Capacity Flow Rate of the Working Fluid on the Heat Transfer Capacity of the System

Figure 7a depicts the variation trends of the total heat transfer coefficient of the heater (kA)h and condenser (kA)c, as well as the sum of the two coefficients (kA)tot, with Cwf when ε = 0.95 and Chc = 5 kW/K. It reveals that (kA)h increased quickly and then decreased rapidly with the increase of Cwf. When Cwf = Chc, (kA)h reached the highest value. The increased rate of (kA)c for Cwf < Chc was larger than that for Cwf > Chc. Moreover, the conversion trend of (kA)tot showed great similarities to that of (kA)h. As depicted in Figure 7a, when Cwf was close to Chc, (kA)h was greater than (kA)c. In other cases, (kA)c was bigger than (kA)h. According to the simulation results in Section 4.2, when Cwf = Chc, Wnet attained its maximum value. At the same time, (kA)h reached the maximum of 88.3 kW/K. Taking the investment of the heat exchanger into account, the system economy is not necessarily good when Wnet is at its maximum.
As shown in Figure 7b, at (kA)h = 20 kW/K, (kA)c gradually increased and exceeded (kA)h. However, the increased rate of (kA)c decreased gradually. Furthermore, (kA)tot increased with (kA)c. As the simulation results mentioned above, Wnet had a maximum value when (kA)h = 20 kW/K and Cwf = Chc. Nevertheless, the heater efficiency was minimum. Therefore, Cwf should be selected, reasonably based on the actual situation.

5. Conclusions

This work developed a system model for a stable-flowing triangular cycle, simulated its thermodynamic process, and investigated the effects of key operational parameters on system performance. The following are the main conclusions:
(1) For the TC internal cycle, increasing T3 and decreasing T2 can improve the thermal efficiency and net power output of the cycle.
(2) For the TC heat recovery and power conversion system with constant parameters of the heat source fluid, the net power output increases at first and then decreases when ε or (kA)h is constant. The net power output can reach its maximum value at a certain average heat-capacity flow rate of the working fluid. In addition, the thermal efficiency and exergy efficiency should be taken into consideration as well; thus, a suitable objective function will be selected to optimize the thermodynamic performance of the system.
(3) For the TC heat recovery and power conversion system with constant parameters of the heat source fluid, when the total heat transfer coefficient of the heater (kA)h is constant, the heat transfer coefficient of the condenser (kA)c increases gradually with the increase of the average heat-capacity flow rate of the working fluid Cwf. Furthermore, (kA)c will increase to a value that is greater than (kA)h for a relatively small (kA)h. Under the condition that the effectiveness of the heater ε is 0.95, (kA)h increases first and then decreases. (kA)h will reach its maximum when Cwf = Chc. (kA)c increases gradually, however, the increase rate decreases gradually for Cwf > Chc.
(4) The performance of the TC will be improved when the heat transfer capacity between the working fluid and the heat source fluid and cooling water is enhanced. Besides, the balance of the investment and the performance of the system plays a significant role in reducing the cost of the heat exchanger and the wide application of TC. In the actual process, not only the heat transfer but also the increase in the amount of working fluid, heat source fluid, and cooling water significantly impact the net power output and thermal efficiency.

Author Contributions

Writing—original draft and methodology, L.L.; writing—review and editing and visualization, S.Z.; investigation, Y.J.; data curation, X.L.; validation, G.L.; resources, C.L.; data curation, Q.L.; software, H.G.; supervision and project administration, C.H. All authors have read and agreed to the published version of the manuscript.

Funding

This research was funded by the Science and Technology Innovation Talents in Universities of Henan Province (No.22HASTIT024).

Data Availability Statement

The data that support the findings of this study are available from the corresponding author upon reasonable request.

Conflicts of Interest

The authors declare that they have no known competing financial interests or personal relationships that could have appeared to influence the work reported in this paper.

Nomenclature

cpspecific heat at constant pressure (kJ/kg)ccondenser
Cthe average heat-capacity flow rate (kW/K)cacooling water
especific exergy (kJ/kg)exexergy
Eexergy (kW)expexpansion
hspecific enthalpy (kJ/kg)hheater
(kA)the heat transfer coefficient (kW/K)hcheat source fluid
mmass flow rate (kg/s)ia state point
ppressure (MPa)ininlet
qspecific heat absorption or heat release (kJ/kg)maxmaximum
Qheat absorption or heat release (kW)minminimum
Rthe ratio of average heat-capacity flow ratenetnet
sspecific entropy (kJ/(kg·K))outoutlet
Ttemperature (K)pumppump
ΔTthe pinch temperature difference (K)sideal state point
wspecific power (kJ/kg)ththermal
Wpower output or input (kW)tottotal
xdrynesswfworking fluid
SubscriptsGreek symbols
0environmental conditionsεeffectiveness of heat exchanger
1–8state pointsηefficiency

References

  1. Javadi, M.A.; Ghomashi, H.; Taherinezhad, M.; Nazarahari, M.; Ghasemiasl, R. Comparison of Monte Carlo Simulation and Genetic Algorithm in Optimal Wind Farm Layout Design in Manjil Site Based on Jensen Model. In Proceedings of the 7th Iran Wind Energy Conference (IWEC2021), Shahrood, Iran, 17–18 May 2021. [Google Scholar] [CrossRef]
  2. Chen, J.; Zhang, Y.; Xu, Z.; Li, C. Flow characteristics analysis and power comparison for two novel types of vertically staggered wind farms. Energy 2023, 263, 126141. [Google Scholar] [CrossRef]
  3. Ancona, M.A.; Bianchi, M.; Branchini, L.; De Pascale, A.; Melino, F.; Peretto, A.; Poletto, C.; Torricelli, N. Solar driven micro-ORC system assessment for residential application. Renew. Energy 2022, 195, 167–181. [Google Scholar] [CrossRef]
  4. Yang, J.; Li, J.; Yang, Z.; Duan, Y. Thermodynamic analysis and optimization of a solar organic Rankine cycle operating with stable output. Energy Convers. Manag. 2019, 187, 459–471. [Google Scholar] [CrossRef]
  5. Bina, S.M.; Jalilinasrabady, S.; Fujii, H. Energy, economic and environmental (3E) aspects of internal heat exchanger for ORC geothermal power plants. Energy 2017, 140, 1096–1106. [Google Scholar] [CrossRef]
  6. Surindra, M.D.; Caesarendra, W.; Prasetyo, T.; Mahlia, T.M.I.; Taufik. Comparison of the Utilization of 110 °C and 120 °C Heat Sources in a Geothermal Energy System Using Organic Rankine Cycle (ORC) with R245fa, R123, and Mixed-Ratio Fluids as Working Fluids. Processes 2019, 7, 113. [Google Scholar] [CrossRef] [Green Version]
  7. Vélez, F.; Segovia, J.J.; Martín, M.C.; Antolín, G.; Chejne, F.; Quijano, A. A technical, economical and market review of organic Rankine cycles for the conversion of low-grade heat for power generation. Renew. Sustain. Energy Rev. 2012, 16, 4175–4189. [Google Scholar] [CrossRef]
  8. Chan, C.; Ling-Chin, J.; Roskilly, A.P. A review of chemical heat pumps, thermodynamic cycles and thermal energy storage technologies for low grade heat utilisation. Appl. Therm. Eng. 2013, 50, 1257–1273. [Google Scholar] [CrossRef]
  9. Hays, L.; Welch, P.; Boyle, P. The organic triangle cycle experience and status. Energy Procedia 2017, 129, 1034–1040. [Google Scholar] [CrossRef]
  10. Iqbal, A.; Rana, S.; Ahmadi, M.; Date, A.; Akbarzadeh, A. Experimental study on the prospect of low-temperature heat to power generation using Trilateral Flash Cycle (TFC). Appl. Therm. Eng. 2020, 172, 115139. [Google Scholar] [CrossRef]
  11. Iqbal, A.; Rana, S.; Ahmadi, M.; Date, A.; Akbarzadeh, A. Trilateral Flash Cycle (TFC): A promising thermodynamic cycle for low grade heat to power generation. Energy Procedia 2019, 160, 208–214. [Google Scholar] [CrossRef]
  12. Smith, I.K. Development of the Trilateral Flash Cycle System: Part 1: Fundamental Considerations. Proc. Inst. Mech. Eng. Part A J. Power Energy 1993, 207, 179–194. [Google Scholar] [CrossRef]
  13. Smith, I.K.; Da Silva, R.P.M. Development of the Trilateral Flash Cycle System Part 2: Increasing Power Output with Working Fluid Mixtures. Proc. Inst. Mech. Eng. Part A J. Power Energy 1994, 208, 135–144. [Google Scholar] [CrossRef]
  14. Smith, I.K.; Stosic, N.; A Aldis, C. Development of the Trilateral Flash Cycle System: Part 3: The Design of High-Efficiency Two-Phase Screw Expanders. Proc. Inst. Mech. Eng. Part A J. Power Energy 1996, 210, 75–93. [Google Scholar] [CrossRef]
  15. Bryson, M. Conversion of Low Grade Heat into Electricity Using the Thermosyphon Rankine Engine and Trilateral Flash Cycle; RMIT University: Melbourne, VIC, Australia, 2007. [Google Scholar]
  16. Steffen, M.; Löffler, M.; Schaber, K. Efficiency of a new Triangle Cycle with flash evaporation in a piston engine. Energy 2013, 57, 295–307. [Google Scholar] [CrossRef]
  17. Fischer, J. Comparison of trilateral cycles and organic Rankine cycles. Energy 2011, 36, 6208–6219. [Google Scholar] [CrossRef]
  18. Lai, N.A.; Fischer, J. Efficiencies of power flash cycles. Energy 2012, 44, 1017–1027. [Google Scholar] [CrossRef]
  19. Arbab, I.; Sohel, R.; Mahdi, A.; Thomas, C.; Abhijit, D.; Aliakbar, A. Prospects of Trilateral Flash Cycle (TFC) for Power Generation from Low Grade Heat Sources. EDP Sci. 2018, 64, 06004. [Google Scholar] [CrossRef] [Green Version]
  20. Ajimotokan, H.A. A Study of Trilateral Flash Cycles for Low-Grade Waste Heat Recovery-to-Power Generation; Cranfield University: Cranfield, UK, 2014. [Google Scholar]
  21. Antonopoulou, C.; Atsonios, K.; Grammelis, P.; Manolakos, D.; Skiadopoulos, A.; Bakalis, P. Thermodynamic Analysis on Trilateral Flash Cycle (TFC) for Low Grade Heat to Power Generation Using Different Working Fluids. In Proceedings of the 6th International Seminar on ORC Power Systems, online, 11–13 October 2021. [Google Scholar]
  22. Chang, N.; Zhu, J.; Chen, G.; Zhang, P.; Song, A. Working fluids selection from perspectives of heat source and expander for a Trilateral cycle. Energy Procedia 2019, 158, 1579–1584. [Google Scholar] [CrossRef]
  23. Feng, Y.; Chen, X.; Xu, X.F. Current status and potentials of enhanced geothermal system in China: A review. Renew. Sustain. Energy Rev. 2014, 33, 214–223. [Google Scholar] [CrossRef]
  24. Zhang, D.; Wang, J.; Lin, Y.; Si, Y.; Huang, C.; Yang, J.; Huang, B.; Li, W. Present situation and future prospect of renewable energy in China. Renew. Sustain. Energy Rev. 2017, 76, 865–871. [Google Scholar] [CrossRef]
  25. Wang, S.; Liu, C.; Zhang, C.; Xu, X.; Li, Q. Thermo-economic evaluations of dual pressure organic Rankine cycle (DPORC) driven by geothermal heat source. J. Renew. Sustain. Energy 2018, 10, 063901. [Google Scholar] [CrossRef]
  26. Zhang, C.; Liu, C.; Xu, X.; Li, Q.; Wang, S.; Chen, X. Effects of superheat and internal heat exchanger on thermo-economic performance of organic Rankine cycle based on fluid type and heat sources. Energy 2018, 159, 482–495. [Google Scholar] [CrossRef]
  27. Hays, L.; Otsuka, A.; Boyle, P. Sea Trials of an Organic Triangle System (OTC) for Waste Heat Recovery. In Proceedings of the 6th International Seminar on ORC Power Systems, Online, 11–13 October 2021. [Google Scholar]
  28. Zeynali, A.; Akbari, A.; Khalilian, M. Investigation of the performance of modified organic Rankine cycles (ORCs) and modified trilateral flash cycles (TFCs) assisted by a solar pond. Sol. Energy 2019, 182, 361–381. [Google Scholar] [CrossRef]
  29. Sphaier, L.; Worek, W. Parametric analysis of heat and mass transfer regenerators using a generalized effectiveness-NTU method. Int. J. Heat Mass Transf. 2009, 52, 2265–2272. [Google Scholar] [CrossRef]
  30. Zhou, Y.; Tang, J.; Zhang, C.; Li, Q. Thermodynamic Analysis of the Air-Cooled Transcritical Rankine Cycle Using CO2/R161 Mixture Based on Natural Draft Dry Cooling Towers. Energies 2019, 12, 3342. [Google Scholar] [CrossRef] [Green Version]
  31. Cengel, Y.A.; Klein, S.; Beckman, W. Heat Transfer: A Practical Approach. McGraw-Hill: Boston, MA, USA, 1998. [Google Scholar]
Figure 1. Schematic diagram (a) and temperature-enthalpy diagram (b) of the TC system.
Processes 11 00357 g001
Figure 2. The variation of thermodynamic performance with T2: (a) Qh and Wnet; (b) the thermal efficiency and exergy efficiency by numerical simulations (ηth,ns and ηex,ns) and those by theoretical calculations (ηth,tc and ηex,tc).
Processes 11 00357 g002
Figure 3. The variation of thermodynamic performance with T3: (a) Qh and Wnet; (b) the thermal efficiency and exergy efficiency by numerical simulations (ηth,ns and ηex,ns) and those by theoretical calculations (ηth,tc and ηex,tc).
Processes 11 00357 g003
Figure 4. The variation of expansion ratio and dryness at the outlet of the expander with (a) T2; (b) T3.
Processes 11 00357 g004
Figure 5. The impact of Cwf on the thermal performance of the system for a constant ε: (a) Qh and Wnet; (b) ηth and ηex.
Processes 11 00357 g005
Figure 6. The impact of Cwf on the thermal performance of the system for a constant (kA)h: (a) Qh and Wnet; (b) ηth and ηex.
Processes 11 00357 g006
Figure 7. The impact of Cwf on the heat transfer capacity of the system: (a) ε remains constant; (b) (kA)h remains constant.
Processes 11 00357 g007
Table 1. Validation of the model.
ParametersT1/KT2/KT3/KT4/Kp1/kPap3/kPaηth/%
Fischer’s work358.15360.21590358.1557.8710,8610.198
Present work358.15360.21590358.1557.8710,8610.1947
Table 2. Boundary parameters of the TC.
ParametersValueUnit
Heat source fluid inlet temperature T5423K
Pump adiabatic efficiency ηpump85%
Expander adiabatic efficiency ηexp85%
Ambient temperature T0298.15K
Working fluid temperature range309–496.5K
Cooling water inlet temperature T7298.15K
Condenser pinch temperature difference ΔTp5K
Disclaimer/Publisher’s Note: The statements, opinions and data contained in all publications are solely those of the individual author(s) and contributor(s) and not of MDPI and/or the editor(s). MDPI and/or the editor(s) disclaim responsibility for any injury to people or property resulting from any ideas, methods, instructions or products referred to in the content.

