Article

Classification of Quality Characteristics of Surimi Gels from Different Species Using Images and Convolutional Neural Network

by
Won Byong Yoon
1,2,
Timilehin Martins Oyinloye
1,2,* and
Jinho Kim
3
1
Department of Food Science and Biotechnology, College of Agriculture and Life Sciences, Kangwon National University, 1 Kangwondaehak-gil, Chuncheon 24341, Republic of Korea
2
Elder-Friendly Research Center, Agriculture and Life Science Research Institute, Kangwon National University, 1 Kangwondaehak-gil, Chuncheon 24341, Republic of Korea
3
Swiss School of Management—Seoul, #202 Wellbeing Center, Worldcup-ro 37, Mapo-gu, Seoul 04056, Republic of Korea
*
Author to whom correspondence should be addressed.
Processes 2023, 11(10), 2864; https://doi.org/10.3390/pr11102864
Submission received: 7 September 2023 / Revised: 22 September 2023 / Accepted: 26 September 2023 / Published: 28 September 2023

Abstract

:
In the aspect of food quality measurement, the application of image analysis has emerged as a powerful and versatile tool, enabling a highly accurate and efficient automated recognition and the quality classification of visual data. This study examines the feasibility of employing an AI algorithm on labeled images as a non-destructive method to classify surimi gels. Gels were made with different moisture (76–82%) and corn starch (5–16%) levels from Alaska pollock and Threadfin breams. In surimi gelation, interactions among surimi, starch, and moisture caused color and quality shifts. Color changes are indicative of structural and quality variations in surimi. Traditional color measuring techniques using colorimeter showed insignificant differences (p < 0.05) in color values and whiteness among treatments. This complexity hindered effective grading, especially in intricate formulations. Despite insignificant color differences, they signify structural changes. The Convolutional Neural Network (CNN) predicts the visual impact of moisture and starch on gel attributes prepared with different surimi species. Automated machine learning assesses AI algorithms; and CNN’s 70:30 training/validation ratio involves 400–700 images per category. CNN’s architecture, including input, convolutional, normalization, Rectified Linear Unit (ReLU) activation, and max-pooling layers, detects subtle structural changes in treated images. Model test accuracies exceed 95%, validating CNN’s precision in species and moisture classification. It excels in starch concentrations, yielding > 90% accuracy. Average precision (>0.9395), recall (>0.8738), and F1-score (>0.8731) highlight CNN’s high performance. This study demonstrates CNN’s value in non-destructively classifying surimi gels with varying moisture and starch contents across species, and it provides a solid foundation for advancing our understanding of surimi production processes and their optimization in the pursuit of high-quality surimi products.

1. Introduction

Surimi is a stabilized fish protein derived from mechanically deboned fish flesh that has been washed with water and blended with cryo-protectants. It can mimic the unique textures of seafood [1]. The global surimi market, valued at USD 6.1 billion in 2023, is projected to grow at an annual compound growth rate (CAGR) of approximately 6%, with anticipated global demand reaching USD 11 billion by the same year [2]. Serving as a foundational component in the creation of surimi-based seafood products such as crab analogues, kamaboko, eamook, and fish balls, surimi holds the position of an intermediate product. Following a salting and grinding process, these surimi seafood products undergo heat-induced gelation [1,3], forming distinctive texture and quality attributes ascribed to the three-dimensional networks of myofibrillar proteins.
The adaptability of surimi, combined with its neutral taste, inherent order, and colorlessness, paves the way for an array of flavors, tastes, or colors in surimi-based seafood products. This flexibility is achieved through the application of formulated seasonings, flavors, and colors. The ultimate consumer reception of surimi-based products rests significantly upon the functional characteristics of surimi gels, particularly in terms of texture and color [4]. Central determinants influencing these functional traits encompass the selection of fish species employed in surimi production, moisture content in both surimi and surimi gels, as well as the integration of supplementary ingredients.
Various fish species are employed in the production of surimi. Among these, Alaska pollock (Gadus chalcogrammus) and Threadfin bream (Nemipterus japonicus) are notably prominent [5,6]. The proteins within these fish exhibit distinct characteristics influenced by the species and their respective natural environments, including water temperature. The species itself plays a pivotal role, not only in shaping the quality attributes of surimi-based seafood, but also in determining the necessary processing conditions [2,6]. For instance, Threadfin bream, a common tropical fish used in surimi production, displays remarkable temperature tolerance (<28 °C) [1]. Consequently, the optimal processing conditions such as mixing operations at room temperature for Threadfin bream differ from the conventional methods developed for Alaska pollock with a temperature tolerance that is <10 °C [7,8].
Water stands as the second most crucial ingredient in surimi-based seafood. The moisture content within both surimi and surimi gels plays a vital role in managing the texture and color of these products. Assessing the texture properties and the whiteness of surimi gels produced with varying moisture contents allows for the evaluation of both the quality and quantity of proteins in the surimi [4,9]. Water within surimi gels becomes entrapped within three-dimensional networks, thus contributing to the elastic properties closely tied to the texture characteristics of the gels. The role of water within a mixture of surimi, starch, and water is more intricate compared to its role within a surimi water gel [10,11]. Maintaining a well-regulated moisture content within surimi gels serves as a crucial parameter and a valuable tool for ensuring the quality of surimi-based seafood products. While specific moisture content ranges can vary depending on the desired product characteristics and the specific surimi formulation, a typical range might fall between 75% and 82%, but this can be adjusted based on the product’s intended texture and other factors [1,4,5,6]. Ultimately, a well-controlled moisture content serves as a valuable tool for achieving consistent quality in surimi-based seafood products.
When high-quality surimi is combined with an appropriate amount of water, the resulting gels tend to exhibit high elasticity in their mechanical properties, leading to a rubbery texture [12]. In order to better align with consumers’ preferences for texture, the addition of ingredients that modify both the textural and water mobility properties of surimi is necessary [12,13]. In the realm of composite foods like surimi seafood, the manipulation of texture can be achieved through the incorporation of both protein and starch. Particularly, the addition of starch is the most common method for controlling both texture and cost, as starch is less expensive than high-quality surimi or other protein sources such as egg white [13,14]. Additionally, the presence of starch has an impact on the color of surimi gels [14,15]. However, excessive starch content in surimi gels can lead to negative effects on consumers’ perceptions, particularly in terms of hardness and chewiness [13]. Consequently, the quantity of starch added to surimi gels is meticulously regulated, usually below 10% [13,14].
The criteria for managing the quality of the final surimi products are texture and whiteness [15,16,17]. Typically, for texture analysis, a texture analyzer is utilized, while for whiteness, a colorimeter is used to measure L, a, and b values for quality control. The L value represents lightness, a value signifies the degree of redness or greenness, and b value indicates the degree of yellowness or blueness in the product. These objective measurements offer distinct advantages over traditional sensory evaluations, providing statistical significance and enabling robust statistical quality control [14,18]. Setting quality management standards based on texture and whiteness measurements offers advantages, particularly when the composition of the produced items is simple and uniform. However, in cases where the product composition is diverse and the formulations for a single product are complex, confirming statistical significance can become challenging. Particularly challenging in quality management on the production floor is determining whether the formulation composing the final product is manufactured identically to the recipe. Traditional methods of texture measurement or color measurement may not always reveal quality differences stemming from variations in the blend ratios. Observations of such differentiations often rely heavily on the judgment of skilled inspectors.
Recently, quality management techniques for food products based on image analysis have been increasingly adopted. Particularly, image analysis is highly advantageous due to its non-destructive nature. Samples utilized in image analysis can be subjected to destructive quality measurements or sensory evaluations, enabling mutual validation between different quality measurement techniques. This inter-validation greatly enhances the utility of quality measurement methods. For instance, ElMasry and Nakauchi [19] explored the use of non-invasive image analysis as a tool for assessing food quality. Their study delved into the application of imaging systems to examine the physical characteristics of various food varieties. Furthermore, researchers have employed image analysis to assess the moisture content in black tea and sea buckthorn by scrutinizing sample surface images [20,21]. This approach presents a non-destructive method for evaluating quality and streamlines the development of a grading system for samples. In addition, in the study by Mendoza et al. [22], a computer vision system was implemented to quantify the quality defects in fruits and vegetables by analyzing the color spectrum in the captured images against a standard color threshold for the fruits and vegetables. Similarly, image processing was also used as a quality assessment tool for pork meat by analyzing the meat product lightness [23]. Within the realm of quality management through image analysis, the establishment of quality criteria and suitability assessments is achieved through artificial intelligence-driven analysis algorithms [24].
In the field of food data analysis, a range of conventional machine learning algorithms is employed, encompassing support vector machines (SVM), K-means clustering, and artificial neural networks (ANN) [25,26,27]. Machine learning, a subset of artificial intelligence, facilitates the extraction of knowledge from extensive datasets [26]. The central objective of machine learning involves the development of algorithms that autonomously learn, enhance, and generalize based on examples, enabling predictions or decisions without explicit programming. A subclass within machine learning, known as deep learning, features powerful algorithms like Convolutional Neural Networks (CNNs). The widespread adoption of CNNs can be attributed to their prowess in handling unstructured data and achieving impressive outcomes [25]. A defining characteristic of CNNs is their robust capacity for automatic feature extraction, a key factor contributing to their success across diverse applications.
In the case of surimi seafood, there exist variations in quality due to the diversity of fish species comprising the raw surimi, the grade of raw surimi, moisture content in the included surimi, and the quantity of additives. Research on mechanical measurement methods and sensory evaluation to analyze these differences has been extensively reported [4,28,29]. However, compared to other processed foods, there is a lack of reported studies on quality classification methods utilizing image analysis and artificial intelligence algorithms. This study aims to investigate the feasibility of artificial intelligence in non-destructive quality management through the use of image analysis and artificial intelligence algorithms to discriminate surimi gels based on the species of raw surimi and the moisture and starch contents within surimi gels.
Therefore, this study pursued two primary objectives: (1) the development of a Convolutional Neural Network (CNN) model by employing image data from the surface of surimi to predict moisture content within surimi gels of varying species, and (2) the development of CNN models by utilizing image data from the surimi surface to predict starch content within surimi gels across different species and/or grades.

2. Materials and Methods

2.1. Preparation of Surimi Gel

Frozen Alaska pollock surimi (FA grade, Premier pacific seafood, Inc., Seattle, WA, USA), containing 75.23 ± 0.17% moisture and a pH of 6.81 ± 0.01, as well as Threadfin bream surimi (A grade, Thai Marina partners Co., Ltd., Mahachai, Thailand) with 73.61 ± 0.23% moisture and a pH of 6.72 ± 0.01, were used. Prior to usage, the surimi was stored at a temperature of −65 °C. To prepare the surimi gel, 400 g of frozen surimi was partially thawed in a refrigerator (4 °C) for 12 h, and then cut into small pieces. These pieces were then subjected to chopping at 1800 rpm for 1 min using a universal food processor (Model UMC5, Stephan Machinery Corp., Hameln, Germany). Throughout the chopping process, a cooling medium (ice water) was circulated within the double-walled chopping bowl to maintain the sample’s temperature below 4 °C. Sodium chloride (2 wt%) was added and mixed with the surimi at a speed of 2100 rpm for 1 min under a pressure of 0.5 bar [30]. Different concentra tions of corn starch with a moisture content of 12.04 ± 0.15% (Ottogi Corporation Ltd., Anyang-si, Gyeonggi-do, Republic of Korea) and ice water, as outlined in Table 1, were then added to the resulting surimi sol to control the overall sample moisture and starch content. The moisture contents and the level of corn starch were decided based on the preliminary tests that showed the proper formation of surimi gel. Specifically, the starch concentration was chosen within the minimum and maximum range that forms proper gel during steaming operation. The mixture underwent further mixing at a speed of 2100 rpm for 5 min under 0.5 bar pressure to eliminate the air pockets formed during the chopping process. The resultant emulsified surimi paste was stuffed into plastic casings with a diameter of 2 cm, and the openings were securely sealed. The resulting emulsified surimi paste were 10 ± 0.5 cm in length, and weighed 80 ± 2 g. All samples were subjected to heating in a water bath at 90 °C for a duration of 30 min. Following this, they were stored at a temperature of 4 °C prior to undergoing further analysis.

2.2. Determination of Surimi Gel Whiteness

The color of the surimi gels was measured using a colorimeter (Model TC-1500 DX, Tokyo Denshoku Co., Ltd., Tokyo, Japan). The L, a, and b values were recorded, with L denoting lightness on a 0–100 scale from black to white; a, red (+) or green (−); and b, yellow (+) or blue (−). A ‘whiteness’ index for overall color evaluation of surimi was also used and calculated using Equation (1) below [31]:
W = 100 ( ( 100 L ) 2 + a 2 + b 2 ) 1 2

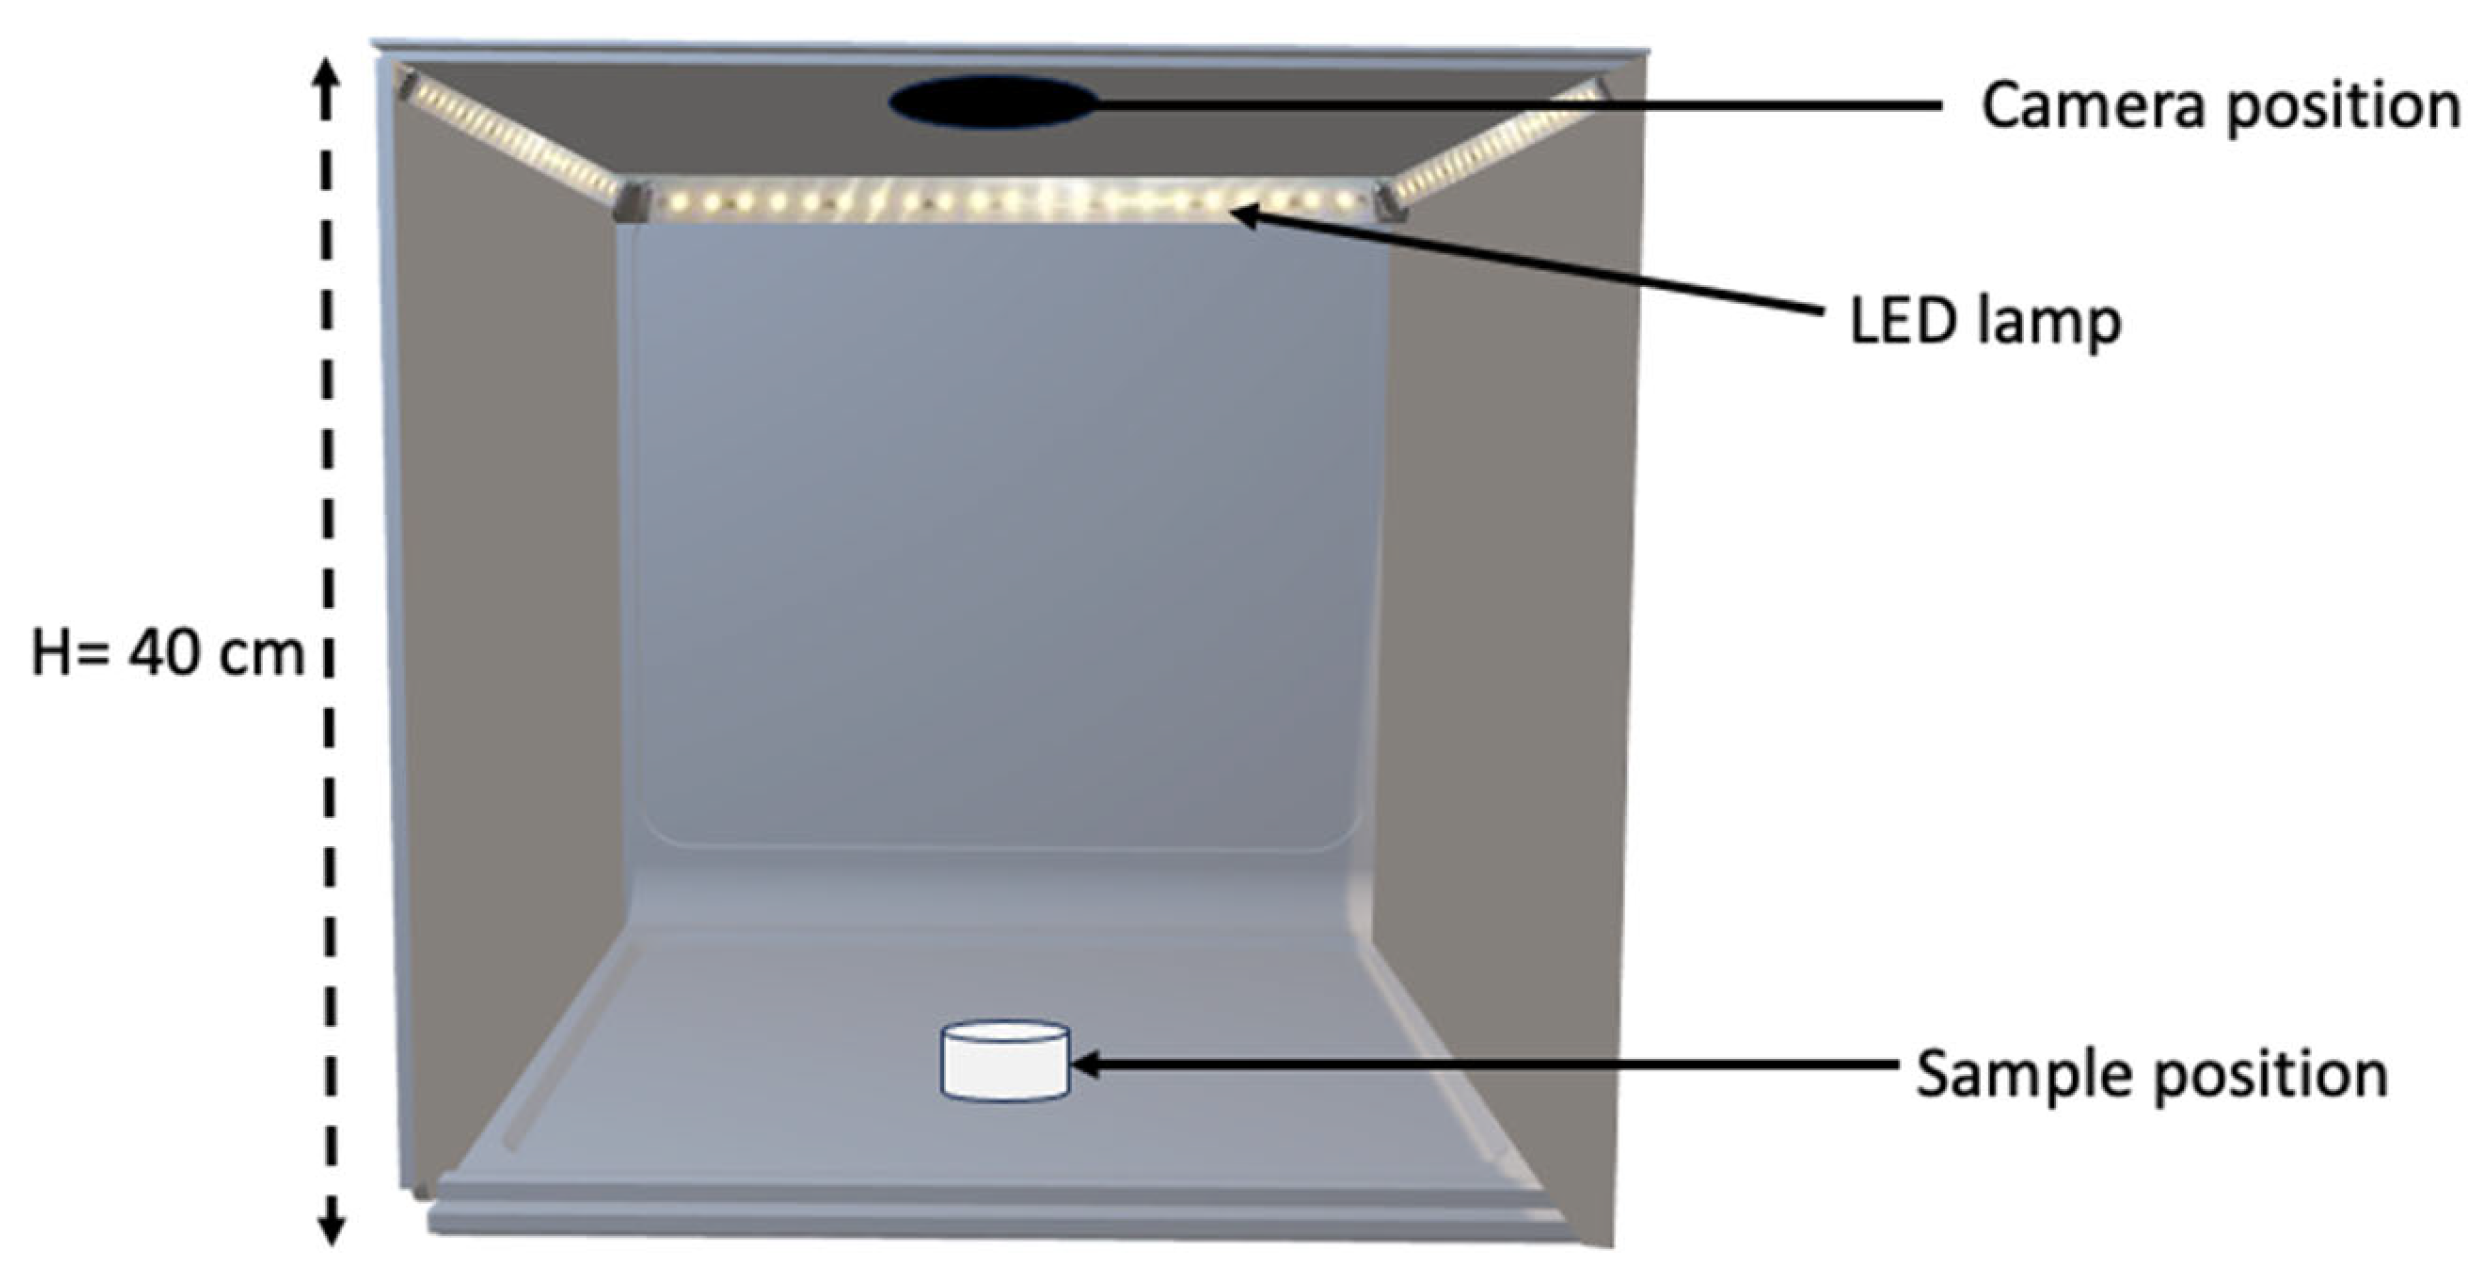
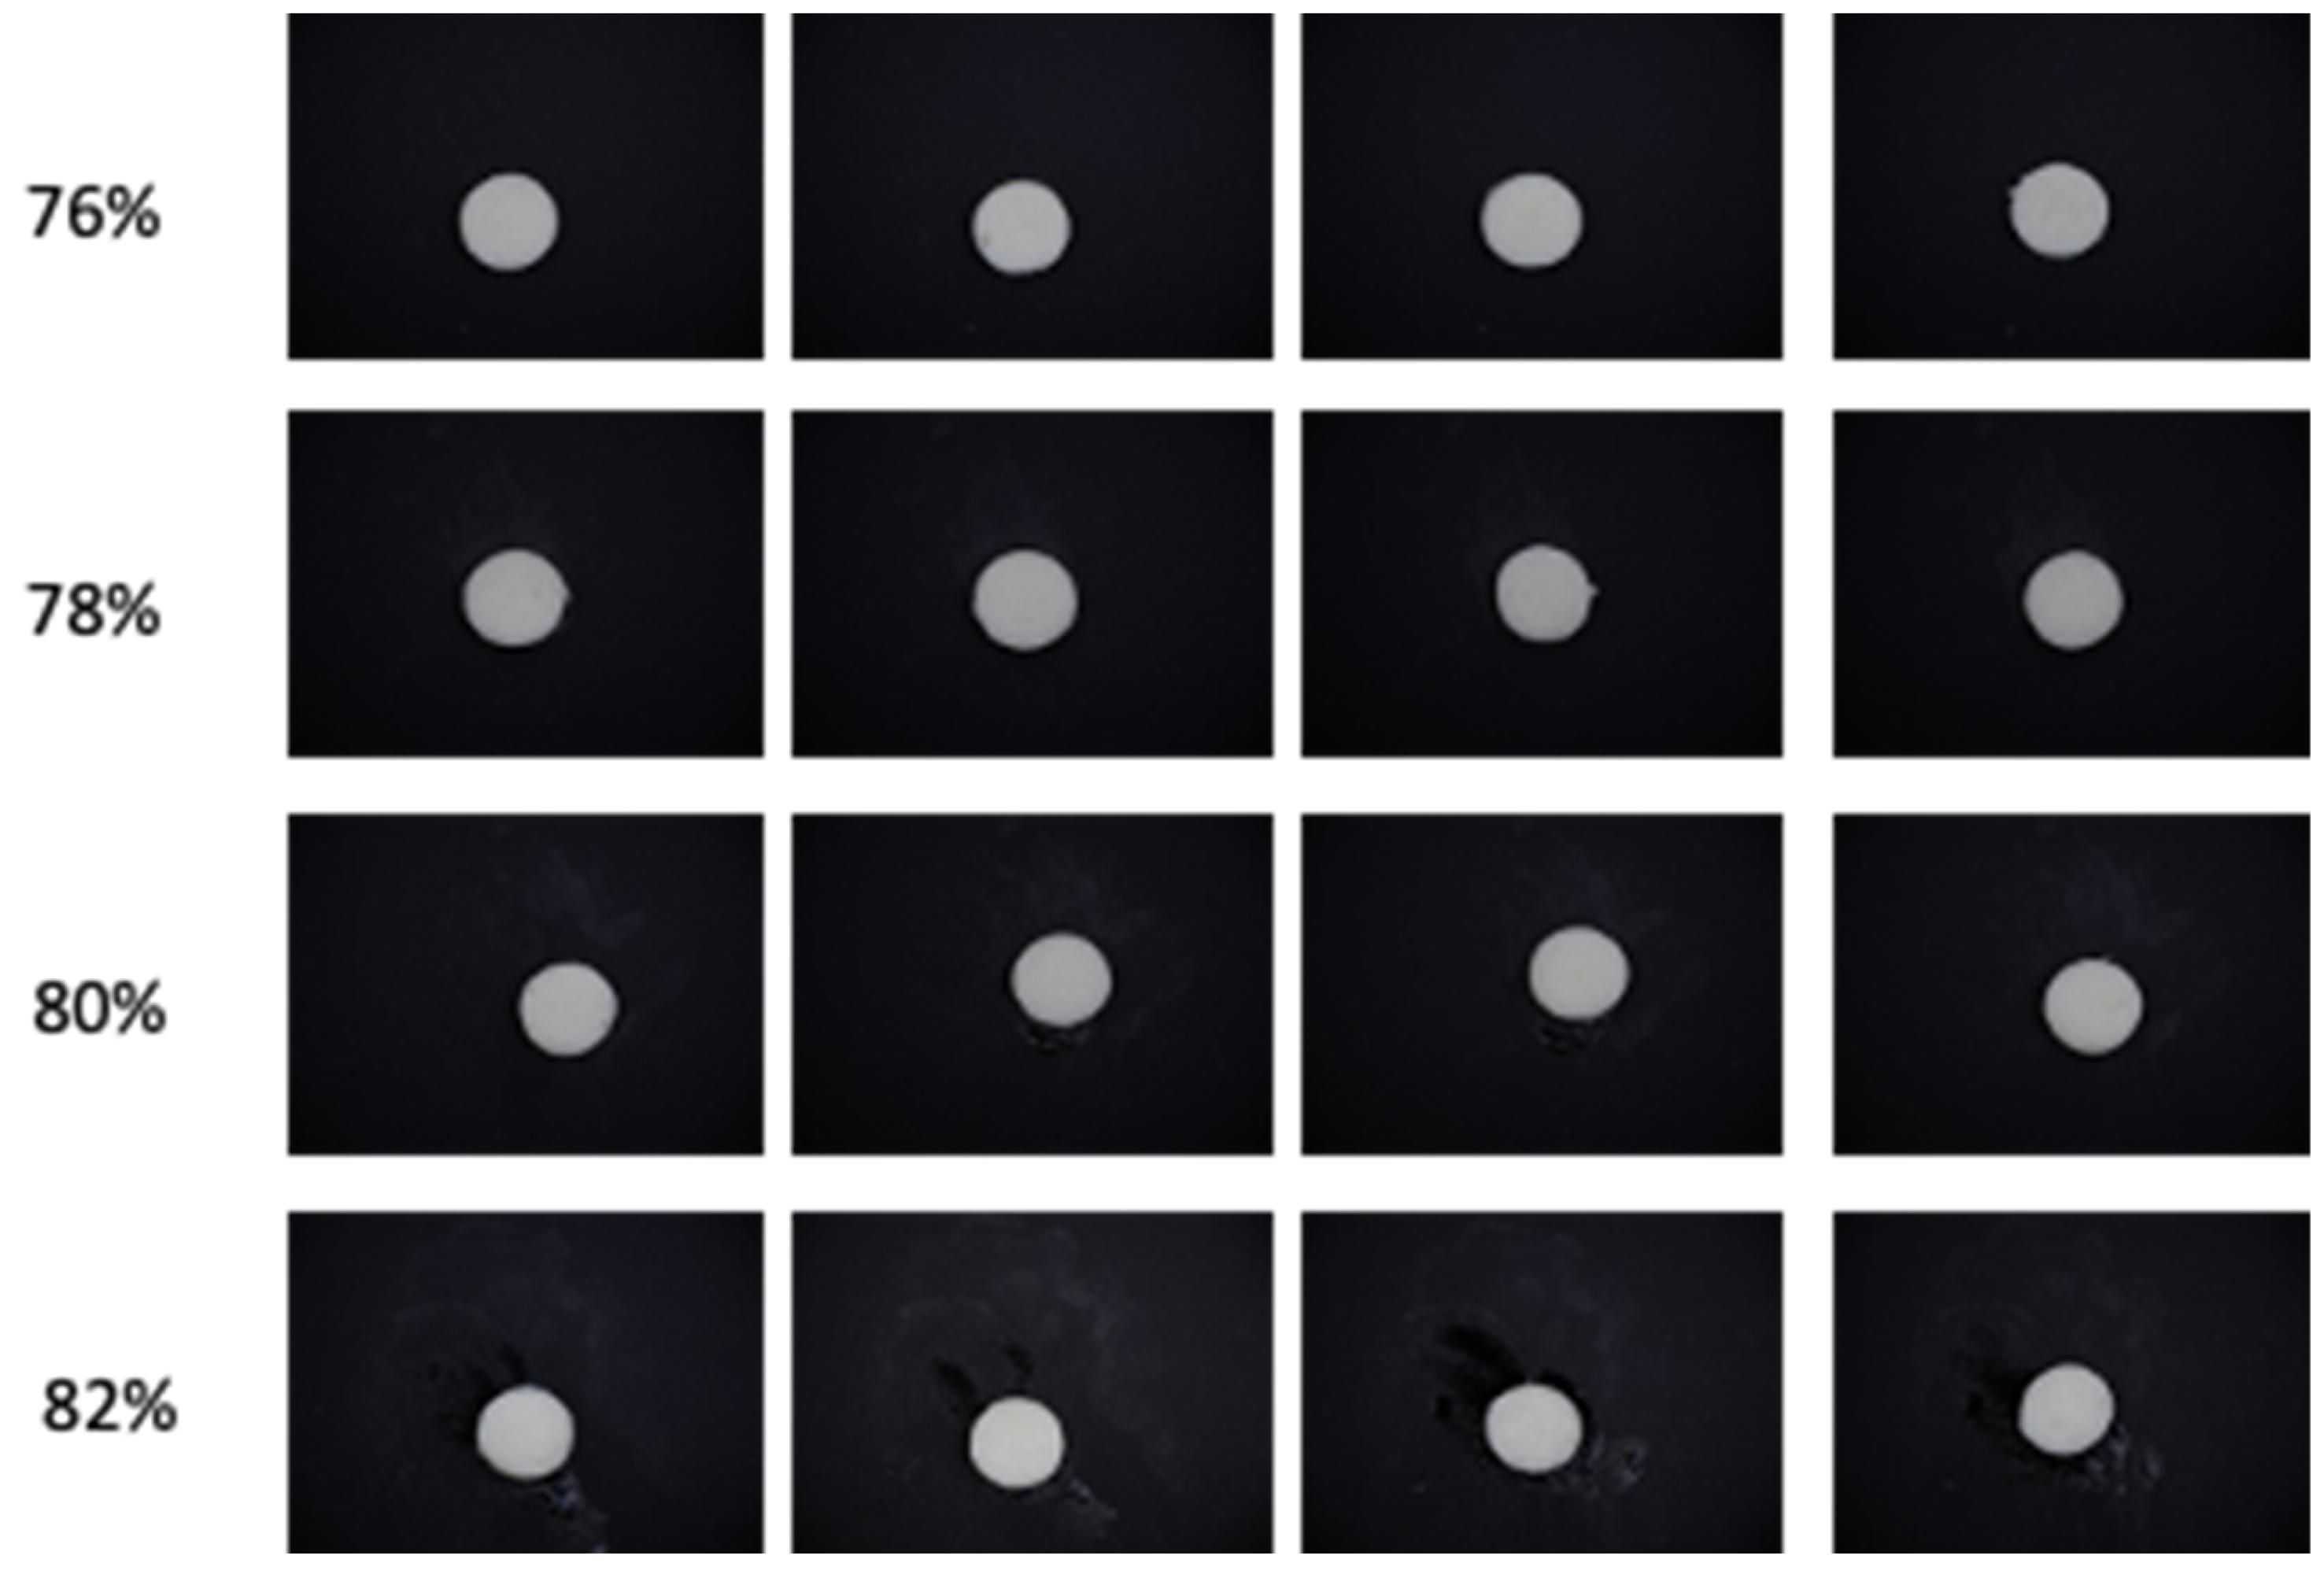
2.3. Image Acquisition System and Data Processing
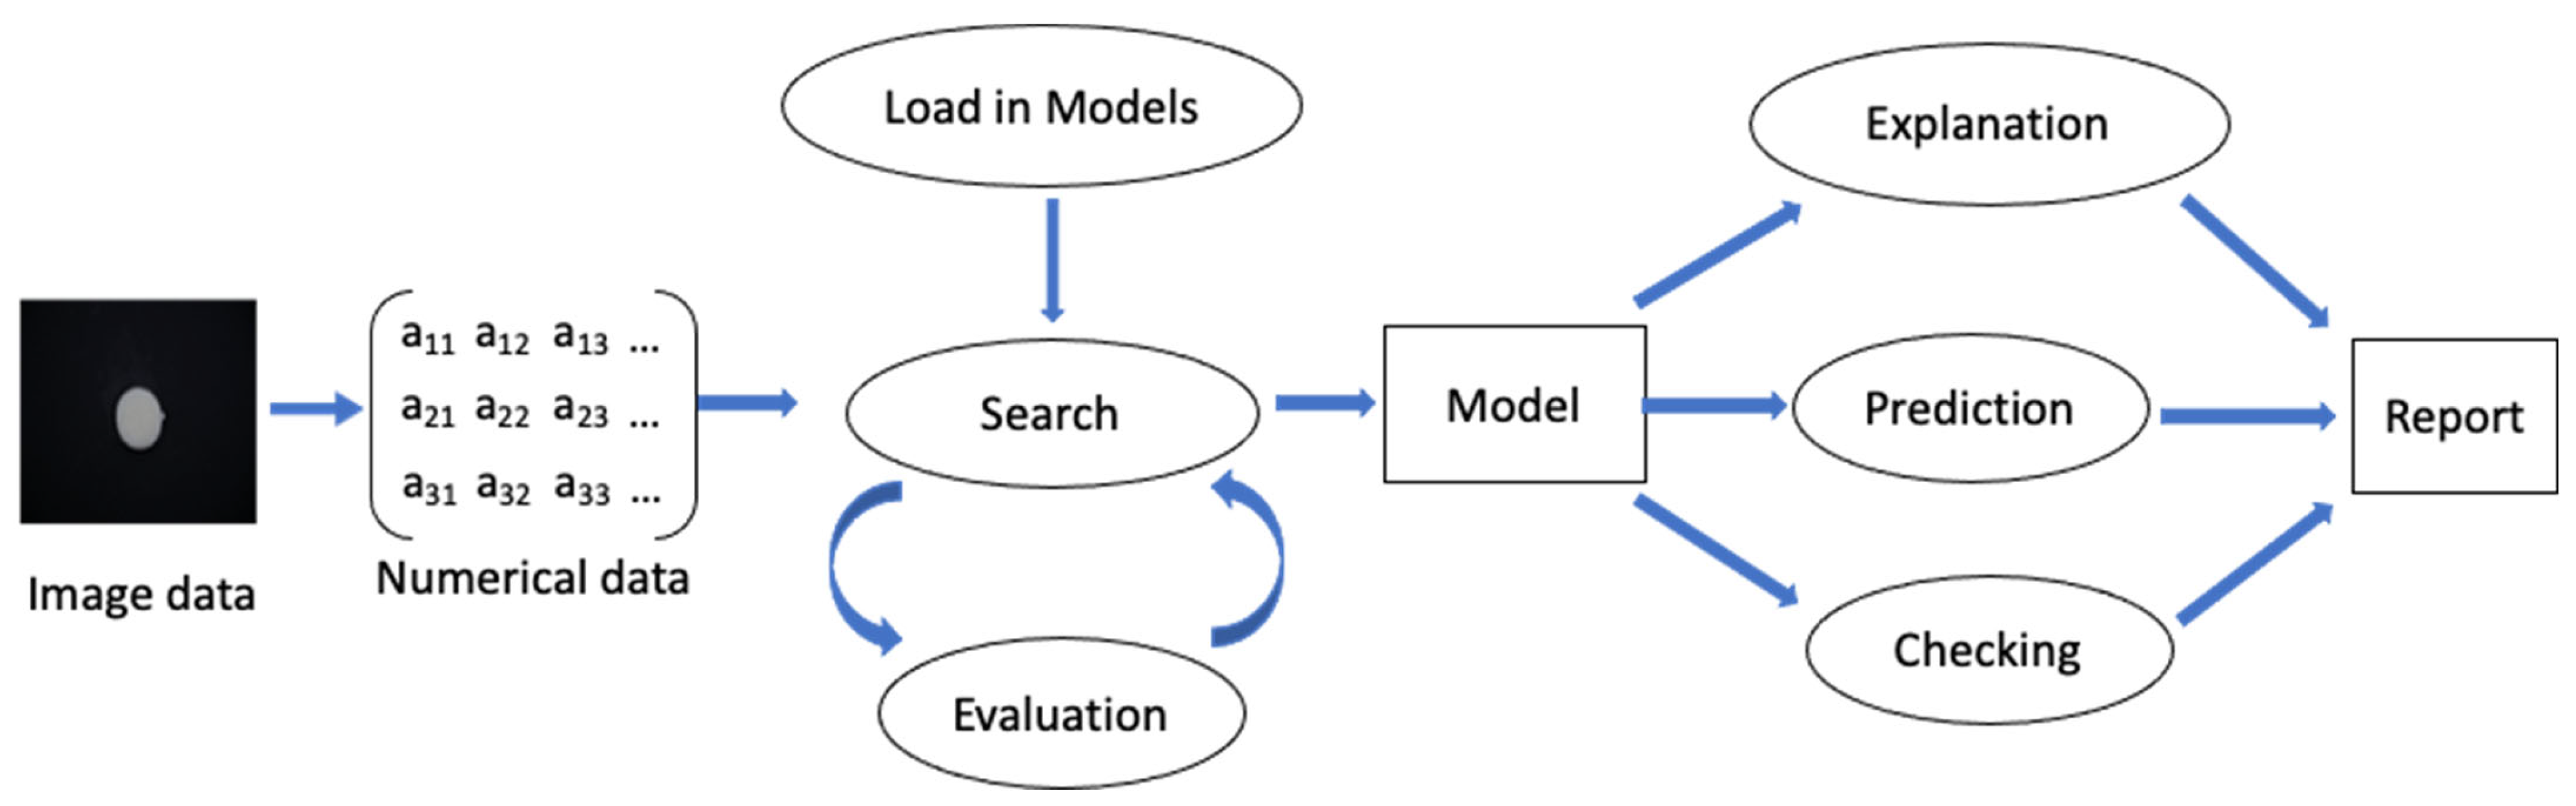
The surimi gel samples (kept at 4 °C) were carefully cut into cylindrical shapes (with a diameter of 2 cm and a height of 1 cm) using a surgical blade (model no 11, Feather safety razor Co., Ltd., Osaka, Japan). This process ensured a uniform and smooth surface for the samples. Subsequently, the prepared samples were positioned at the center of a PhotoBox measuring 38 cm in length, 40 cm in width, and 45 cm in height (Figure 1). To ensure optimal lighting conditions without casting shadows, 25 W slim-lens LED lamps (model 941-XHP70DD0ZH227G, Mouser Electronics, Inc., Mansfield, TX, USA) were affixed to the four upper corners of the PhotoBox. Images of the samples were taken using a digital camera (Model DC-GX9, Panasonic, Osaka, Japan) with an image resolution of 2.07 million pixels (Figure 2). To prevent external light interference, the exterior of the PhotoBox was designed to be translucent. After capturing an image of each sample, the respective sample was discarded. For each species and preparation condition, a total of 500 to 700 images were captured. From each set, 50 images were reserved for model verification purposes. The remaining images were divided into training and testing sets in a ratio of 7:3. Consequently, a minimum of 100 sample images were utilized as input images for testing the trained CNN model.

2.4. Modeling

2.4.1. Determination of Training Model (Auto Machine Learning)

Various conventional machine learning algorithms frequently used for image training and identification were identified from the literature [32,33,34,35]. These encompass K-Nearest Neighbors (KNNs), Logistic Regression (LR), Support Vector Machine (SVM), Naïve Bayes (NB), Linear Discriminant Analysis (LDA), AdaBoost, and Convolutional Neural Network (CNN). For conventional models, image feature extraction is essential. However, due to the computational demands and time required, assessing large image datasets to pinpoint the most suitable traditional learning algorithm and its hyperparameters is arduous. Consequently, this study adopted Matlab’s (MathWorks® Inc., Natick, MA, USA) auto machine learning (AutoML) capabilities.
In the AutoML modeling process, images were transformed into numerical data by capturing pixel values across each row (Figure 3). To streamline data volume, the image resizing function reduced the selected 50 images from each set of preparation condition to 28 × 28 dimensions. The resultant numerical data were saved in an xlsx file, which was then uploaded to the AutoML to compare the validity and accuracy of various machine learning algorithms. In AutoML, the data were partitioned into training and validation datasets (80% and 20%, respectively). AutoML provided the “Best” and “Acceptable” models, each equipped with optimal hyperparameters. This process simplified the selection of the most suitable machine learning algorithm and associated hyperparameters (Figure 3).
The training and testing were conducted on a computing infrastructure that played a pivotal role in achieving the research objectives. The hardware configuration included a central processing unit (CPU) and graphics processing units (GPUs), each contributing significantly to the efficiency and computational prowess of the system. The CPU employed in this study was an Intel processor (Intel Core i9-13900K, Intel Corporation, Santa Clara, CA, USA) with 8 cores and 16 threads clocked at 3.0 GHz. This high-performance CPU served as the computational backbone of our system, handling various tasks and performing complex algorithms. The system was equipped with NVIDIA graphics processing units (GPUs), providing essential parallel computing capabilities. Specifically, we utilized NVIDIA GeForce RTX 3070 (NVIDIA Corporation, Santa Clara, CA, USA) with 24 GB GDDR6X VRAM and 10,496 CUDA cores. These GPUs were instrumental in accelerating the training and inference phases of our machine learning models, significantly reducing computation time and enhancing overall efficiency.
The entire image training and testing was conducted on a computer running on a Windows 10 operating system (Microsoft Corporation, Redmond, WA, USA). In addition, the system included a total of 4 GPUs and 128 GB of RAM, all of which worked together to facilitate the computational demands of our research tasks. It is noteworthy that this hardware configuration was meticulously chosen to ensure the precision and reproducibility of our findings, as the performance of our experiments was inherently tied to the capabilities of the CPU and GPU components.

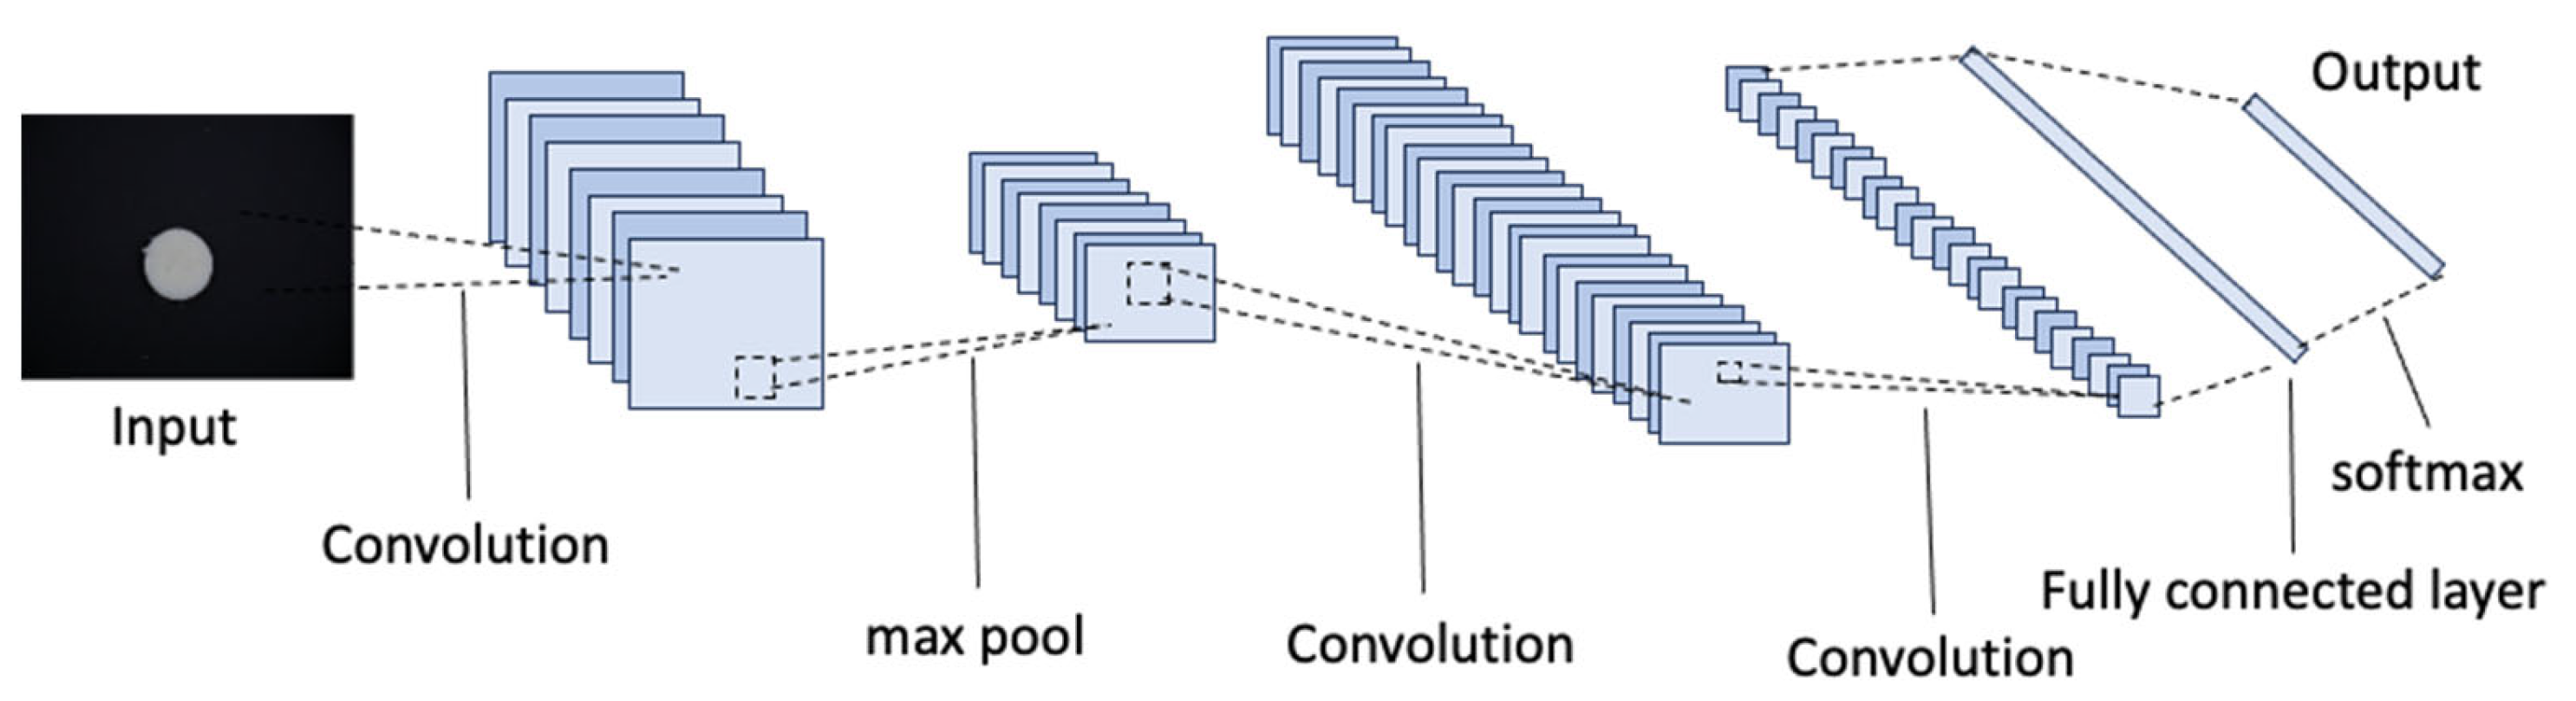
2.4.2. Convolutional Neural Network

The Convolutional Neural Network (CNN) architecture used in this study is shown in Figure 4. The architecture commences with an input layer designed to handle RGB images of size 128 × 128 pixels. Following the input layer are three sets of layers: convolutional, normalization, rectified linear unit (ReLU) activation, and max-pooling layers. The first convolutional layer utilizes 16 kernels of size 3 × 3, preserving spatial dimensions through ‘same’ padding. Batch normalization and ReLU activation are then applied, ensuring efficient training and introducing non-linearity, respectively. Subsequently, a max-pooling layer with a 2 × 2 window and a stride of 2 reduces spatial dimensions by half. The process is repeated with increasing complexity as the architecture deepens. Two additional convolutional layers follow, each with progressively larger kernel counts (32 and 64) and the same 3 × 3 kernel size. Batch normalization and ReLU activation remain consistent. After each of these convolutional layers, max-pooling layers are employed to halve spatial dimensions. Three more convolutional layers are then integrated, maintaining the pattern of increasing kernel counts (128, 256), 3 × 3 kernel size, and preserving spatial dimensions through ‘same’ padding. Batch normalization and ReLU activation continue to enhance the architecture’s capacity to extract hierarchical features from the input images. The architecture culminates with a fully connected layer consisting of neurons, which corresponds to the number of classes in the classification task. A softmax activation layer ensures the output represents class probabilities. The classification layer is labeled ‘classoutput’ for clarity.
During training, the architecture is optimized using the hyperparameters that have been specified by the AutoML; specifically, Adam optimizer with a learning rate of 0.02 and a maximum of 500 epochs. The training data are divided into mini-batches of size 100, shuffled every epoch. Validation is performed using a separate validation dataset. To leverage GPU acceleration, the ‘multi-gpu’ execution environment is employed. Once trained, the architecture demonstrates its capability on the test dataset, achieving accuracy by comparing predicted labels with ground truth labels. The confusion matrix aids in evaluating classification performance across various classes. The architecture is designed to generalize good to new images by employing consistent preprocessing techniques and the well-tuned layers configured for the surimi gel classification task.

2.4.3. Performance Metrics

The primitive objective of this study is to determine the moisture content and starch concentration within each species and formulation. Model accuracy was assessed using various evaluation metrics, including cross-entropy (as the loss function), overall accuracy, macro-averaged precision (Pr), macro-averaged recall (Re), and macro-averaged F1-score (F1). Given that the task of surimi image classification involves multiple image classes, accuracy is defined as the proportion of correctly classified images to the total number of images. Precision, recall, and F1-score for each class were computed using True Positive (TP), False Positive (FP), and False Negative (FN) values, as outlined in Equations (2)–(7). In this context, TP(n) represents correctly classified images for class n, FN(n) indicates misclassified images for class n, and FP(n) signifies misclassified images predicted as class n. The macro-averages for these metrics were obtained by calculating the averages across all classes. For a more detailed explanation of these metrics, readers can refer to previous works [36,37,38]. Additionally, the best-performing model is accompanied by a confusion matrix, providing precision and recall values for each class.
P r ( n ) = T P ( n ) T P ( n ) + F P ( n )
R e ( n ) = T P ( n ) T P ( n ) + F N ( n )
F 1 s c o r e ( n ) = 2 Pr ( n ) · R e ( n ) P r ( n ) + R e ( n )
M a c r o A v e r a g e P r = 1 N n = 1 N P r ( n )
M a c r o A v e r a g e R e = 1 N n = 1 N R e ( n )
M a c r o A v e r a g e F 1 = 1 N n = 1 N F 1 ( n )

2.5. Statistical Analysis

All color data were analyzed using one-way analysis of variance (ANOVA). The significant differences (p < 0.05) of data were evaluated using Duncan’s multiple range test. Data analysis was performed with IBM SPSS Statistics 21 (IBM Corporation, New York, NY, USA) software.

3. Results and Discussion

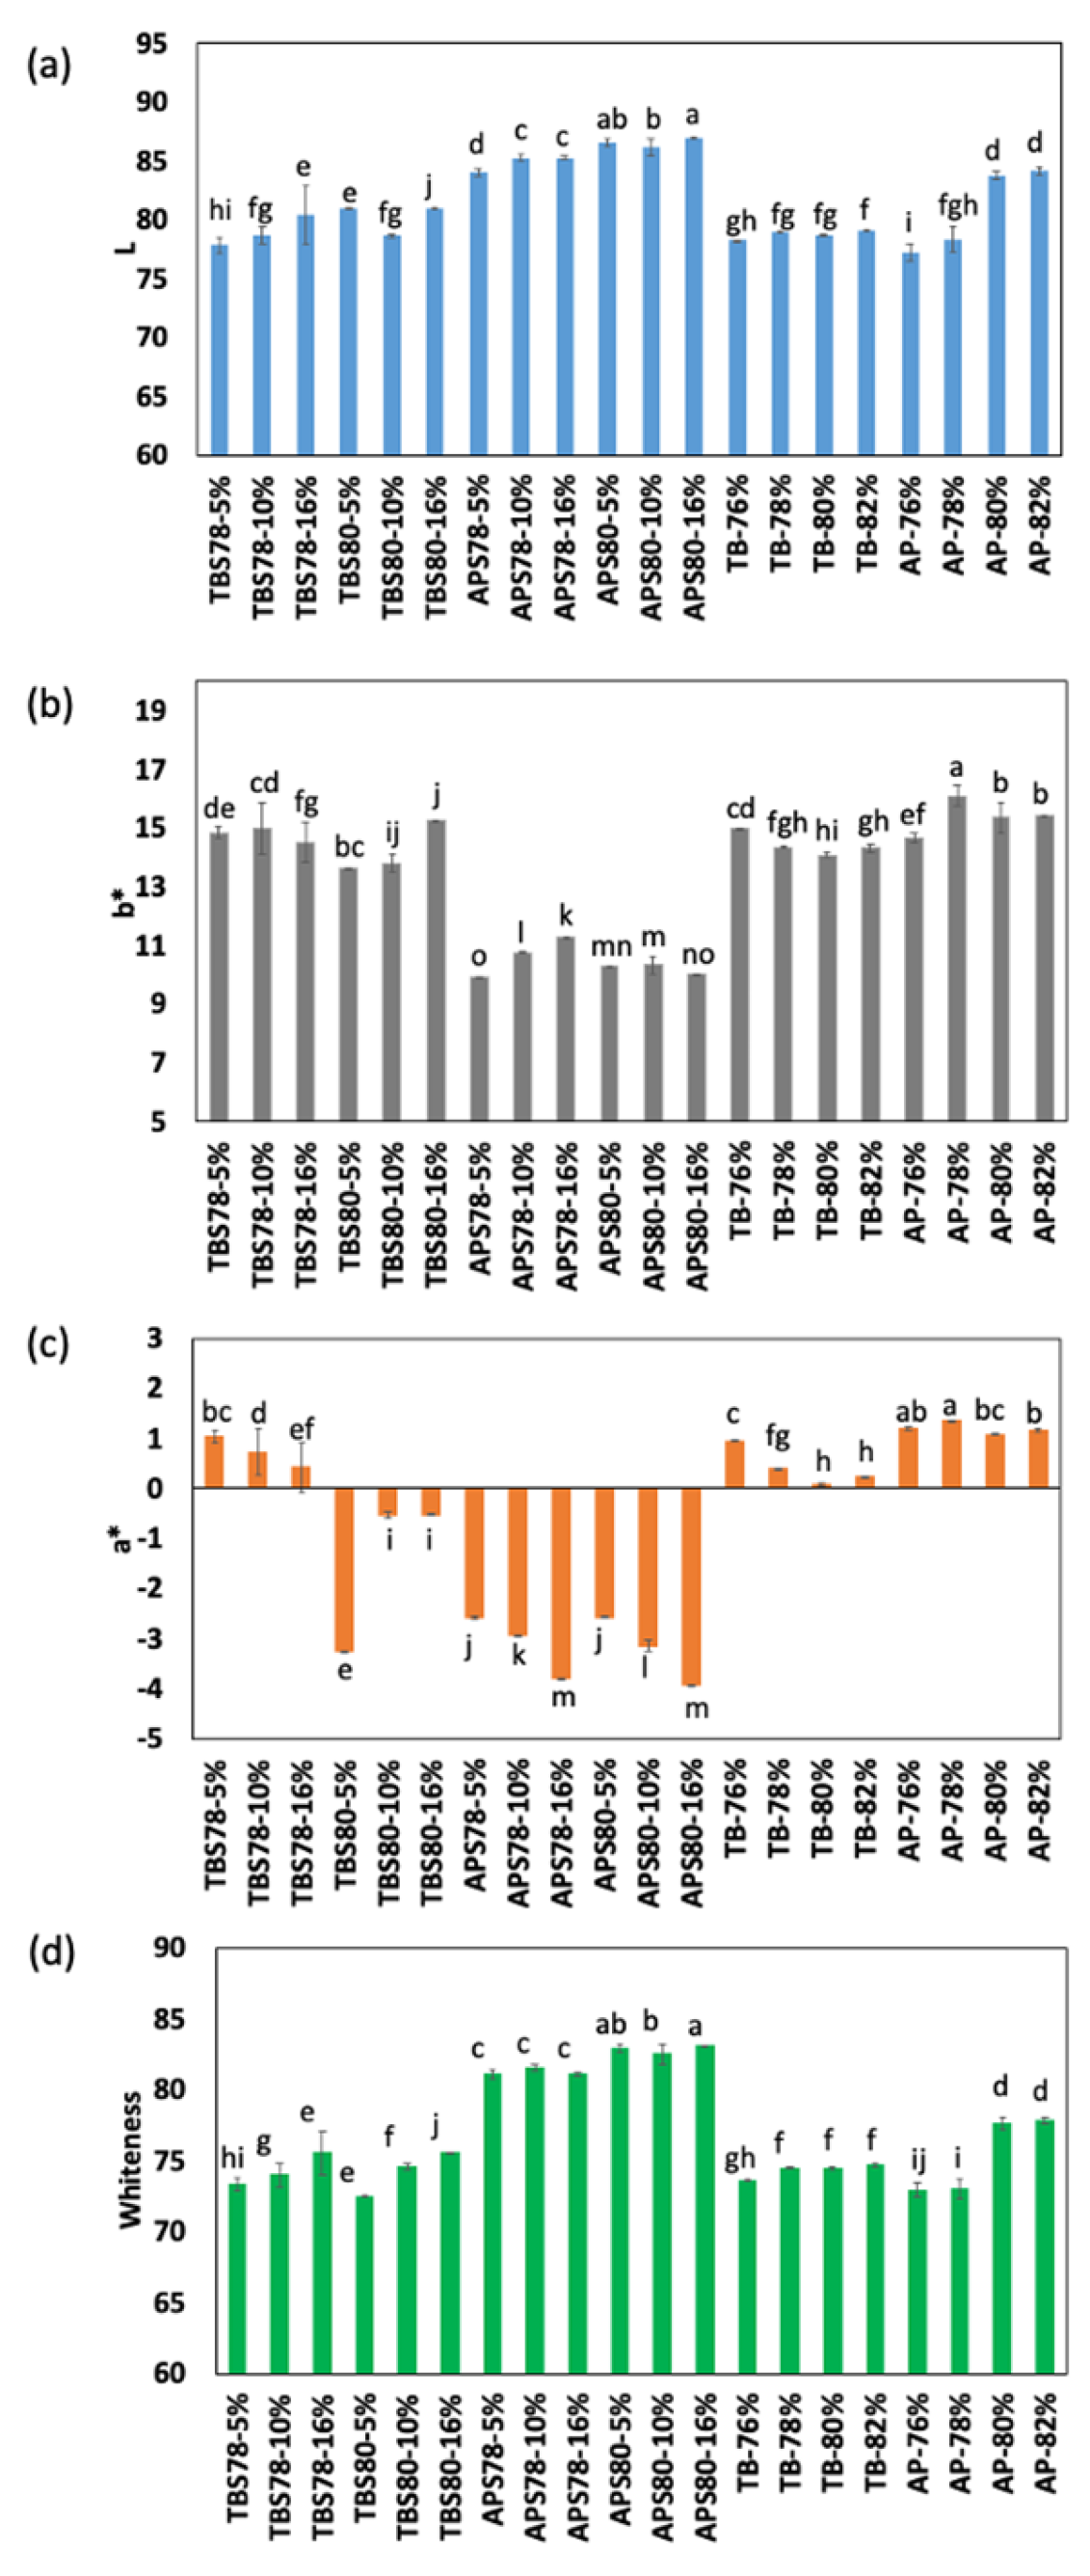
3.1. Color Measurement

The effects of starch on the three main preparation group comprising different species (Threadfin breams and Alaska pollock) and moisture contents (76%, 78%, 80%, and 82%) of surimi gel is shown in Figure 5a–d. Whiteness is an important indicator used to judge the color of surimi-based seafood, such as imitation crab meat, kamaboko, fish balls, and fish sausage [39,40]. The interaction between the internal structure of a material and the frequency of light absorbed by it forms the basis for color variations. Such changes in color serve as a direct indicator of structural modifications and quality shifts within a sample. Typically, a higher L value and a lower b value correspond to a product with a purer white hue and superior quality [14,41]. Notably, the introduction of starch and variations in moisture content exert influence over the color attributes of the surimi gel (Figure 5). The comprehensive spectrum of whiteness spans from 77.24 to 86.97 (Figure 5d). However, most samples exhibit insignificantly distinguishable variations. The slight deviations in color properties across the surimi gel samples present challenges in employing conventional approaches, either visual or instrumental, such as utilizing a colorimeter, for the purpose of grading or classification. Nevertheless, under circumstances where gel preparation closely aligns, such as within a confined range of moisture or starch concentration, discerning minute color disparities becomes arduous.
Our research outcomes underscore striking parallels in color characteristics among surimi gel samples encompassing diverse moisture content and starch concentration levels. Consequently, it becomes imperative to approach these results with caution when attempting to solely predict the quality of surimi gel based on color attributes. As these findings emphasize, a comprehensive evaluation that takes into account various factors should be pursued for an accurate grading and classification of surimi gel quality.

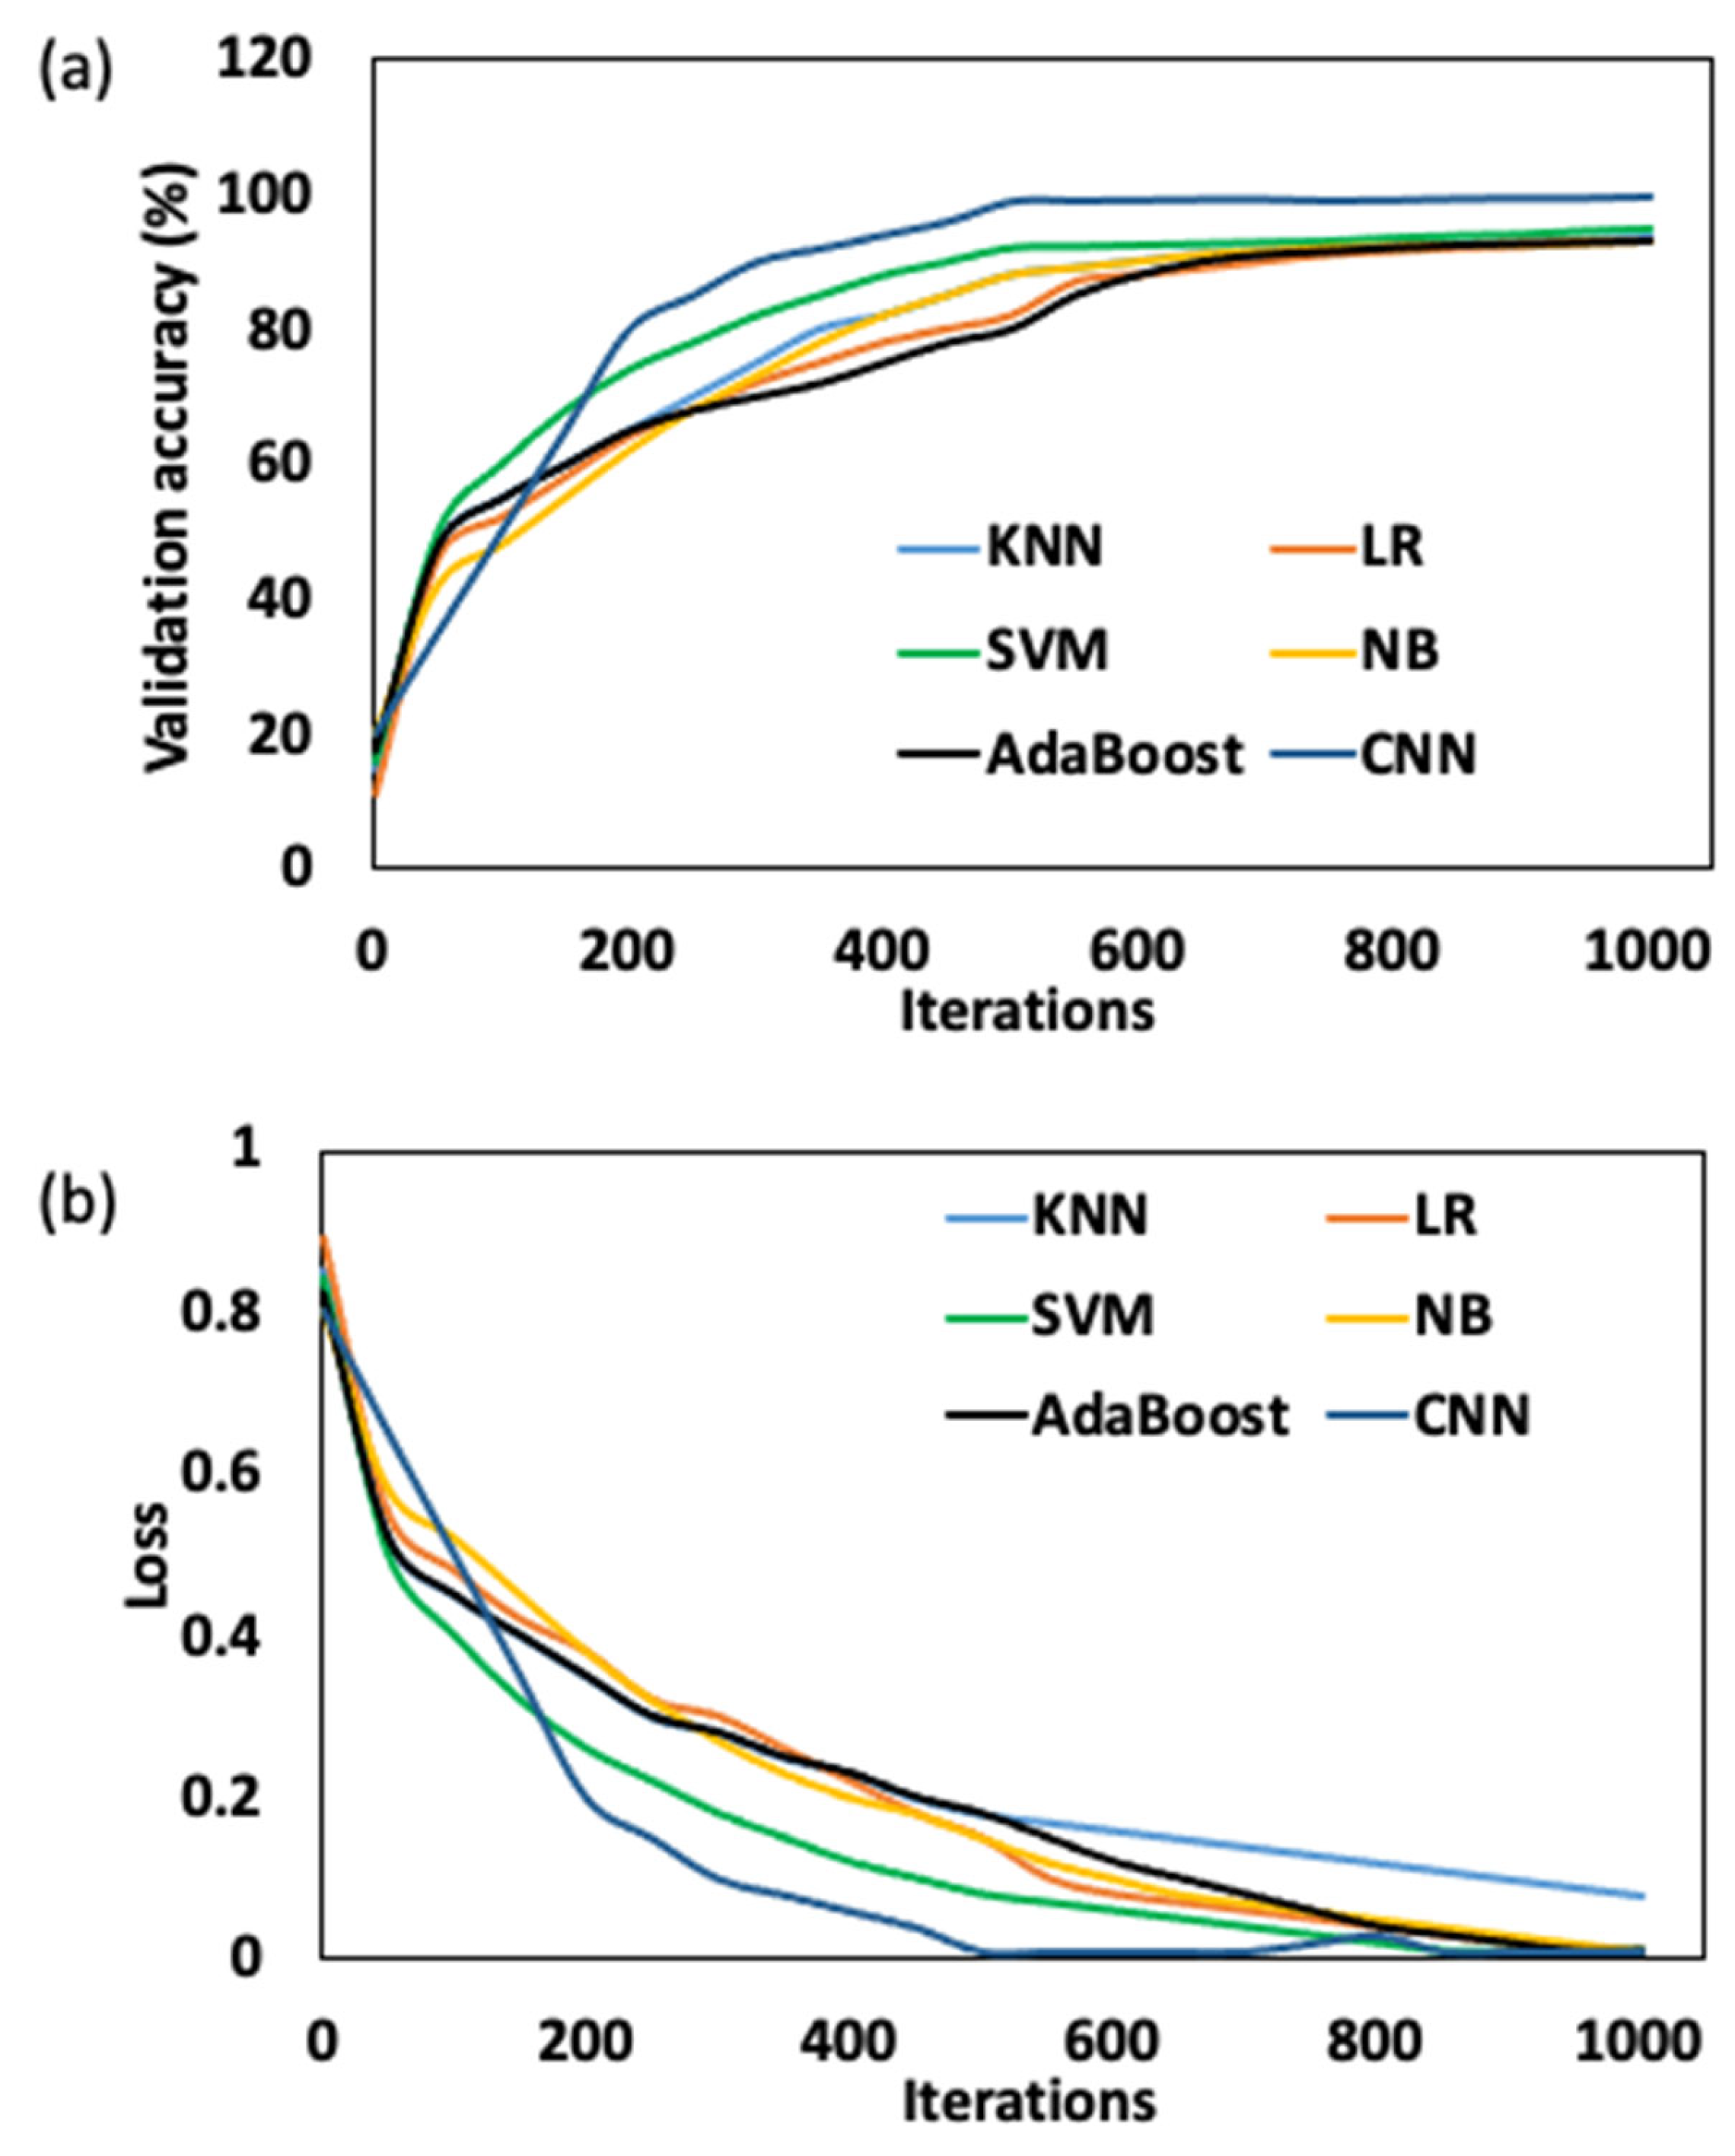
3.2. Validation of AutoML Models

Validation processes for both the “Best” and “Acceptable” models recommended by the AutoML system were conducted, as depicted in Figure 6. AutoML typically employs cross-validation techniques to assess the performance of various models [42]. In our study, the models were trained on subsets of the data, specifically 80% of the numerical data, and then tested on the remaining 20% of the numerical data. Performance metrics such as accuracy, precision, recall, and F1-score were calculated to assess how well these models generalize to new data. The model with the optimal values based on the selected criteria is designated as the “Best,” while other models with values above average are categorized as “Acceptable” models. The output provided by the AutoML Matlab includes the hyperparameters for each model and their respective labels as either “Best” or “Acceptable”. Therefore, we proceeded to assess the model performance based on the hyperparameters suggested by AutoML. For this purpose, we randomly selected a subset of 200 images from each dataset, ensuring a balanced representation. Images from each dataset were captured under identical conditions and at the same positions. This subset was used for both training and testing phases, maintaining the 7:3 ratio for training and testing purposes. The models suggested by the AutoML encompassed K-Nearest Neighbors (KNNs), Logistic Regression (LR), Support Vector Machine (SVM), Naïve Bayes (NB), AdaBoost, and Convolutional Neural Network (CNN). The accuracy and loss of these models were evaluated on this smaller batch of data, and the results are shown in Figure 6a,b. The enhanced validation accuracy and minimized loss indicate superior model performance. Notably, the CNN exhibited a significantly higher accuracy and lower loss compared to the other models. Impressively, CNN’s performance aligns with the conclusions drawn by the AutoML system, which designated it as the “Best” model. Given its remarkable accuracy, it can be seen that the feature extraction capacity of the CNN model can comprehensively collect the subtle features of the surimi gel image changes and show a good result for the validation set. Therefore, the CNN was consequently selected as the optimal training model for the entire dataset of images. This rigorous validation process and the subsequent selection of CNN as the training model underscore the reliability and efficiency of the AutoML system in identifying the model with the highest potential for accurate prediction.

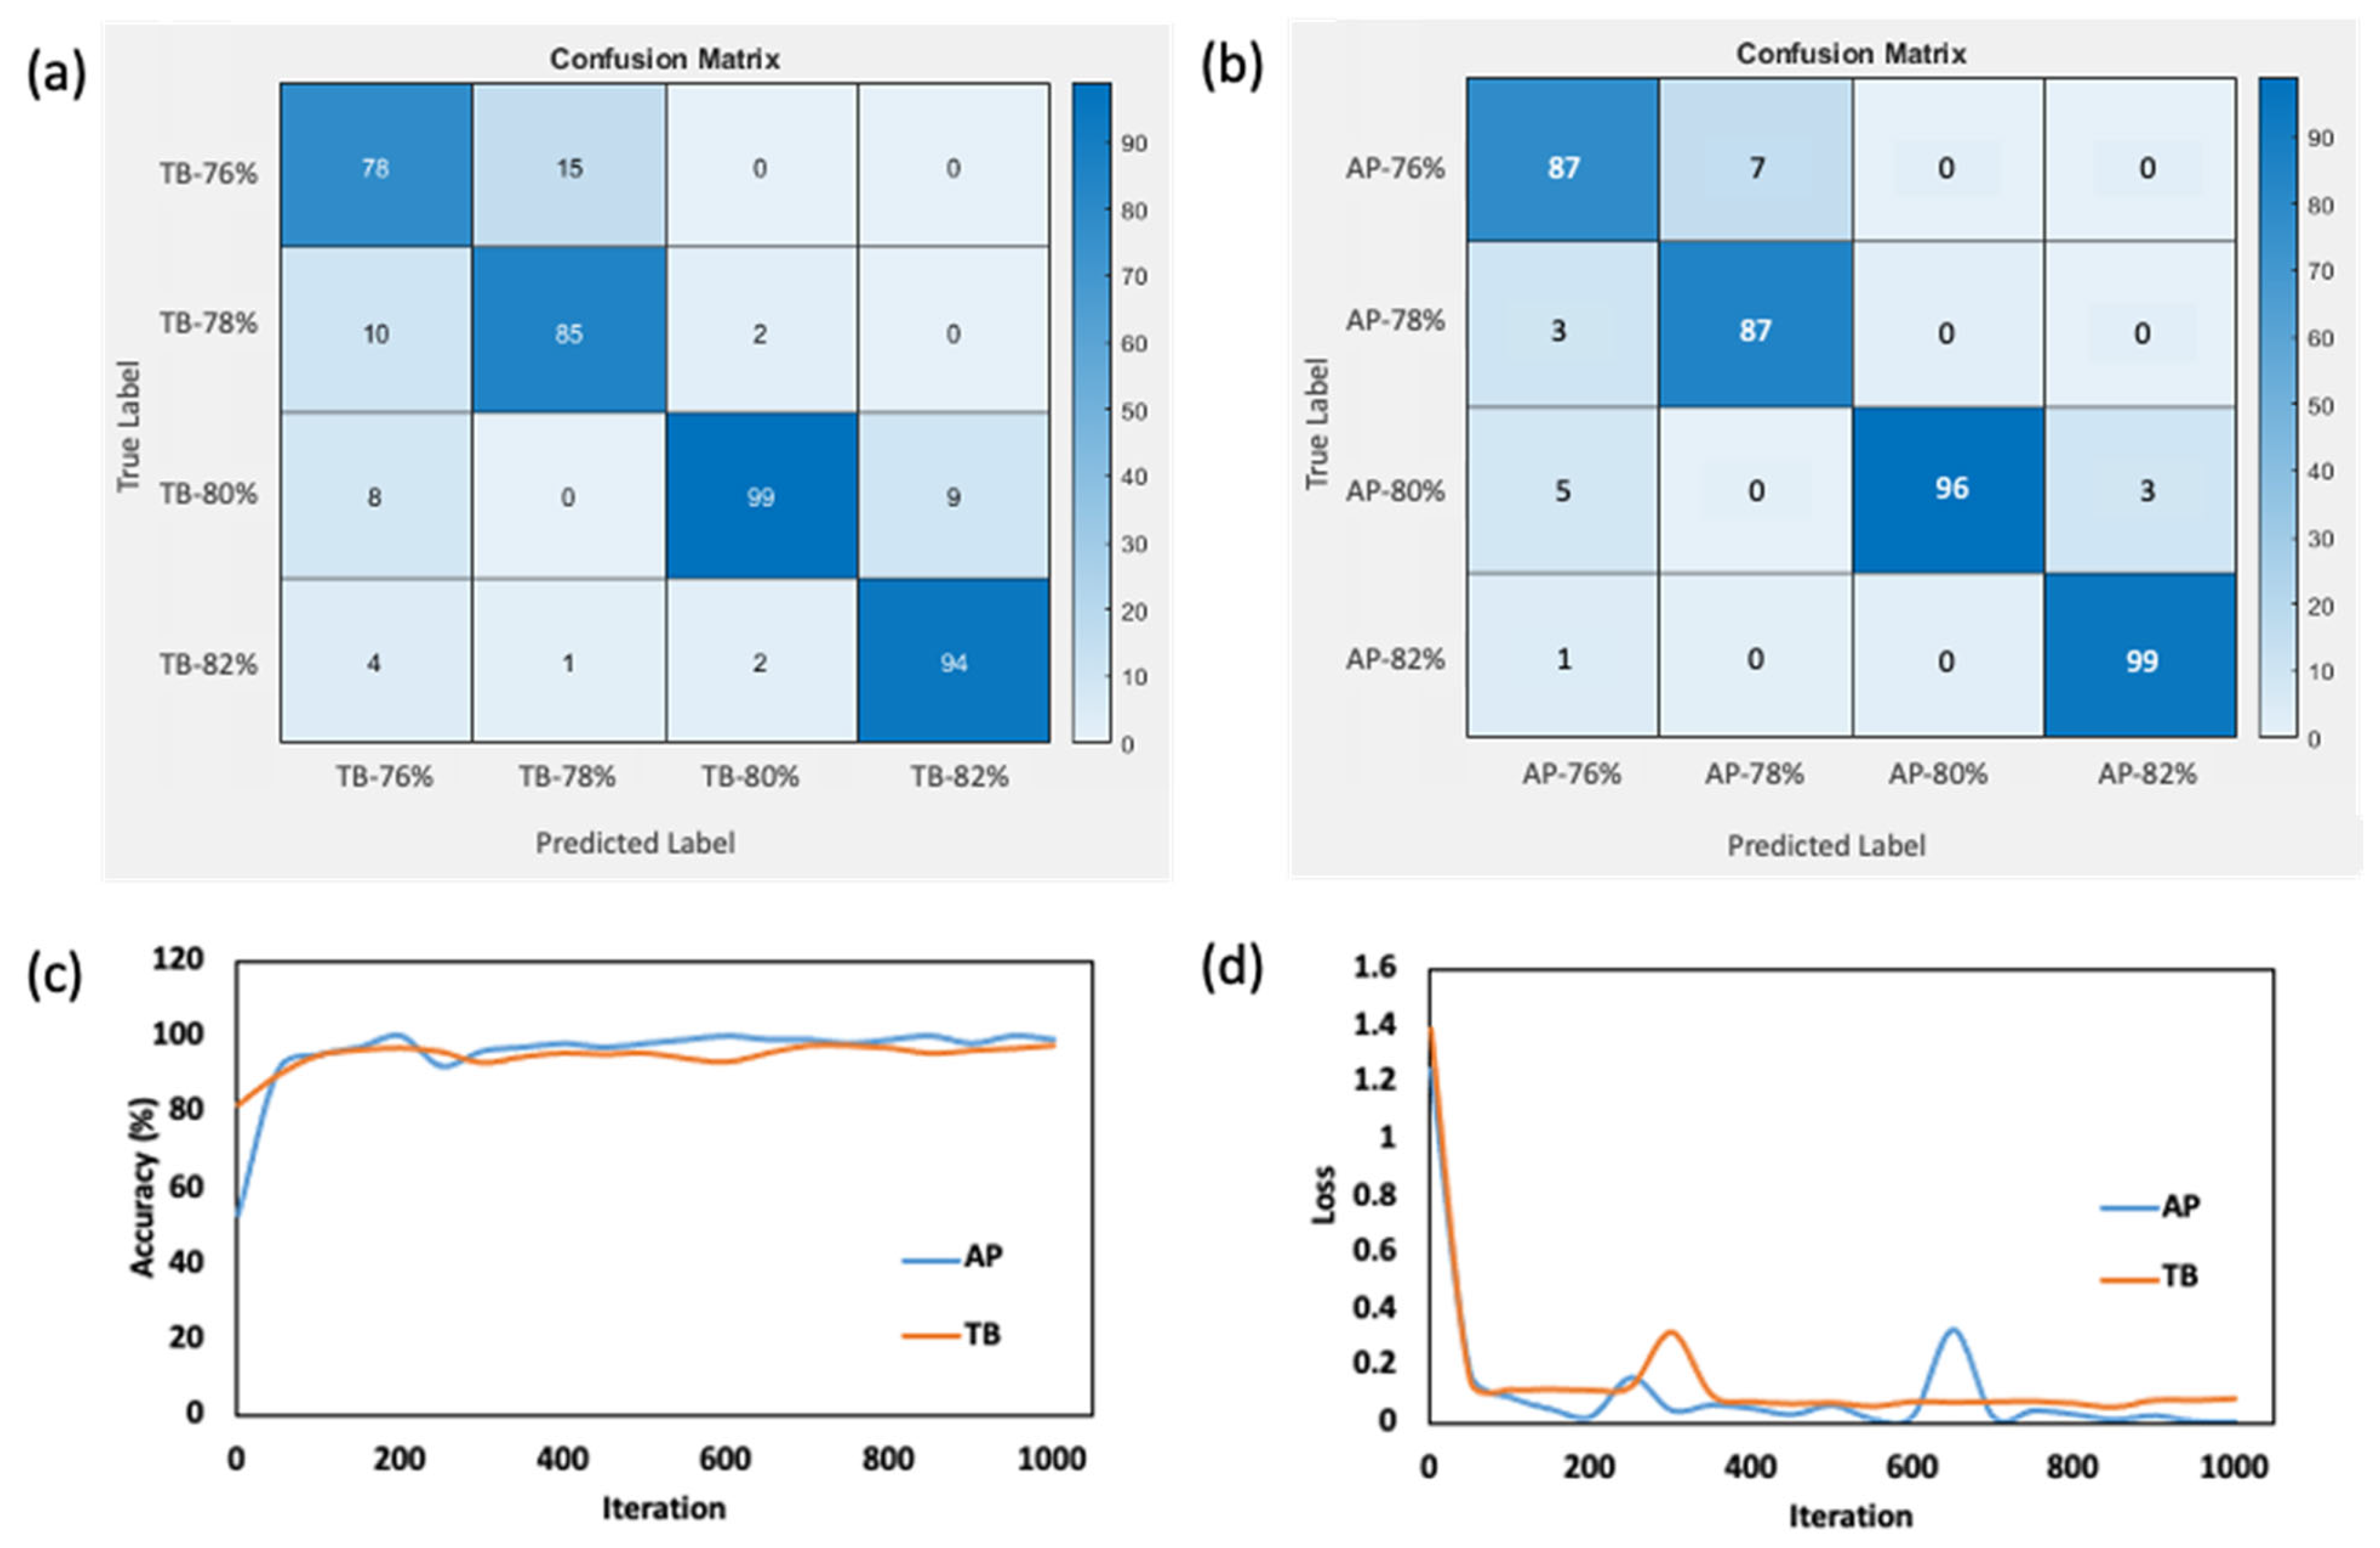
3.3. Classification of Surimi Gel Based on Moisture Content

The CNN model demonstrates a general adaptability under the training of large datasets, but the visual image detection of surimi gel moisture content requires that the feature extraction layer provided by the network model structure has a higher requirement for the perception of subtle structural changes. The change in similar water content ranges is not particularly significant in the appearance of surimi gel, but the results show that the feature extraction layer of the CNN model can identify subtle features. Remarkably, with a model iteration count of 1000 and 500 epoch, the validation accuracy of the CNN model attains 87.46% and 95.10% for samples of Threadfin breams and Alaska pollock surimi, respectively. This performance translates to the accurate classification of 356 images out of a total of 407 Threadfin bream surimi gel images and 369 images out of a total of 388 Alaska pollock surimi gel images, each possessing distinct moisture content levels.
When assessing the accuracy for specific moisture levels, the individual class accuracy percentages are as follows: 83.87% for the TB-76% class, 87.62% for TB-78%, 85.34% for TB-80%, and 93.06% for TB-82% moisture content in the Threadfin bream surimi gel samples, and 92.55% for the AP-76% class, 96.66% for AP-78%, 92.31% for AP-80%, and 99% for AP-82% moisture content in the Alaska pollock surimi gel samples. It is noteworthy that the classes TB-82% and AP-82% exhibit particularly high accuracy, potentially due to their comparably more moistened surfaces compared to the other sample classes. In addition, the Alaska pollock sample had a higher accuracy due to the natural whitish color of the gel compared to the Threadfin breams’ sample. This analysis underscores the CNN model’s capability to discern subtle distinctions in moisture content among surimi gel samples, highlighting its potential significance in accurate moisture content detection.
The class-based classification evaluation of the CNN model is based on the presented confusion matrix, shown in Figure 7a,b. Within this matrixes, distinct numbers of misclassifications are observed across the different moisture content classes. Specifically, there were 15 images from the TB-76% class, 12 from the TB-78% class, 17 from the TB-80% class, and 7 from the TB-82% class that were incorrectly predicted by the model, whereas there were seven images from the AP-76% class, three from the AP-78% class, eight from the AP-80% class, and one from the AP-82% class that were incorrectly predicted by the model. Notably, these inaccurately predicted images are situated in close proximity within the adjacent water content ranges of the respective classes. Furthermore, a higher number of misclassified images in the Threadfin breams’ surimi gel images contributed to a lower average precision, average recall, and average F1-scores compared to those obtained from Alaska pollock surimi gel images. Specifically, the average precision, recall, and F1-score, calculated using Equations (5)–(7), were 0.8748, 0.8738, and 0.8731, respectively, for Threadfin breams’ surimi gel; and 0.9513, 0.9530, and 0.9516, respectively, for Alaska pollock surimi gel. When comparing our study to related research, which has employed CNN model in the analysis of food quality and the classification of food defects, we find that our CNN model’s performance in terms of accuracy, precision, recall, and F1-scores falls within the reported range. For example, Moses et al. [37] employed CNN in the detection of defective rice grains and reported an accuracy > 95%; similarly, Al-Sarayreh et al. [38] used CNN for the detection of adulteration in red-meat products such as lamb, beef, and pork muscles and reported an accuracy of 94.4%. This suggests that our model exhibits a competitive edge in the domain of surimi gel moisture content and starch concentration detection. Our study’s robustness and effectiveness further highlight its potential for enhancing quality control and production efficiency in the surimi food industry.

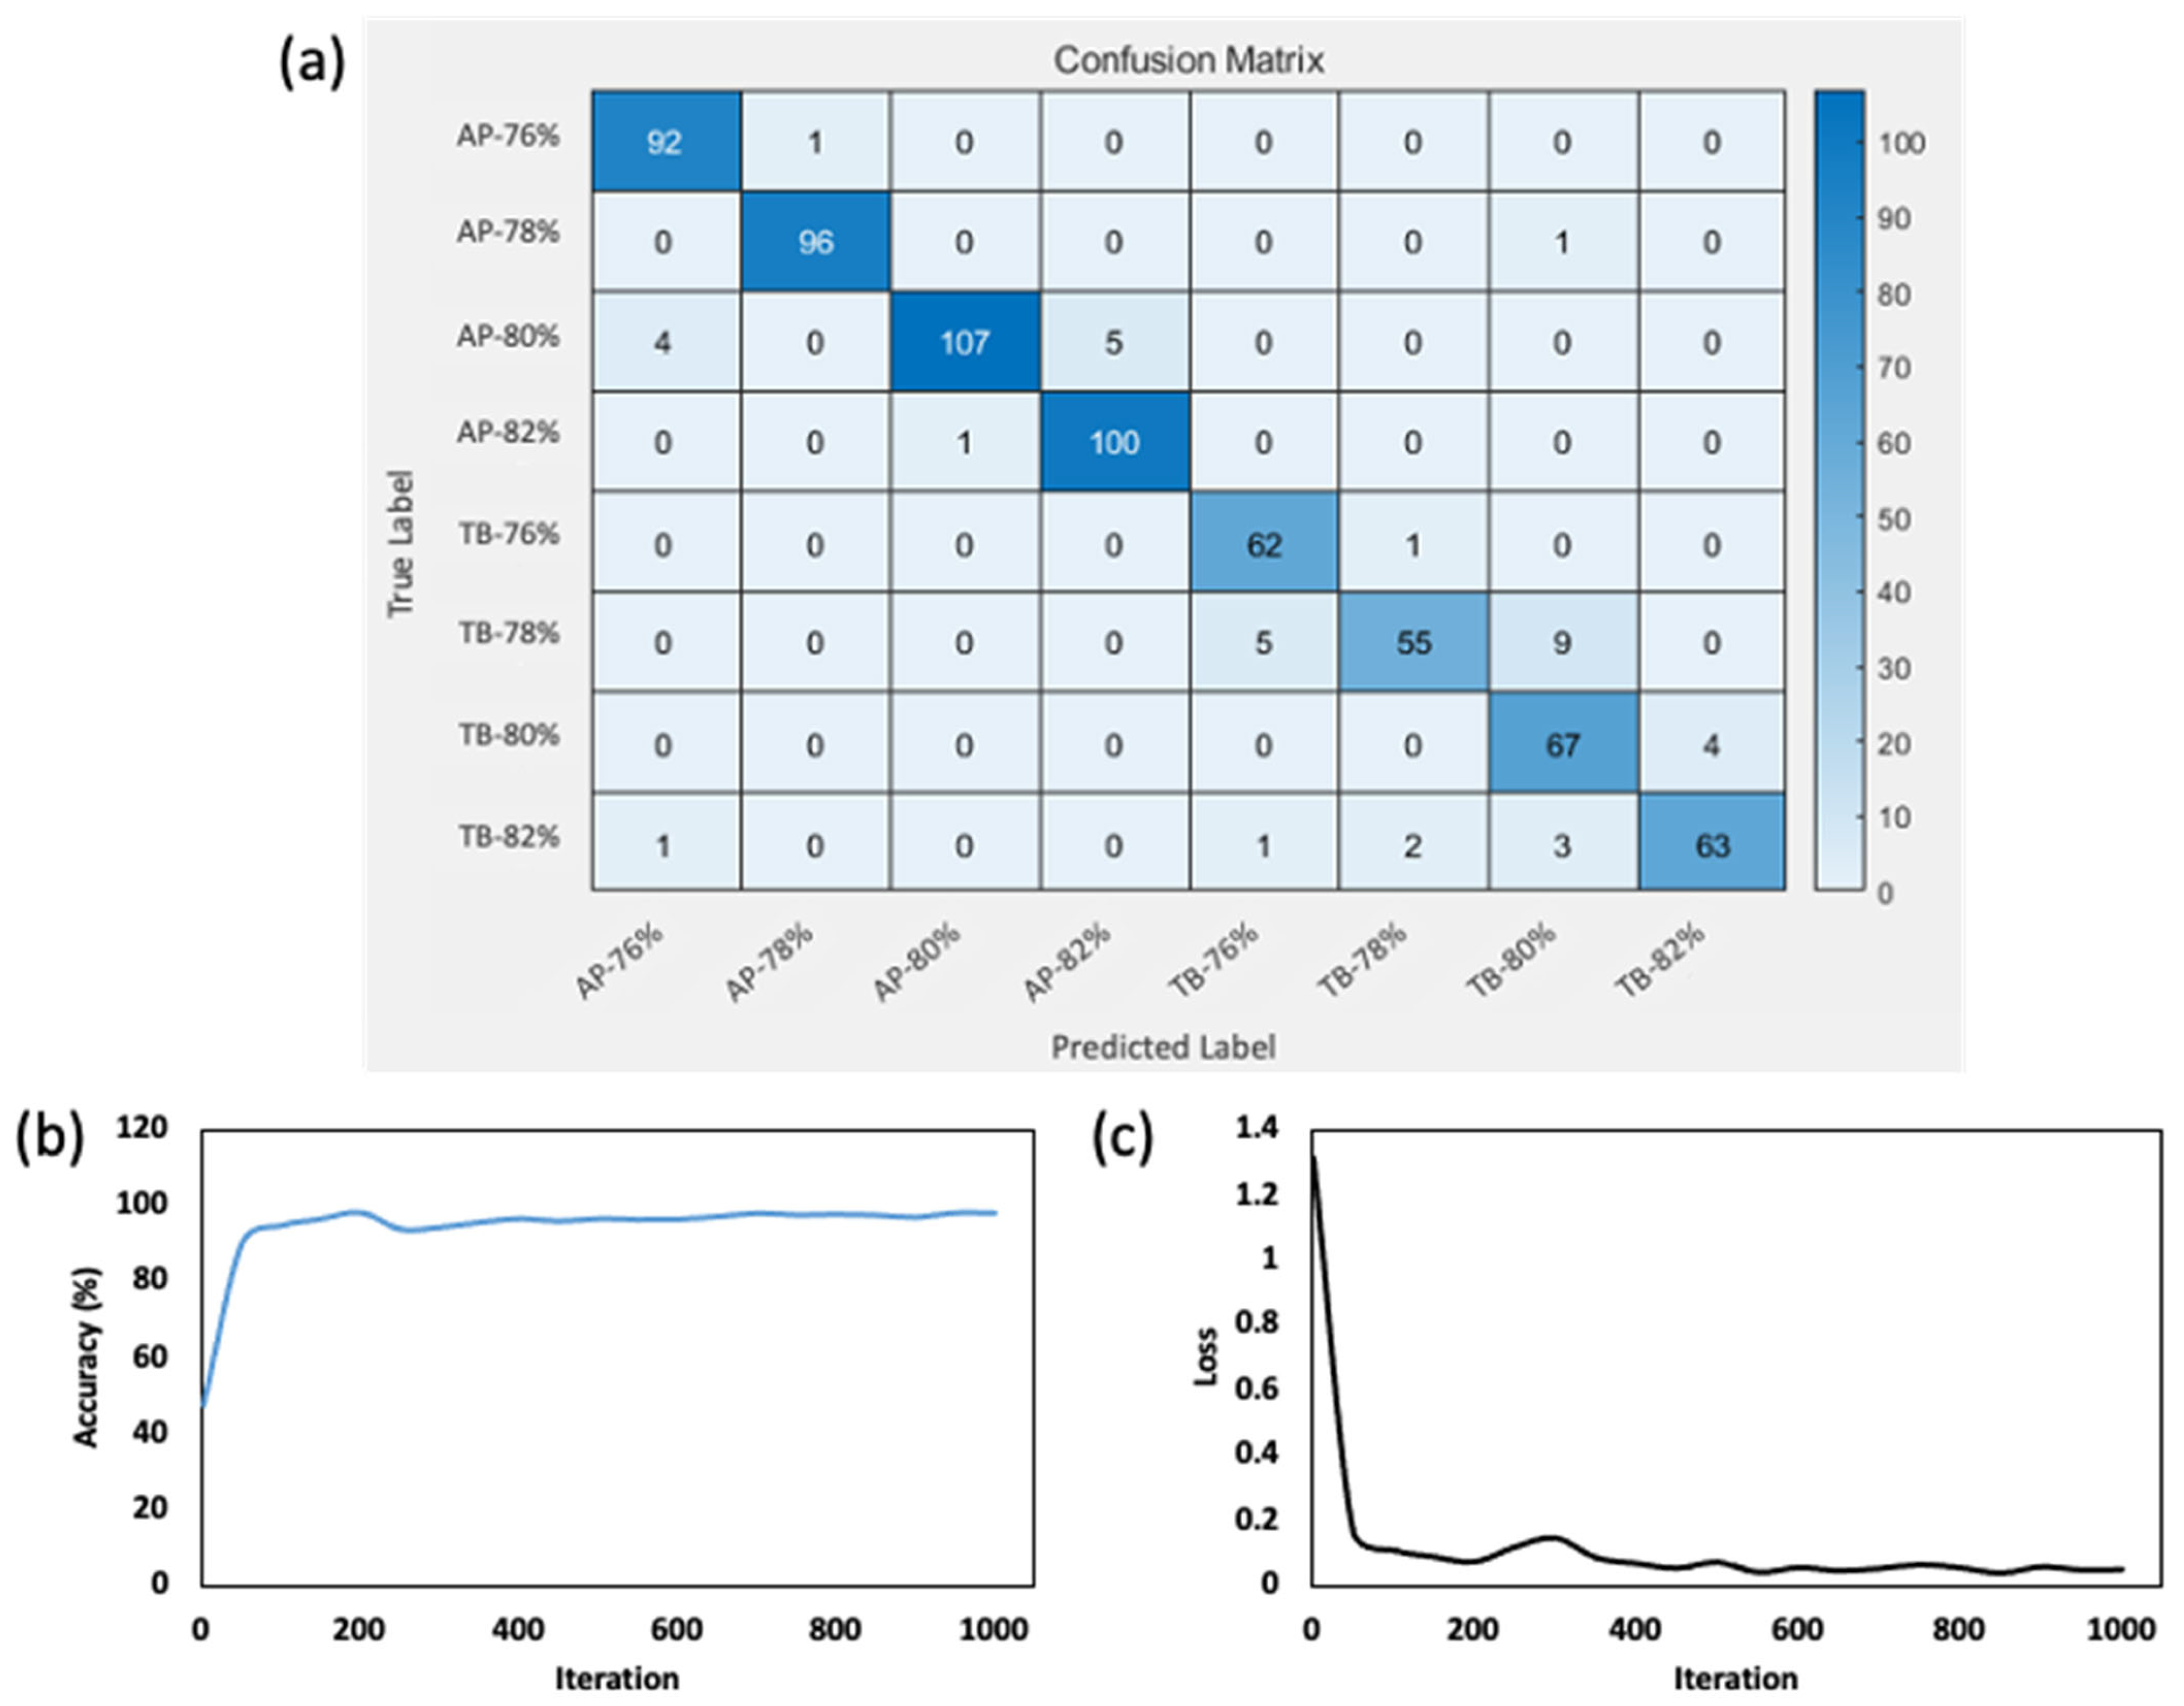
3.4. Classification of Surimi Gel Based on Species and Moisture Content Levels

The comprehensive assessment of surimi gel detection across distinct species and a varied range of moisture content levels is shown using a confusion matrix in Figure 8a. The predictive performance of the trained CNN model, aimed at identifying both the species and corresponding moisture content of surimi samples, showcased a remarkable accuracy of 94.41%. Out of the total 680 test image dataset instances, a notable 642 were accurately classified, emphasizing the model’s efficacy. In addition, the model attained a high average precision, average recall, and average F1-score of 0.9395, 0.9399, and 0.9380, respectively. Delving into the classification outcomes for each group, the achieved accuracies were as follows: 98.92% for sample AP-76%, 98.97% for AP-78%, 92.92% for AP-80%, 99.01% for AP-82%, 98.41% for TB-76%, 79.71% for TB-78%, 94.37% for TB-80%, and 90% for TB-82%. Compared to the individual classification of moisture content range within different species (Section 3.3), this classification basis yielded a higher accuracy, which could be attributed to the ability of the model to extract specific feature within each of the images of different species as the classification group widens, and more distinct variables are observed.

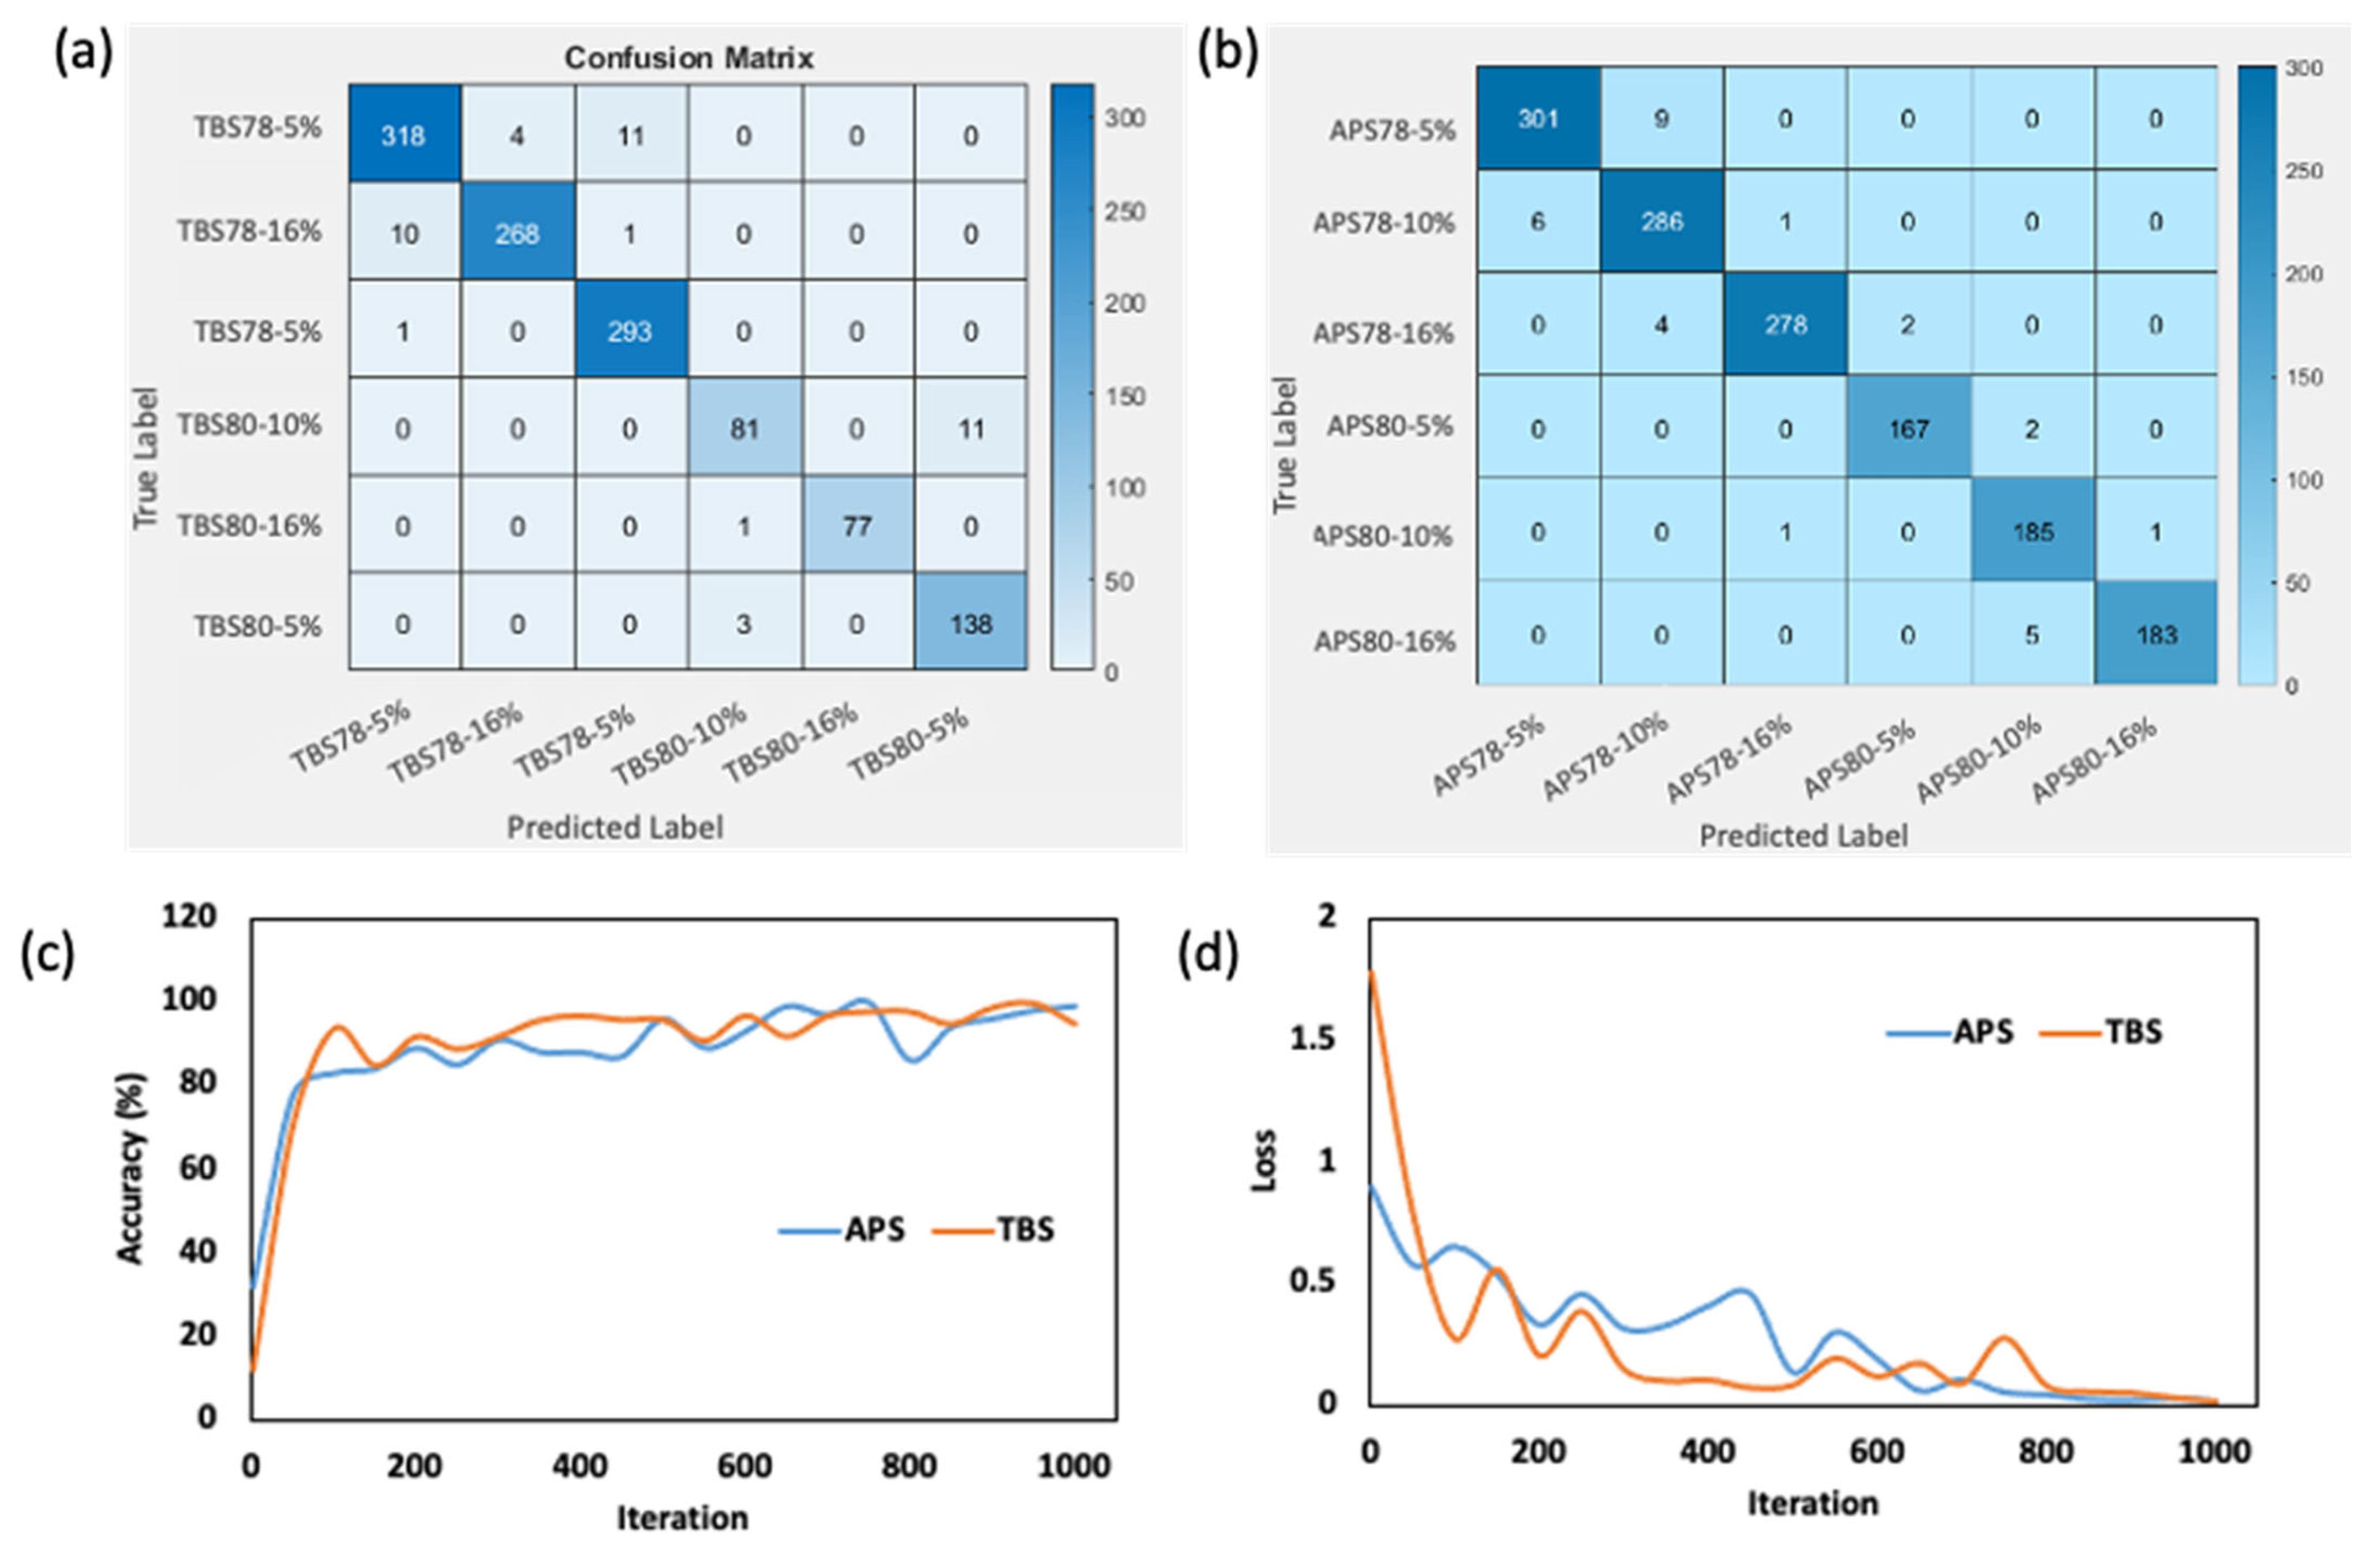
3.5. Classification of Surimi Gel Based on Starch Concentration and Moisture Content Levels

Figure 9 illustrates the categorization of surimi gels with varying starch concentrations and moisture contents across different surimi species. The CNN model, after being trained, demonstrated exceptional predictive performance. Notably, it achieved an accuracy of 96.55% when applied to Threadfin bream surimi with varying starch concentrations, and an accuracy of 97.83% for surimi derived from Alaska pollock with varying starch concentrations. In addition, the average precision, recall, and F1-score were 0.9597, 0.9653, and 0.9568, respectively, for Threadfin bream surimi with starch, and 0.9795, 0.9794, and 0.9793, respectively, for Alaska pollock surimi gel with starch.
Specifically, for the Threadfin bream sample, 1175 out of 1217 images were correctly classified, while for the Alaska pollock sample, 1400 out of 1431 samples were accurately classified. Remarkably high individual classification accuracies were attained within distinct groups. For surimi gel prepared from Threadfin bream, the accuracies were as follows: 95.50% for sample TBS78-5%, 99.66% for TBS78-10%, 96.06% for TBS78-16%, 97.87% for TBS80-5%, 88.04% for TBS80-10%, and 98.72% for TBS80-16%. In the case of gel samples prepared from Alaska pollock, the accuracies were as follows: 97.10% for sample APS78-5%, 97.28% for APS78-10%, 97.89% for APS78-16%, 98.82% for APS80-5%, 98.93% for APS80-10%, and 97.34% for APS80-16%. The significantly high values of accuracy, precisions, recalls, and F1-scores are indicative of a high-performance model [42].

4. Conclusions

In this study, we systematically investigated the impact of starch variations (5%, 10%, and 16%) and moisture content variations (76%, 78%, 80%, and 82%) on the color and quality of surimi gels derived from two different species, Alaska pollock and Threadfin breams, using a non-destructive approach. The observed changes in color resulting from these variations highlight the intricate relationship between structural alterations and product quality classification. To address these complexities, we employed several artificial intelligence algorithms, including K-Nearest Neighbors (KNNs), Logistic Regression (LR), Support Vector Machine (SVM), Naïve Bayes (NB), AdaBoost, and Convolutional Neural Network (CNN). Given the computational demands of analyzing a large dataset with all these algorithms, we utilized the Auto Machine Learning (AutoML) system provided by Matlab to predict the best and acceptable training models along with the necessary hyperparameters. The CNN emerged as a crucial tool for predicting the visual impact of changes in moisture content and starch concentration on surimi gel attributes. The CNN architecture consisted of an input layer followed by convolutional, normalization, rectified linear unit (ReLU) activation, and max-pooling layers. The model demonstrated remarkable adaptability and accuracy in predicting how alterations in moisture content affected the appearance of surimi gels, achieving a validation accuracy of 87.46% for Threadfin bream samples and an impressive 95.10% for Alaska pollock samples. Additionally, the average precision, recall, and F1-score were 0.8748, 0.8738, and 0.8731, respectively, for Threadfin bream surimi and 0.9513, 0.9530, and 0.9516, respectively, for Alaska pollock surimi gel. Furthermore, the CNN’s adaptability in classifying surimi image samples was evident in species and moisture content classifications, boosting overall accuracy to 96.55% for Threadfin bream and 97.83% for Alaska pollock, with an average precision, recall, and F1-score of 0.9597, 0.9653, and 0.9568, respectively, for Threadfin bream surimi with starch, and 0.9795, 0.9794, and 0.9793, respectively, for Alaska pollock surimi gel with starch. Remarkably, the model’s proficiency in discerning subtle distinctions was evident in classifications based on starch concentration and moisture content. These findings further illuminate the intricate dynamics governing surimi gel quality prediction, encompassing color, moisture content, species, and starch concentration. It also facilitates quality control and product characterization within the surimi industry, offering invaluable insights for both manufacturers and research purposes. The non-destructive approach and rigorous analysis employed in this study provide a solid foundation for advancing our understanding of surimi production processes and their optimization in the pursuit of high-quality surimi products.

Author Contributions

W.B.Y.: Conceptualization, methodology, resources, funding acquisition, supervision, writing—review and editing. T.M.O.: Conceptualization, methodology, writing—original draft. J.K.: Conceptualization, methodology, review. All authors have read and agreed to the published version of the manuscript.

Funding

This study was supported by the research grant of Kangwon National University in 2023. This research was supported by Basic Science Research Program through the National Research Foundation of Korea (NRF) funded by the Ministry of Education (2018R1D1A3B06042501) (grant number NRF-2020-D-G035-010104). Following are results of a study on the “Leaders in INdustry-university Cooperation 3.0” Project, supported by the Ministry of Education and National Research Foundation of Korea.

Data Availability Statement

The data presented in this study are available on request from the corresponding author.

Acknowledgments

All the authors extend their gratitude to Jae W. Park for his valuable intellectual assistance throughout the process of preparing and composing this report, and the financial support from Jae Park Surimi School.

Conflicts of Interest

The authors declare no conflict of interest.

References

  1. Park, J.W. Ingredient technology for surimi and surimi seafood. In Surimi and Surimi Seafood, 2nd ed.; Taylor and Francis Group: Boca Raton, FL, USA, 2005; pp. 649–707. [Google Scholar]
  2. Jha, S.N. Fact.Mr. Surimi Market. 2023. Available online: https://www.factmr.com/report/5014/surimi-market (accessed on 31 August 2023).
  3. Xiong, Z.; Shi, T.; Jin, W.; Bao, Y.; Monto, A.R.; Yuan, L.; Gao, R. Gel performance of surimi induced by various thermal technologies: A review. Crit. Rev. Food Sci. Nutr. 2022, 1–16. [Google Scholar] [CrossRef]
  4. De Albuquerque Sousa, T.C.; Ferreira VC, D.S.; da Silva Araújo, Í.B.; da Silva, F.A.P. Natural Additives as Quality Promoters in Surimi: A Brief Review. J. Aquat. Food Prod. Technol. 2022, 31, 735–744. [Google Scholar] [CrossRef]
  5. Benjakul, S.; Chantarasuwan, C.; Visessanguan, W. Effect of medium temperature setting on gelling characteristics of surimi from some tropical fish. Food Chem. 2003, 82, 567–574. [Google Scholar] [CrossRef]
  6. Poowakanjana, S.; Park, J.W. Biochemical characterisation of Alaska pollock, Pacific whiting, and threadfin bream surimi as affected by comminution conditions. Food Chem. 2013, 138, 200–207. [Google Scholar] [CrossRef] [PubMed]
  7. Park, J.W. Surimi seafood: Products, market, and manufacturing. In Food Science and Technology, 2nd ed.; Taylor and Francis Group: Boca Raton, FL, USA, 2000; pp. 201–236. [Google Scholar]
  8. Poowakanjana, S.; Mayer, S.G.; Park, J.W. Optimum chopping conditions for Alaska pollock, Pacific whiting, and threadfin bream surimi paste and gel based on rheological and Raman spectroscopic analysis. J. Food Sci. 2012, 77, E88–E97. [Google Scholar] [CrossRef] [PubMed]
  9. Yoon, W.B.; Park, J.W.; Kim, B.Y. Linear programming in blending various components of surimi seafood. J. Food Sci. 1997, 62, 561–564. [Google Scholar] [CrossRef]
  10. Moon, J.H.; Yoon, W.B.; Park, J.W. Assessing the textural properties of Pacific whiting and Alaska pollock surimi gels prepared with carrot under various heating rates. Food Biosci. 2017, 20, 12–18. [Google Scholar] [CrossRef]
  11. Cao, G.; Chen, X.; Wang, N.; Tian, J.; Song, S.; Wu, X.; Wang, L.; Wen, C. Effect of konjac glucomannan with different viscosities on the quality of surimi-wheat dough and noodles. Int. J. Biol. Macromol. 2022, 221, 1228–1237. [Google Scholar] [CrossRef] [PubMed]
  12. Zhang, F.; Fang, L.; Wang, C.; Shi, L.; Chang, T.; Yang, H.; Cui, M. Effects of starches on the textural, rheological, and color properties of surimi–beef gels with microbial tranglutaminase. Meat Sci. 2013, 93, 533–537. [Google Scholar] [CrossRef]
  13. Tabilo-Munizaga, G.; Barbosa-Cánovas, G.V. Color and textural parameters of pressurized and heat-treated surimi gels as affected by potato starch and egg white. Food Res. Int. 2004, 37, 767–775. [Google Scholar] [CrossRef]
  14. Liu, H.; Nie, Y.; Chen, H. Effect of different starches on colors and textural properties of surimi-starch gels. Int. J. Food Prop. 2014, 17, 1439–1448. [Google Scholar] [CrossRef]
  15. Mi, H.; Li, Y.; Wang, C.; Yi, S.; Li, X.; Li, J. The interaction of starch-gums and their effect on gel properties and protein conformation of silver carp surimi. Food Hydrocoll. 2021, 112, 106290. [Google Scholar] [CrossRef]
  16. Song, C.; Lin, Y.; Hong, P.; Liu, H.; Zhou, C. Compare with different vegetable oils on the quality of the Nemipterus virgatus surimi gel. Food Sci. Nutr. 2022, 10, 2935–2946. [Google Scholar] [CrossRef] [PubMed]
  17. Tian, Z.; Jiang, X.; Xiao, N.; Zhang, Q.; Shi, W.; Guo, Q. Assessing the Gel Quality and Storage Properties of Hypophythalmalmichthys molitrix Surimi Gel Prepared with Epigallocatechin Gallate Subject to Multiple Freeze-Thaw Cycles. Foods 2022, 11, 1612. [Google Scholar] [CrossRef]
  18. Alakhrash, F.; Anyanwu, U.; Tahergorabi, R. Physicochemical properties of Alaska pollock (Theragra chalcograma) surimi gels with oat bran. LWT-Food Sci. Technol. 2016, 66, 41–47. [Google Scholar] [CrossRef]
  19. ElMasry, G.M.; Nakauchi, S. Image analysis operations applied to hyperspectral images for non-invasive sensing of food quality–a comprehensive review. Biosyst. Eng. 2016, 142, 53–82. [Google Scholar] [CrossRef]
  20. An, T.; Yu, H.; Yang, C.; Liang, G.; Chen, J.; Hu, Z.; Hu, B.; Dong, C. Black tea withering moisture detection method based on convolution neural network confidence. J. Food Process Eng. 2020, 43, e13428. [Google Scholar] [CrossRef]
  21. Xu, Y.; Kou, J.; Zhang, Q.; Tan, S.; Zhu, L.; Geng, Z.; Yang, X. Visual Detection of Water Content Range of Seabuckthorn Fruit Based on Transfer Deep Learning. Foods 2023, 12, 550. [Google Scholar] [CrossRef]
  22. Mendoza, F.; Dejmek, P.; Aguilera, J.M. Calibrated color measurements of agricultural foods using image analysis. Postharvest Biol. Technol. 2006, 41, 285–295. [Google Scholar] [CrossRef]
  23. Chmiel, M.; Słowiński, M.; Dasiewicz, K. Lightness of the color measured by computer image analysis as a factor for assessing the quality of pork meat. Meat Sci. 2011, 88, 566–570. [Google Scholar] [CrossRef]
  24. Sahni, V.; Srivastava, S.; Khan, R. Modelling techniques to improve the quality of food using artificial intelligence. J. Food Qual. 2021, 2021, 1–10. [Google Scholar] [CrossRef]
  25. Zhou, L.; Zhang, C.; Liu, F.; Qiu, Z.; He, Y. Application of deep learning in food: A review. Compr. Rev. Food Sci. Food Saf. 2019, 18, 1793–1811. [Google Scholar] [CrossRef]
  26. Du, C.J.; Sun, D.W. Pizza sauce spread classification using colour vision and support vector machines. J. Food Eng. 2005, 66, 137–145. [Google Scholar] [CrossRef]
  27. Teng, J.; Zhang, D.; Lee, D.J.; Chou, Y. Recognition of Chinese food using convolutional neural network. Multimed. Tools Appl. 2019, 78, 11155–11172. [Google Scholar] [CrossRef]
  28. Liang, F.; Lin, L.; Zhu, Y.; Jiang, S.; Lu, J. Comparative study between surimi gel and surimi/crabmeat mixed gel on nutritional properties, flavor characteristics, color, and texture. J. Aquat. Food Prod. Technol. 2020, 29, 681–692. [Google Scholar] [CrossRef]
  29. Zhang, Y.; Chang, S.K. Color and texture of surimi-like gels made of protein isolate extracted from catfish byproducts are improved by washing and adding soy whey. J. Food Sci. 2022, 87, 3057–3070. [Google Scholar] [CrossRef] [PubMed]
  30. Oyinloye, T.M.; Yoon, W.B. Investigation of flow field, die swelling, and residual stress in 3D printing of surimi paste using the finite element method. Innov. Food Sci. Emerg. Technol. 2022, 78, 103008. [Google Scholar] [CrossRef]
  31. Liu, X.; Ji, L.; Zhang, T.; Xue, Y.; Xue, C. Effects of pre-emulsification by three food-grade emulsifiers on the properties of emulsified surimi sausage. J. Food Eng. 2019, 247, 30–37. [Google Scholar] [CrossRef]
  32. He, Y.; Xu, C.; Khanna, N.; Boushey, C.J.; Delp, E.J. Analysis of food images: Features and classification. In Proceedings of the 2014 IEEE International Conference on Image Processing (ICIP), Paris, France, 27–30 October 2014; pp. 2744–2748. [Google Scholar] [CrossRef]
  33. Sari, Y.A.; Utaminingrum, F.; Adinugroho, S.; Dewi, R.K.; Adikara, P.P.; Wihandika, R.C.; Mutrofin, S.; Izzah, A. Indonesian traditional food image identification using random forest classifier based on color and texture features. In Proceedings of the 2019 International Conference on Sustainable Information Engineering and Technology (SIET), Lombok, Indonesia, 28–30 September 2019; pp. 206–211. [Google Scholar] [CrossRef]
  34. Liu, Y.; Pu, H.; Sun, D.W. Efficient extraction of deep image features using convolutional neural network (CNN) for applications in detecting and analysing complex food matrices. Trends Food Sci. Technol. 2021, 113, 193–204. [Google Scholar] [CrossRef]
  35. Saha, D.; Manickavasagan, A. Machine learning techniques for analysis of hyperspectral images to determine quality of food products: A review. Curr. Res. Food Sci. 2021, 4, 28–44. [Google Scholar] [CrossRef]
  36. Sokolova, M.; Lapalme, G. A systematic analysis of performance measures for classification tasks. Inf. Process. Manag. 2009, 45, 427–437. [Google Scholar] [CrossRef]
  37. Moses, K.; Miglani, A.; Kankar, P.K. Deep CNN-based damage classification of milled rice grains using a high-magnification image dataset. Comput. Electron. Egriculture 2022, 195, 106811. [Google Scholar] [CrossRef]
  38. Al-Sarayreh, M.; MReis, M.; Qi Yan, W.; Klette, R. Detection of red-meat adulteration by deep spectral–spatial features in hyperspectral images. J. Imaging 2018, 4, 63. [Google Scholar] [CrossRef]
  39. Santana, P.; Huda, N.; Yang, T.A. Physicochemical properties and sensory characteristics of sausage formulated with surimi powder. J. Food Sci. Technol. 2015, 52, 1507–1515. [Google Scholar] [CrossRef] [PubMed]
  40. Alipour, H.J.; Rezaei, M.; Shabanpour, B.; Tabarsa, M. Effects of sulfated polysaccharides from green alga Ulva intestinalis on physicochemical properties and microstructure of silver carp surimi. Food Hydrocoll. 2018, 74, 87–96. [Google Scholar] [CrossRef]
  41. Chang, T.; Wang, C.; Wang, X.; Shi, L.; Yang, H.; Cui, M. Effects of soybean oil, moisture and setting on the textural and color properties of surimi gels. J. Food Qual. 2015, 38, 53–59. [Google Scholar] [CrossRef]
  42. Feurer, M.; Hutter, F. Towards further Automation in AutoML. In Proceedings of the ICML AutoML Workshop, Stockholm, Sweden, 14 July 2018; p. 13. Available online: https://ml.informatik.uni-freiburg.de/wp-content/uploads/papers/18-AUTOML-AutoAutoML.pdf (accessed on 31 August 2023).
Figure 1. Schematic representation of the image capture system for surimi gel. H represents the distance between the sample and the camera lens.
Processes 11 02864 g001
Figure 2. Images of surimi gel with different moisture contents.
Processes 11 02864 g002
Figure 3. Schematics illustrating the AutoML flow diagram for training surimi images with varying moisture and starch concentration levels.
Processes 11 02864 g003
Figure 4. Schematic representation of the Convolutional Neural Network architecture constructed in this study.
Processes 11 02864 g004
Figure 5. Color characteristics of surimi gel as affected by increased moisture content and starch concentration: (a) L value, (b) b value, (c) a value, and (d) whiteness value. TBS represents Threadfin breams with starch, APS represents Alaska pollock with starch, TB stands for Threadfin breams without starch, and AP denotes Alaska pollock without starch. The values 76, 78, 80, and 82 indicate the moisture content of the samples, while the values 5%, 10%, and 16% represent the starch concentration in the samples. Samples with different lowercase letters a to j represent classes with significant different (p < 0.05).
Processes 11 02864 g005
Figure 6. Comparison between the “Best” and “Acceptable” models suggested by AutoML, (a) validation accuracy, and (b) model loss.
Processes 11 02864 g006
Figure 7. Confusion matrix generated from test data of surimi with different moisture contents: (a) gel sample prepared from Threadfin bream; (b) gel sample prepared from Alaska pollock; (c) accuracy of the training model; and (d) training loss.
Processes 11 02864 g007
Figure 8. Confusion matrix generated from the test data of surimi with different species and moisture content levels (a), training accuracy (b), and training loss (c).
Processes 11 02864 g008
Figure 9. Confusion matrix generated from the test data of surimi with different starch and moisture content levels for (a) gel sample prepared from Threadfin bream surimi, (b) gel sample prepared from Alaska pollock, (c) training accuracy for Threadfin bream and Alaska surimi, and (d) training loss for Threadfin bream and Alaska surimi.
Processes 11 02864 g009
Table 1. Formulations for surimi gels.
Surimi SpeciesSurimi Content (%)Salt (%)Ice (%)Corn Starch (%)Total Weight (g)Moisture Content (%)Sample Code
Threadfin breams59.34233.66510078%TBS78-5%
42.34245.661010078%TBS78-10%
23.24258.761610078%TBS78-16%
Threadfin breams50.67242.33510080%TBS80-5%
33.81254.191010080%TBS80-10%
14.55267.451610080%TBS80-16%
Alaska pollock62.33230.77510078%APS78-5%
44.22243.781010078%APS78-10%
22.13259.871610078%APS78-16%
Alaska pollock52.04240.96510080%APS80-5%
35.34252.661010080%APS80-10%
15.44266.561610080%APS80-16%
Threadfin breams84.45213.55-10076TB-76%
76.65221.35-10078TB-78%
68.85229.15-10080TB-80%
61.05236.95-10082TB-82%
Alaska pollock88.0629.94-10076AP-76%
79.32218.68-10078AP-78%
71.45226.55-10080AP-80%
63.94234.06-10082AP-82%
Rows with (-) indicate that the material was not used.
Disclaimer/Publisher’s Note: The statements, opinions and data contained in all publications are solely those of the individual author(s) and contributor(s) and not of MDPI and/or the editor(s). MDPI and/or the editor(s) disclaim responsibility for any injury to people or property resulting from any ideas, methods, instructions or products referred to in the content.

