Article

Experimental Study on Enhanced Oil Recovery of the Heterogeneous System after Polymer Flooding

Key Laboratory of Enhanced Oil and Gas Recovery of Ministry of Education, Northeast Petroleum University, Daqing 163319, China
*
Author to whom correspondence should be addressed.
Processes 2023, 11(10), 2865; https://doi.org/10.3390/pr11102865
Submission received: 2 September 2023 / Revised: 22 September 2023 / Accepted: 27 September 2023 / Published: 28 September 2023
(This article belongs to the Section Chemical Processes and Systems)

Abstract

:
Daqing Oilfield faces increasing reservoir heterogeneity after years of polymer flooding, limiting further enhanced oil recovery. A novel preformed particle gel (PPG) was developed by Daqing Oilfield due to the limited profile control ability of polymer flooding. The preformed particle gel possesses strong deformation ability and the ability to pass through pore throats. The PPG was developed considering the in situ reservoir conditions and combined effects of plugging and flooding. Thus, a heterogeneous system was prepared by mixing polymers and the PPG. In this study, we measured the related properties of the system and assessed its profile control ability and oil displacement performance after polymer flooding. The experimental results demonstrate that typical polymer flooding cannot improve oil recovery under current reservoir conditions. Thus, deep profile control technology should be applied to remediate the highly heterogeneous reservoir issue. PPG can considerably increase the viscosity and stability of the system. The heterogeneous system has a strong plugging ability during the subsequent water flooding stage and is suitable to inject into the medium and high permeability layers. The water absorption profile of the core samples is significantly improved due to the impact of the PPG on the plugging of the layer with high permeability and the liquid flow direction. The system displays an excellent profile control effect in the core with a permeability ratio (high permeability/low permeability) of two under the conditions of a PPG concentration of 500 mg/L and an injection volume of 0.5 PV. In the oil displacement experiment, the recovery efficiency was raised by 16.56% using the polymer system, leading to significant swept volume increment and oil recovery improvement.

1. Introduction

Polymer flooding is a commonly used enhanced oil recovery (EOR) technique to improve oil recovery and decrease residual oil. When a polymer (such as polyacrylamide) is dissolved in water, the viscosity of the solution is dramatically increased, lowering the mobility ratio and increasing reservoir sweep efficiency. Additionally, it is an essential technology for enhancing oil recovery in old oilfields [1]. The polymer flooding technique has been applied to Daqing Oilfield since 1996 and shows a practical oil enhancement effect [2,3,4]. Statistical analysis indicates that the reservoir recovers an additional 50% of oil production after polymer flooding. However, over 40% of the original oil in place still exists in the reservoirs, leaving the potential to further improve oil recovery [5,6,7]. Polymer flooding leads to complex reservoir pore structure, high reservoir heterogeneity, high permeable stripes, and the formation of a dominant seepage channel with high permeability and low residual oil saturation [8]. In addition, long-term polymer flooding and water flooding can alter the reservoir’s physical properties, resulting in difficulty in maintaining oil production or production decrease [9]. Higher standards are required for successful EOR applications in old oilfields [10]. As a result, the effective polymer system should possess the ability to control the main seepage channels, increase the swept volume, reduce inter-layer heterogeneity contradiction, improve oil recovery in medium and low permeability layers, and effectively recover the residual oil in potential reservoirs [11,12].
Due to the complexity of old oilfields, traditional polymer flooding cannot effectively enhance oil recovery [13,14]. Therefore, experts and scholars have significantly progressed in enhanced oil recovery technology after polymer flooding. Some research outcomes have been tested in the field [15]. For instance, Daqing Oilfield employed weak-alkali terpolymer flooding and high-concentration polymer flooding, which improved recovery rates by 8% and 10%, respectively. However, the scaling problem caused by alkali limits its subsequent development. Wang [16] studied and assessed weak gel microstructure and characteristics under different conditions. The weak gel (gels with small principal concentration and elastic modulus) flooding was successfully conducted in field tests in the LD10-1 oilfield, with a cumulative oil increment of 57.8 × 10⁴ m3 in the test area. Bian [17] selected the optimal blowing agent (CO2) through laboratory experiments. The foam generated with the blowing agent could improve its stability and minimize adsorption. Foams can effectively seal the highly permeable layer and expand the swept volume by the Jamin effect generated when foams pass through pore throats. In addition, B-PPG (branched preformed particle gel) and hydrolyzed polyacrylamide (HPAM) had synergistic effects on improving oil recovery. Gong confirmed that a B-PPG/HPAM mixture had a higher recovery rate than HPAM or B-PPG alone. Daqing Oilfield has developed gel particles based on the actual reservoir conditions, and the gel particles were prepared through drying, pulverizing, granulating, and screening processes. Currently, methylene bisacrylamide, a cross-linked monomer, and acrylamide are copolymerized to generate new gel particles. The cross-linked monomer only contains one methylene, resulting in weak flexibility and being easy to break.
However, the molecular structure of PPG (preformed particle gel) was designed by Daqing Oilfield based on the plugging adjustment requirements of heterogeneous reservoirs after polymer flooding and matching reservoir pores, as shown in Figure 1. The acrylic acid and cross-linked monomer with a double acrylamide head group were selected as the ionic and cross-linked units, respectively. Acrylamide is the main body of the PPG; the ion unit regulates its swelling performance, and the cross-linked unit is used to construct the gel skeleton. The cross-linked monomer has two acrylamide reaction head groups, which can cross-link different molecular chains and construct the gel network. In addition, its reaction head group is the same as the primary material (acrylamide) and has good polymerization ability. At the same time, the flexibility of gel molecules is adjusted using carbon chains with a specific length as spacer groups between the two reaction head groups. Since PPG is composed of 4–6 allyl diacrylamide copolymerized with acrylamide and acrylic acid, it has higher elasticity, compressive strength, and larger expansion [18]. Therefore, PPG can resist high pressure and has good deformation recovery ability, leading to a successful pass through small pores without breaking. The recovery rate is over 70%.
The system used in this study is a solid–liquid combination composed of PPG and polymer. Under a certain pressure gradient, the particles of the system migrate in large pores to block the dominant seepage channels in the high permeability layer, directing the subsequent fluid flow, expanding the swept volume, and alleviating interlayer heterogeneity. Consequently, injecting the polymer system can improve oil recovery in middle and low permeability layers and effectively produce residual oil from potential reservoirs [19,20]. This paper investigated the properties of heterogeneous systems and the factors that impact the profile control ability after polymer flooding, guiding the application of chemical flooding using the system in the field.

2. Materials and Methods

2.1. Experimental Materials

The following elements are primarily included in the experimental materials:
(1) Polymer: Polyacrylamide (HPAM) with a molecular weight of 25 million. The polymer, made by PetroChina Daqing Petrochemical Company, has a 90% effective content and a 30% degree of hydrolysis.
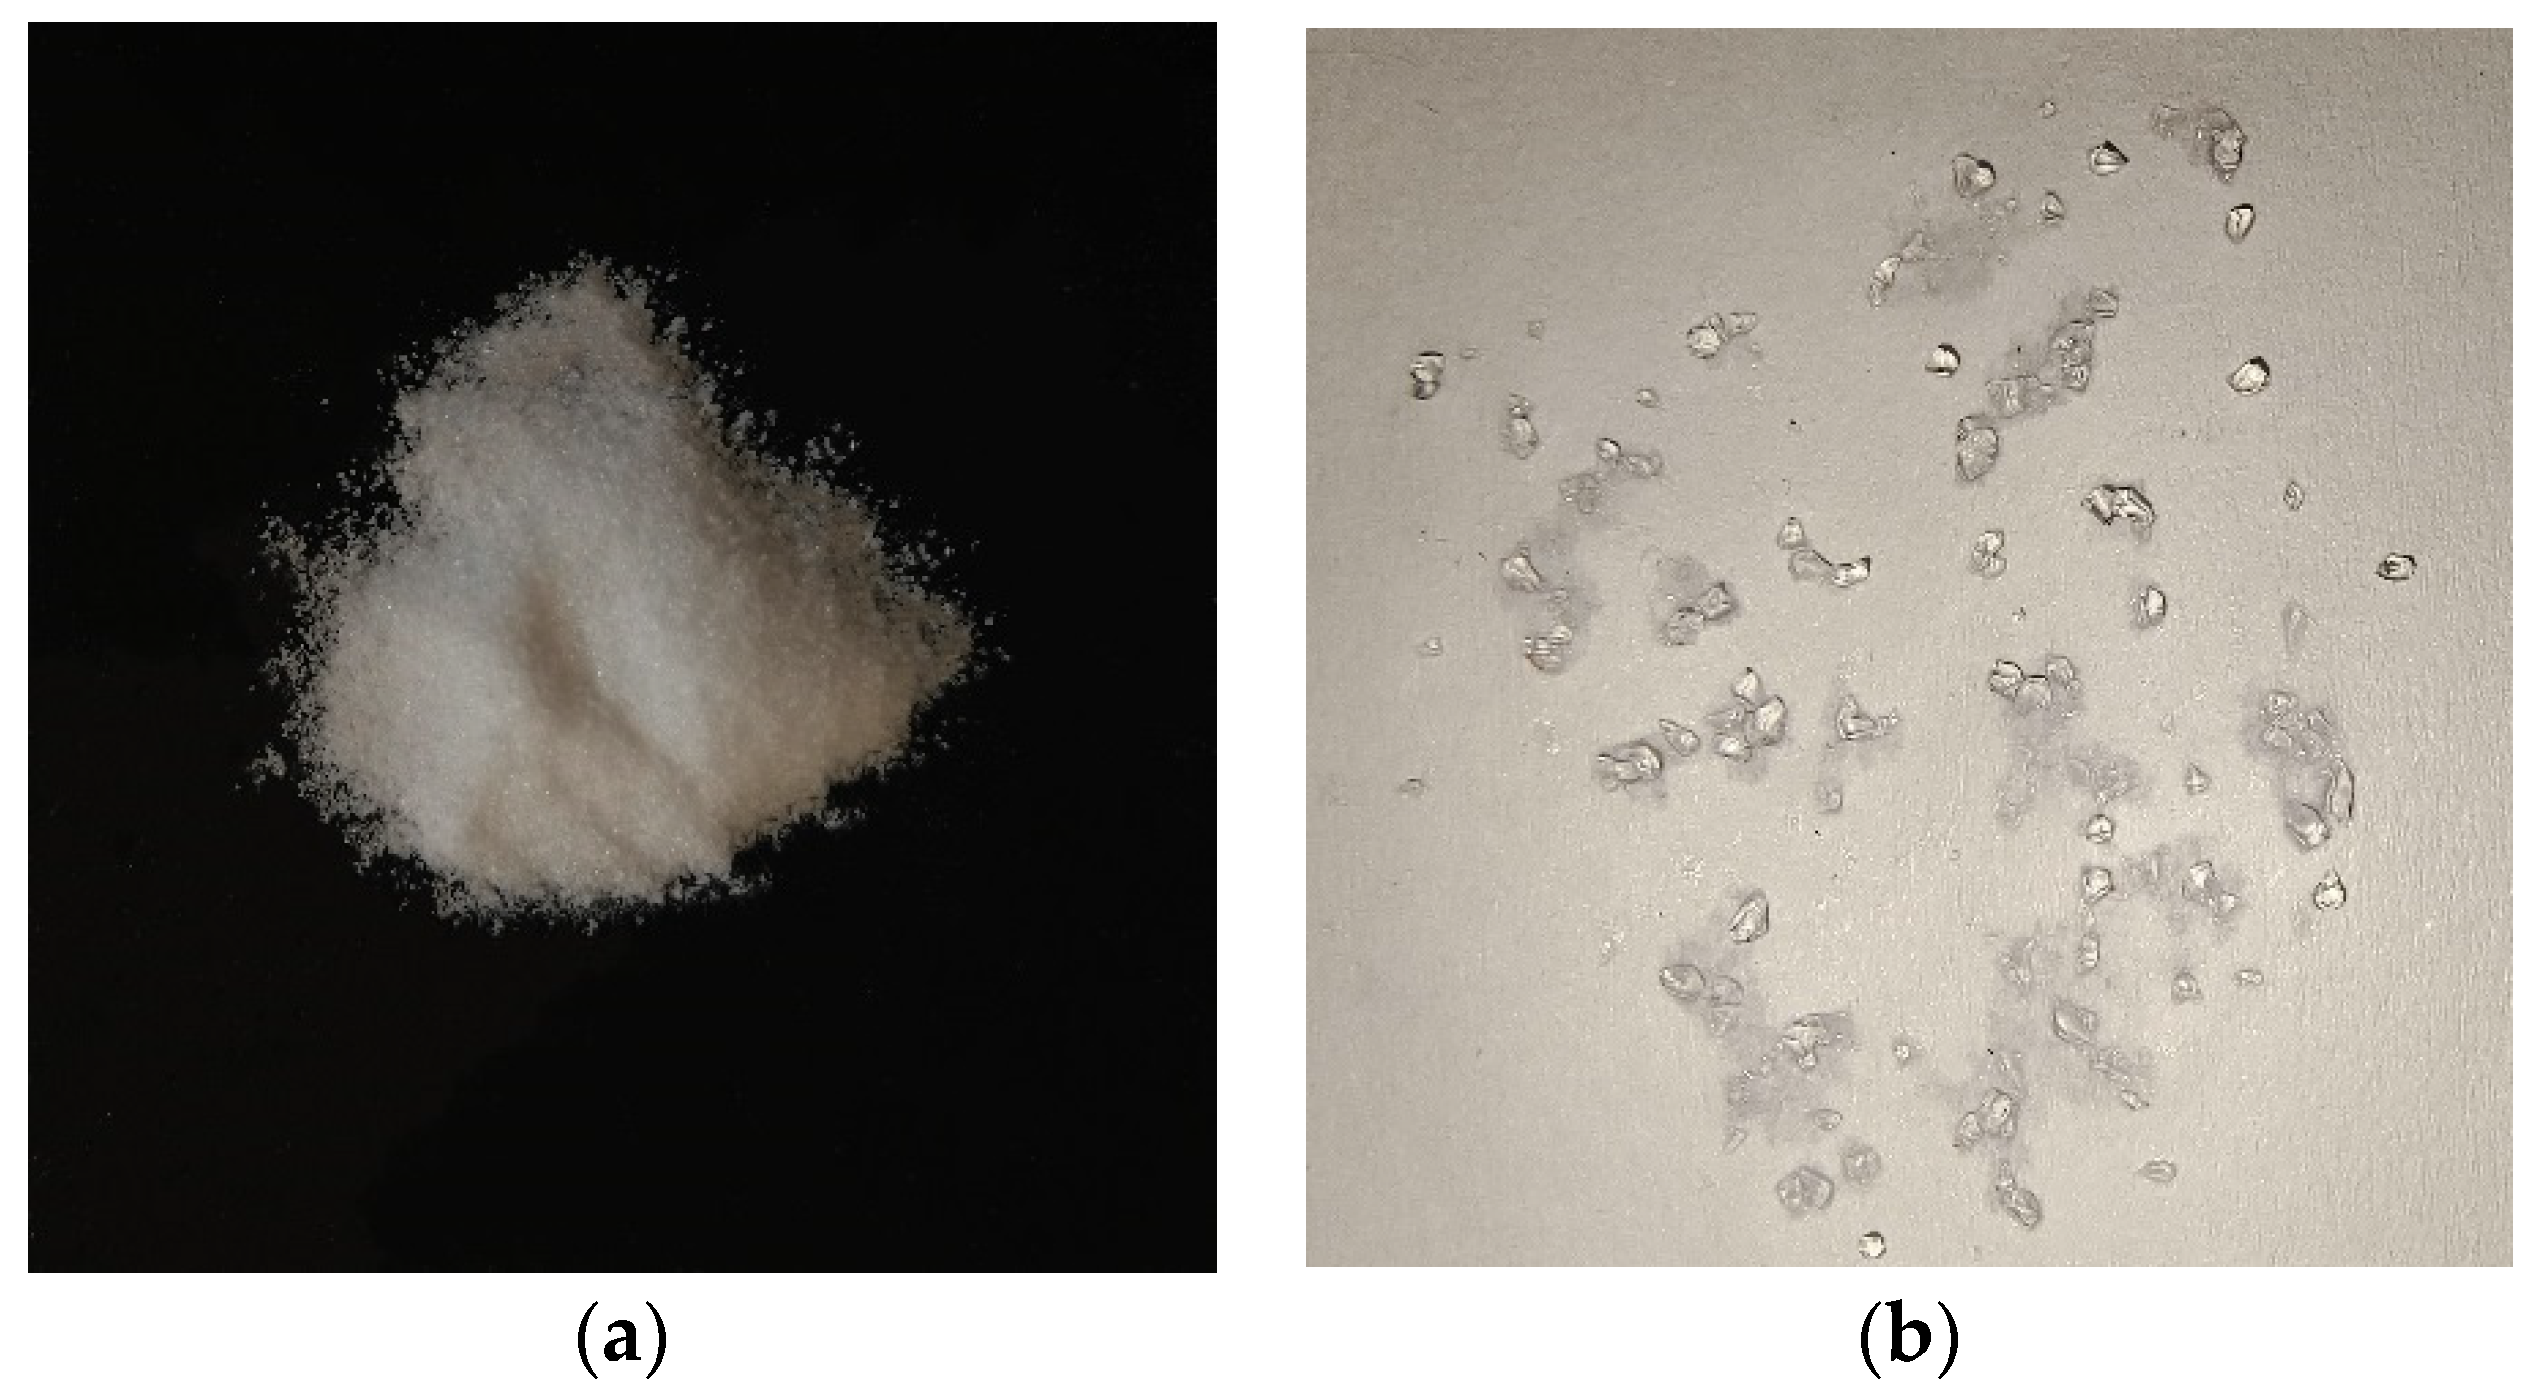
(2) Preformed particle gel (PPG): PPG was developed by the Exploration and Development Research Institute of Daqing Oilfield. The particles have an expansion ratio of three and range in size from 0.15 mm to 0.3 mm, as shown in Figure 2.
(3) Experimental water: Produced water from the first oil production facility of Daqing Oilfield; simulated formation water with a salinity of 6778 mg/L and pH of 8.5. Table 1 provides details of the composition of the experimental water.
(4) Experimental oil: Dehydrated crude oil produced from Daqing Oilfield and aeronautical kerosene. Kerosene and dehydrated crude oil were mixed to create the simulated oil utilized in the experiment. The viscosity of experimental oil is 9.8 mPa·s at 45 °C.
(5) Experimental core: The outer surface of the artificial core model was cast with epoxy resin and ethylenediamine, and the high-strength bakelite was threaded at different locations, including the injection end, the outlet end, and the pressure measurement points. Artificial cores were made by pressing cutting, and quartz sand acted as the matrix. The physical models primarily used in this study were the cylindrical core, long core models, ordinary cast cores, and oil displacement experimental models. Figure 3 depicts the utilized cores. Table 2 displays the main parameters of the models.
(6) Experimental instrument: DV-II Brinell viscometer (Brookfield Company, Toronto, ON, Canada), ISCO pump (Teledyne ISCO Co., Ltd., Lincoln, NE, USA), 2xZ-8 direct-connected high-speed rotary vane vacuum pump (Shanghai Wanjing Pump Manufacturing Co., Ltd., Shanghai, China), and YP-B2003 electronic balance (Shanghai Yueping, Shanghai, China).

2.2. Oil–Water Relative Permeability Change Experiment

The experimental scheme of oil–water relative permeability is as follows:
(1) First, oil was injected into the saturated water core with a small flow rate, and then the displacement speed was gradually increased until no water was collected from the outlet. The displacement volume was recorded, and the bound water saturation was calculated.
(2) The rock sample was soaked in crude oil at a constant temperature of 45 °C for 2 h, evacuated for 1 h, and then put into the core holder for 4 h at the test temperature.
(3) After injecting the experimental oil up to 10 PV, the oil flow rate and inlet and outlet pressure were recorded, and the relative oil permeability under the corresponding water saturation was calculated.
(4) The oil and water were proportionally injected into the rock sample. The inlet and outlet pressure of the rock sample and the flow rate of oil and water were recorded when the injection flow was stable, and the change of oil and water in the oil–water separator was measured.
(5) After injecting 0.57 PV of polymer solution, the above experimental steps (1–4) were repeated.

2.3. Stability Experiment

The stability experiment scheme is described as follows:
(1) Heterogeneous system preparation: 5000 mg/L polymer mother liquid was prepared, stirred in a mixer for 2 h, and then placed in an incubator for 6 h. The required polymer mother liquid was poured into the beaker, diluted with produced water to a concentration of 1200 mg/L, and stirred for half an hour. PPG powder was added slowly into the beaker and stirred for half an hour until the preparation was complete. The mixer speed was set to 800 r/min. The PPG concentration was 500 mg/L.
(2) The viscosity change of the system and polymer was measured with a Brinell viscometer, and the size change of the PPG was measured every 5 days.
(3) The measurements of viscosity are as follows: The viscometer was opened, rotor No. 61 was selected, and the speed was set to 6 r/min. The solution was slowly poured into a container fixed to the viscometer hook. The control lifting knob was turned and the rotor was slowly lowered until the rotor was immersed in the solution. The “Start” button was pressed to record the viscosity value after stability. After the test, the container and rotor were removed.

2.4. Injectivity Test

The injection experiment scheme is described as follows:
(1) Four kinds of artificial cylindrical cores with different permeability were used. The cylindrical cores were vacuumed and saturated with water until the pressure gauge reached −0.1 MPa. The vacuumed core was loaded into the core holder and 10 MPa confining pressure was applied.
(2) The experimental devices were connected successively. The ISCO pump was turned on, the flow rate was set at 0.3 mL/min, the system was injected into the core, and the pressure gauge value and liquid production were recorded every 10 min. The pressure changes were observed at the same time until the pressure stabilization experiment was completed.
(3) The valves at the ends of the ISCO pump and core holder were closed.
(4) The variation of injection pressure with the cumulative injection pore volume were plotted and analyzed.

2.5. Flow Experiment

The liquidity experiment scheme is described as follows:
(1) The long core was connected to the vacuum pump to vacuum and saturate the simulated formation water, connecting the test sets.
(2) When the water flooding pressure was stable, the water permeability of core Kw1 and Kw2 were calculated.
(3) Polymer flooding and system flooding were conducted, respectively, to achieve pressure stability. Finally, the water flooding was performed until pressure stabilization, and the permeability Kp1 and Kp2 were calculated again.
(4) The pressure changes along the five measuring points were recorded throughout the experiment, and the core RF, RRF, and η were calculated.
(5) The experimental data were recorded and analyzed.
The calculation formulas of core RF, RRF, and η are as follows:
R F = P m P f
R R F = P l P f
η = K w K p K w × 100 %
where RF is the resistance coefficient; RRF is the residual resistance coefficient, dimensionless. Pm is the pressure after chemical injection; Pf is the pressure of water flooding before chemical injection. Pl is the pressure of subsequent water flooding after chemical injection; η is the plugging efficiency, dimensionless; Kw is the core permeability before chemical flooding; Kp is the core permeability after chemical flooding.

2.6. Study on Influencing Factors of Profile Control Effect

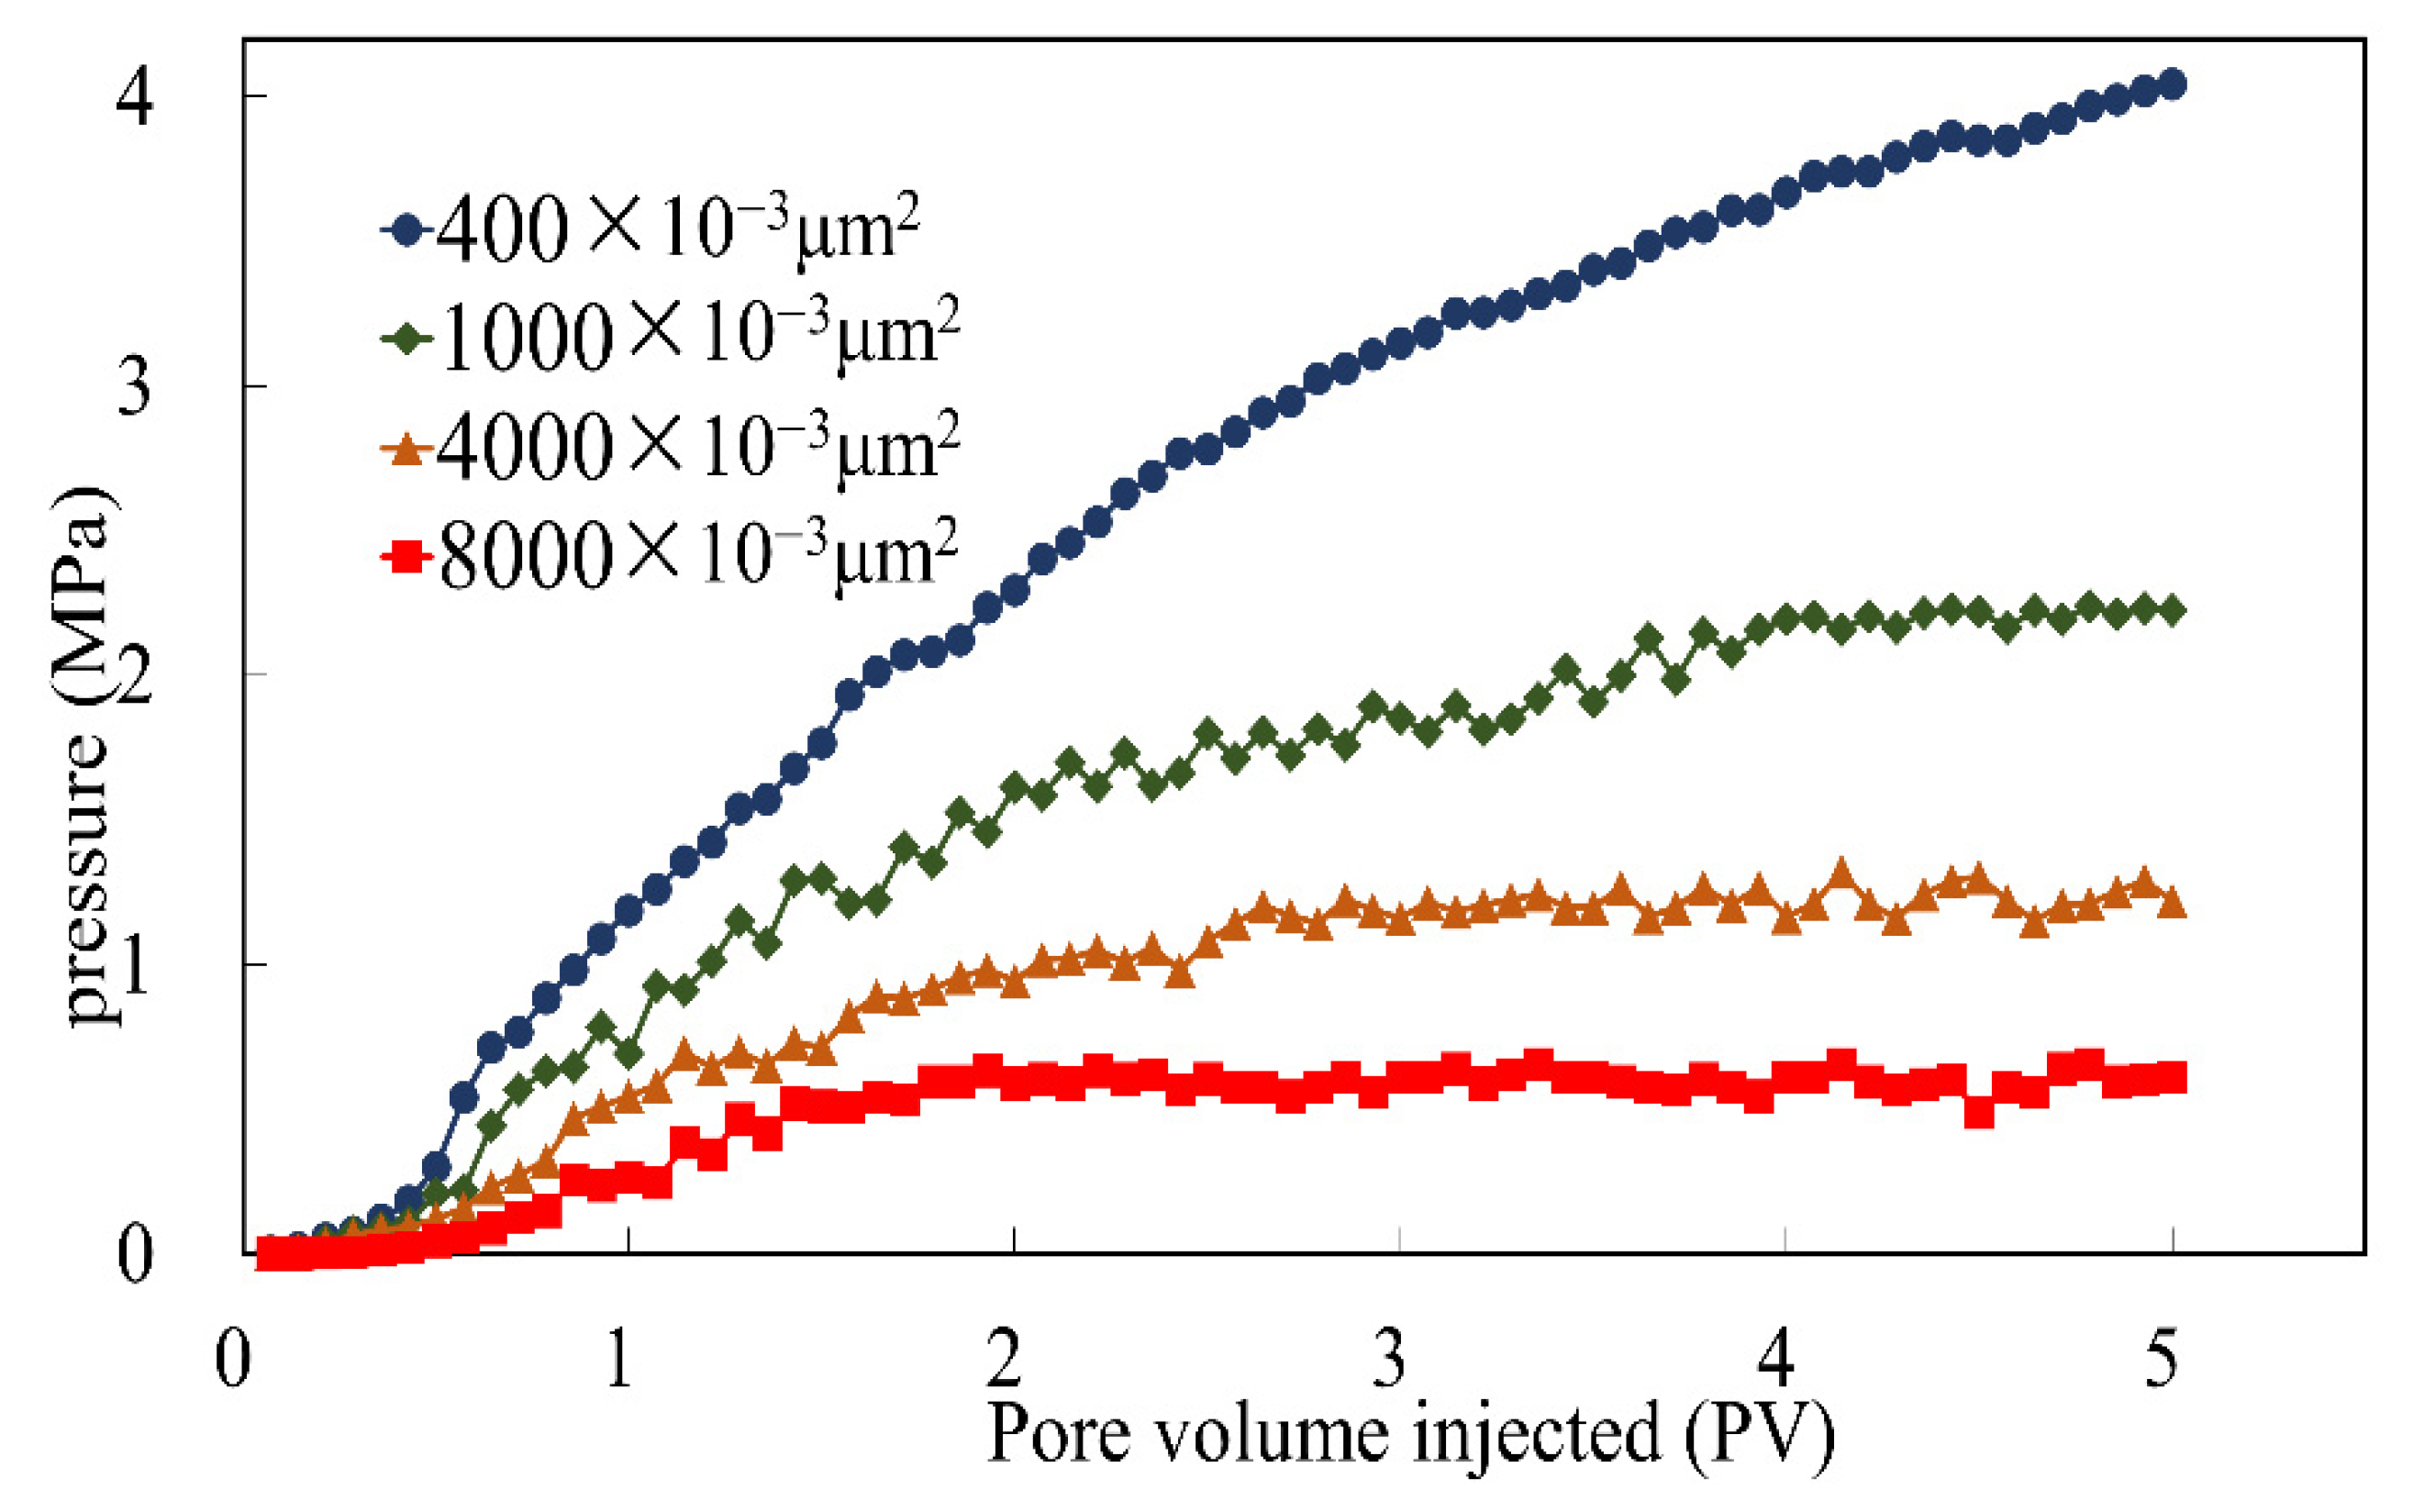
This experiment investigated the plugging ability of PPG on the dominant seepage channel. Since the permeability of the primary seepage path in Daqing Oilfield is greater than or equal to 8000 × 10−3 μm2, the core with 8000 × 10−3 μm2 permeability was selected as the dominant seepage channel. Three groups of parameters with permeability ratios of 2, 4, and 10 representing different degrees of heterogeneity were selected for experiments. Based on the field tests and analysis in Daqing Oilfield, the system with concentrations of 400 mg/L, 500 mg/L, and 600 mg/L and injection volumes of 0.3 PV, 0.5 PV, and 0.7 PV was selected to evaluate the profile control effect. The specific experimental schemes are shown in Table 3.
The experimental procedure of the influencing factors of the profile control effect is described as follows:
(1) The ordinary cast core was vacuumed and saturated with water, and the experimental device used a double-tube parallel model.
(2) The simulated formation water was injected at an injection rate of 0.3 mL/min until the pressure remained stable. After injecting 0.57 PV of polymer solution, the water was injected until the total water content was 98%, and then the system flooding was performed following the subsequent water flooding until the total water content reached 98%.
(3) The experimental data were recorded and analyzed.

2.7. Oil Displacement Experiment

The two-dimensional oil displacement experimental procedure is described as follows:
(1) The core was vacuumed, the formation water was saturated, the simulated oil was saturated, and the experimental device was connected.
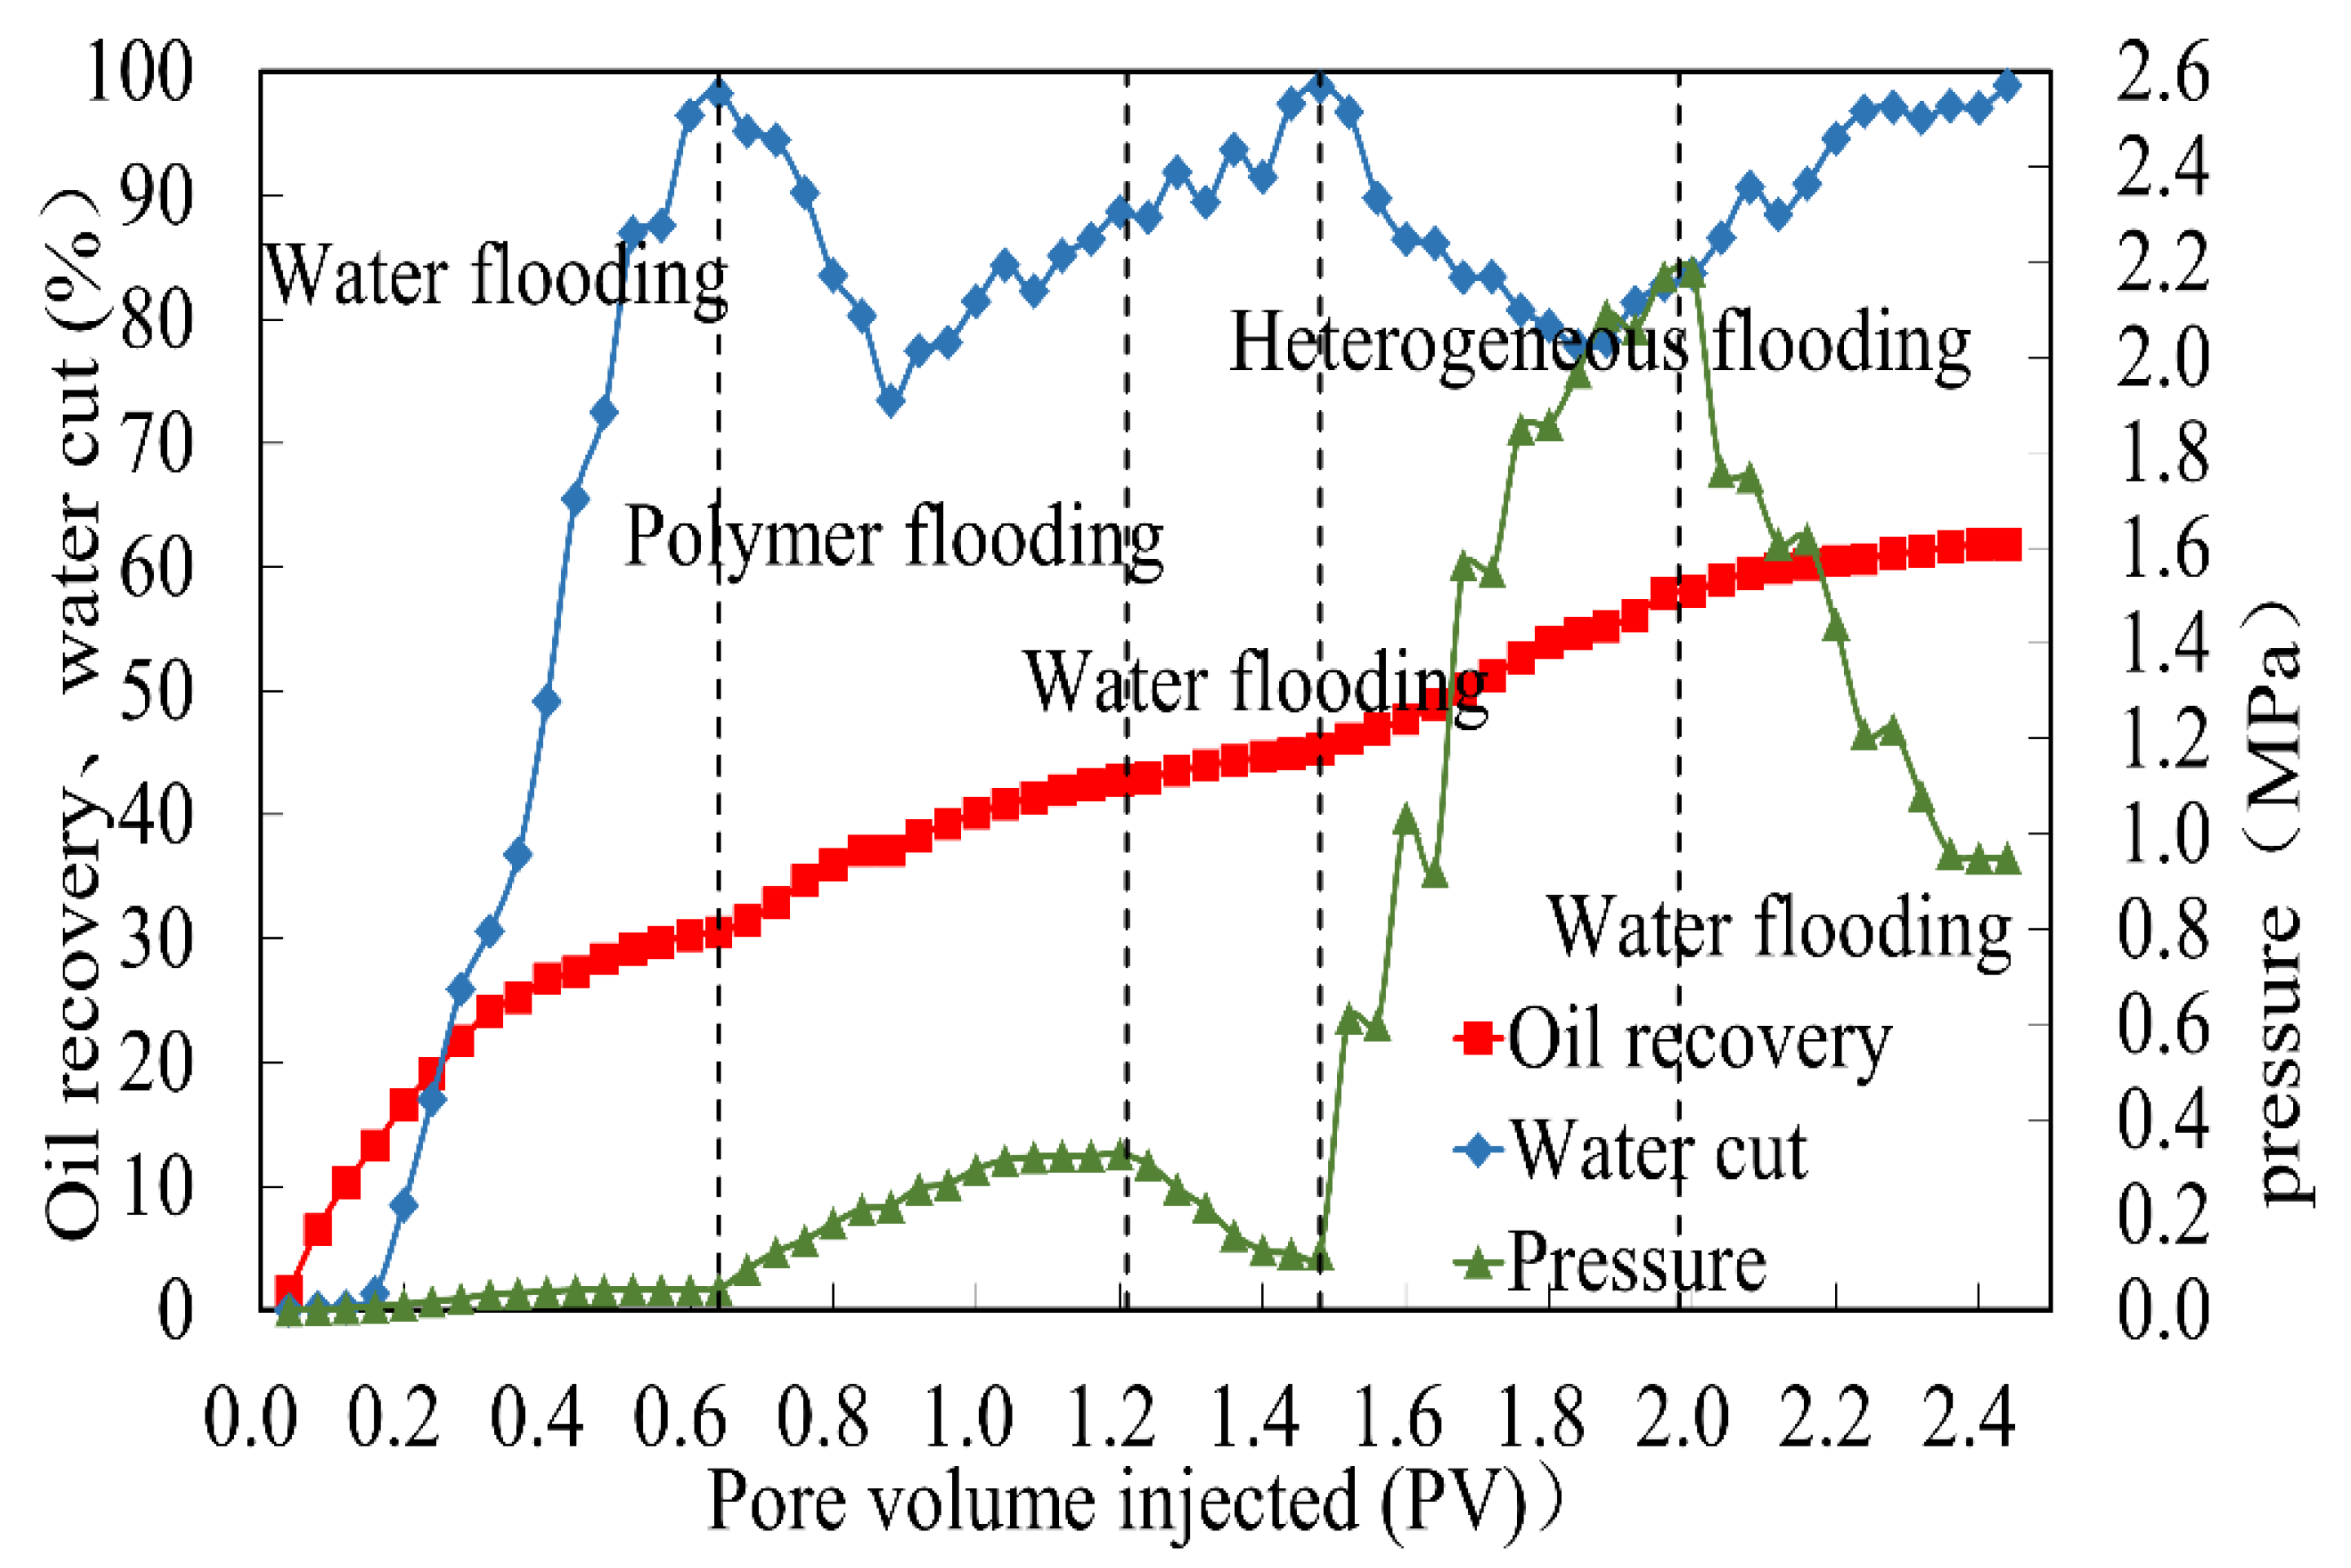
(2) The simulated formation water was injected at an injection rate of 0.3 mL/min until the water cut reached 98%; 0.57 PV of polymer solution was injected, the water was injected to a total water content of 98%, and then 0.5 PV of the system (1200 mg/L polymer + 500 mg/L PPG) was injected, and the subsequent water was injected to a total water content of 98%.
(3) The experimental data were recorded and analyzed.

3. Results

3.1. Oil–Water Relative Permeability Change Experiment

As shown in Figure 4, the oil–water relative permeability curves of the medium and low permeability layers display differences at the high water saturation region after polymer flooding. The polymer adsorption layer on the core surface is approximately 6.2 µm, resulting in a decrease in the water relative permeability (Krw) at the high water saturation end. The Krw of the low, medium, and high permeability layers decreases by 5.49%, 4.90%, and 1.77%, respectively, indicating that a stable and active polymer film greatly influences the medium and low permeability layers. Furthermore, the addition of polymer increases the seepage capacity difference between the high permeability layer and the medium and low permeability layers. The high reservoir heterogeneity and the unfavorable mobility ratio of oil to water lead to the injected fluids flowing along the preferential channel during the oil displacement. Therefore, flow control is the key to further enhancing oil recovery after polymer flooding.

3.2. Stability Analysis

Figure 5 indicates that the viscosity of the heterogeneous system and polymer decreases with time, from 102 mPa·s to 96 mPa·s and from 83 mPa·s to 60 mPa·s, respectively. Their viscosity retention rates are 94.11% and 72.29%, respectively. Therefore, PPG can maintain the viscosity of the polymer solution at a high level and improve the stability of the polymer solution. The increase in system viscosity is mainly caused by increased intramolecular friction. Intermolecular friction includes PPG intermolecular friction, polymer intermolecular friction, and PPG and polymer intermolecular friction. PPG expands rapidly within two days and completes expansion in five days, and the large particle size of PPG increases the molecular interaction and viscosity. However, after PPG maintains the peak expansion rate, the metal cation in the solution neutralizes the negative charge on the polyacrylamide molecular chain, thus weakening the electrostatic repulsion between the molecules. As a result, the viscosity of the polymer solution decreases. PPG consists of polymer monomers and crosslinkers with more charged groups than polyacrylamide molecules. Adding PPG to the polymer solution increases the electrostatic repulsion between PPG and the polymer molecules. The total electrostatic repulsion increases, hindering particle aggregation and leading to a more stable system.
PPG is suspended in the system, and the high viscosity polymer acts as a carrier to transport PPG into the core. The increase in viscosity improves the mobility ratio and the carrying capacity of PPG in the system. However, once the viscosity of the system and the mobility ratio are reduced, PPG accumulates at the inlet end, leading to an injectivity issue.

3.3. Injectivity Test

The pore diameter of the dominant seepage channel in Daqing Oilfield is less than 30 μm, while the size of PPG after expansion is between 0.15 mm and 0.3 mm, much larger than the pore diameter. The successful injection of PPG into the core is the key to the experiment. As shown in Figure 6, the inlet pressure continues to rise with the increase of the injection volume, and the smaller the core permeability, the higher the injection pressure. When the core permeability decreases to 400 × 10−3 μm2, the pressure keeps increasing, indicating that PPG accumulates at the core entrance and fails to migrate into the core. For the core with a permeability of 1000 × 10−3 μm2, the inlet pressure increases and fluctuates to reach stability. The final injection pressure is stable at 2.2 MPa after 4.07 PV injection. Therefore, PPG accumulation occurs at the inlet during the early injection time. PPG passes through the pore throat as injection pressure increases due to its deformation. Similar injection pressure trends are observed on the cores with the permeability of 4000 × 10−3 μm2 and 8000 × 10−3 μm2. The injection pressure of the two experiments finally stabilizes at 1.22 MPa and 0.63 MPa when injecting 2.86 PV and 1.93 PV, respectively. The experimental results show that the heterogeneous system can easily be injected into high permeability cores (permeability > 4000 × 10−3 μm2) but has difficulty penetrating low permeability cores (permeability < 1000 × 10−3 μm2). Therefore, under the experimental pressure, PPG primarily remains in the high permeability layer, minorly enters the middle permeability layer, and fails to enter the low permeability layer, alleviating the reservoir heterogeneity issue.

3.4. Flow Performance Analysis

The seepage behavior of the heterogeneous system in porous media determines its deep profile control ability and can be described by the change in pressure along the path. Figure 7 shows that the pressure gradually increases during the polymer flooding and reaches its maximum value of 0.46 MPa. The pressure gradients along the core direction are 0.695 MPa/m, 0.595 MPa/m, 0.385 MPa/m, and 0.355 MPa/m, respectively. Then, the pressure remains stable, indicating that the polymer steadily migrates in the core. In contrast, the injection pressure rapidly increases during the heterogeneous flooding phase until it reaches the maximum pressure of 1.22 MPa, and then the pressure at each measuring point fluctuates around the maximum pressure. The pressure gradients along the long core direction are 1.434 MPa/m, 1.362 MPa/m, 1.126 MPa/m, and 1.098 MPa/m, respectively. The pressure curve shows a zigzag pattern as PPG migrates forward. Due to the shear force in the rock, the polymer viscosity and the pressure gradient decrease, resulting in PPG migration termination and PPG deposition in the large pore. PPG blocks the large pores and directs the following liquid to small pores. The accumulated PPG is squeezed slowly through the pore throat into other pore channels in the pattern of deformation–pass–recovery, causing a pressure gradient decrease and sweep area increase. Compared to polymer flooding, the pressure gradient distribution from inlet to outlet is more apparent in heterogeneous flooding.
RF and RRF are two critical parameters in chemical flooding. As shown in Table 4, the resistance coefficient in the heterogeneous flooding stage is about four times that of the polymer flooding, the RRF is about five times that of polymer flooding RF, and the plugging rate is much higher than that of the polymer solution. The results demonstrate that the system possesses better retention and plugging properties and weaker injectivity performance than the polymer solution. Therefore, the heterogeneous oil flooding system has a strong plugging ability in the subsequent water flooding stage.

3.5. Analysis of Influencing Factors of Profile Control Effect

3.5.1. Core Permeability Ratio

After years of water and chemical flooding, the interlayer heterogeneity intensifies, and PPG can mitigate the interlayer difference and improve the liquid absorption profile. The profile control ability for reservoirs with different permeability was studied in the experiment. As shown in Figure 8, the core flow ratio of the high permeability to low permeability layers is around 2:8 when the core permeability ratio is two, while the core flow ratio of the high permeability to low permeability layers is approximately 3:7 under the core permeability ratio of four. However, effective plugging does not occur when the core permeability ratio increases to 10. Therefore, the heterogeneous system has a good profile control effect and can effectively improve its water imbibition profile. However, the required injection pressure difference of the high and low permeability cores is too significant as core heterogeneity increases, and the profile control effect is gradually diminished.

3.5.2. Injection Concentration

The flow rate curves of heterogeneous systems with different PPG concentrations were investigated, and the results are depicted in Figure 8b and Figure 9. When the concentration is 500 mg/L, the high–low permeability flow ratio in the subsequent water flooding stage is close to 2:8, with an excellent profile control effect. However, fluids tend to flow through the high permeability layer in the subsequent water flooding stage as the concentration increases to 600 mg/L. PPG rapidly accumulates in the front end of the core when the concentration is too high, preventing PPG from penetrating the core in-depth due to the permeability of the front end decreasing. Since the permeability of the core in-depth cannot be modified by PPG, a new high flow channel is formed during the subsequent water drive process once the pressure breaks through. Therefore, the flow diversion rate of the high permeability layer increases rapidly, showing an inferior sealing effect. In contrast, the plugging is incomplete under low concentrations. Thus, 400 mg/L is the optimal concentration.

3.5.3. Injection Volume

Figure 8b and Figure 10 compare the flow rate curves under different injection rates. As the injection volume of PPG increases to a certain value after water flooding, the diversion volume of the low permeability core exceeds that of the high permeability core. The flow diversion rate of the high permeability layer is higher than that of the low permeability layer when injecting 0.3 PV of PPG, with a ratio of the high to low permeability layers of 7:3. When increasing the injection volume to 0.7 PV, the diversion ratio of the high and low permeable layers is 5:5. PPG first enters the high permeability core and increases the seepage resistance of the high permeability core. Therefore, when the injection amount of PPG is small, the seepage resistance of the low permeability core after flooding is still higher than that of the high permeability core due to an inadequate PPG volume to fully seal high flow channels. However, a large amount of PPG enters the low permeability core after PPG blocks the high permeability core if the PPG injection volume is too high, resulting in a similar flow rate in the high and low permeability layers. PPG can dynamically adjust the shunt flow of heterogeneous cores by alternately plugging high and low permeable layers. However, the injection pressure loss is severe when substantive PPG enters the low permeability layer due to the low permeability layer damage, causing a weak shunt effect of high and low permeability layers. Therefore, the optimal PPG injection volume is 0.5 PV.

3.6. Oil Displacement Experiment

3.6.1. Dynamic Production Curve

Figure 11 illustrates that the pressure at the injection ends rises with the formation water injection during the water flooding stage. Water production rises quickly along with increased crude oil production before stabilizing. Because the polymer is more viscous than water, the residual oil in the previous stage is recovered by polymer flooding, although the water cut reaches 98% in the water flooding stage. During early polymer flooding, the water rate decreases sharply, and the pressure rises. With the increase of the polymer injection amount, the polymer solution gradually forms a mainstream channel in the core. The subsequent fluid passes through the mainstream channel, resulting in stable pressure and an increased water rate in the late polymer flooding. After polymer flooding, the pressure drops rapidly in the subsequent water flooding stage. At this time, a lot of oil is still trapped in the core.
In heterogeneous flooding, PPG blocks large pores and dominant seepage channels, resulting in a rapid rise in pressure. PPG passes through pore throats by elastic deformation and rupture when the pressure reaches a certain level, resulting in pressure decline. The heterogeneous system plays a significant role in plugging the high permeability layer, especially in the middle stage of flooding. The subsequent fluid is allowed to direct to the medium and low permeability layers, producing the residual oil in these layers.

3.6.2. Variation of Oil Saturation

The oil saturation changes of the reservoir before and after heterogeneous flooding were analyzed, as shown in Figure 12. Compared to the beginning of the heterogeneous flooding stage, the main channel of the high permeability layer becomes significantly broader after the heterogeneous flooding stage, indicating that the heterogeneous system preferentially enters the high permeability layer and migrates along the main channel. PPG in the heterogeneous system effectively seals the high permeability layer and strips and deforms through the pore throat under high pressure. The residual oil in the core is expelled, and the oil saturation of the high permeability layer is reduced by 3.80%. The migration pattern of the heterogeneous system in the middle permeable layer is similar to that in the high permeable layer. The main channel becomes broader and more uniform, and the oil saturation near the main channel decreases by 5.26%, slightly higher than that in the high permeable layer. Thus, the heterogeneous system can effectively seal the high permeable layer, expand the swept volume of the middle permeable layer, and improve the oil recovery. The oil saturation of the low permeability layer decreases by approximately 17.22%. PPG in the heterogeneous system seals the high and medium permeability layers, forcing the subsequent injection fluid to the low permeability layer. In addition, PPG cannot enter the reservoir, forming a small range of the main channel near the injection end and expanding the swept volume near the injection end. Therefore, the impact area near the injection end of the permeable layer is wide, and the residual oil is recovered to a large extent.

4. Conclusions

This study aims to solve the issues of reservoir heterogeneity and seepage channels after years. The main conclusions and recommendations are as follows:
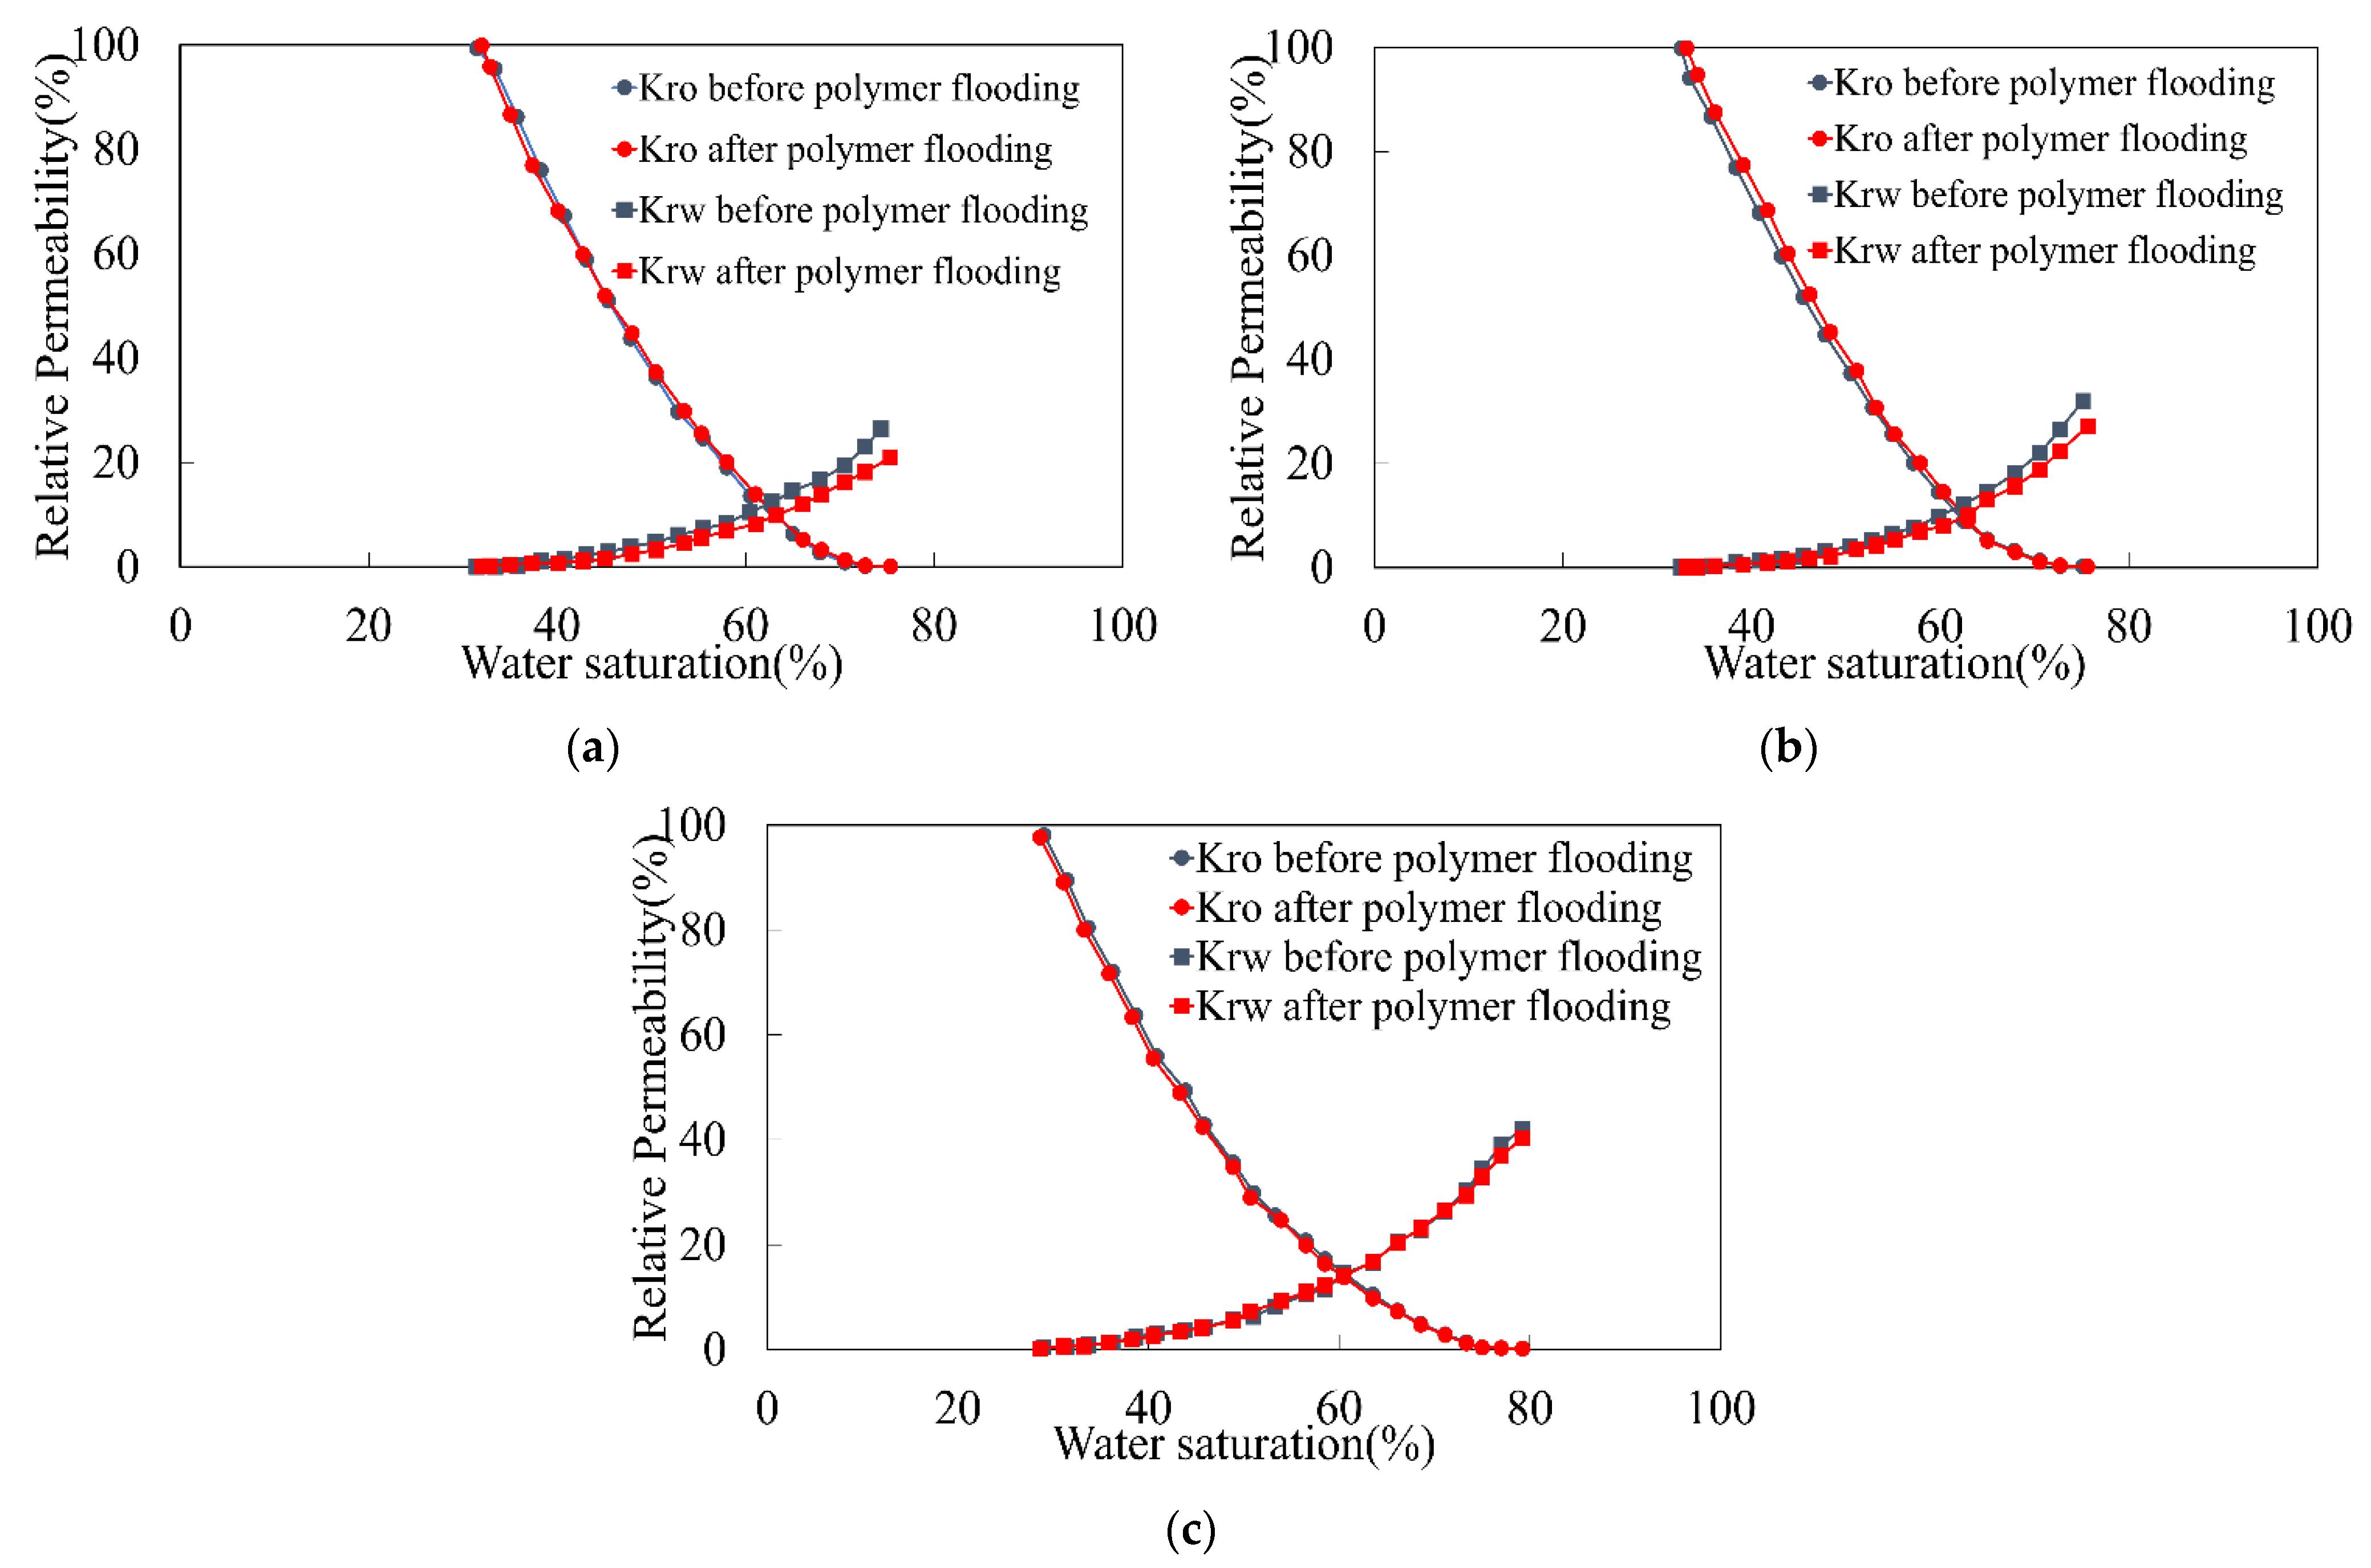
(1) Krw decreases after polymer flooding, and the Krw of the low, medium, and high permeability layers decreases by 5.49%, 4.90%, and 1.77%. The lower the permeability, the more obvious the decrease.
(2) The viscosity retention rate of the heterogeneous composite system within 90 days is 94.11%, which is 21.82% higher than that of the polymer system. System stability has been greatly improved.
(3) PPG cannot be injected into cores with a permeability of 400 × 10−3 μm2 and 1000 × 10−3 μm2 but can be injected smoothly into cores with a permeability of 4000 × 10−3 μm2 and 8000 × 10−3 μm2.
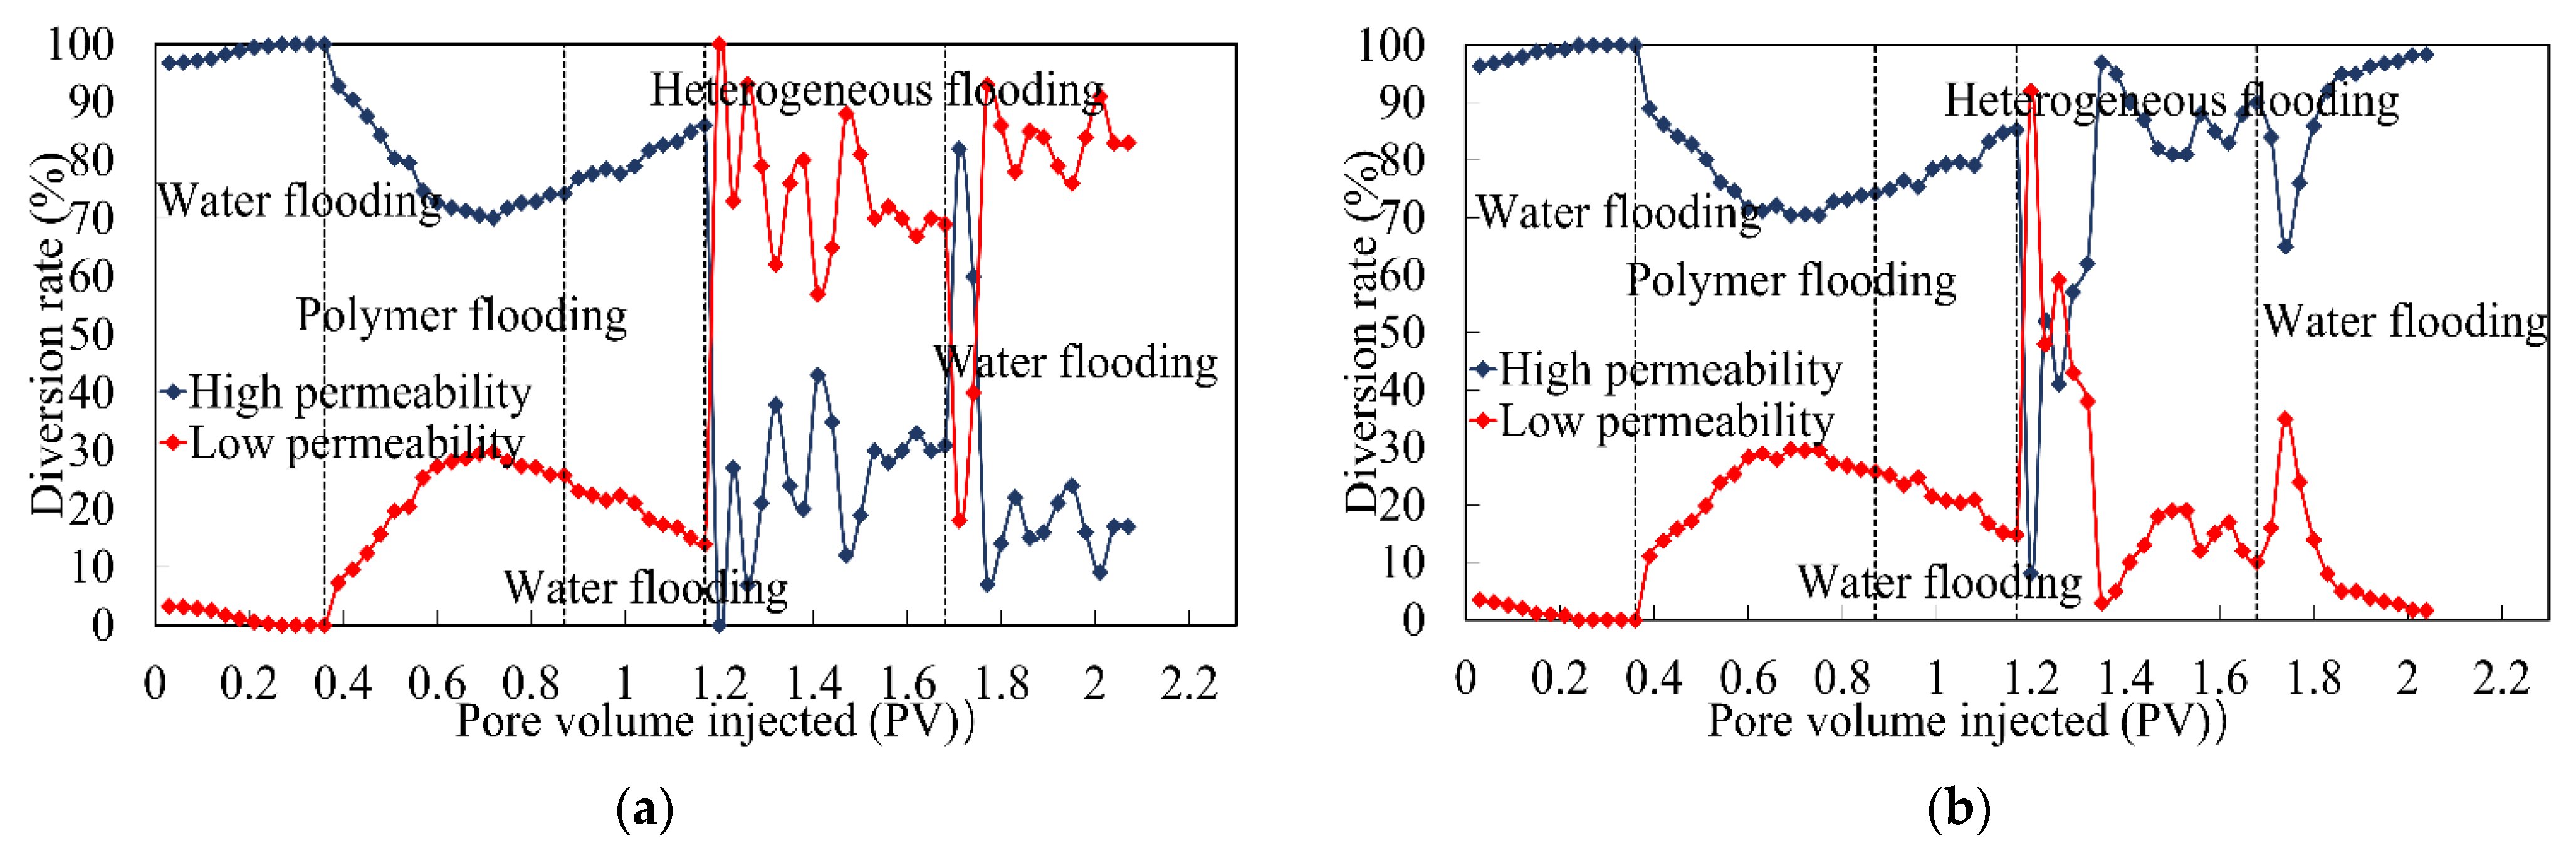
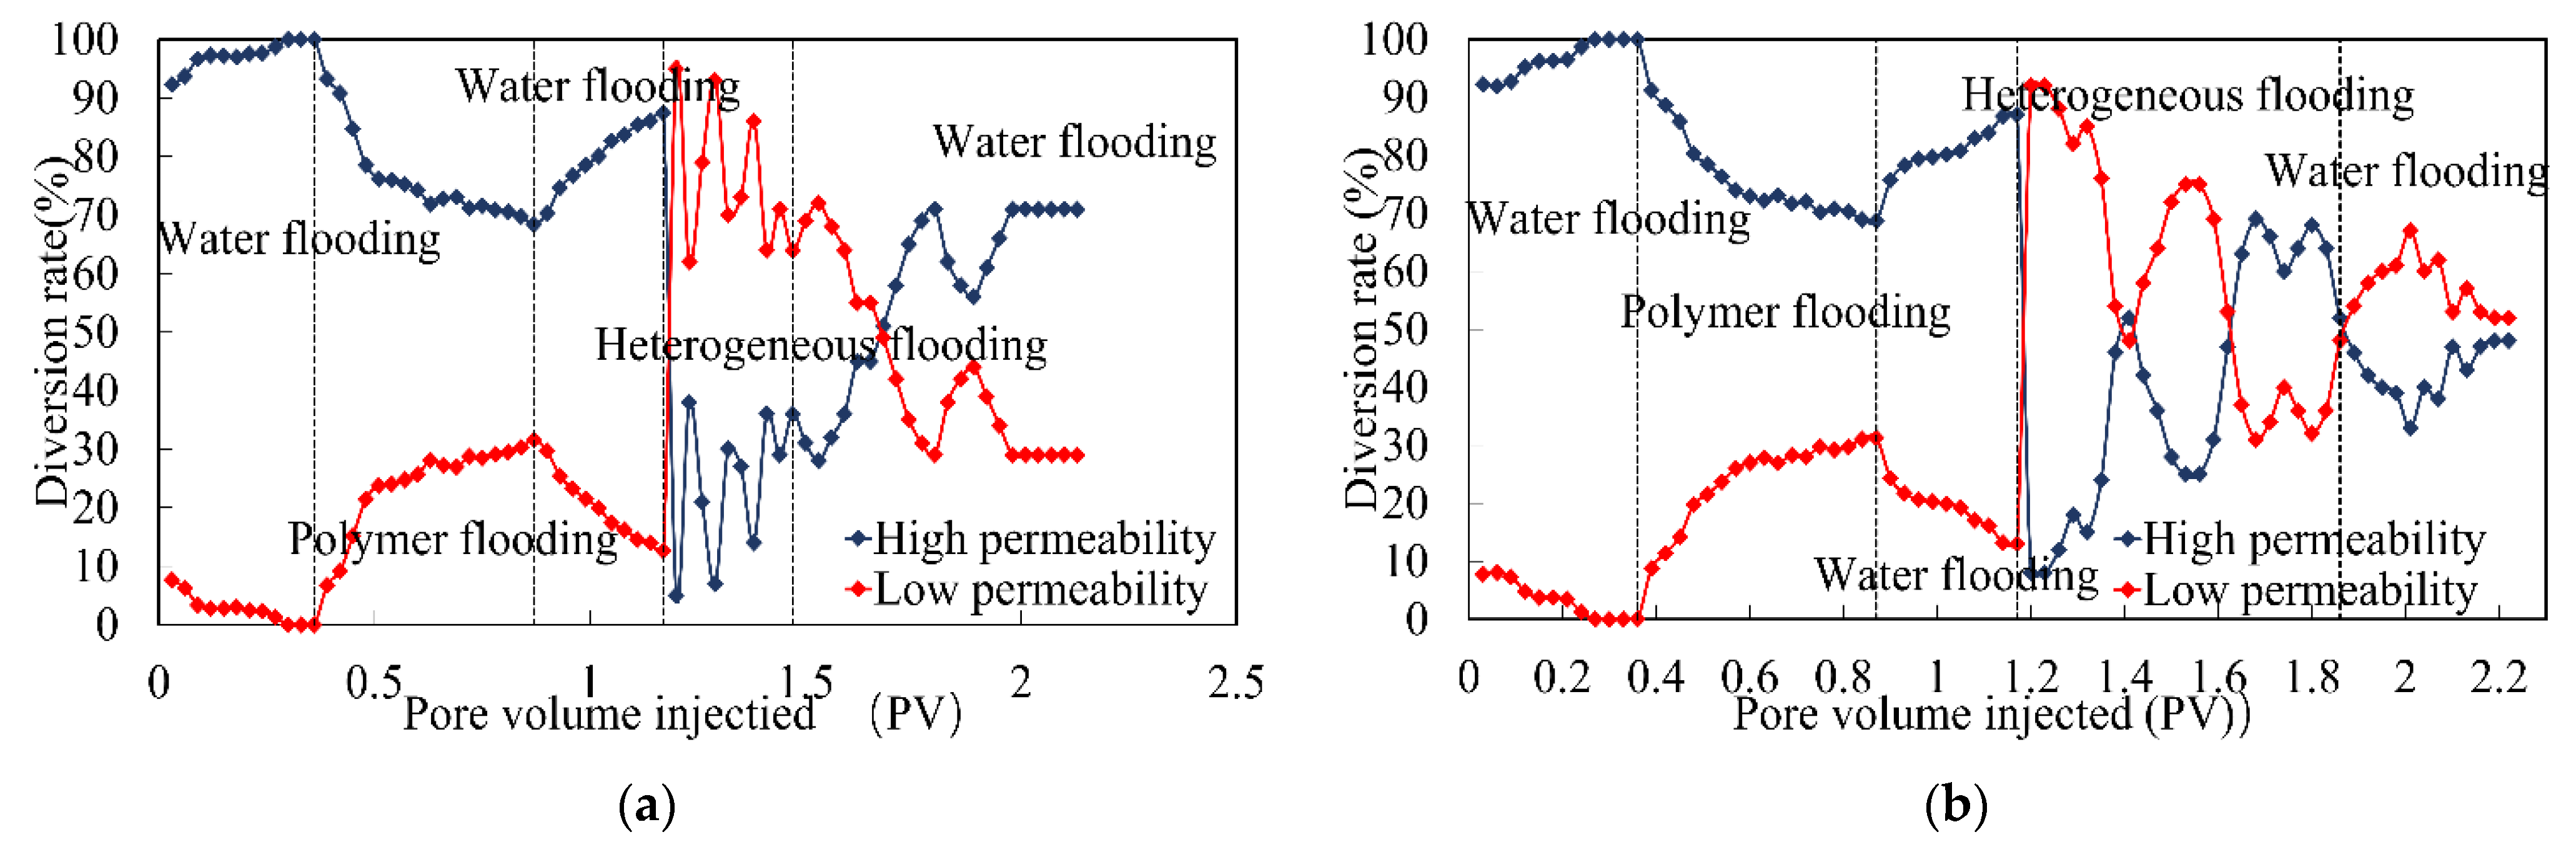
(4) The pressure gradients of the heterogeneous system along the long core direction are 1.434 MPa/m, 1.362 MPa/m, 1.126 MPa/m, and 1.098 MPa/m, respectively, and the pressure gradient decreased slightly. The pressure gradient of the heterogeneous system is nearly higher than that of the polymer. Thus, the heterogeneous system preferentially enters the high-permeability layer and is more likely to form the plugging, which forces the subsequent fluids to enter the medium/low permeability layers, thereby greatly enhancing oil recovery in the medium/low permeability layers.
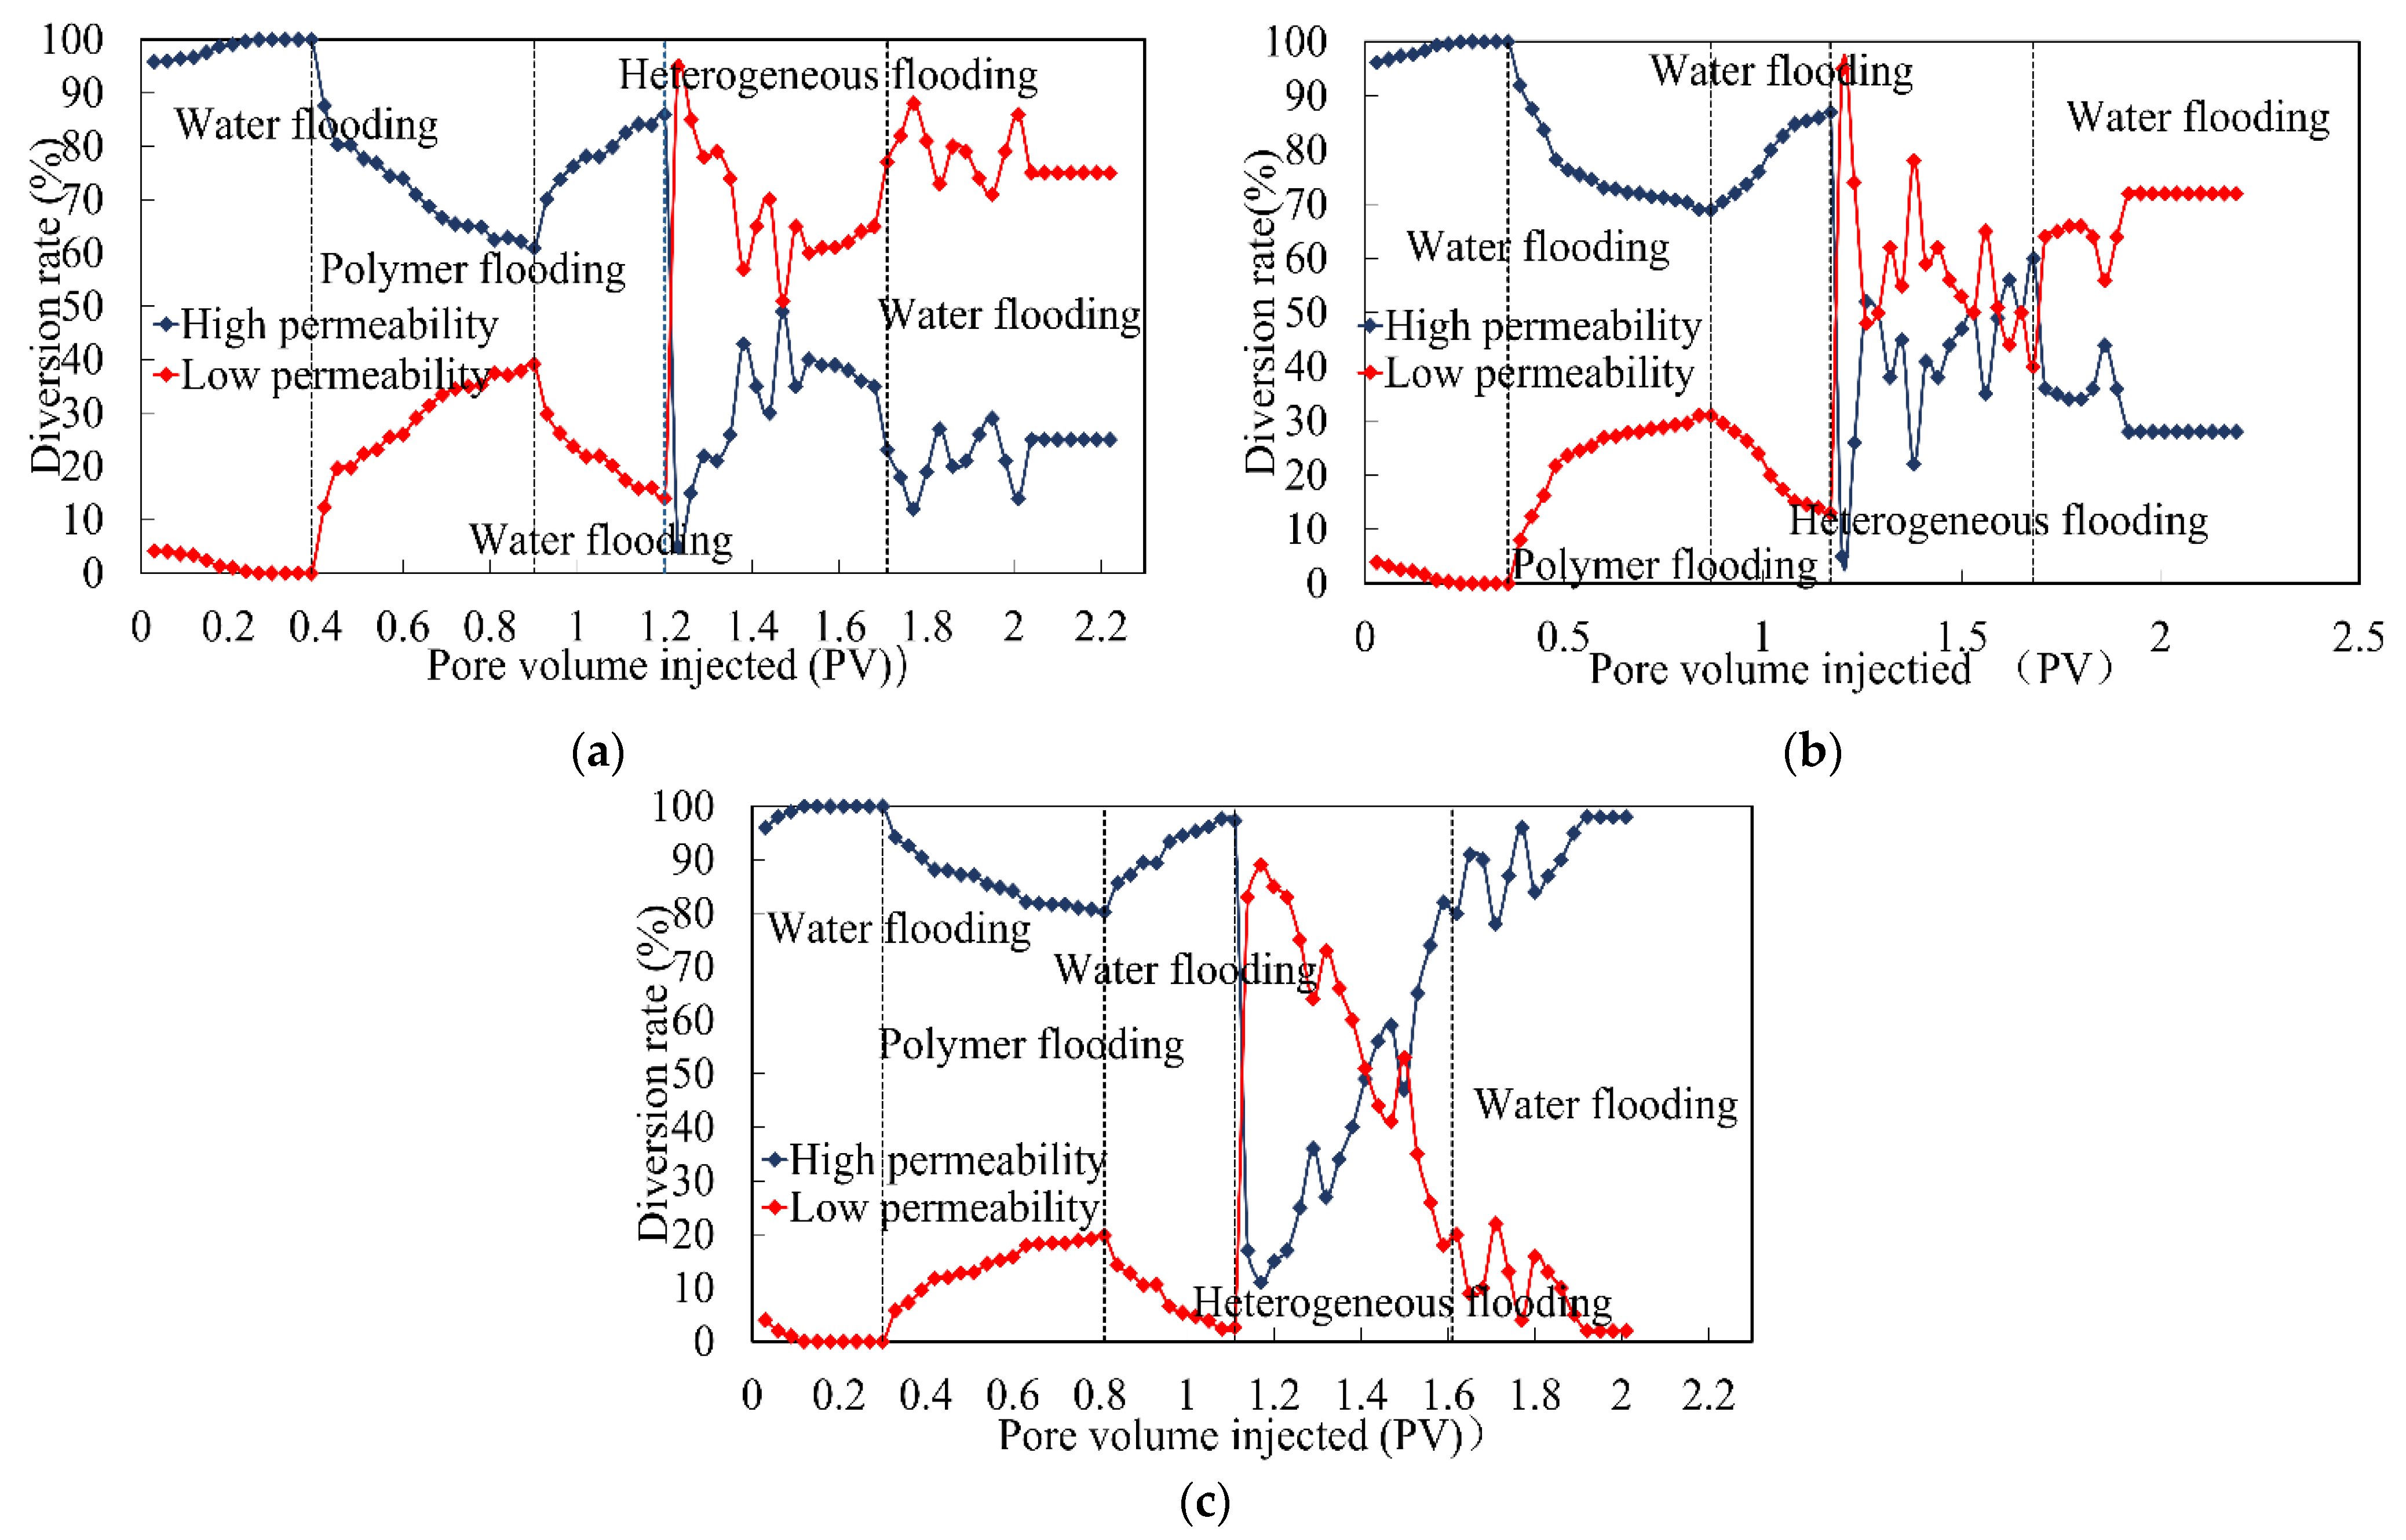
(5) The heterogeneity of the core, the PPG concentration, and the injection volume greatly influence the profile control effect. The heterogeneous system has a remarkable profile control effect on heterogeneous cores under 500 mg/L concentration, 0.5 PV injection volume, and a permeability ratio of two.
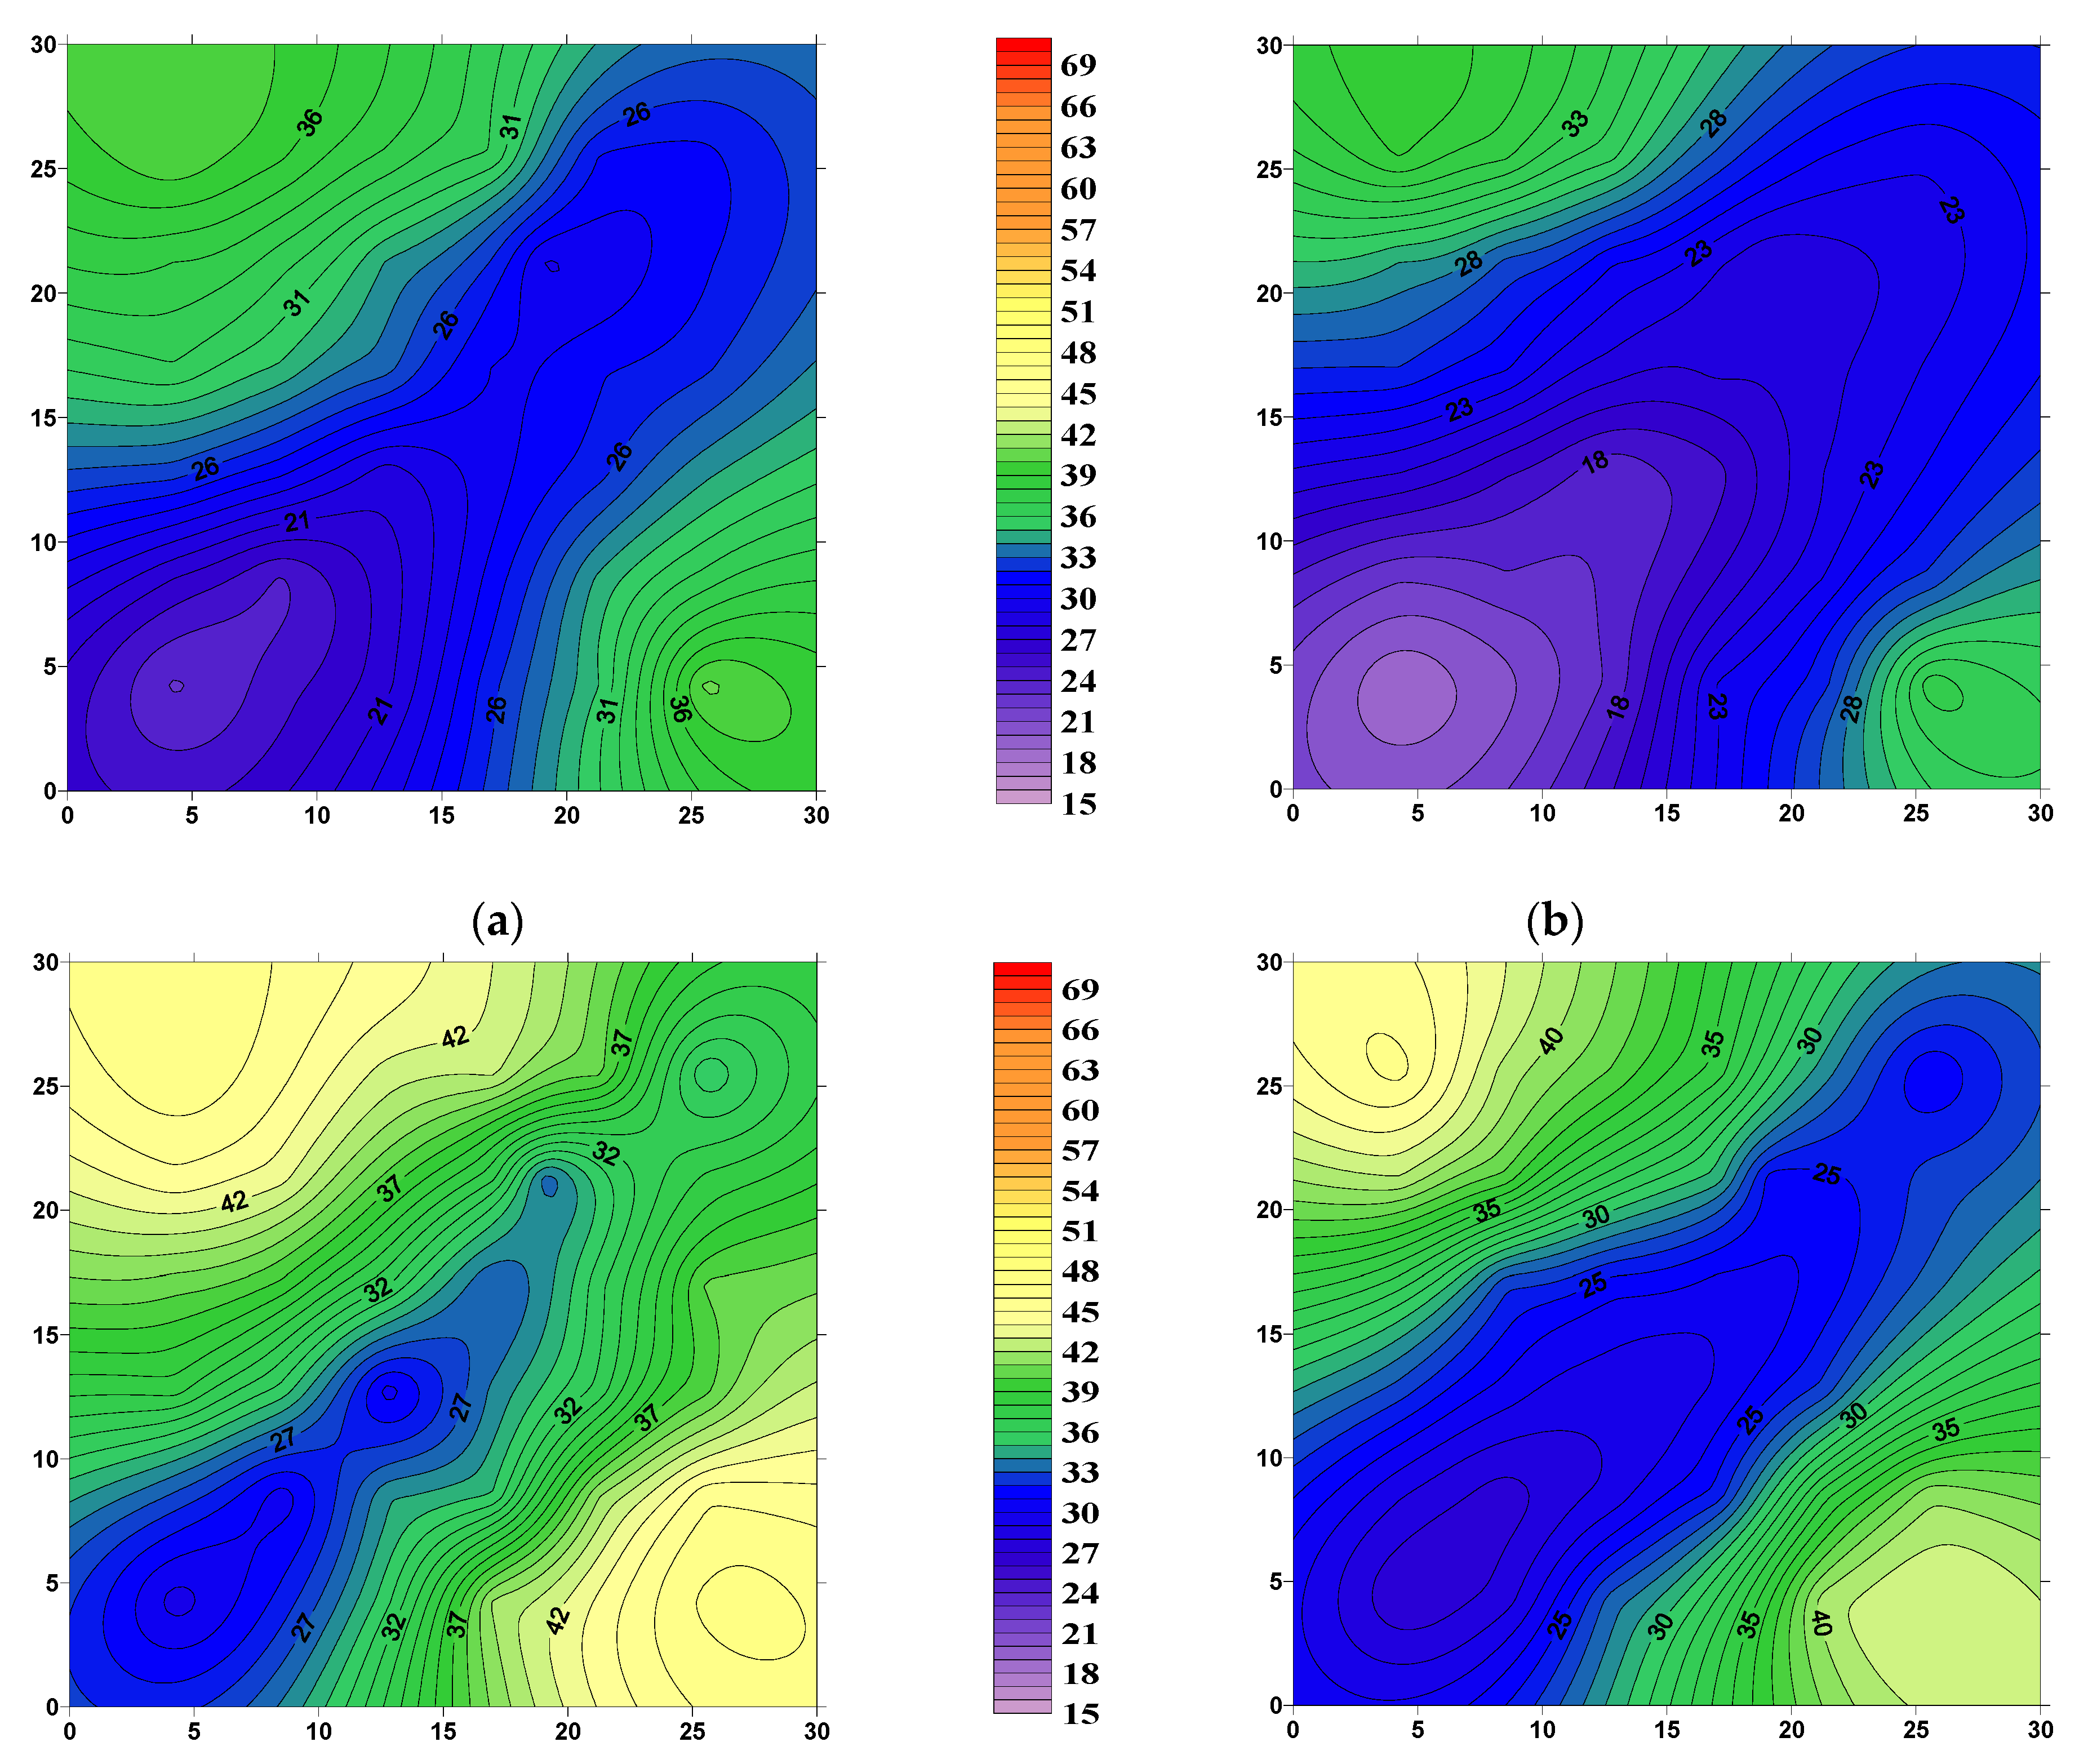
(6) The recovery efficiency of the one-injection-one-production well pattern model in the heterogeneous flooding stage is 16.56%. The average oil saturation reduction of high, medium, and low permeability layers is 3.80%, 5.26%, and 17.22%, respectively. The medium and low permeability layers contribute a significant portion to the production increment.

Author Contributions

Conceptualization, L.L.; methodology, M.Z. and L.L.; formal analysis, Y.P. and M.Z.; data management, X.F., G.C. and L.J. All authors have read and agreed to the published version of the manuscript.

Funding

This work was supported by the Natural Foundation of China (52174023) and the Science Foundation of Heilongjiang Province of China (LH2021E015).

Data Availability Statement

Due to limitations such as privacy or ethical concerns, data are only available upon request. The corresponding author can provide the data described in this study upon request. Due to corporate limitations, the data are not publicly accessible.

Acknowledgments

Li Liu thanks the Enhanced Oil Recovery Research Institute for funding this work.

Conflicts of Interest

The authors declare no conflict of interest.

References

  1. Guo, H.; Song, K.; Liu, S.; Zhao, F.; Wang, Z.; Xu, Y.; Liu, J.; Tang, E.; Yang, Z. Recent advances in polymer flooding in China: Lessons learned and continuing development. SPE J. 2021, 26, 2038–2052. [Google Scholar] [CrossRef]
  2. Wang, D.M.; Cheng, C.J.; Wu, J.Z.; Wang, G. Application of polymer flooding technology in Daqing Oilfield. Acta Pet. Sin. 2005, 26, 74. [Google Scholar]
  3. Zhang, R.; Chen, H. Multi-objective global and local Surrogate-Assisted optimization on polymer flooding. Fuel 2023, 342, 127678. [Google Scholar] [CrossRef]
  4. Chen, Z.; Han, X.; Kurnia, I.; Yu, J.; Zhang, G.; Li, L. Adoption of phase behavior tests and negative salinity gradient concept to optimize Daqing oilfield alkaline-surfactant-polymer flooding. Fuel 2018, 232, 71–80. [Google Scholar] [CrossRef]
  5. Song, K.; Tao, J.; Lyu, X.; Xu, Y.; Liu, S.; Wang, Z.; Liu, H.; Zhang, Y.; Fu, H.; Meng, E. Recent Advances in Polymer Flooding in China. Molecules 2022, 27, 6978. [Google Scholar] [CrossRef] [PubMed]
  6. Bai, M.; Zhang, Z.; Cui, X.; Song, K. Studies of injection parameters for chemical flooding in carbonate reservoirs. Renew. Sustain. Energy Rev. 2017, 75, 1464–1471. [Google Scholar] [CrossRef]
  7. Seright, R.; Wang, D. Polymer Retention “Tailing” Phenomenon Associated with the Milne Point Polymer Flood. SPE J. 2022, 27, 2863–2881. [Google Scholar] [CrossRef]
  8. Guangzhi, L.; Qiang, W.; Hongzhuang, W.; Weidong, L.; Zhengmao, W. Chemical flooding development status and prospect. Acta Pet. Sin. 2017, 38, 196. [Google Scholar]
  9. Han, X.; Kurnia, I.; Chen, Z.; Yu, J.; Zhang, G. Effect of oil reactivity on salinity profile design during alkaline-surfactant-polymer flooding. Fuel 2019, 254, 115738. [Google Scholar] [CrossRef]
  10. Hou, J. Network modeling of residual oil displacement after polymer flooding. J. Pet. Sci. Eng. 2007, 59, 321–332. [Google Scholar] [CrossRef]
  11. Pi, Y.; Liu, J.; Cao, R.; Liu, L.; Ma, Y.; Gu, X.; Li, X.; Fan, X.; Zhao, M. Visualized Study on a New Preformed Particle Gels (PPG)+ Polymer System to Enhance Oil Recovery by Oil Saturation Monitoring Online Flooding Experiment. Gels 2023, 9, 81. [Google Scholar] [CrossRef] [PubMed]
  12. Pi, Y.; Su, Z.; Cao, R.; Li, B.; Liu, J.; Fan, X.; Zhao, M. Experimental Study on Enhanced Oil Recovery of PPG/ASP Heterogeneous System after Polymer Flooding. Gels 2023, 9, 427. [Google Scholar] [CrossRef] [PubMed]
  13. Yiqiang, L.; Xinguang, S.; Binhui, L. Experimental research in laboratory on improving oil recovery after polymer flooding. Acta Pet. Sin. 2008, 29, 405. [Google Scholar]
  14. Alhuraishawy, A.K.; Sun, X.; Bai, B.; Wei, M.; Imqam, A. Areal sweep efficiency improvement by integrating preformed particle gel and low salinity water flooding in fractured reservoirs. Fuel 2018, 221, 380–392. [Google Scholar] [CrossRef]
  15. Gao, Q.; Zhong, C.; Han, P.; Cao, R.; Jiang, G. Synergistic effect of alkali–surfactant–polymer and preformed particle gel on profile control after polymer flooding in heterogeneous reservoirs. Energy Fuels 2020, 34, 15957–15968. [Google Scholar] [CrossRef]
  16. Wang, C.; Zhong, L.; Liu, Y.; Han, Y.; Zhao, P.; Yuan, Y.; Han, X. Characteristics of weak-gel flooding and its application in LD10-1 oilfield. ACS Omega 2020, 5, 24935–24945. [Google Scholar] [CrossRef]
  17. Bian, Y.; Penny, G. Surfactant formulation evaluation for carbon dioxide foam flooding in heterogeneous sandstone reservoirs. In Proceedings of the SPE Improved Oil Recovery Conference, Tulsa, OK, USA, 14–18 April 2012; p. SPE-154018-MS. [Google Scholar]
  18. Wang, L.; Li, S.; Cao, R.; Han, P.; Yan, W.; Sun, G.; Xia, H.; Xu, T. Microscopic plugging adjustment mechanism in a novel heterogeneous combined flooding system. Energy Rep. 2022, 8, 15350–15364. [Google Scholar] [CrossRef]
  19. Wang, L.; Long, Y.; Ding, H.; Geng, J.; Bai, B. Mechanically robust re-crosslinkable polymeric hydrogels for water management of void space conduits containing reservoirs. Chem. Eng. J. 2017, 317, 952–960. [Google Scholar] [CrossRef]
  20. Dong, L.; Yue, X.a.; Su, Q.; Qin, W.; Song, W.; Zhang, D.; Zhang, Y. Study on the plugging ability of polymer gel particle for the profile control in reservoir. J. Dispers. Sci. Technol. 2016, 37, 34–40. [Google Scholar] [CrossRef]
Figure 1. Schematic diagram of the molecular structure of PPG.
Processes 11 02865 g001
Figure 2. Comparison of PPG before and after expansion. (a) PPG before expansion and (b) PPG after expansion.
Processes 11 02865 g002
Figure 3. Core models, (a) long core model, and (b) oil displacement experimental model.
Processes 11 02865 g003
Figure 4. Oil–water relative permeability curves before and after polymer flooding. (a) The permeability is 500 × 10−3 μm2, (b) the permeability is 1000 × 10−3 μm2, and (c) the permeability is 4000 × 10−3 μm2.
Processes 11 02865 g004
Figure 5. Viscosity and expansion rate change. (a) Viscosity changes of different systems and (b) PPG expansion rate change.
Processes 11 02865 g005
Figure 6. Injection pressure of cores with different permeability.
Processes 11 02865 g006
Figure 7. Pressure curve at each point: (a) polymer flooding and (b) heterogeneous flooding.
Processes 11 02865 g007
Figure 8. Flow rate curves under different permeability ratios. (a) The core permeability ratio is two, (b) the core permeability ratio is four, and (c) the core permeability ratio is ten.
Processes 11 02865 g008
Figure 9. Flow rate curves at different concentrations. (a) The amount of PPG is 500 mg/L and (b) the amount of PPG is 600 mg/L.
Processes 11 02865 g009
Figure 10. Flow rate curves under different injection volumes. (a) The injection volume is 0.3 PV and (b) the injection volume is 0.7 PV.
Processes 11 02865 g010
Figure 11. Production curves.
Processes 11 02865 g011
Figure 12. Oil saturation distributions (a) before injection of the heterogeneous system in layer with high permeability, (b) after injection of the heterogeneous system in layer with high permeability, (c) before injection of the heterogeneous system in the middle permeable layer, (d) after injection of the heterogeneous system in the middle permeable layer, (e) before injection of the heterogeneous system in layer with low permeability, and (f) after injection of the heterogeneous system in layer with low permeability.
Processes 11 02865 g012aProcesses 11 02865 g012b
Table 1. Composition of simulated formation water.
Ionic CompositionNa+Mg2+Ca2+K+HCO3SO42−Cl
Concentration (mg/L)2183.2852.4023.0610.462054.39286.672167.72
Table 2. Core parameters of physical experiment models.
TypeLength × Diameter (mm) or
Length × Width × Thickness (mm)
Permeability (×10−3 µm2)Porosity (%)
Oil–water relative permeability change experiment models100 × 2540023.05
100 × 25100025.72
100 × 25400029.36
Injection experimental models100 × 2540022.47
100 × 25100025.03
100 × 25400028.96
100 × 25800031.50
Flow experimental model1000 × 45 × 45400031.88
Profile control experimental models300 × 45 × 4540022.60
300 × 45 × 45100025.21
300 × 45 × 45400029.26
300 × 45 × 45800031.74
Oil displacement experimental models300 × 300 × 1540022.39
300 × 300 × 15100025.44
300 × 300 × 154000 (Containing 8000)30.23
Table 3. Experimental schemes.
SchemeMean Permeability (K)
×10−3 μm2
Permeability RatioConcentration
mg/L
Injection Volume
PV
1800024000.5
4000
2400044000.5
1000
34000104000.5
400
4400045000.5
1000
5400046000.5
1000
6400044000.3
1000
7400044000.7
1000
Table 4. Plugging performance of different systems.
SystemResistance CoefficientResidual Resistance CoefficientPlugging Rate (%)
Polymer28.664.3015.60
Heterogeneous system114.2221.2088.47
Disclaimer/Publisher’s Note: The statements, opinions and data contained in all publications are solely those of the individual author(s) and contributor(s) and not of MDPI and/or the editor(s). MDPI and/or the editor(s) disclaim responsibility for any injury to people or property resulting from any ideas, methods, instructions or products referred to in the content.

