

The Relationship between Rehydration Time and Tenderness at Different Rehydrating Water Temperatures in Freeze-Dried Pork Loin


1
Institute of Nutritional Science, Faculty of Agricultural and Food Sciences and Environmental Management, University of Debrecen, 4032 Debrecen, Hungary
2
Doctoral School of Nutritional and Food Sciences, University of Debrecen, 4032 Debrecen, Hungary
3
Institute of Animal Science, Biotechnology and Nature Conservation, Faculty of Agricultural and Food Sciences and Environmental Management, University of Debrecen, 4032 Debrecen, Hungary
*
Author to whom correspondence should be addressed.
Processes 2023, 11(10), 2822; https://doi.org/10.3390/pr11102822
Submission received: 30 August 2023
/
Revised: 19 September 2023
/
Accepted: 22 September 2023
/
Published: 24 September 2023
(This article belongs to the Special Issue New Technologies for the Processing and Assessment of the Quality of Food Products)
Abstract
:Meat tenderness is one of the key factors determining consumer satisfaction and food quality. Freeze drying is a critical aspect of food preservation. Foods produced this way can be stored for an exceedingly long time, but they are characterized by being very hard in texture and requiring rehydration before use. This study presents an investigation focusing on finding preparation parameters of freeze-dried meat that would enable rehydration when left in an environment below 50 °C for 10 min, qualities that are ideal for hikers or soldiers. The meat samples were cooked at both 100 °C and 120 °C, cooled, and freeze-dried. Optical analysis, conducted using a microscope, was conducted to assess tissue damage. A compact and uniform structure was observed in the samples cooked at 120 °C, whereas fractures and gaps were detected on the surfaces of those cooked at 100 °C. Various rehydration durations and temperatures were explored to attain the samples’ original tenderness, as measured using the Warner–Bratzler method, and identify the optimal rehydration conditions. Based on this investigation, it was determined that with proper preparation, the original tenderness can be restored at temperatures below 50 °C within a 10 min rehydration period. It was determined that the recommended rehydration temperature is 40 °C for a 10 min duration.
1. Introduction
Meat tenderness is one of the key factors influencing consumer satisfaction and determining food quality [1,2,3], and it depends on meat texture. Karwacka points out that the texture of food is an important factor influencing its attractiveness to consumers [4]. There are different methods for evaluating meat texture, such as physical methods, chemical methods, enzymatic digestion, histological methods, and sensory methods [5]. Spectroscopy and imaging methods are also suitable [6]. Instrumental methods involve mechanical tests that measure the resistance of meat to a force applied to it and techniques that provide objective information on various structural parameters. Common methods for assessing meat tenderness include shearing, e.g., with Kramer Shear Cell and Warner–Bratzler shear blades. Other tests include tensile tests using dual grips or compression tests using a Texture Profile Analysis (TPA) test, which is a two-bite test. These tests measure meat tenderness as the force or energy required to cut (penetrate), tear, or compress (deform) the meat. Samples must be large enough and well defined. A TPA test simulates biting using one’s mouth. It consists of a two-cycle crush test. The sample should have a smooth, flat surface with a diameter smaller than the flat-faced cylindrical probe employed. This test provides textural parameters such as tenderness (hardness), adhesion, springiness, cohesiveness, chewiness, and gumminess. Tenderness can be measured in an objective way with instruments or sensorily using a consumer panel [7]. Tenderness can be measured using the single-blade shear test of the Warner–Bratzler Shear Force (WBSF). This is the most widely used method worldwide [8]. The WBSF protocol measures the amount of force required to shear entire muscle fibers. The WBSF measurement is an excellent objective method for determining and measuring tenderness [9]. This procedure is suitable for measuring the relationship between the inherent cooking rate and the Warner–Bratzler shear force with respect to cooked pork chops [10]; thus, it is considered suitable for the acquisition of research measurements between rehydration time and WBSF. Tenderness is a variable that depends on many factors, such as the cooking method employed, sample preparation, the shear apparatus used, the measurement procedure employed, and plate type. The Warner–Bratzler blade is a mechanical device that measures maximum shear force with an approximately 1 mm thick “V”-shaped blade. The measured force is then correlated with meat tenderness [11]. This method is suitable for comparing samples with different temperatures and rehydration times but of the same size. The WBSF method has been shown to yield highly repeatable results when the corresponding measurement protocols are followed accurately [12,13,14]. There are many different factors that affect cooked meat tenderness and WBSF measurements. The most important factors are the cooking method employed [15,16], the position of the core [17,18], and the orientation of the muscle fibers, whose assurance, as well as that of the rehydration time and temperature in the case of freeze-dried meat [19], constitutes an excellent method of food preservation. Freeze drying has many beneficial properties, such as endowing a long shelf life via removing moisture and inhibiting the growth of bacteria, yeast, and mold, allowing food to remain edible for longer periods of time, often years or even decades. FD is the most important drying technique in the food industry and has led to rapid development in the 21st century [20]. It preserves the nutritional value of food better than many other preservation methods. It retains the original flavor, color, and most vitamins and minerals, making it a healthier option. It is highly advantageous for weight loss because it removes moisture from products, making it ideal for cost-effective transportation. The sublimation of water results in the creation of a highly porous structure, thus allowing immediate rehydration [21,22]. Freeze drying is a unit operation primarily focusing on the removal of solvents from a liquid formulation. During this process, the formulation is first frozen, and then the frozen solvent is removed via sublimation under reduced pressure. This is followed by a desorption phase in which the remaining unfrozen solvent is removed. As a result, a complete lyophilization process includes two equally important phases: (1) freezing, during which a substantial portion of the solvent, approximately up to 95% [23], is converted into a frozen solid, and (2) drying, during which almost all of the solvent (both frozen and unfrozen) is extracted from the formulation. The drying process can be further divided into two steps depending on the mechanism involved: sublimation (primary drying) and desorption (secondary drying). There are three stages in the freeze-drying process: sublimation, primary drying, and secondary drying. The balance between heat input and process speed is important. If the heat applied in the process is not high enough, sublimation will be slow. If it is too high, heat will accumulate, resulting in an undesirable increase in product temperature [24]. The rehydrated, ready-to-eat food is expected to regain the properties of the original product. Both thermally processed and freeze-dried foods exhibit changes in quality. Food quality can be characterized by three main factors. These are nutritional, physical, and chemical properties [25]. In general, the drying process can affect color, odor, rehydration properties, flow properties, water activity, and the retention of nutrients and volatile compounds [26]. During FD, the most significant damage is caused by oxidation. Polyphenol oxidase, which is present in plant raw materials, is susceptible to enzymatic degradation due to its activity [27]. The carotenes present are also polyunsaturated compounds with a strong tendency toward oxidation, which is considered autocatalytic. This process can be controlled by the use of antioxidants [28]. During various palatability tests of freeze-dried foods, participants have generally described their oral impressions of meat-based rehydrated foods as “chewy”, “fibrous”, and “stringy”, indicating inadequate texture characteristics. They have also used terms such as “watery or mushy” and “dry, but oozing juice”, indicating inadequate rehydration characteristics. [29]. Textural changes are caused by the following events in the actomyosin complex: the denaturation of proteins; the aggregation or cross-linking of proteins followed by aggregation; and the interaction of the native or denatured proteins with carbohydrates or fats [30]. Elif Aykın and Mustafa Erbaş investigated the quality characteristics and rehydration behavior of freeze-dried and dehydrated bovine muscle. They reported measuring 31.19 ± 0.87 and 31.36 ± 0.65 of shear force in approximately 1 cm cubes using a Warner–Bratzler blade [31]. FD food is suitable for long-life, ready-to-eat applications such as hiking food or military rations (Meals Ready to Eat, MRE) due to its light weight, very low moisture content, and fast-food-amenable character. An important quality feature in this regard is the texture of a product, particularly how effectively tenderness can be restored after rehydration. This aspect can also be perceived by customers [32]. However, it is important to mention that FD has the largest estimated carbon footprint of all drying technologies and processes [4], but according to a very recent study, it is a suitable method for reducing the amount of food waste because, according to data from the Food and Agriculture Organization of the United Nations (FAO), as much as 1/3 of the food produced annually worldwide is lost or wasted [33].
The aim of this study was to optimize the preparation and rehydration conditions of the raw material for rehydration at low temperatures in the shortest time. According to our hypothesis, with the right raw materials and proper preparation, rehydration with hot water can be avoided, which means that an increase in usability can be achieved while saving energy and time.
2. Materials and Methods
2.1. Preparing Samples
The samples were obtained from chilled and vacuum-packed pork loin (longissimus thoracis), and the sample acquisition procedure was repeated three times. The meat was purchased commercially in Hungary. The pork loin was sourced from Spain (ES-10.3950/L CE) and Hungary (HU 1360 EK; HU 510 EK). Meat from various sources was used to ensure that our results were not only true for a single source but were also generally valid and applicable, despite the differences arising from geographical variability. For each sample, 8 days had passed since slaughter, after which the samples were stored at 0–4 °C in vacuum packs. The weight of the pork loins was between 2.9 and 3.2 kg. After opening the vacuum packs, the pieces of pork loin were chopped cross-sectionally using a stainless-steel knife into 5 cm wide slices and cooked in tap water in a pressure cooker (BONQUET 7L). The cooking water in each case did not contain added salt or any other added material. The control samples were made in a pot at atmospheric pressure and in a cooker. An induction plate (ZANUSSI ZEI6640XBA, Europe Group Companies, Electrolux Home Products, France) was used for heating throughout the procedure. The temperature of the tap water was 20 °C. For atmospheric cooking, the heating time was 15 min (to reach the boiling point), and the cooking time was 145 min from the boiling point in each case. For the cooker method, the heating phase was 25 min, and the boiling phase was always 60 min. The temperature at which the samples were considered cooked was 120 °C. After cooking, the samples were cooled for an hour in the water in which they were cooked. Subsequently, the samples were stored in a Whirlpool refrigerator (model: ART 9811/A ++SF, manufactured by Whirlpool Corporation, Pero, Italy) at a temperature of 5 °C for 24 h to ensure complete coverage. After storage, the desired samples were formed. First, they were cut into 1.27 cm (0.5 inches) wide slices from the cooked loin in a direction parallel to the muscle fibers. The slices were further cut into 1.27 cm (0.5 inch) wide and 4 cm long rectangular prisms. To cut the samples to size, a self-made cutting board was used. Cuts were made using a stainless-steel knife. Sample size was uniformly 1.27 × 1.27 × 4 cm, and the cutting surfaces of the cubes were shaped so that the meat fibers were perpendicular to the surface of the meat cube, as recommended by the American Meat Science Association [7]. The samples were stored in a refrigerator (WHIRLPOOL ART 9811/A ++SF, Whirlpool Corporation, Pero, Italy) at 5 °C for 12 h. The samples were transported to laboratory facilities over 3 h in cooler bags at 5 °C. Temperature was checked using a cooler thermometer. Dry paper towels were used to remove residual moisture. The samples were placed in a plastic tray and prepared using the institute-owned freeze-drier developed by the University of Debrecen. The temperature of the samples at the beginning of the treatment was +4 °C. The pressure in the vacuum chamber was 0.01 Atm, and the condensing chamber temperature was −40 °C. The chamber trays were heated. The temperature of the samples was measured during treatment using a built-in core thermometer. The end point of the procedure was until 42 °C reached, but a minimum of 24 h of treatment was ensured. These parameters were sufficient for removing all moisture and performing the post-drying operation [25]. At the end of the procedure, the products were immediately vacuum-packed at −1 bar pressure into plastic bags using a vacuum-packing machine (MAXIMA MVAC 300, Maxima Holland Spangenberg International B.V., Mijdrecht, Utrecht, The Netherlands). Control samples were prepared to compare the results with the original condition without freeze-drying and to assess the extent to which the original condition could be restored via the parameters and sample preparation method used. The control samples were prepared from the same meat material at the same time as the test samples. The cooking temperatures differed. In the case of C1, the cooking temperature was 100 °C, modeling the normal environment, and in the case of C2, the cooking temperature was 120 °C, modeling industrial conditions. The temperature of C1 and C2 samples was set at 80 °C, modeling freshly prepared and served food. The C3 samples were heated separately with warm water for measurements (50 °C; 40 °C) and evaluated separately. The C3 40 °C control sample was used for measurements at 30 °C. The samples were stored in a refrigerator until the start of the measurements and then heated to the measurement temperature in warm water.
2.2. Surface Analysis
A surface analysis was carried out with a microscope to determine how the different methods of sample preparation affected the structure of the meat to determine if possible muscle fiber fractures or injuries occurred. Photographs were immediately taken in a dry state following FD treatment. Microscopic examinations were performed using a 20×–1280× microscope (BRESSER BIOLUX NV, Bresser GmbH, Rhede, Germany) with 40× magnification and an HD USB camera connection (BESSER, Bresser GmbH, Rhede, Germany). CamLabLite_2.1.20016 software (BESSER, Bresser GmbH, Rhede, Germany) was utilized for capturing photos.
2.3. Texture Analysis
Shear force was determined on each sample of loin after rehydration as follows. After two hours, the freeze-dried meat cubes were removed from the vacuum packaging and rehydrated in a water bath at different temperatures. The rehydration water temperatures were 30 °C, 40 °C, and 50 °C, and the rehydration times were 2; 4; 6; 8; and 10 ± 0.5 min. The designation of rehydration times was determined according to the requirements of the United States Defense Logistics Agency, The Nation’s Combat Logistics Support Agency. It stipulates that the preparation time of dehydrated foods for soldiers is from 5 to 12 min [34]. Tap water was employed for conducting rehydration tests. Randomly selected samples were removed from the water, and their shear force was promptly measured. This process was repeated 5 to 8 times. Meat tenderness was measured as maximum shear force. The prepared samples were examined using Warner–Bratzler Blade shear force attachment (V-notch blade 60°) at a 2.0 mm/s blade speed that was connected to a TAXT Plus texture analyzer (Stable Micro Systems Ltd., Godalming, UK).
2.4. Statistical Analysis
The relationship between rehydrating time and tenderness at different rehydrating water temperatures was determined for each sample using linear modelling in the RStudio software environment [35]. The model is outlined below:
Model 1. Tenderness = rehydrating water temperature + rehydrating temperature
Degradation: origin of sample, date of purchase
y = m x + c
The results were converted from g to N with 0.00980665. To evaluate data, statistical analysis was performed using descriptive statistical methods, i.e., two-sample t-tests. Also, regression calculations were performed. Statistical analysis of data was performed using RStudio, R version 4.0.4 (15 February 2021).
3. Results
3.1. Surface Analysis
After freeze drying, optical analysis was carried out using a microscope.
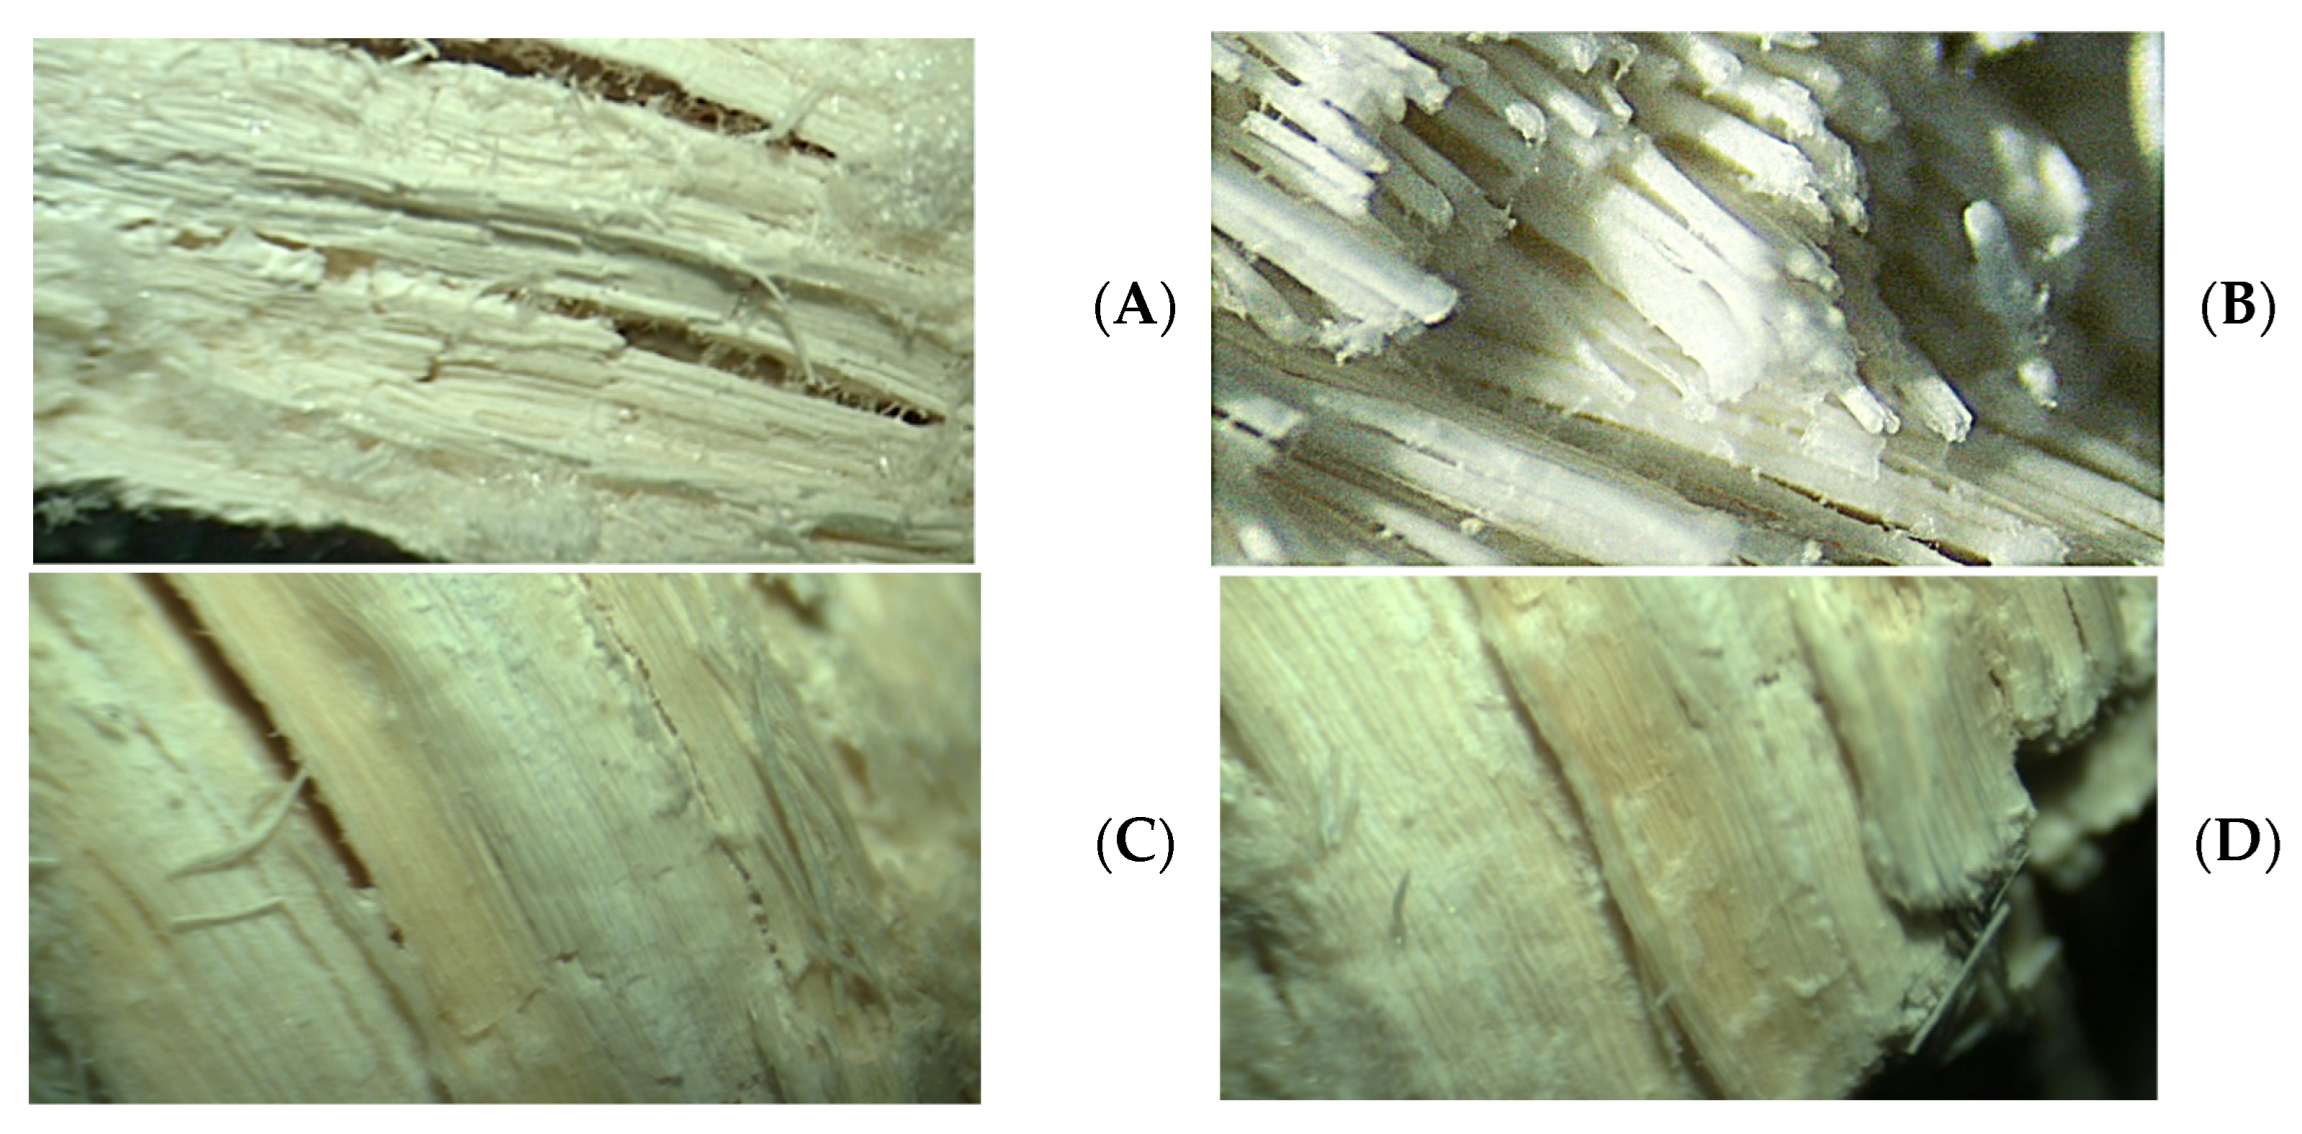
Microscopic photos of the cooked meat at 100 °C are presented in Figure 1A,B, and microscopic photos of the cooked meat at 120 °C are presented in Figure 1C,D.
Based on the microscopic images, it can be stated that the samples cooked in the oven have a more compact and uniform structure. The muscle fibers were located close to each other, and no fragmentation or damage could be observed on their surfaces. In the case of the pork cooked at normal atmospheric pressure, the structure was not as orderly as it had been. Fractures and gaps can be observed on the surfaces of the samples. The directions of the fibers in relation to each other are different and deviate.
3.2. Texture Analysis
The data regarding the maximal shear force of the samples and the effects of cooking parameters, rehydration time, and temperature are shown in Table 1. The value-magnitude of the coefficient of variations is the same as the value reported in other WBSF measurements, so it can be considered acceptable [36,37,38].
Our measurement results are summarized in the figures below. The results of the tests carried out at 50 °C and the regression plot between rehydration time and shear force are shown in Figure 2.
The results of tests carried out at 40 °C and the regression plot between rehydration time and shear force are shown in Figure 3.
Due to the high number of coefficients of variation, further statistical calculations were performed in order to examine this regression between rehydration time and maximum shear force. During the data analysis, only the results of measurements taken at 40 °C were considered and analyzed. Measurements made at 30 °C and 50 °C were not analyzed. For analysis, a two-sample t-test was performed (Table 2).
Based on the findings of the two-sample t-test (p = 0.05), it is obvious that the results for 4–6, 6–8, and 8–10 min do not show a significant difference, yet there was a significant difference between the results of the 4 and 10 min measurements, despite the large standard deviation. As a result, the decision was made to conduct regression analysis. During the regression study, the average of the results for the time units (4, 6, 8, and 10) was calculated.
The best results were achieved when rehydrating at 40 °C. Regarding the force required for shearing, smaller values were measured compared to the control samples measured at 40 °C. During rehydration at this temperature, the shear force values of the control samples prepared at 80 °C were achieved in 10 min. A gradually decreasing trend can be observed in the case of measurements starting at 4 min (Figure 3). Regression analysis was performed using the average results of the measurements for 4–10 min. It was determined that the level of regression was very high, the multiple R-squared was 0.976, and the adjusted R-squared was 0.964 at 40 °C (p-value: 0.0121), indicating the strong time dependency of structural changes.
Equation of Straight line (mean) y = −5.406x + 106.65
Considering the high variance in the results, the median of the samples was calculated, as shown below:
Equation of Straight line (median) line y = −3.5411x + 91.638; R2 = 0.8558
A linear relationship was detected between the variables.
Furthermore, during the rehydration process conducted at 40 °C, the same tenderness as the C1, C2, and C3 control samples was achieved.
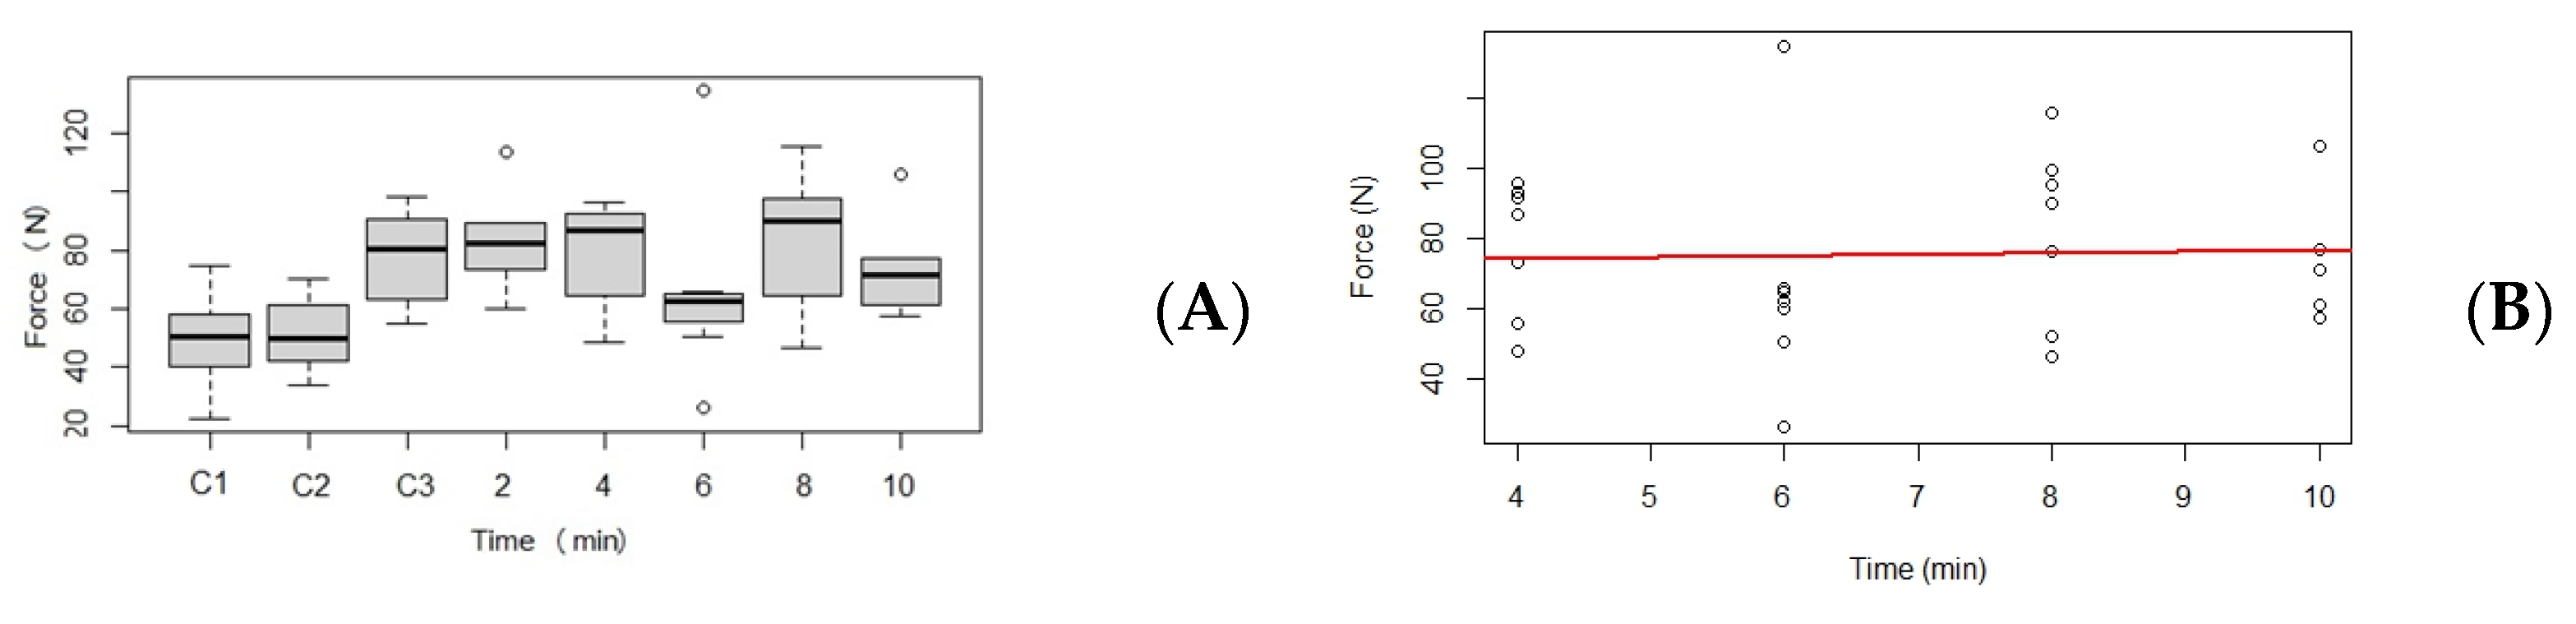
Figure 4 presents the results of the tests carried out at 30 °C and the regression plot between rehydration time and shear force.
During the tests performed at a rewetting temperature of 30 °C, it was not possible to reach the values measured in the case of the control samples at 80 °C. In this case, the largest deviation values and the largest outliers were observed. The regression analysis conducted at this stage showed the weakest regression. The multiple R-squared value was 0.0141 (p-value: 0.882). It was not possible to detect a linear relationship between the variables.
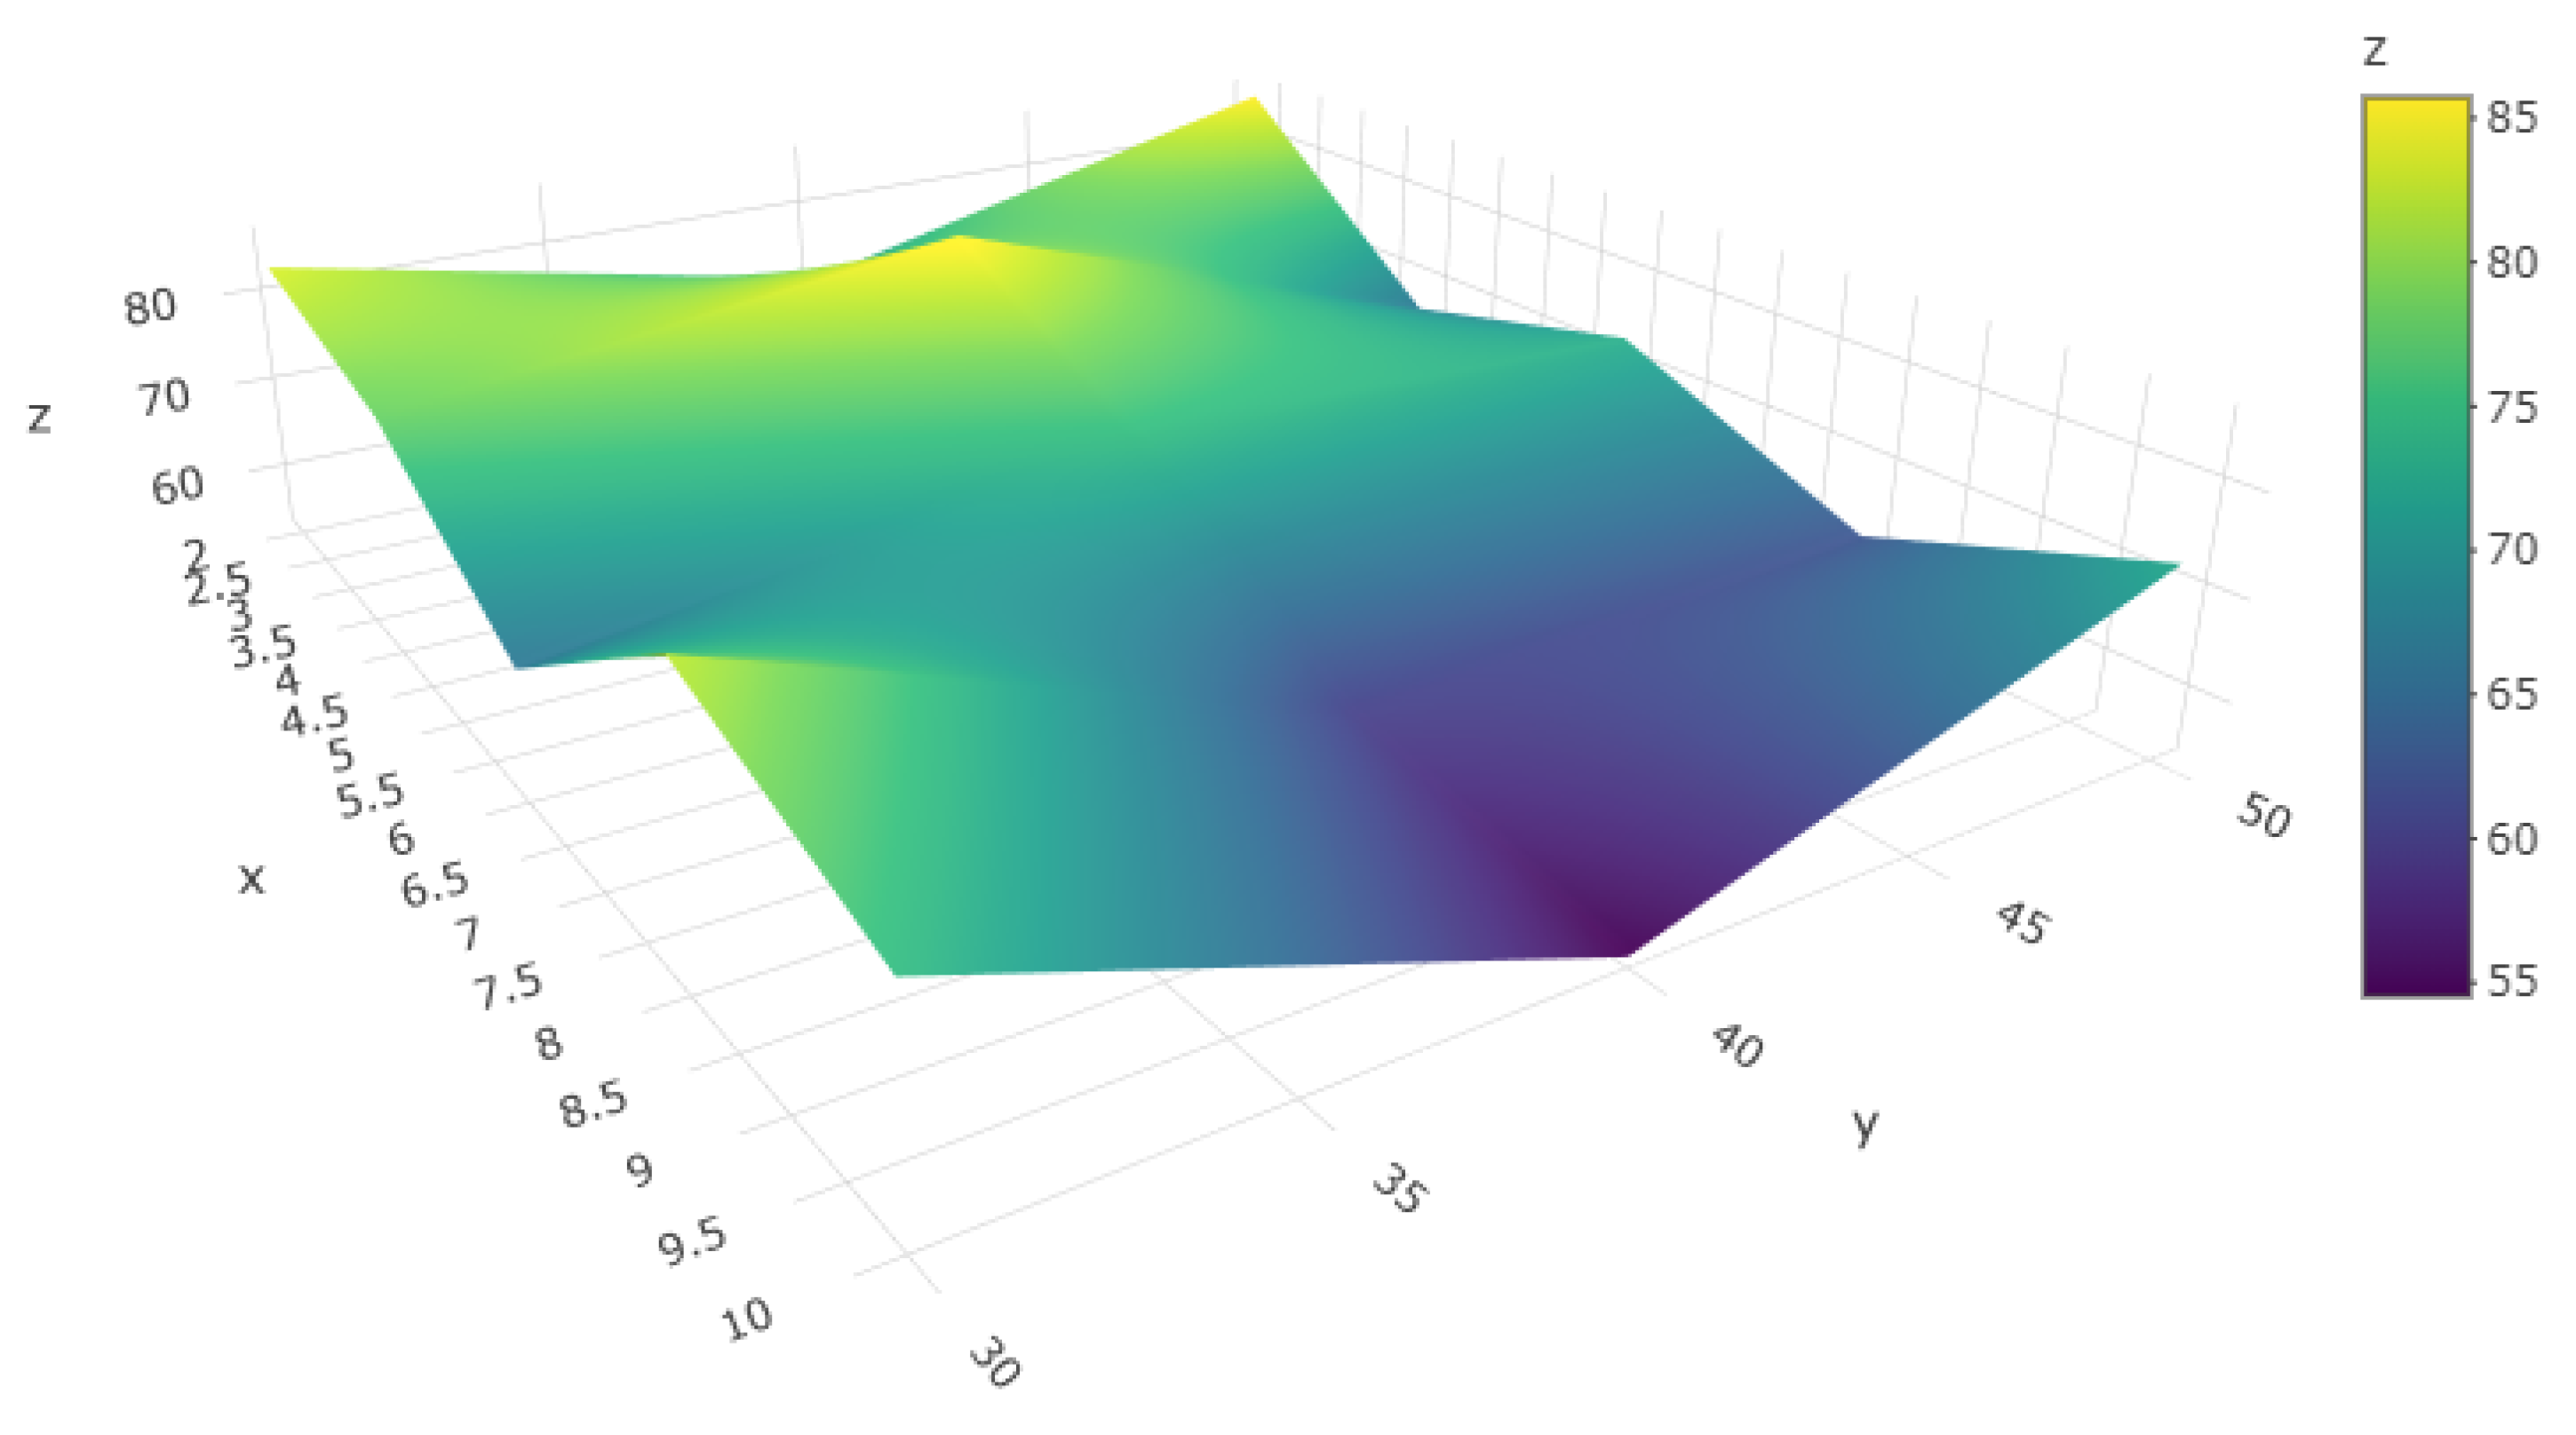
The averages of the WBSF measurement results are shown in Figure 5.
4. Discussion
There are relatively few studies on the rehydration of frozen meat and meat products conducted either at low temperatures with long rehydration times [39,40,41] or at very high temperatures [42], and the rehydration recommendations for commercially available products are similar. Alina Surmacka Szcześniak conducted excellent comparative studies on beef chops at 26 °C and 82 °C under different rehydration conditions [43], but her tests did not include intermediate temperature values. The uniform structure seen in our surface analysis images is identical to the uniform structure presented in the microscopic images from her research. Our measurement result at 30 °C was also confirmed by the results of the tests at 26 °C, according to which there is no significant difference and no correlation during rehydration at low temperature, but it is important to highlight the differences in the origin of the meat. If the stock remains tough, proper rehydration will not happen over time. Our results are in line with those reported by the food scientist Alina Surmacka Szcześniak and offer the opportunity to fully map rehydration.
Marabi et al. evaluated rehydration results using the Weibull distribution model and concluded that capillarity controls mass transfer for products with high porosity (i.e., freeze-dried ones), whereas for products with low porosity (those that are air-dried), diffusion predominates. In our view, the glass transition should be taken into account when establishing rehydration conditions [44]. The glass transition is a well-known change in the state of amorphous materials. It is a reversible transformation of the solid- and liquid-like states of supercooled liquids. The glass transition occurs within a temperature range present during the cooling of a material resembling a liquid, resulting in its solidification into a glassy substance (vitrification) [45]. According to Khalloufi et al.’s study, if the temperature of the process is higher than the glass-transition temperature of the material at its particular moisture content, the risk of collapse (i.e., deformation, pore reduction, etc.) is greatly increased [46]. Based on the foregoing discussion, a special balance should be established through the capillaries so that the rehydrating fluid flows at the proper rate toward the interior of the product to ensure that the capillaries are not blocked due to the saturation of the outer layers. Taking these aspects into account, it can be estimated that raising the water bath temperature above the glass-transition temperature of freeze-dried solids can induce a sudden structural collapse, resulting in reduced product porosity. This not only results in lower water absorption at higher temperatures but also causes a decrease in the rehydration rate and can shift the control of mass transfer from capillarity to diffusion. Increasing the temperature at various levels above the glass transition temperature can further induce varying degrees of collapse. Based on the results of tests carried out at 40 °C, this temperature is below the glass-transition temperature of pork loin and is sufficient for rehydration to occur evenly, and it provides a sufficient enthalpy of moisturizing fluid for carrying out rehydration.
5. Conclusions
During our research, we found a very strong regression between the time required for rehydration and the shear forces associated with units of time at 40 °C, for which the multiple R-squared value was 0.976 (p-value: 0.0121), indicating optimal and balanced conditions between the rehydration and the structure of frozen dried pork loin. By preparing the meat as described and using appropriate rehydration conditions, we were able to obtain a tenderness of the control samples (C1; C2; C3) identical to the product’s original consistency.
We have confirmed our hypothesis that with the right raw material and proper preparation, rehydration with hot or boiling water can be avoided within a short period. This means that an increase in usability can be achieved while saving energy and time.
Author Contributions
Conceptualization, Z.R. and Z.G.; methodology, Z.R. and P.S.; software, Z.R. and P.S.; validation, J.P., Z.G. and P.S.; formal analysis, Z.R.; investigation, Z.R. and P.S.; resources, J.P.; data curation, Z.R.; writing—original draft preparation, Z.R.; writing—review and editing, J.P., Z.G. and P.S.; visualization, Z.R.; supervision, Z.G.; project administration, Z.R.; funding acquisition, Z.G.Y. All authors have read and agreed to the published version of the manuscript.
Funding
This work was supported by the Doctoral School of Nutritional and Food Sciences, University of Debrecen (grant number No. 1C00BMX4MUKO/320).
Data Availability Statement
The data that support the findings of this study are available on request from the corresponding author ([email protected]; [email protected]).
Conflicts of Interest
The authors declare no conflict of interest. The funders had no role in the design of the study; in the collection, analyses, or interpretation of data; in the writing of the manuscript; or in the decision to publish the results.
References
- Maltin, C.; Balcerzak, D.; Tilley, R.; Delday, M. Determinants of meat quality: Tenderness. Proc. Nutr. Soc. 2003, 62, 337–347. [Google Scholar] [CrossRef] [PubMed]
- Sørheim, O.; Idland, J.; Halvorsen, E.C.; Frøystein, T.; Lea, P.; Hildrum, K.I. Influence of beef carcass stretching and chilling rate on tenderness of m. longissimus dorsi. Meat Sci. 2001, 57, 79–85. [Google Scholar] [CrossRef]
- Tornberg, E. Biophysical aspects of meat tenderness. Meat Sci. 1996, 43, 175–191. [Google Scholar] [CrossRef]
- Karwacka, M.; Ciurzyńska, A.; Galus, S.; Janowicz, M. Freeze-dried snacks obtained from frozen vegetable by-products and apple pomace—Selected properties, energy consumption and carbon footprint. Innov. Food Sci. Emerg. Technol. 2022, 77, 102949. [Google Scholar] [CrossRef]
- Szcześniak, A.S.; Torgeson, K.W. Methods of meat texture measurement viewed from the background of factors affecting tenderness. Adv. Food Res. 1965, 14, 33–165. [Google Scholar] [CrossRef] [PubMed]
- Floor, K.G.; Schreuders; Schlangen, M.; Kyriakopoulou, K.; Boom, R.M.; Jan van der Goot, A. Texture methods for evaluating meat and meat analogue structures. Food Control. 2021, 127, 108103. [Google Scholar] [CrossRef]
- AMSA. Research Guidelines for Cookery, Sensory Evaluation, and Instrumental Tenderness Measurements of Meat, 2nd ed.; American Meat Science Association: Champaign, IL, USA, 2015. [Google Scholar]
- Wheeler, T.L.; Koohmaraie, M.; Cundiff, L.V.; Dikeman, M.E. Effects of cooking and shearing methodology on variation in warner-bratzler shear force values in beef. J. Anim. Sci. 1994, 72, 2325–2330. [Google Scholar] [CrossRef] [PubMed]
- Boccard, R.; Buchter, L.; Casteels, E.; Cosentino, E.; Dransfield, E.; Hood, D.E.; Joseph, R.L.; Macdougall, D.B.; Rhodes, D.N.; Schön, I.; et al. Procedures for Measuring Meat Quality Characteristics in Beef Production Experiments; Report of a Working Group in the Commission of the European Communities’ (cec), Beef Production Research Programme; Livestock Production Science Elsevier Scientific Publishing Company: Amsterdam, The Netherlands, 1981; Volume 8, pp. 385–397. [Google Scholar] [CrossRef]
- Nethery, T.N.; Boler, D.D.; Harsh, B.N.; Dilger, A.C. Relationship between Inherent Cooking Rate and Warner-Bratzler Shear Force of Pork Chops Cooked to Two Degrees of Doneness. Foods 2022, 11, 131. [Google Scholar] [CrossRef]
- Møller, A.J. Analysis of warner-bratzler shear pattern with regard to myofibrillar and connective tissue components of tenderness. Meat Sci. 1981, 5, 247–260. [Google Scholar] [CrossRef]
- Mckenna, D.R.; King, D.A.; Savell, J.W. Comparison of clam-shell cookers and electric broilers and their effects on cooking traits and repeatability of warner-bratzler shear force values. Meat Sci. 2004, 66, 225–229. [Google Scholar] [CrossRef]
- Wheeler, T.L.; Shackelford, S.D.; Koohmaraie, M. Sampling, cooking, and coring effects on warner-bratzler shear force values in beef. J. Anim. Sci. 1996, 74, 1553–1562. [Google Scholar] [CrossRef]
- Wheeler, T.L.; Shackelford, S.D.; Johnson, L.P.; Miller, M.F.; Miller, R.K.; Koohmaraie, M. A comparison of warner-bratzler shear force assessment within and among institutions. J. Anim. Sci. 1997, 75, 2423–2432. [Google Scholar] [CrossRef] [PubMed]
- Apple, J.K.; Rakes, L.K.; Watson, H.B. Cooking and shearing methodology effects on warner-bratzler shear force values of pork. J. Muscle Foods 1999, 10, 269–277. [Google Scholar] [CrossRef]
- Kerth, C.R.; Blair-Kerth, L.K.; Jones, W.R. Warner-bratzler shear force repeatability in beef longissimus steaks cooked with a convection oven, broiler, or clam-shell grill. J. Food Sci. 2003, 68, 668–669. [Google Scholar] [CrossRef]
- Crouse, J.D.; Theer, L.K.; Seideman, S.C. The measurement of shear force by core location in longissimus dorsi beef steaks from four tenderness groups1. J. Food Qual. 1989, 11, 341–347. [Google Scholar] [CrossRef]
- Jeremiah, L.E.; Murray, A.C. The influence of anatomical location within the longissimus dorsi muscle on overall tenderness and on the concentration and solubility of intramuscular collagen. Can. J. Anim. Sci. 1984, 64, 1045–1047. [Google Scholar] [CrossRef]
- Francis, S.J.; Allen, D.M.; Kastner, C.L.; De Felicio, P.E. The effect of coring method on beef longissimus muscle shear force values. J. Anim. Sci. 1981, 52, 1294–1297. [Google Scholar] [CrossRef]
- Adams, G. The principles of freeze-drying. Methods Mol. Biol. 2007, 368, 15–38. [Google Scholar] [CrossRef] [PubMed]
- Jia, Y.; Khalifa, I.; Hu, L.; Zhu, W.; Li, J.; Li, K.; Li, C. Influence of three different drying techniques on persimmon chips’ characteristics: A comparison study among hot-air, combined hot-air-microwave, and vacuum-freeze drying techniques. Food Bioprod. Process. 2019, 118, 67–76. [Google Scholar] [CrossRef]
- Meda, L.; Ratti, C. Rehydration of freeze-dried strawberries at varying temperatures. J. Food Process Eng. 2005, 28, 233–246. [Google Scholar] [CrossRef]
- Tang, X.; Pikal, M.J. Design of freeze-drying processes for pharmaceuticals: Practical advice. Pharm. Res. 2004, 21, 191–200. [Google Scholar] [CrossRef] [PubMed]
- Nowak, D.; Jakubczyk, E. The freeze-drying of foods—The characteristic of the process course and the effect of its parameters on the physical properties of food materials. Foods 2020, 9, 1488. [Google Scholar] [CrossRef] [PubMed]
- Ratti, C. 3-Freeze drying for food powder production. In Handbook of Food Powders; Woodhead Publishing Series in Food Science, Technology and Nutrition; Bhandari, B., Bansal, N., Zhang, M., Schuck, P., Eds.; Woodhead Publishing Witney: Oxford, UK, 2013; pp. 57–84. [Google Scholar] [CrossRef]
- Sablani, S.S. Drying of fruits and vegetables: Retention of nutritional/functional quality. Dry. Technol. 2006, 24, 123–135. [Google Scholar] [CrossRef]
- Mayer, A.M.; Harel, E. Polyphenol oxidases in plants. Phytochemistry 1979, 18, 193–215. [Google Scholar] [CrossRef]
- Bonnie, T.P.; Choo, Y. Oxidation and thermal degradation of carotenoids. J. Oil Palm Res. 1999, 1, 62–78. [Google Scholar]
- Bird, K. Freeze-Dried Foods: Palatability Tests; U.S. Dept. Of Agriculture, Economic Research Service, Marketing Economics Division: Washington, DC, USA, 1963.
- Connell, J.J. Some aspects of the texture of dehydrated fish. J. Sci. Food Agric. 1957, 9, 526–537. [Google Scholar] [CrossRef]
- Aykın, E.; Erbaş, M. Quality properties and adsorption behavior of freeze-dried beef meat from the biceps femoris and semimembranosus muscles. Meat Sci. 2016, 121, 272–277. [Google Scholar] [CrossRef]
- Destefanis, G.; Brugiapaglia, A.; Barge, M.T.; Dal Molin, E. Relationship between beef consumer tenderness perception and warner–bratzler shear force. Meat Sci. 2008, 78, 153–156. [Google Scholar] [CrossRef]
- Nowacka, M.; Mannozzi, C.; Dalla Rosa, M.; Tylewicz, U. Sustainable Approach for Development Dried Snack Based on Actinidia deliciosa Kiwifruit. Appl. Sci. 2023, 13, 2189. [Google Scholar]
- Defense Logistics Agency. The Nation’s Combat Logistics Support Agency. Available online: https://www.dla.mil/Portals/104/Documents/TroopSupport/Subsistence/Rations/pcrs/misc/dehybib/b053b.pdf (accessed on 10 September 2023).
- 2R Core Team. R: A Language and Environment for Statistical Computing. R Foundation for Statistical Computing, Vienna, Austria. 2022. Available online: https://www.R-project.org/ (accessed on 26 February 2023).
- Cama-Moncunill, R.; Cafferky, J.; Augier, C.; Sweeney, T.; Allen, P.; Ferragina, A.; Sullivan, C.; Cromie, A.; Hamill, R.M. Prediction of warner-bratzler shear force, intramuscular fat, drip-loss and cook-loss in beef via raman spectroscopy and chemometrics. Meat Sci. 2020, 167, 108–157. [Google Scholar] [CrossRef]
- Shackelford, S.D.; Wheeler, T.L.; Koohmaraie, M. Evaluation of slice shear force as an objective method of assessing beef longissimus tenderness. J. Anim. Sci. 1999, 77, 2693–2699. [Google Scholar] [CrossRef]
- Wyrwisz, J.; Moczkowska, M.; Kurek, M.A.; Karp, S.; Atanasov, A.G.; Wierzbicka, A. Evaluation of wbsf, color, cooking loss of longissimus lumborum muscle with fiber optic near-infrared spectroscopy (ft-nir), depending on aging time. Molecules 2019, 24, 757. [Google Scholar] [CrossRef]
- Suden, J.R.; Pearson, A.M.; Dugan, L.R., Jr. Rehydration of Freeze-Dried Pork as Related to pH and Protein Denaturation. J. Food Sci. 1964, 29, 192–197. [Google Scholar] [CrossRef]
- Lee, S.; Choi, Y.S.; Jo, K.; Jeong, H.G.; Yong, H.I.; Kim, T.K.; Jung, S. Processing Characteristics of Freeze-Dried Pork Powder for Meat Emulsion Gel. Food Sci. Anim. Resour. 2021, 41, 997–1011. [Google Scholar] [CrossRef]
- Watson, E.L.; Ni, Y.W.; Richards, J.F. Effect of Irradiation and Freezing Rate on Rehydration of Freeze dried Beef. Can. Inst. Food Sci. Technol. J. 1974, 7, 232–235. [Google Scholar] [CrossRef]
- Ayrosa, A.M.I.B.; Pitombo, R.N.D.M. Influence of plate temperature and mode of rehydration on textural parameters of precooked freeze-dried beef. J. Food Process. Preserv. 2003, 27, 173–180. [Google Scholar] [CrossRef]
- Szcześniak, A.S. Effect of mode of rehydration on textural parameters of precooked freeze-dried sliced beef. J. Texture Stud. 1971, 2, 18–30. [Google Scholar] [CrossRef]
- Marabi, A.; Livings, S.; Jacobson, M.; Saguy, I.S. Normalized Weibull distribution for modeling rehydration of food particulates. Eur. Food Res. Technol. 2003, 217, 311–318. [Google Scholar] [CrossRef]
- Roos, Y.H. Glass Transition Temperature and Its Relevance in Food Processing. Ann. Rev. Food Sci. Tech. 2010, 1, 469–496. [Google Scholar] [CrossRef]
- Khalloufi, S.; El-Maslouhi, Y.; Ratti, C. Mathematical model for prediction of glass transition temperature of fruit powders. J. Food Sci. 2000, 65, 842–848. [Google Scholar] [CrossRef]
Figure 1.
(A,B) Microscopic photos at 40× magnification of meat cooked at 100 °C and (C,D) meat cooked at 120 °C.
Figure 1.
(A,B) Microscopic photos at 40× magnification of meat cooked at 100 °C and (C,D) meat cooked at 120 °C.

Figure 2.
(A) Maximum shear force and (B) regression line of the average shear force at 50 °C (C1 = control (100 °C); C2 = control (120 °C); C3 = control (50 °C), the red line is the regression line, the white dots are the amounts of the measurement results)When rehydrating at 50 °C, the average size of the data series was greater than that of the control samples heated to 80 °C. However, no significant variation was observed for the control samples when reheated to 50 °C. Notably, when conducting two-minute measurements, a substantial coefficient of variation was observed (34.6); however, this value decreased as the rehydration time increased. Regarding the regression values, the multiple R-squared regression value was 0.0385 (p-value: 0.804). It was not possible to detect a linear relationship between the variables.
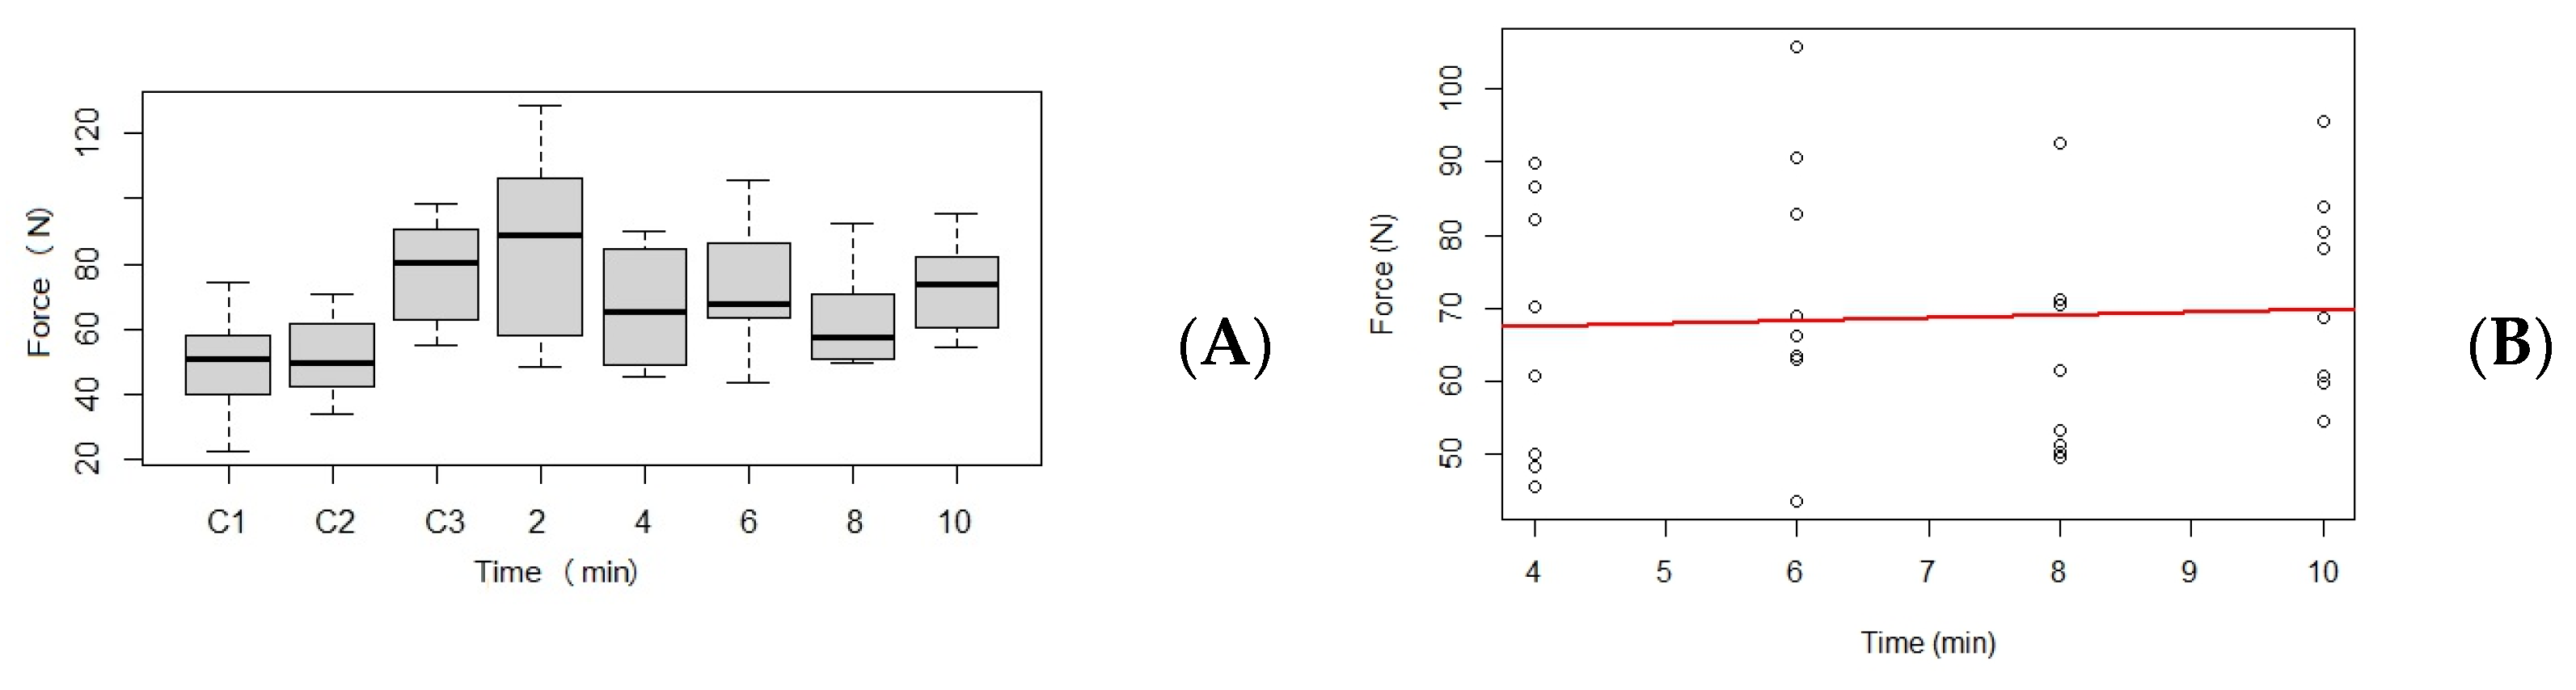
Figure 3.
(A) Maximum shear force and (B) regression line of the average shear force at 40 °C (C1 = control (100 °C); C2 = control (120 °C); C3 = control (40 °C), the red line is the regression line, the white dots are the amounts of the measurement results).
Figure 3.
(A) Maximum shear force and (B) regression line of the average shear force at 40 °C (C1 = control (100 °C); C2 = control (120 °C); C3 = control (40 °C), the red line is the regression line, the white dots are the amounts of the measurement results).
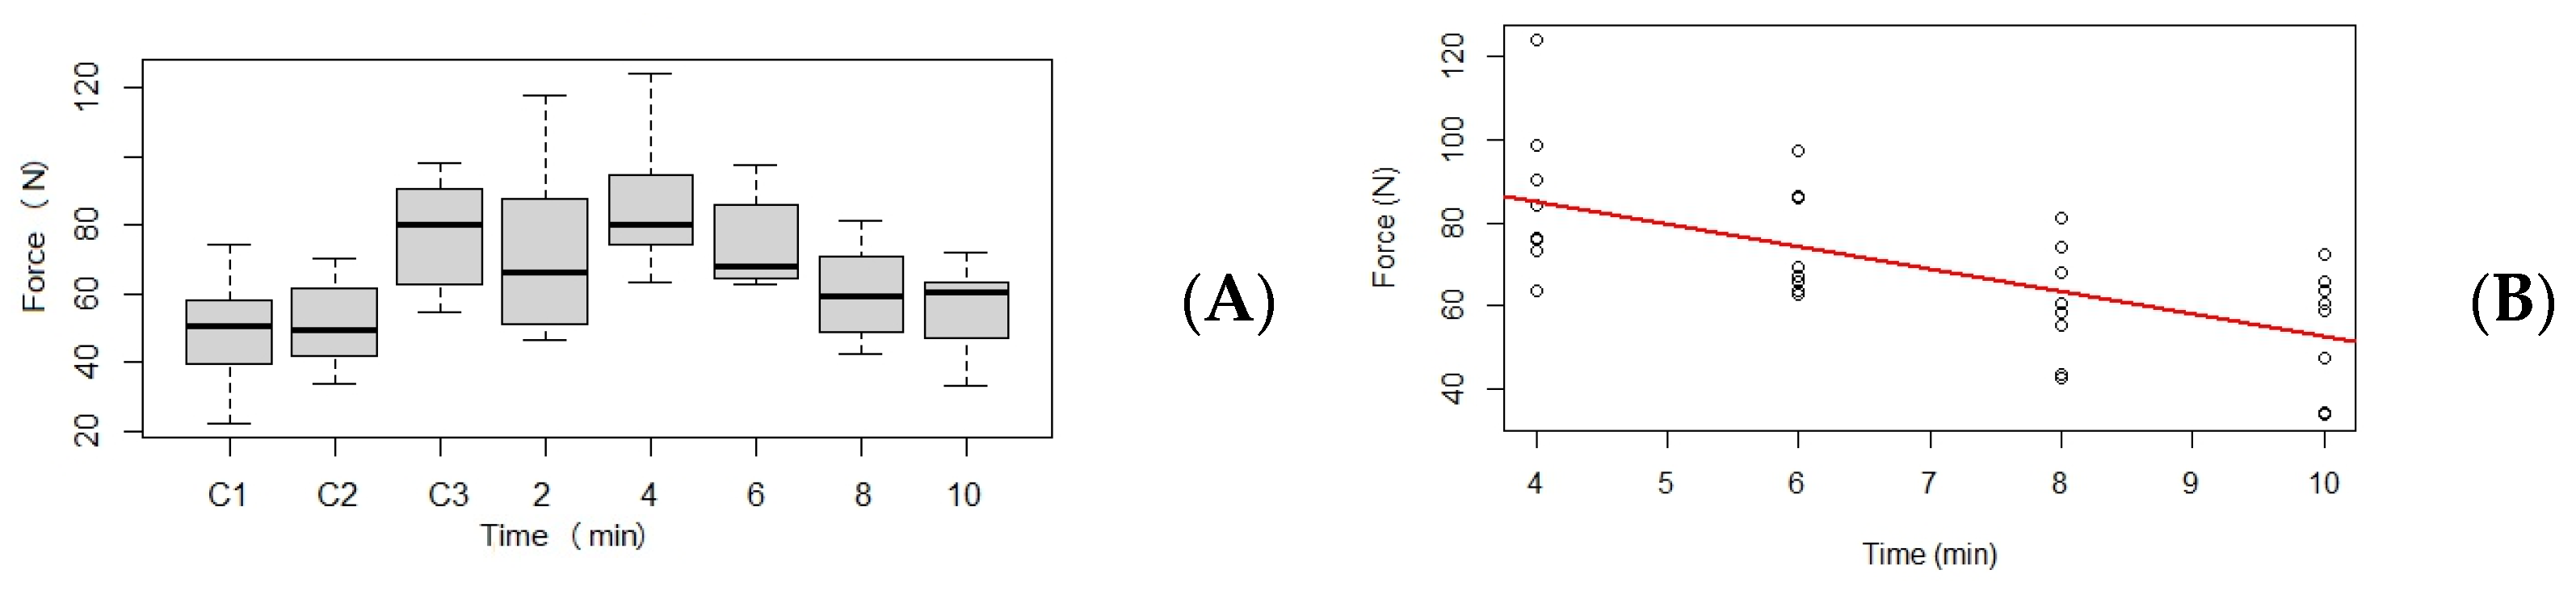
Figure 4.
(A) Maximum shear force and (B) regression line of the average shear force at 50 °C (C1 = control (100 °C); C2 = control (120 °C); C3 = control (50 °C) the red line is the regression line, the white dots are the amounts of the measurement results).
Figure 4.
(A) Maximum shear force and (B) regression line of the average shear force at 50 °C (C1 = control (100 °C); C2 = control (120 °C); C3 = control (50 °C) the red line is the regression line, the white dots are the amounts of the measurement results).

Figure 5.
Surface diagram of the averages of the measurements, where x = time (min), y = rehydration water temperature (°C), and z = WBSF (N).
Figure 5.
Surface diagram of the averages of the measurements, where x = time (min), y = rehydration water temperature (°C), and z = WBSF (N).


Table 1.
Descriptive statistical analysis of maximal shear force (n = 162).
| Cooked Temperature (°C) | Rehydration Water Temperature (°C) | Rehydration Time (min) | Maximum Shear Force Mean ± SD (N) | Maximum Shear Force Coefficient of Variation (N) | Maximum Shear Force Standard Error (N) |
|---|---|---|---|---|---|
| 100 | 80 | Control | 49.8 ± 14.1 | 28.4 | 3.65 |
| 120 | 80 | Control | 51.3 ± 11.4 | 22.2 | 2.55 |
| 120 | 50 | Control | 77.8 ± 14.8 | 19.0 | 4.68 |
| 120 | 40 | Control | 89.6 ± 18.2 | 20.3 | 8.15 |
| 120 | 50 | 2 | 85.4 ± 29.6 | 34.6 | 10.45 |
| 120 | 50 | 4 | 66.6 ± 18.1 | 27.1 | 6.4 |
| 120 | 50 | 6 | 73.0 ± 19.2 | 26.3 | 6.8 |
| 120 | 50 | 8 | 62.5 ± 15.0 | 24.0 | 5.31 |
| 120 | 50 | 10 | 72.7 ± 14.1 | 19.4 | 4.98 |
| 120 | 40 | 2 | 71.7 ± 25.1 | 35.0 | 8.87 |
| 120 | 40 | 4 | 85.7 ± 18.8 | 22.0 | 6.66 |
| 120 | 40 | 6 | 74.7 ± 13.2 | 17.6 | 4.66 |
| 120 | 40 | 8 | 60.3 ± 13.7 | 22.8 | 4.86 |
| 120 | 40 | 10 | 54.5 ± 14.5 | 26.6 | 5.13 |
| 120 | 30 | 2 | 83.4 ± 18.2 | 21.8 | 7.42 |
| 120 | 30 | 4 | 77.9 ± 19.2 | 24.7 | 7.26 |
| 120 | 30 | 6 | 66.4 ± 33.1 | 49.9 | 12.51 |
| 120 | 30 | 8 | 82.3 ± 25.4 | 30.9 | 9.60 |
| 120 | 30 | 10 | 74.7 ± 19.3 | 25.9 | 8.64 |
Table 2.
Results of two-sample t-tests.
| p Values of Difference between Rehydrating Times | ||||
|---|---|---|---|---|
| Rehydrating Time (min) | 4 | 6 | 8 | 10 |
| 4 | - | 0.06247 | 0.079516 | 0.006072 * |
| 6 | - | 0.734841 | 0.209545 | |
| 8 | - | 0.509765 | ||
* Significant difference (p < 0.05).
Disclaimer/Publisher’s Note: The statements, opinions and data contained in all publications are solely those of the individual author(s) and contributor(s) and not of MDPI and/or the editor(s). MDPI and/or the editor(s) disclaim responsibility for any injury to people or property resulting from any ideas, methods, instructions or products referred to in the content. |
© 2023 by the authors. Licensee MDPI, Basel, Switzerland. This article is an open access article distributed under the terms and conditions of the Creative Commons Attribution (CC BY) license (https://creativecommons.org/licenses/by/4.0/).
Share and Cite
MDPI and ACS Style
Répás, Z.; Prokisch, J.; Győri, Z.; Sipos, P. The Relationship between Rehydration Time and Tenderness at Different Rehydrating Water Temperatures in Freeze-Dried Pork Loin. Processes 2023, 11, 2822. https://doi.org/10.3390/pr11102822
AMA Style
Répás Z, Prokisch J, Győri Z, Sipos P. The Relationship between Rehydration Time and Tenderness at Different Rehydrating Water Temperatures in Freeze-Dried Pork Loin. Processes. 2023; 11(10):2822. https://doi.org/10.3390/pr11102822
Chicago/Turabian StyleRépás, Zoltán, József Prokisch, Zoltán Győri, and Péter Sipos. 2023. "The Relationship between Rehydration Time and Tenderness at Different Rehydrating Water Temperatures in Freeze-Dried Pork Loin" Processes 11, no. 10: 2822. https://doi.org/10.3390/pr11102822
Note that from the first issue of 2016, this journal uses article numbers instead of page numbers. See further details here.