

Rheological Property for Nutritional Parameters Prediction of the Korla Pear

Abstract
:1. Introduction
2. Materials and Methods
2.1. Samples
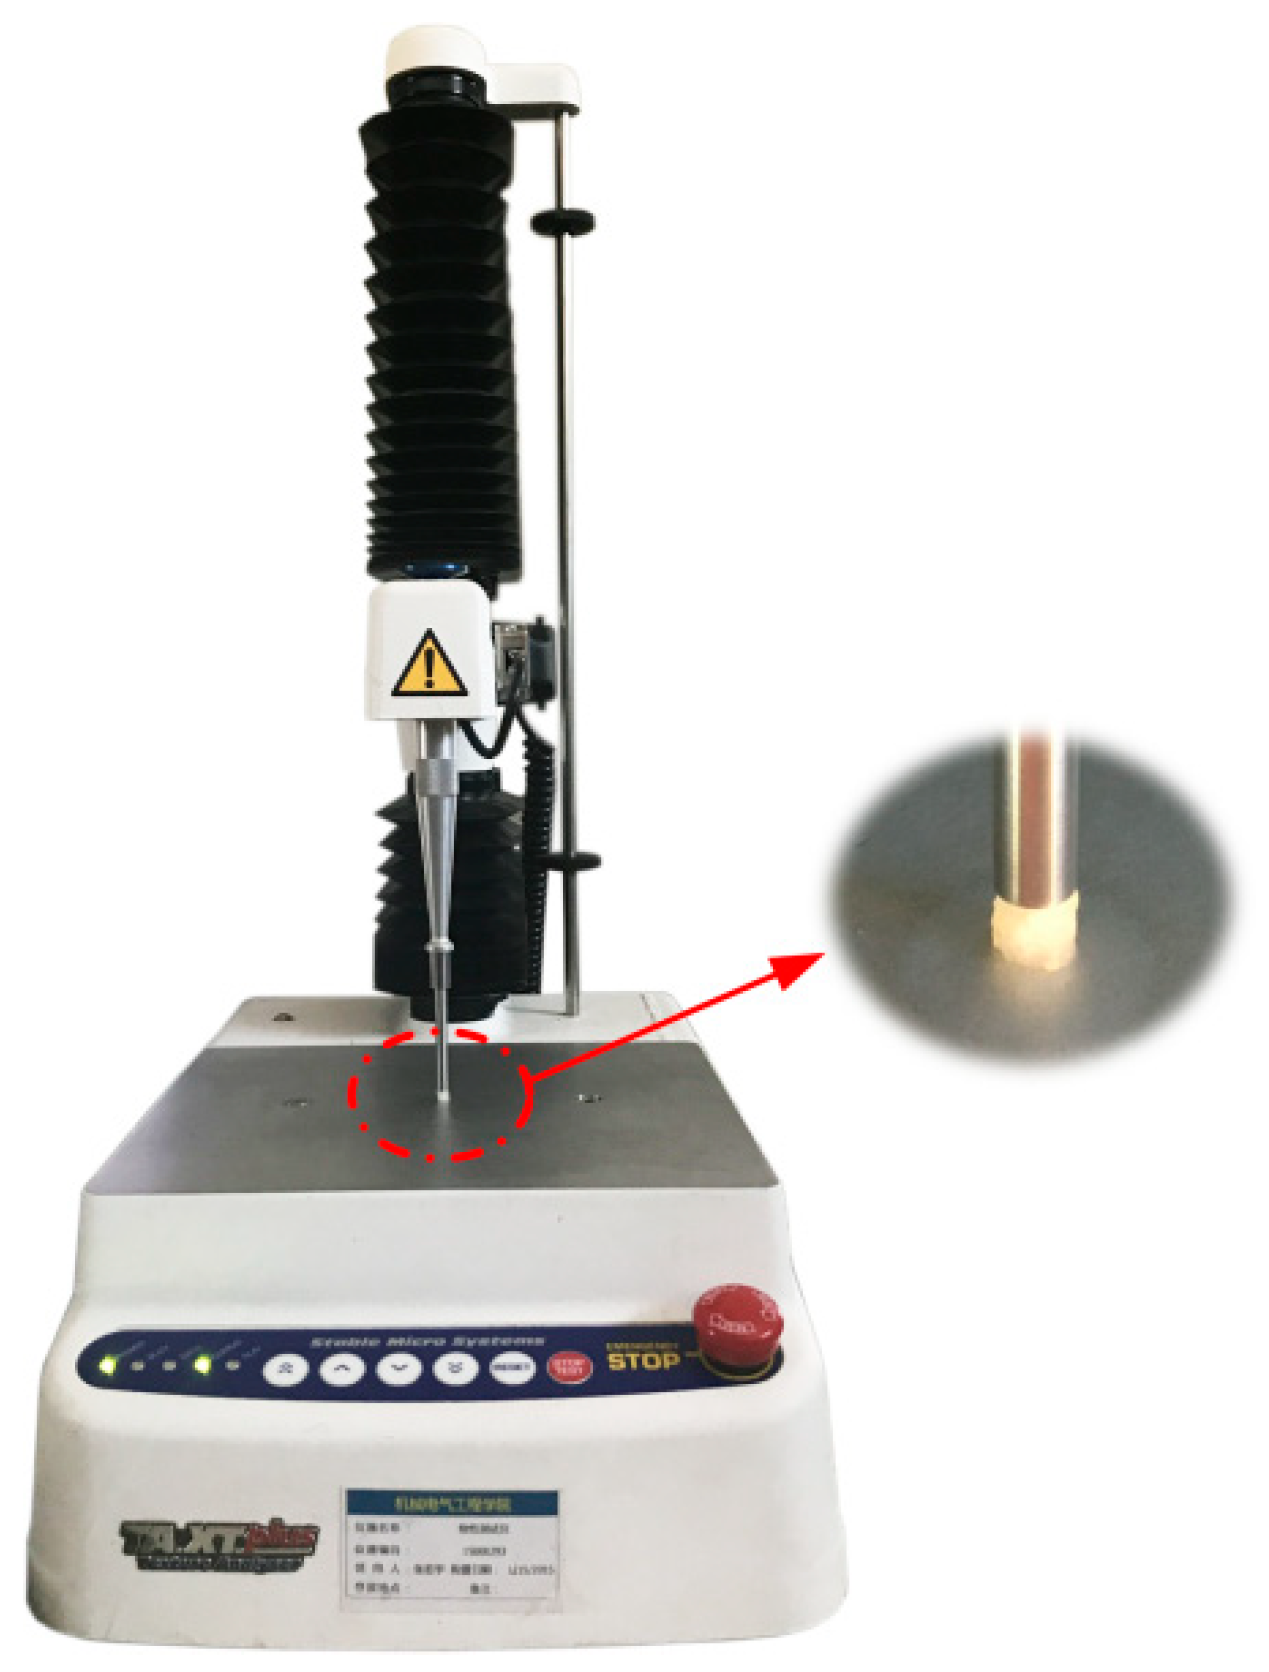
2.2. Rheology Test
2.3. Nutritional Parameters Measurements
2.4. Rheology Test Data Analysis
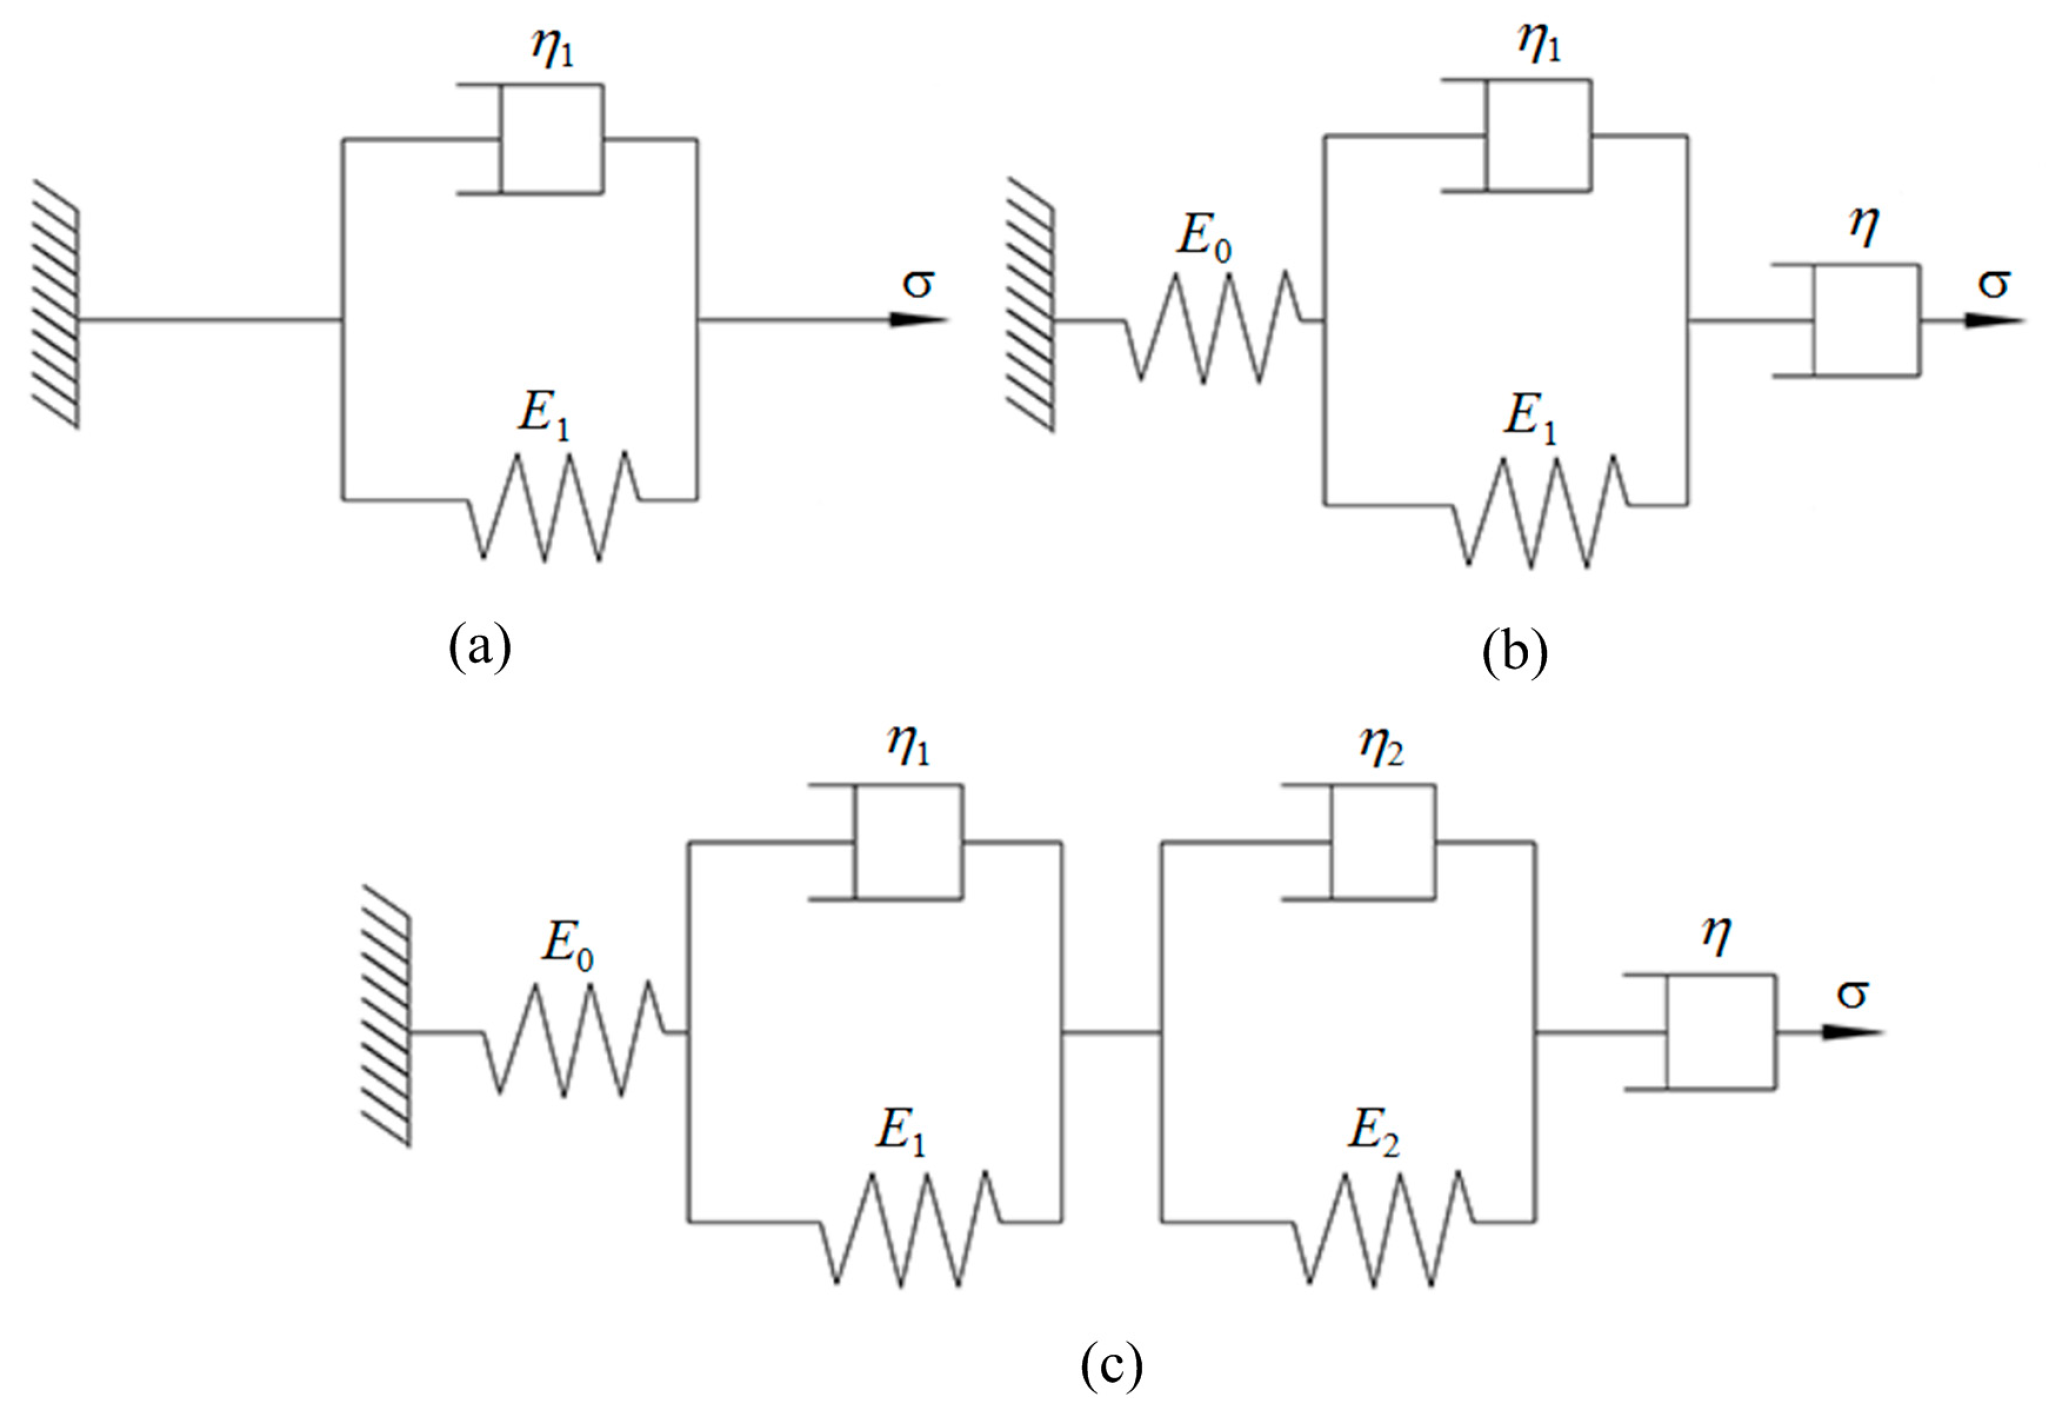
2.4.1. Creep Model
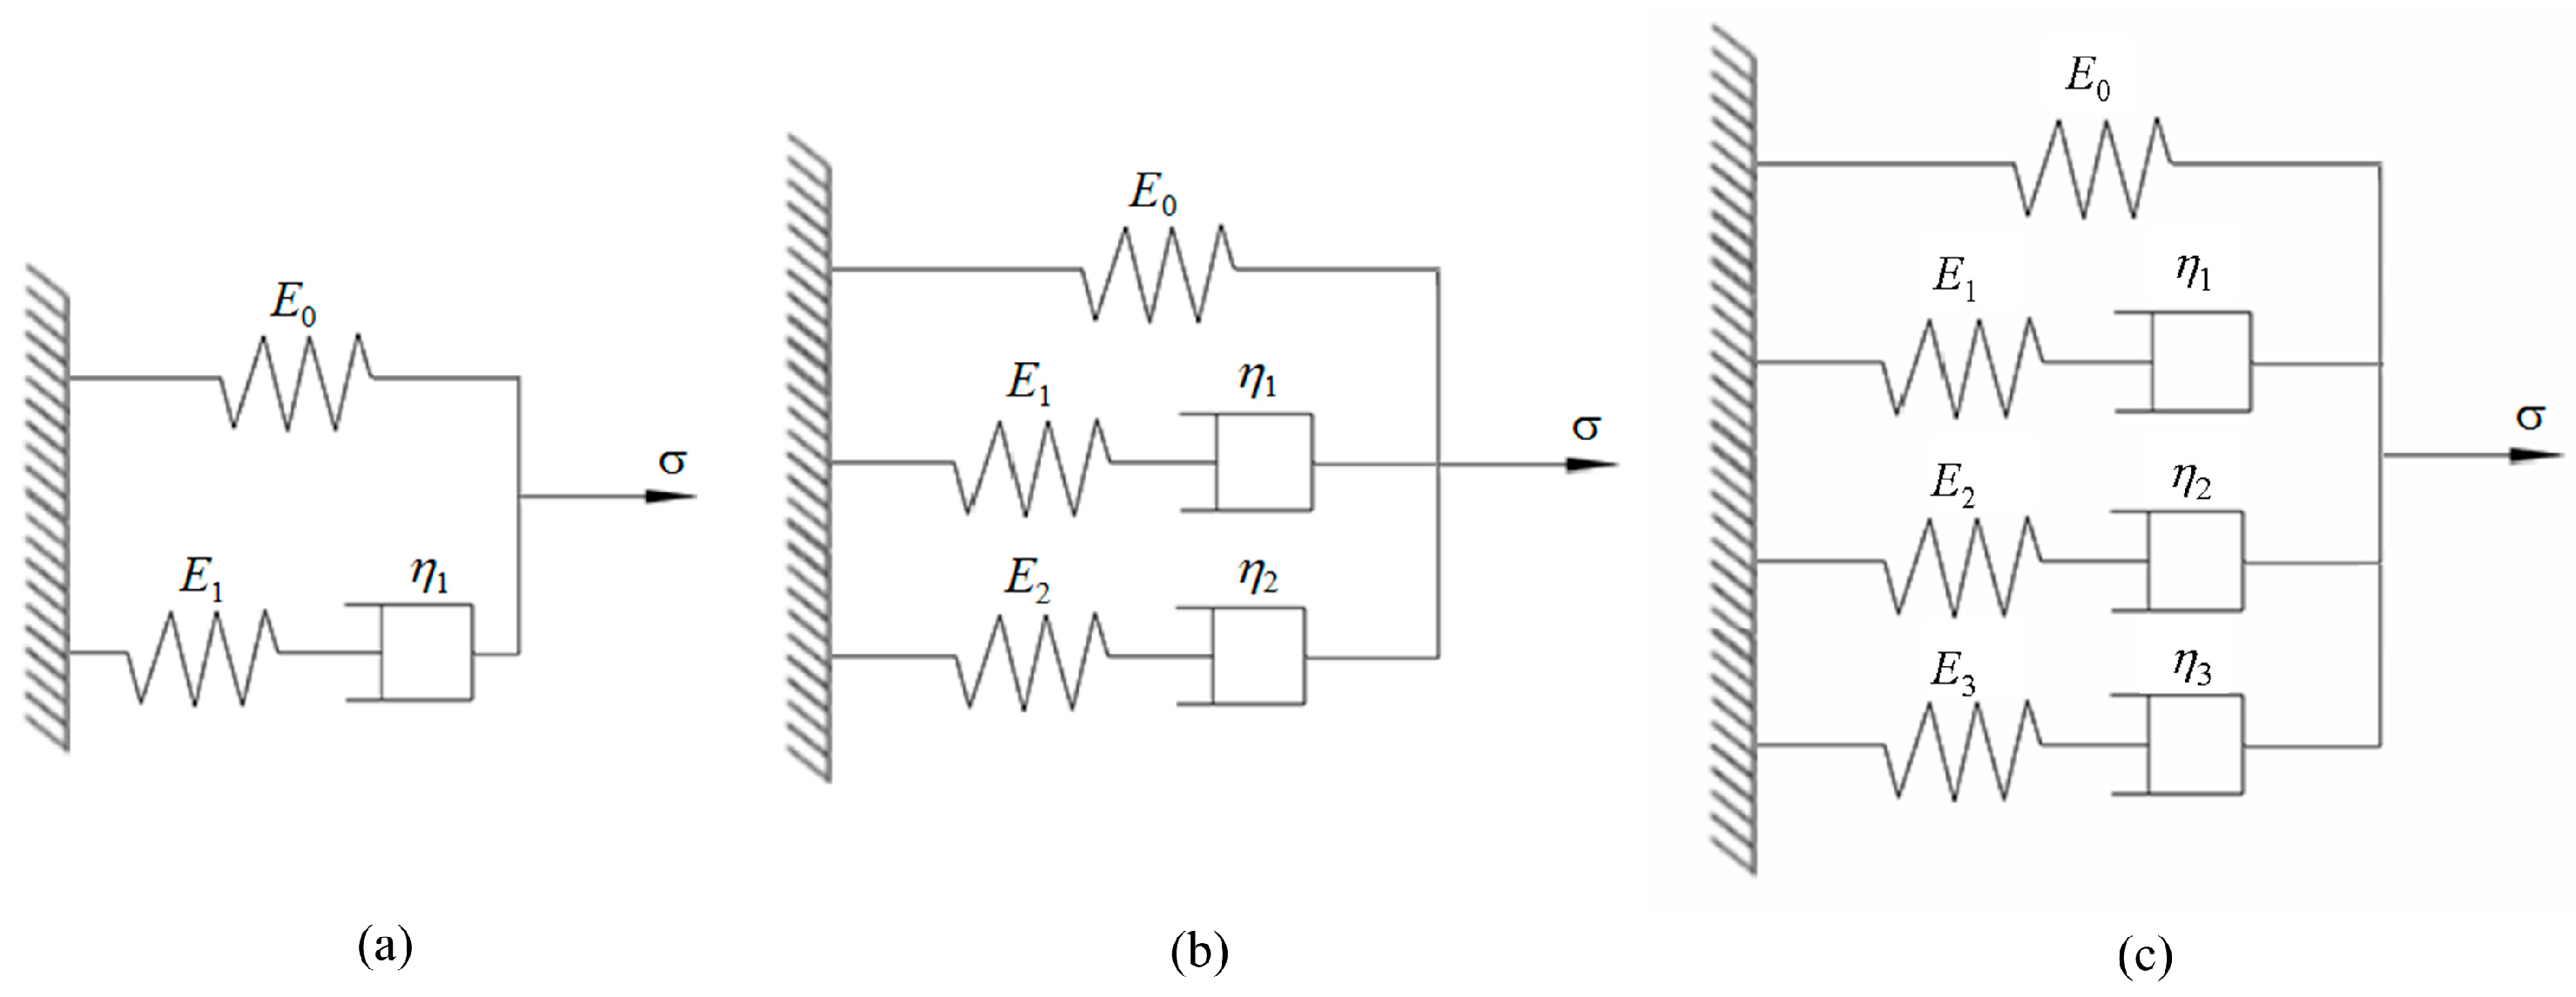
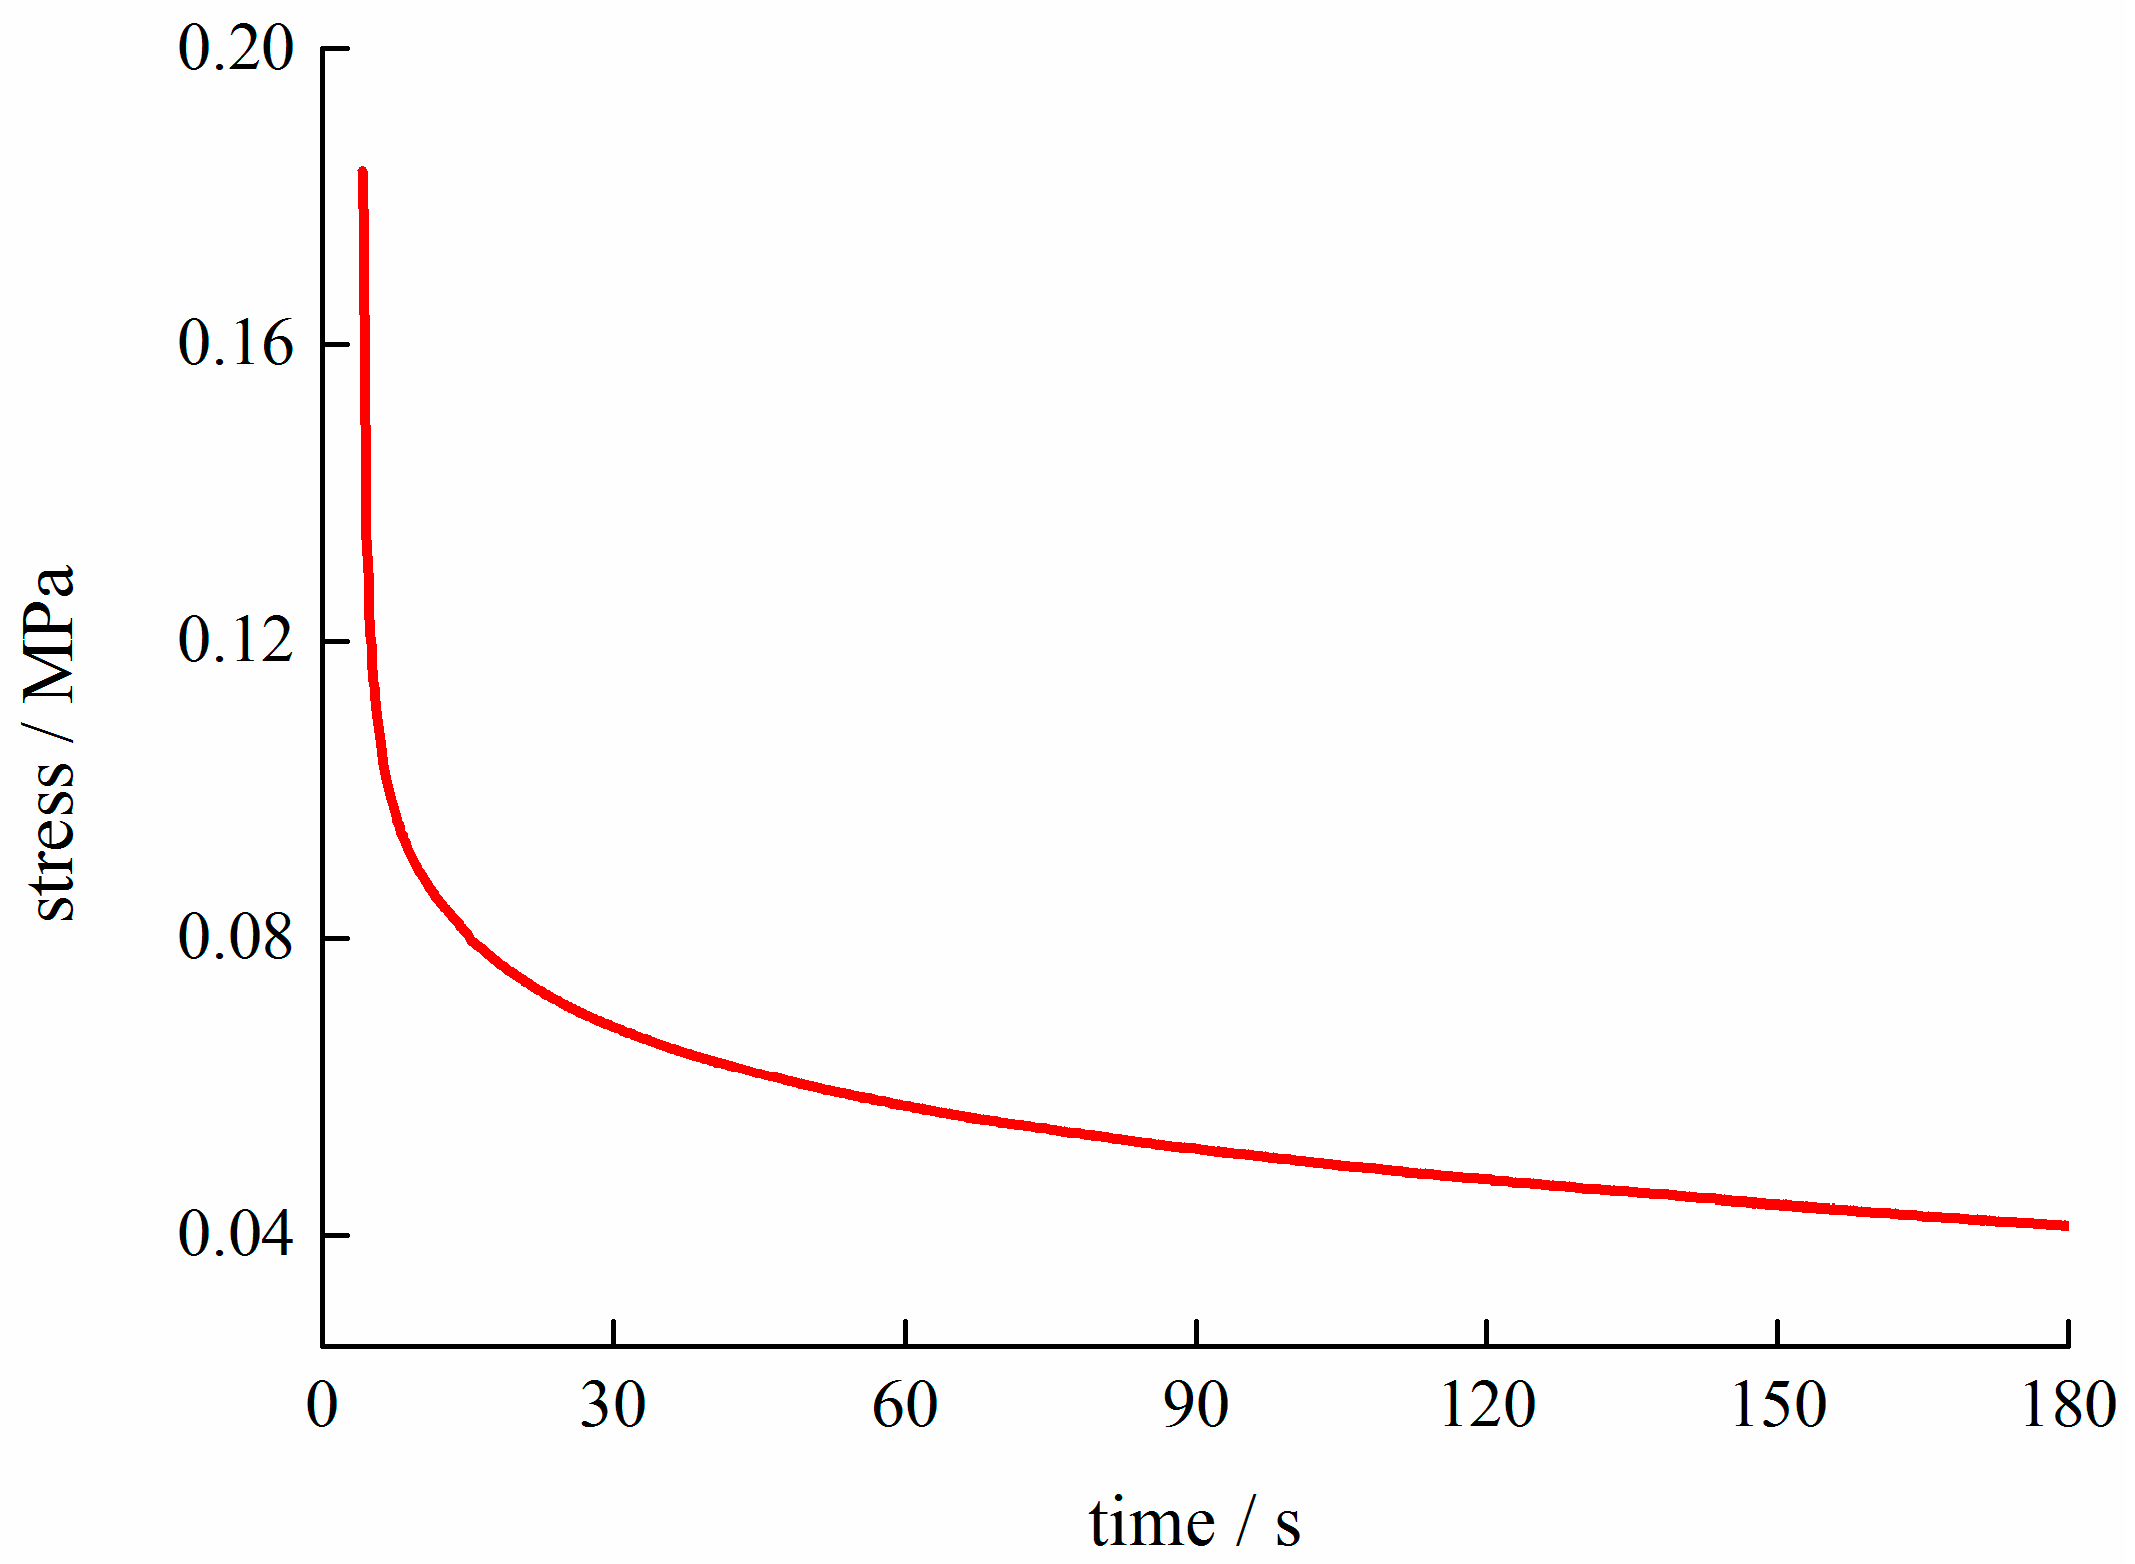
2.4.2. Stress Relaxation Model
2.5. Statistical Analysis and Construction Method of Prediction Model for Pear Nutritional Parameters
3. Results and Discussion
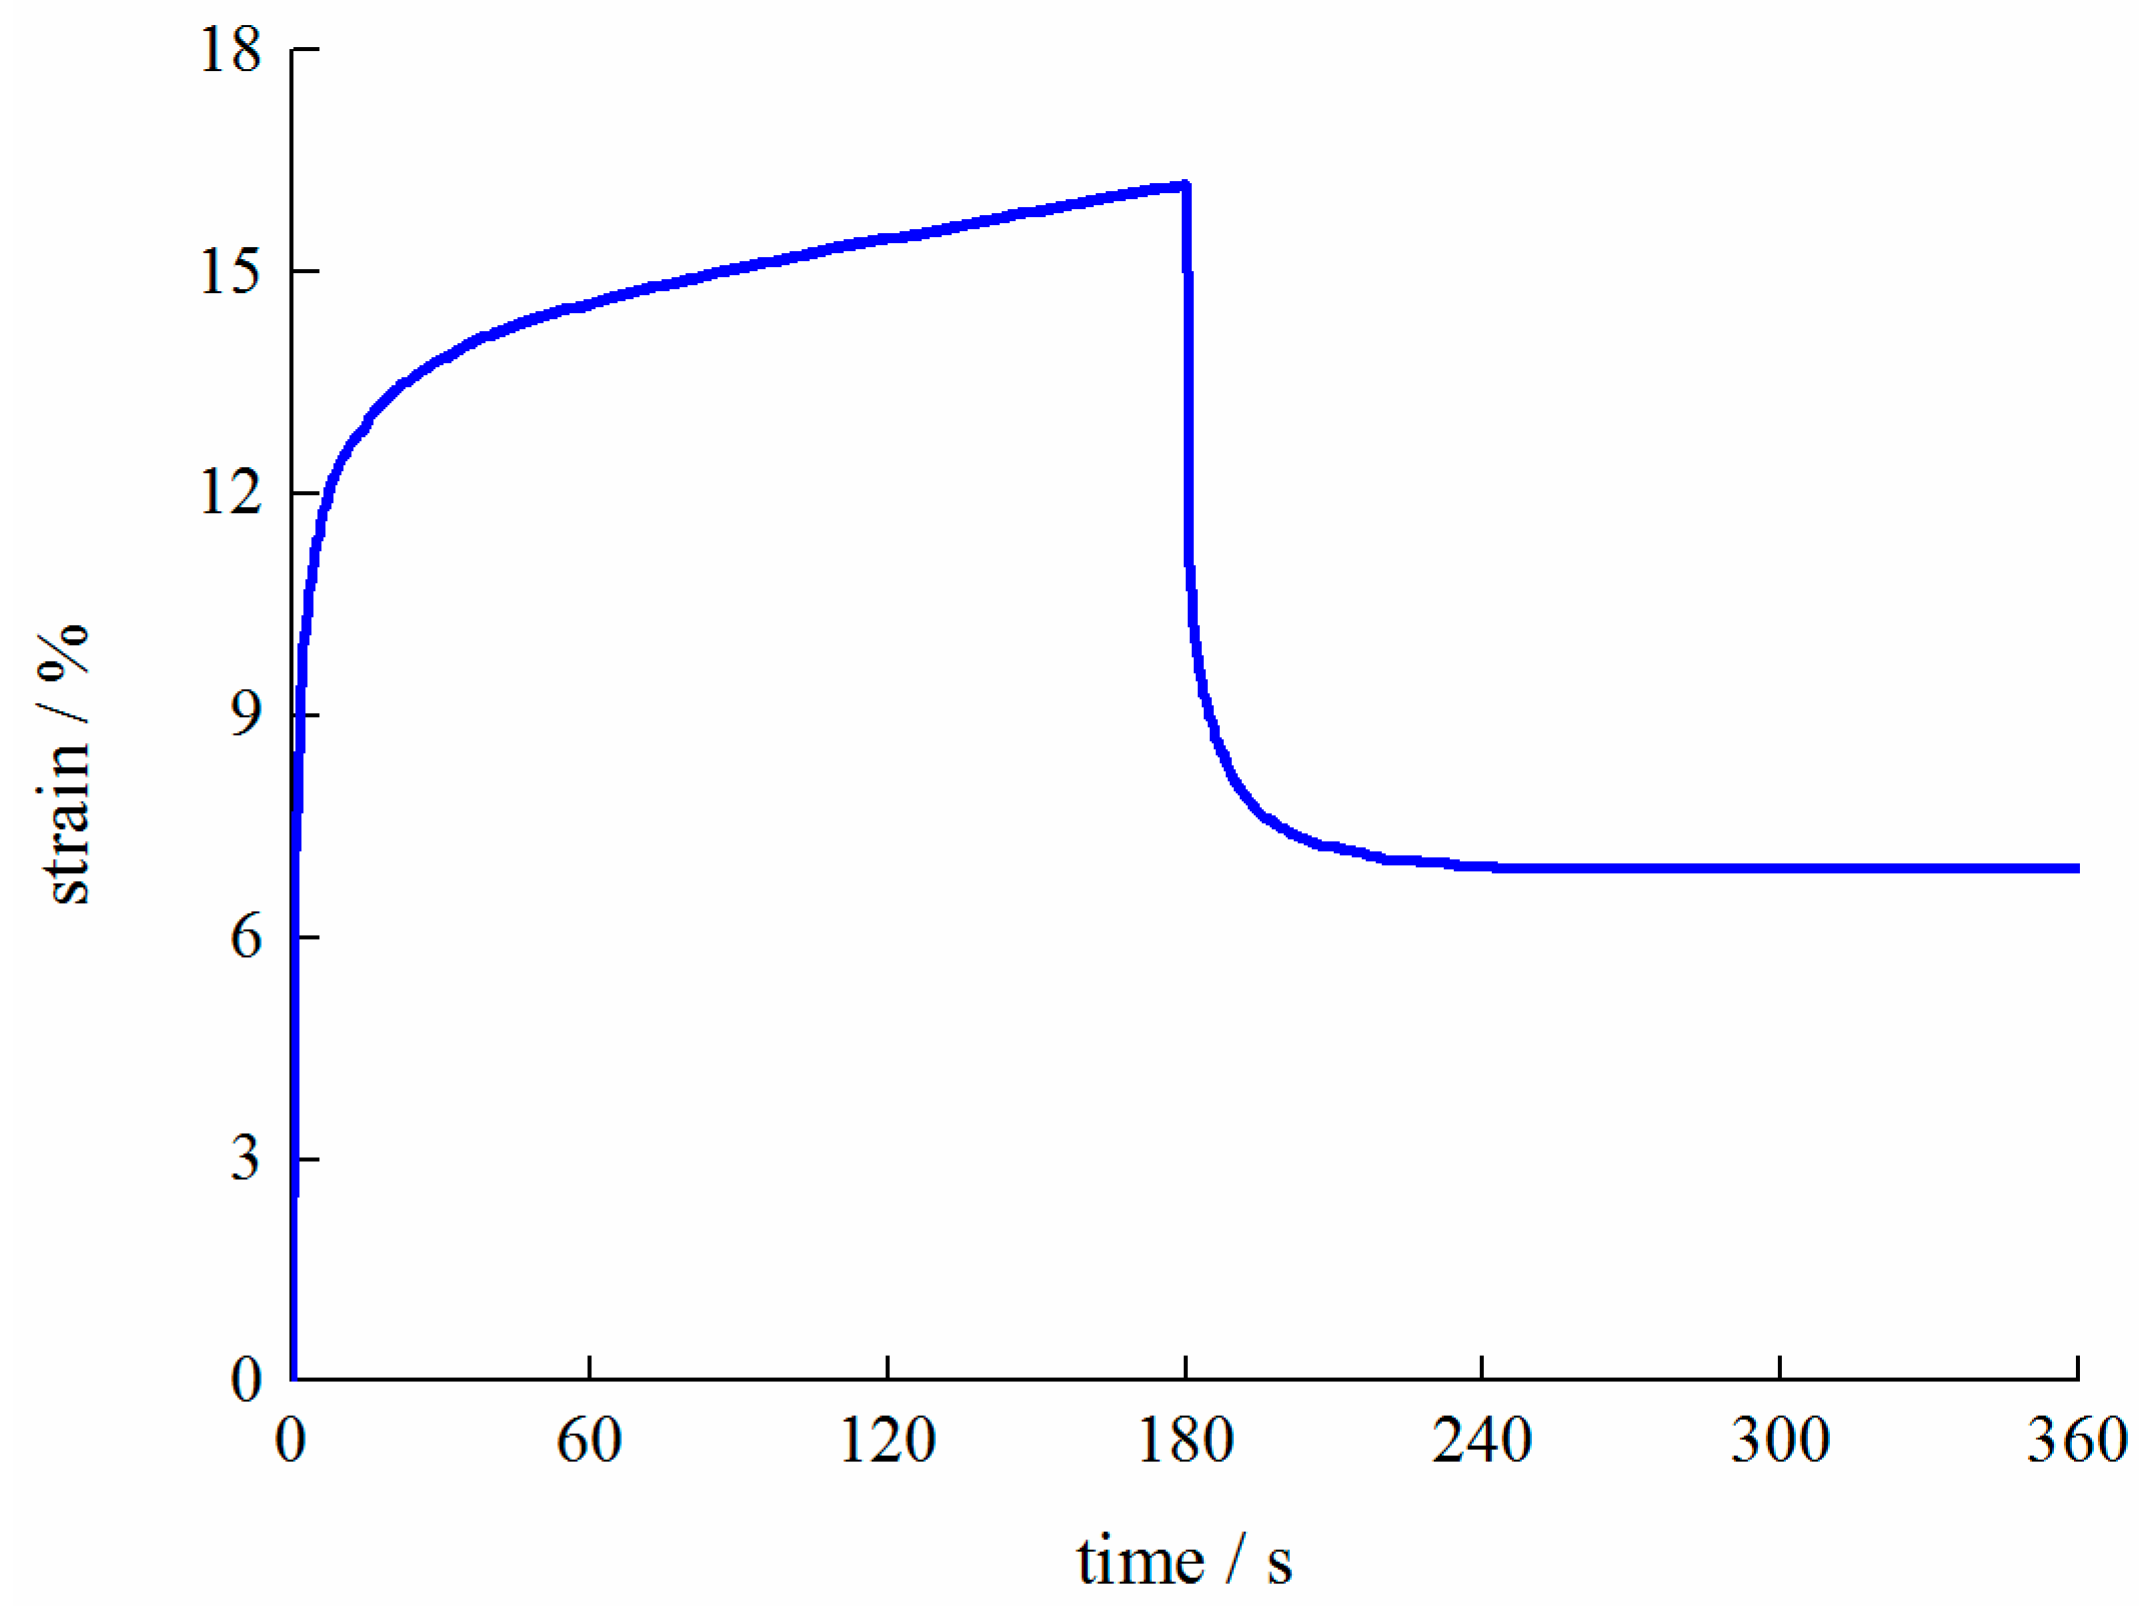
3.1. Curve Fitting
3.2. Correlation between Rheological Property Parameters of the Pear
3.3. Correlation of Rheological Characteristics Parameters of the Pear with Its Nutritional Parameters
3.4. Predictive Modeling of Pear Nutritional Parameters
3.5. Validation of the Prediction Model of Nutritional Parameters of Pear
4. Conclusions
Author Contributions
Funding
Data Availability Statement
Conflicts of Interest
References
- Hoehn, E.; Gasser, F.; Guggenbühl, B.; Künsch, U. Efficacy of instrumental measurements for determination of minimum requirements of firmness, soluble solids, and acidity of several apple varieties in comparison to consumer expectations. J. Postharvest Biol. Technol. 2003, 27, 27–37. [Google Scholar] [CrossRef]
- Pereira, A.G.; Gómez, A.H. The use of physical properties to determine some quality parameters in fruit and vegetables. Rev. Cienc. Técnicas Agropecu. 2002, 11, 27–33. Available online: http://www.redalyc.org/articulo.oa?id=9321407 (accessed on 15 January 2018).
- Limanond, B.; Castell-Perez, M.E.; Moreira, R.G. Modeling the kinetics of corn tortilla staling using stress relaxation data. J. Food Eng. 2002, 53, 237–247. [Google Scholar] [CrossRef]
- Wu, X.H.; Wang, C.; Guo, Y.M. Effects of the high-pulsed electric field pretreatment on the mechanical. J. Food Eng. 2019, 274, 109837. [Google Scholar] [CrossRef]
- Mohsenin, N.N. Mechanical properties of fruits and vegetables review of a decade of research applications and future needs. J. Trans. ASAE 1972, 15, 1064–1070. [Google Scholar] [CrossRef]
- Edwards, E. Vegetables and fruit. In Food Texture: Measurement and Perception; Rosenthal, A.J., Ed.; An Aspen Publication: Frederick, MD, USA, 1999; pp. 259–281. [Google Scholar]
- Jack, F.R.; Paterson, A.; Piggott, J.R. Perceived texture: Direct and indirect methods for use in product development. J. Food Sci. Technol. 1995, 30, 1–12. [Google Scholar] [CrossRef]
- Diamante, L.; Umemoto, M. Rheological properties of fruits and vegetables: A review. Int. J. Food Prop. 2015, 18, 1191–1210. [Google Scholar] [CrossRef]
- Wu, T.; Abbott, J.A. Firmness and force relaxation characteristics of tomatoes stored intact or as slices. J. Postharvest Biol. Technol. 2002, 24, 59–68. [Google Scholar] [CrossRef]
- Ballabio, D.; Consonni, V.; Costa, F. Relationships between apple texture and rheological parameters by means of multivariate analysis. J. Chemom. Intell. Lab. Syst. 2012, 111, 28–33. [Google Scholar] [CrossRef]
- Sayyah, A.H.A.; Esmailpour, B. Apple firmness measurement based on visco-elastic properties. J. Food Agric. Environ. 2008, 6, 276–279. [Google Scholar]
- López-Perea, P.; Schwarz, P.B.; Figueroa, J.D.C.; Hernandez-Estrada, Z.J. Effect of beta-glucans on viscoelastic properties of barley kernels and their relationship to structure and soluble dietary fibre. J. Cereal Sci. 2012, 56, 595–602. [Google Scholar] [CrossRef]
- Nieto, A.B.; Vicente, S.; Hodara, K.; Castro, M.A.; Alzamora, S.M. Osmotic dehydration of apple: Influence of sugar and water activity on tissue structure, rheological properties and water mobility. J. Food Eng. 2013, 119, 104–114. [Google Scholar] [CrossRef]
- Zhao, W.; Fang, Y.; Zhang, Q.A.; Guo, Y.R.; Gao, G.T.; Yi, X. Correlation analysis between chemical or texture attributes and stress relaxation properties of ‘Fuji’ apple. J. Postharvest Biol. Technol. 2017, 129, 45–51. [Google Scholar] [CrossRef]
- Zhang, J.; Wang, J.; Gu, S.; Zheng, C.Y.; Du, D.D. Relaxation characteristics for quality evaluation of Chinese cabbage. J. Food Eng. 2021, 306, 110635. [Google Scholar] [CrossRef]
- Wu, J.; Guo, K.Q. Dynamic viscoelastic behaviour and microstructural changes of Korla pear (Pyrus bretschneideri rehd) under varying turgor levels. J. Biosyst. Eng. 2010, 106, 485–492. [Google Scholar] [CrossRef]
- Corollaro, M.L.; Aprea, E.; Endrizzi, I.; Betta, E.; Demattè, M.L.; Charles, M.; Bergamaschi, M.; Costa, F.; Biasioli, F.; Grappadelli, L.C.; et al. A combined sensory-instrumental tool for apple quality evaluation. J. Postharvest Biol. Technol. 2014, 96, 135–144. [Google Scholar] [CrossRef]
- Augusto, P.E.D.; Ibarz, A.; Cristianini, M. Effect of high pressure homogenization (HPH) on the rheological properties of tomato juice: Creep and recovery behaviours. J. Food Res. Int. 2013, 54, 169–176. [Google Scholar] [CrossRef]
- Cenkowski, S.; Bielewicz, J.; Britten, M.G. A single kernel creep and recovery test. J. Trans. ASAE 1991, 34, 2484–2490. [Google Scholar] [CrossRef]
- Varith, J.; Noochuay, C.; Khamdang, T.; Ponpai, A. Changes in viscoelastic properties of longan during hot-air drying in relation to its indentation. J. Maejo Int. J. Sci. Technol. 2008, 2, 320–330. [Google Scholar]
- Martinez, V.Y.; Nieto, A.B.; Castro, M.A.; Salvatori, D.; Alzamora, S.M. Viscoelastic characteristics of Granny Smith apple during glucose osmotic dehydration. J. Food Eng. 2007, 83, 394–403. [Google Scholar] [CrossRef]
- Martinez, V.Y.; Nieto, A.B.; Viollaz, P.E.; Alzamora, S.M. Viscoelastic behavior of melon tissue as influenced by blanching and osmotic dehydration. J. Food Sci. 2005, 70, E12–E18. [Google Scholar] [CrossRef]
- Bargale, P.C.; Irundayaraj, J.M.; Marquis, B. Some mechanical properties and stress relaxation characteristics of lentils-part II. pdf. J. Can. Agric. Eng. 1994, 36, 251–254. [Google Scholar]
- Chakespari, A.G.; Rajabipour, A.; Mobli, H. Anisotropic relaxation and creep properties of apple (cv. Shafi Abadi and Golab Kohanz). J. Adv. J. Food Sci. Technol. 2010, 2, 200–205. [Google Scholar]
- Kaur, L.; Singh, N.; Sodhi, N.S.; Gujral, H.S. Some properties of potatoes and their starches. I. Cooking, textural and rheological properties of potatoes. J. Food Chem. 2002, 79, 177–181. [Google Scholar] [CrossRef]
- Hassan, B.H.; Alhamdan, A.M.; Elansari, A.M. Stress relaxation of dates at khalal and rutab stages of maturity. J. Food Eng. 2005, 66, 439–445. [Google Scholar] [CrossRef]
- Zhang, W.; Cui, D.; Ying, Y.B. Nondestructive measurement of pear texture by acoustic vibration method. J. Postharvest Biol. Technol. 2014, 96, 99–105. [Google Scholar] [CrossRef]
- Gu, S.; Chen, W.; Wang, Z.H.; Wang, J.; Huo, Y.J. Rapid detection of Aspergillus spp. infection levels on milled rice by headspace-gas chromatography ion-mobility spectrometry (HS-GC-IMS) and E-nose. J. Lwt-Food Sci. Technol. 2020, 132, 109758. [Google Scholar] [CrossRef]


| Average | Standard Error | Coefficient of Variation (%) | |
|---|---|---|---|
| Mass (g) | 138.19 | 16.93 | 12.31 |
| Firmness (kg·cm−2) | 6.98 | 0.27 | 11.23 |
| Moisture content (wet basis) (%) | 88.20 | 0.25 | 0.34 |
| Total soluble solids (%) | 11.53 | 0.86 | 7.50 |
| Titratable acid (%) | 0.034 | 0.008 | 23.16 |
| Rheological Model | Variation of R2 | Average of R2 | CV (%) | |
|---|---|---|---|---|
| Creep | Kelvin–Voigt model | 0.265~0.603 | 0.352 | 0.236 |
| Burgers model | 0.923~0.967 | 0.949 | 0.976 | |
| Generalized Kelvin–Voigt model with six elements | 0.959~0.998 | 0.992 | 0.221 | |
| Stress relaxation | Maxwell model with three elements | 0.919~0.975 | 0.953 | 1.191 |
| Generalized Maxwell model with five elements | 0.989~0.997 | 0.993 | 0.177 | |
| Generalized Maxwell model with seven elements | 0.998~0.999 | 0.998 | 0.002 | |
| E0 | E1 | E2 | η | η1 | η2 | T | T1 | T2 | |
|---|---|---|---|---|---|---|---|---|---|
| E0 | 1 | ||||||||
| E1 | 0.191 | 1 | |||||||
| E2 | 0.177 | 0.776 ** | 1 | ||||||
| η | 0.141 | 0.484 ** | 0.449 ** | 1 | |||||
| η1 | 0.089 | 0.813 ** | 0.661 ** | 0.384 ** | 1 | ||||
| η2 | −0.086 | −0.640 ** | −0.590 ** | −0.250 * | −0.477 ** | 1 | |||
| T | −0.662 ** | −0.054 | −0.077 | 0.429 ** | 0.010 | −0.041 | 1 | ||
| T1 | −0.075 | 0.182 | 0.198 | 0.301 ** | 0.258 * | −0.202 | 0.157 | 1 | |
| T2 | −0.392 ** | −0.508 ** | −0.730 ** | −0.352 ** | −0.384 ** | 0.293 ** | 0.345 ** | −0.197 | 1 |
| E0 | E1 | E2 | E3 | η1 | η2 | η3 | T1 | T2 | T3 | |
|---|---|---|---|---|---|---|---|---|---|---|
| E0 | 1 | |||||||||
| E1 | −0.030 | 1 | ||||||||
| E2 | −0.561 | 0.174 | 1 | |||||||
| E3 | 0.736 * | 0.212 | −0.601 | 1 | ||||||
| η1 | 0.840 ** | 0.285 | −0.654 | 0.957 ** | 1 | |||||
| η2 | −0.564 | 0.192 | 0.982 ** | −0.610 | −0.657 | 1 | ||||
| η3 | 0.835 ** | −0.062 | −0.673 * | 0.944 ** | 0.928 ** | −0.687 * | 1 | |||
| T1 | 0.823 ** | −0.511 | −0.686 * | 0.672 * | 0.670 * | −0.702 * | 0.863 ** | 1 | ||
| T2 | 0.753 * | −0.283 | −0.695 * | 0.857 * | 0.815 ** | −0.713 * | 0.969 ** | 0.919 ** | 1 | |
| T3 | 0.769 * | −0.526 | −0.690 * | 0.570 | 0.618 | −0.704 * | 0.807 ** | 0.955 ** | 0.885 ** | 1 |
| E0 | E1 | E2 | η | η1 | η2 | T | T1 | T2 | |
|---|---|---|---|---|---|---|---|---|---|
| Total soluble solids TSS (%) | 0.505 | 0.807 * | 0.460 | 0.882 ** | 0.780 * | 0.338 | 0.323 | −0.101 | −0.159 |
| Titratable acidity TA (%) | −0.509 | −0.704 | −0.718 * | −0.517 | −0.514 | −0.257 | −0.161 | 0.272 | 0.417 |
| Solid to acid ratio RTT | 0.665 | 0.873 ** | 0.688 | 0.476 | 0.635 | 0.737 * | −0.027 | −0.329 | 0.005 |
| E0 | E1 | E2 | E3 | η1 | η2 | η3 | T1 | T2 | T3 | |
|---|---|---|---|---|---|---|---|---|---|---|
| Total soluble solids TSS (%) | 0.220 | −0.549 * | −0.205 | −0.388 | −0.549 * | −0.202 | −0.345 | 0.619 * | 0.086 | −0.048 |
| Titratable acidity TA (%) | −0.561 | 0.005 | 0.737 * | −0.218 | −0.435 | 0.722 * | −0.323 | −0.418 | −0.248 | −0.498 |
| Solid to acid ratio RTT | 0.605 | 0.154 | −0.704 * | 0.653 | 0.418 | −0.695 * | 0.774 * | 0.707 * | 0.408 | 0.699 * |
| Rheological Parameters | Nutritional Parameters | Predictive Models | Intercept Distance b0 t-Test | Regression Coefficient t-Test | Correlation Coefficient rc | p-Value | Standard Error RMSE |
|---|---|---|---|---|---|---|---|
| Creep parameters | TSS (%) | TSS = 10.968 + 4.313 × 10⁻⁷η − 0.195T1 | tb0 = 11.51 | tb1 = 6.977 tb2 = 2.663 | 0.953 | <0.05 | 0.055 |
| TA (%) | TA = 0.066 + 2.542 × 10⁻⁶E2 | tb0 = 4.962 | tb1 = 2.526 | 0.718 | <0.05 | 0.002 | |
| RTT | RTT = −553.743 + 0.011E1 + 0.14η2 | tb0 = 3.585 | tb1 = 4.392 tb2 = 2.757 | 0.952 | <0.05 | 22.239 | |
| Stress relaxation parameters | TSS (%) | TSS = 10.864 + 0.151T1 − 3.167 × 10⁻¹⁰E3 − 0.008 T3 | tb0 = 27.363 | tb1 = 3.915 tb2 = 3.759 tb3 = 2.523 | 0.863 | <0.05 | 0.135 |
| TA (%) | TA = 0.029 + 2.378 × 10⁻¹³E2 | tb0 = 10.181 | tb1 = 2.885 | 0.737 | <0.05 | 0.004 | |
| RTT | RTT = 81.87 − 2.355 × 10⁻⁴η1 + 5.077 × 10⁻⁵η3 | tb0 = 2.343 | tb1 = 4.495 tb2 = 2.598 | 0.901 | <0.05 | 40.08 |
| Predictive Models | Measured Value—Predicted Value | Differences between Groups | t-Test | df | ||
|---|---|---|---|---|---|---|
| Average | Standard Deviation | Standard Error | ||||
| Creep parameter prediction model | TSS (%) | 0.331 | 0.171 | 0.163 | 0.319 | 24 |
| TA (%) | 0.003 | 0.003 | 0.003 | 0.361 | 24 | |
| RTT | 23.480 | 18.367 | 25.839 | 0.374 | 24 | |
| Stress relaxation parameter prediction model | TSS (%) | 1.722 | 1.345 | 0.332 | 0.945 | 24 |
| TA (%) | 0.004 | 0.004 | 0.004 | 0.372 | 24 | |
| RTT | 42.771 | 22.829 | 44.371 | 0.323 | 24 | |
Disclaimer/Publisher’s Note: The statements, opinions and data contained in all publications are solely those of the individual author(s) and contributor(s) and not of MDPI and/or the editor(s). MDPI and/or the editor(s) disclaim responsibility for any injury to people or property resulting from any ideas, methods, instructions or products referred to in the content. |
© 2023 by the authors. Licensee MDPI, Basel, Switzerland. This article is an open access article distributed under the terms and conditions of the Creative Commons Attribution (CC BY) license (https://creativecommons.org/licenses/by/4.0/).
Share and Cite
Wang, J.; Wang, C.; Mo, X.; Wu, J. Rheological Property for Nutritional Parameters Prediction of the Korla Pear. Processes 2023, 11, 2871. https://doi.org/10.3390/pr11102871
Wang J, Wang C, Mo X, Wu J. Rheological Property for Nutritional Parameters Prediction of the Korla Pear. Processes. 2023; 11(10):2871. https://doi.org/10.3390/pr11102871
Chicago/Turabian StyleWang, Jiaping, Chao Wang, Xiaoming Mo, and Jie Wu. 2023. "Rheological Property for Nutritional Parameters Prediction of the Korla Pear" Processes 11, no. 10: 2871. https://doi.org/10.3390/pr11102871
APA StyleWang, J., Wang, C., Mo, X., & Wu, J. (2023). Rheological Property for Nutritional Parameters Prediction of the Korla Pear. Processes, 11(10), 2871. https://doi.org/10.3390/pr11102871