Article

Low-Pressure Hydrothermal Processing of Disposable Face Masks into Oils

1
Davidson School of Chemical Engineering, Purdue University, West Lafayette, IN 47907, USA
2
Department of Chemistry and Biochemistry, College of Natural and Social Sciences, California State University, Los Angeles, CA 90032, USA
*
Author to whom correspondence should be addressed.
Processes 2023, 11(10), 2819; https://doi.org/10.3390/pr11102819
Submission received: 1 September 2023 / Revised: 20 September 2023 / Accepted: 21 September 2023 / Published: 23 September 2023

Abstract

:
A total of 5.4 million tons of face masks were generated worldwide annually in 2021. Most of these used masks went to landfills or entered the environment, posing serious risks to wildlife, humans, and ecosystems. In this study, batch low-pressure hydrothermal processing (LP-HTP) methods are developed to convert disposable face masks into oils. Three different materials from face masks were studied to find optimal processing conditions for converting full face masks into oil. The oil and gas yields, as well as oil compositions, depend on the feedstock composition, particle size, and reaction conditions. Yields of 82 wt.% oil, 17 wt.% gas, and minimal char (~1 wt.%) were obtained from full masks. LP-HTP methods for converting face masks have higher oil yields than pyrolysis methods in the literature and have lower operating pressures than supercritical water liquefaction. LP-HTP methods for face masks can increase net energy returns by 3.4 times and reduce GHG emissions by 95% compared to incineration. LP-HTP has the potential to divert 5.4 million tons of waste masks annually from landfills and the environment, producing approximately 4.4 million tons of oil.

1. Introduction

The yearly worldwide production rate of plastics has surged from 234 million tons (MT) in 2000 to 460 MT in 2019. The current lifecycle of these plastics is mostly linear. Although 15% of plastic waste is collected for recycling, only 9% of waste is recycled. About 19% of the waste is incinerated, and 72% ends up in landfills, unregulated dumpsites, and the surrounding environment. The low plastic waste recycling rate has led to annual accumulation rates escalating from 156 MT in 2000 to 353 MT in 2019 [1].
These escalating accumulation rates are mainly due to the increased use of single-use plastics. Single-use face masks, with their extensive use encouraged by government mandates, have emerged as the most widespread PPE for curbing the dissemination of airborne illnesses [2,3]. It was estimated that 52 billion disposable face masks were produced in 2020, and 72% of used face masks ended up in landfills and 3% in oceans [2,3,4]. Although the COVID-19 pandemic has been declared over, disposable face masks continue to be used around the world [5]. Although waste face masks contribute 1% of the total plastic waste, any face mask disposed of in water quickly generates microplastic fibers (100–500 μm) over seven days. A single face mask releases several thousands of microplastic particles into the air over 8 h of use. This microplastic pollution of water and air can be harmful to human health and ecological systems [6,7,8,9]. Therefore, a method for reducing the accumulation of waste face masks and other forms of medical waste must be developed.
Incineration and gasification methods for converting used face masks to products have been studied previously. Incineration can treat these face masks using combustion for energy recovery but only results in an energy return of roughly 13–26% of the mask’s energy content [10,11]. Incineration can generate hazardous pollutants such as furans and dioxins, which pose serious health risks [12]. Gasification can convert face mask waste into syngas at the lab scale, containing approximately 11% H2, 6% carbon monoxide, 12% methane, and 14% hydrocarbons within the C2–C3 range. Steam gasification specifically can result in yields of 39% H2 and 22% methane at lab scale [13,14]. However, gasification requires very high temperatures, ranging from 800 °C to 900 °C, and produces lower-value products compared to oils. Furthermore, the gasification of plastic waste produces significant tar yields (up to 20–25%). Tar formation leads to reduced gas production and impacts overall process efficiency [15].
Pyrolysis and supercritical water liquefaction (SWL) methods can thermochemically convert face mask waste to oils [16,17,18]. Pyrolysis can convert face masks to oil under an inert atmosphere with yields of up to 81% (Table 1), but this process can result in high char yields (up to 9%, Table 1). The extent of this undesired char formation can impact the overall process efficiency and lead to equipment fouling. Supercritical water liquefaction (SWL) can convert face masks to oil with yields of 67% while reducing char formation compared to gasification and pyrolysis (Table 1). Water, acting as a diluent [19,20], reduces the formation of polycyclic aromatic hydrocarbons (PAHs), which are precursors for char formation. Water is also non-toxic, relatively inexpensive, and acts as a good conductor of heat that helps to transfer heat to the feedstock. However, the high temperatures (380–500 °C), pressures (~3500 psi), and water loadings (up to 95 wt.%) of SWL increase required energy inputs and capital and operating costs.
Low-pressure hydrothermal processing (LP-HTP) improves upon both pyrolysis and SWL through the conversion of polyolefin pellets into high oil yields of up to 87 wt.% (Table 1). By reducing the water loading to 5 wt.% relative to the feedstock, operating pressures are reduced significantly while still minimizing the formation of PAHs and char [20]. However, this process has not been tested for face mask conversion to oils. Therefore, this study focuses on face mask conversion using LP-HTP methods.
A common disposable face mask consists of 80.7% Polypropylene (PP, main non-woven 3-ply mask body, NW), 7.9% High-Density Polyethylene (HDPE, nose band for mask, NB), and 11.4% Polyester and Spandex (ear loops for mask, EL). As approximately 89% of this face mask is made of polyolefins, the goal of this study is to explore the potential of LP-HTP methods for face mask conversion to useful products (Figure 1). The specific objectives include (1) determining LP-HTP reaction conditions that can convert face masks into oils and (2) comparing the results of face mask conversion into oils with previous LP-HTP studies using PP or HDPE pellets.
Specific research questions for this study include the following: (1) What are the chemical compositions of the oils produced from face mask conversion? (2) Which of the different mask components can be converted into oils? (3) How does the polymer composition of the face mask affect the oil yield and composition? (4) What are the energy consumption and GHG emissions for LP-HTP of face masks compared to landfilling, incineration, pyrolysis, and SWL? Figure 1 shows the overview of converting face masks and their constituents into oil via LP-HTP.
The major findings of this LP-HTP study include the following: (1) oil yields of 87% were obtained from the PP non-woven mask body and 82% from the full mask, respectively, with little (<1%) char, (2) conversion of PP and HDPE face mask components follow the same reaction pathways as reported in previous literature for PP and HDPE pellets, (3) conversions of the thinner face mask components occur at lower temperatures and times than those for thicker pellets, (4) the methods have 3.4 times higher net energy return and 95% lower GHG emissions than incineration, and (5) the methods have the potential to produce 4.4 million tons of oil annually from waste face masks.

2. Materials and Methods
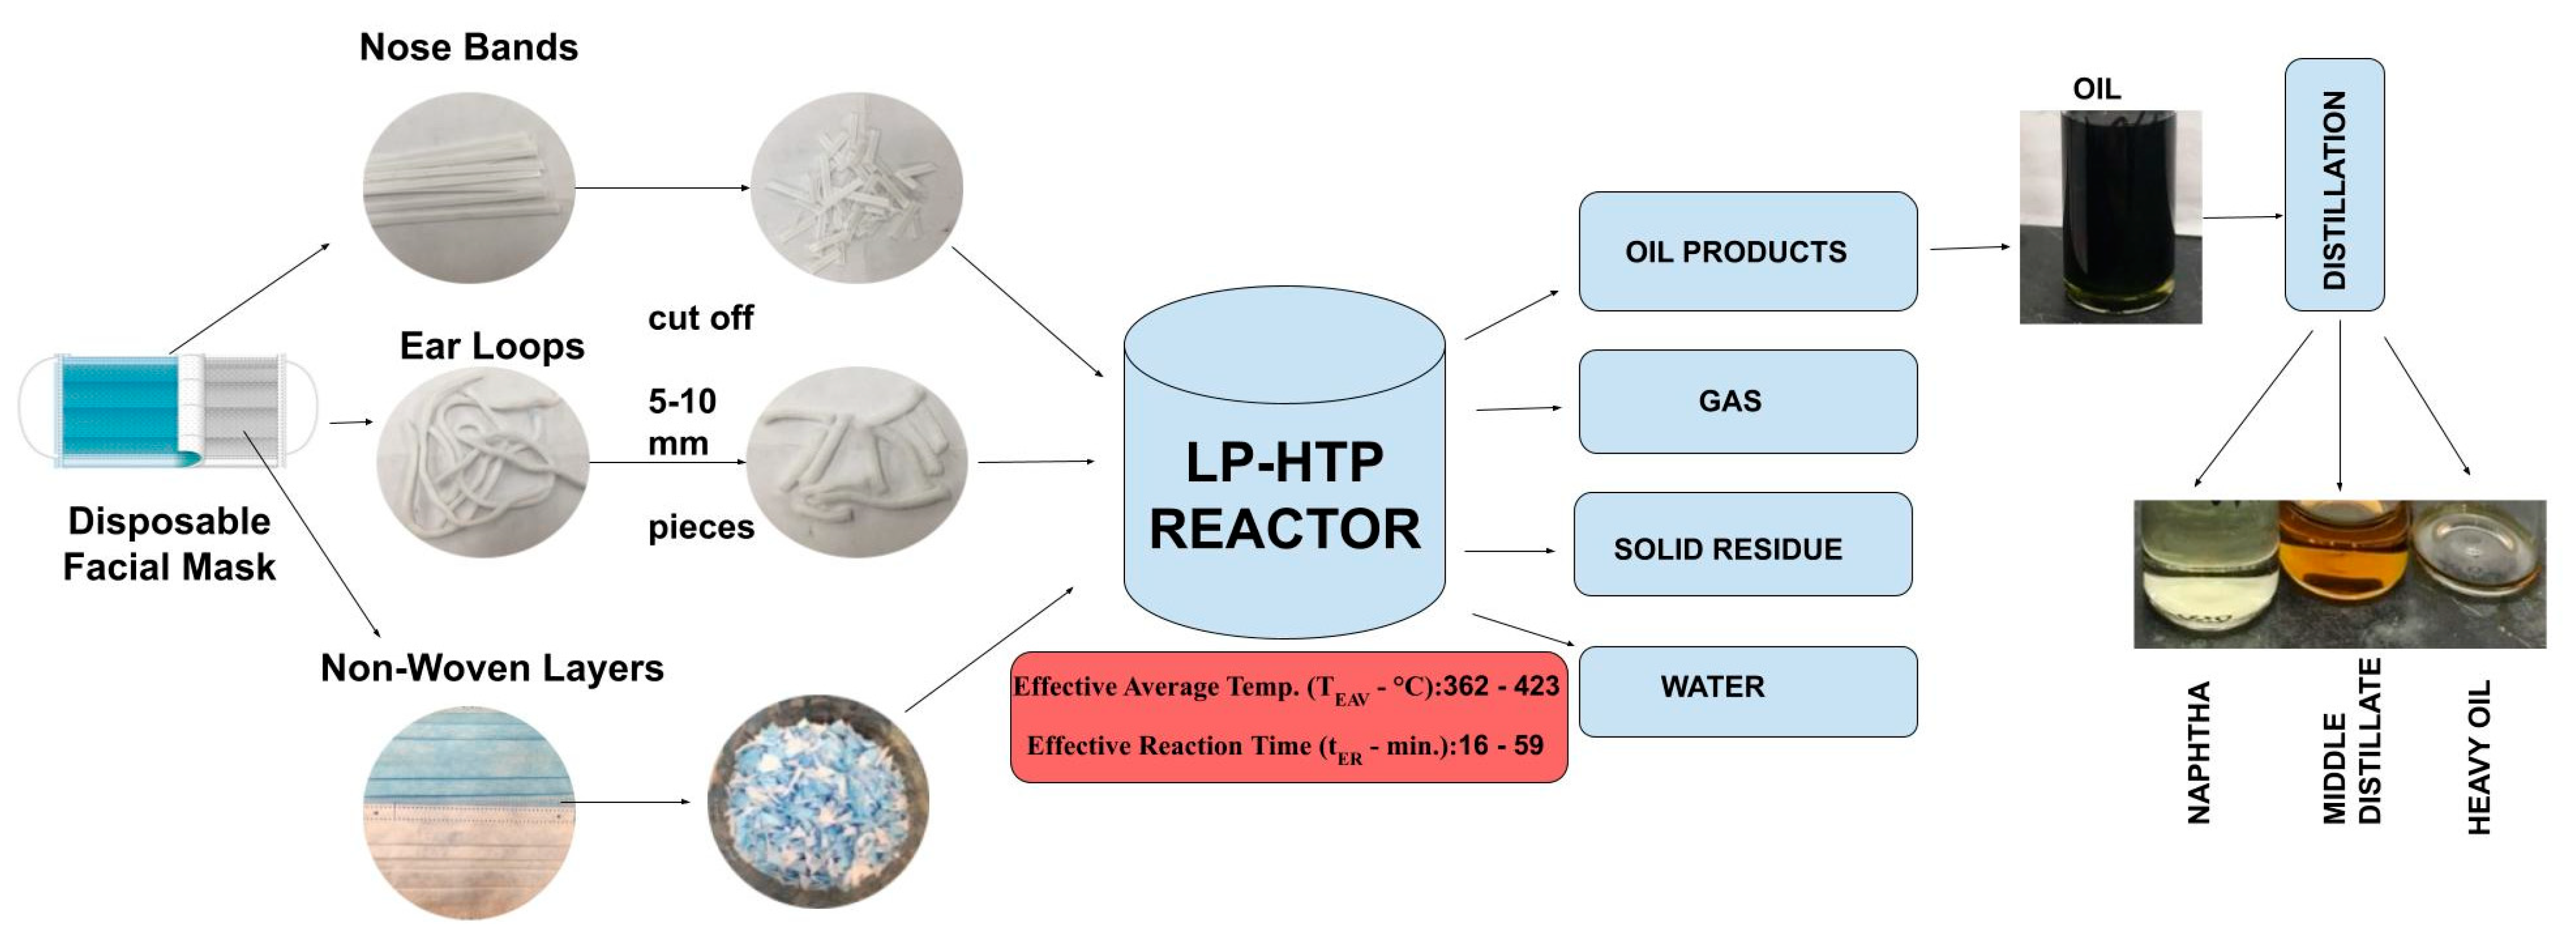
2.1. Feedstocks

This study used disposable 3-ply face masks purchased from Daycon Essentials. The structure of a full face mask (FM) is composed of three key components: the non-woven (NW) mask body, the nose band (NB), and the ear loops (EL). Each full mask (FM) weighed, on average, ~3 g. The weight ratio and chemical compositions of each mask component are given in Table 2.
For the LP-HTP process, water was acquired from a Milli-Q water purification system. To compare the hydrocarbon composition of produced oils to commercial fuels via GC-FID analysis, commercial gasoline and diesel samples were purchased from a local Speedway gas station in West Lafayette, IN, USA.

2.2. Reactor Equipment

The LP-HTP conversion experiments were performed in a 500-mL Parr Type 4570 reactor (Parr Instrument Company, Moline, IL, USA). The reactor system consisted of a cylindrical reactor vessel with an internal diameter of 6.34 cm and an internal depth of 16.8 cm, a magnetic drive for stirring, a pressure gauge for pressure monitoring, a thermocouple within a thermowell for temperature monitoring paired with the Parr temperature controller, and a cooling coil. The reactor cylinder, head, and internal parts are made of Hastelloy C276, while the valves and external fittings are made of stainless steel. Heating was provided by an electric heater assembly that operated at 110 volts.

2.3. Experimental Methodology

For this study, Daycon Essentials disposable 3-ply face masks were carefully disassembled, and each component (Table 2) was cut into 1–2 cm pieces to test the LP-HTP conversion of the individual components. The experiments are labeled in Table 3 based on their respective experimental conditions and feedstocks.
For each experiment, 20 g of feedstock (Table 2) with 1 g of water were weighed and loaded into the Parr batch reactor. Prior to heating, the reactor was sealed and subjected to a triple nitrogen purge to eliminate any residual air. The reactions were then carried out at varying set temperatures of up to 450 °C for varying set times (Figure 2). The heating process took approximately 30–45 min to heat from room temperature to each desired set temperature. After maintaining the set temperature for a specified set time, the reactor was cooled down to room temperature using forced air convection, which took approximately 90 min. Stirring at 300 RPM was maintained, and system temperatures and pressures were monitored and recorded throughout the entire procedure.
In most previous studies on plastic waste processing, the heating and cooling phases are assumed to have a minimal impact on the final yields [28]. However, in this study, the face mask and its components are much thinner than previously studied pellets [20]. Preliminary experiments indicated that conversion could be completed before the set temperature (Ts) was reached. For this reason, the entire temperature history of each experiment is considered in the analysis of the results. An example of the entire temperature history is described in Figure 2.
The variable descriptions for Figure 2 are given below.
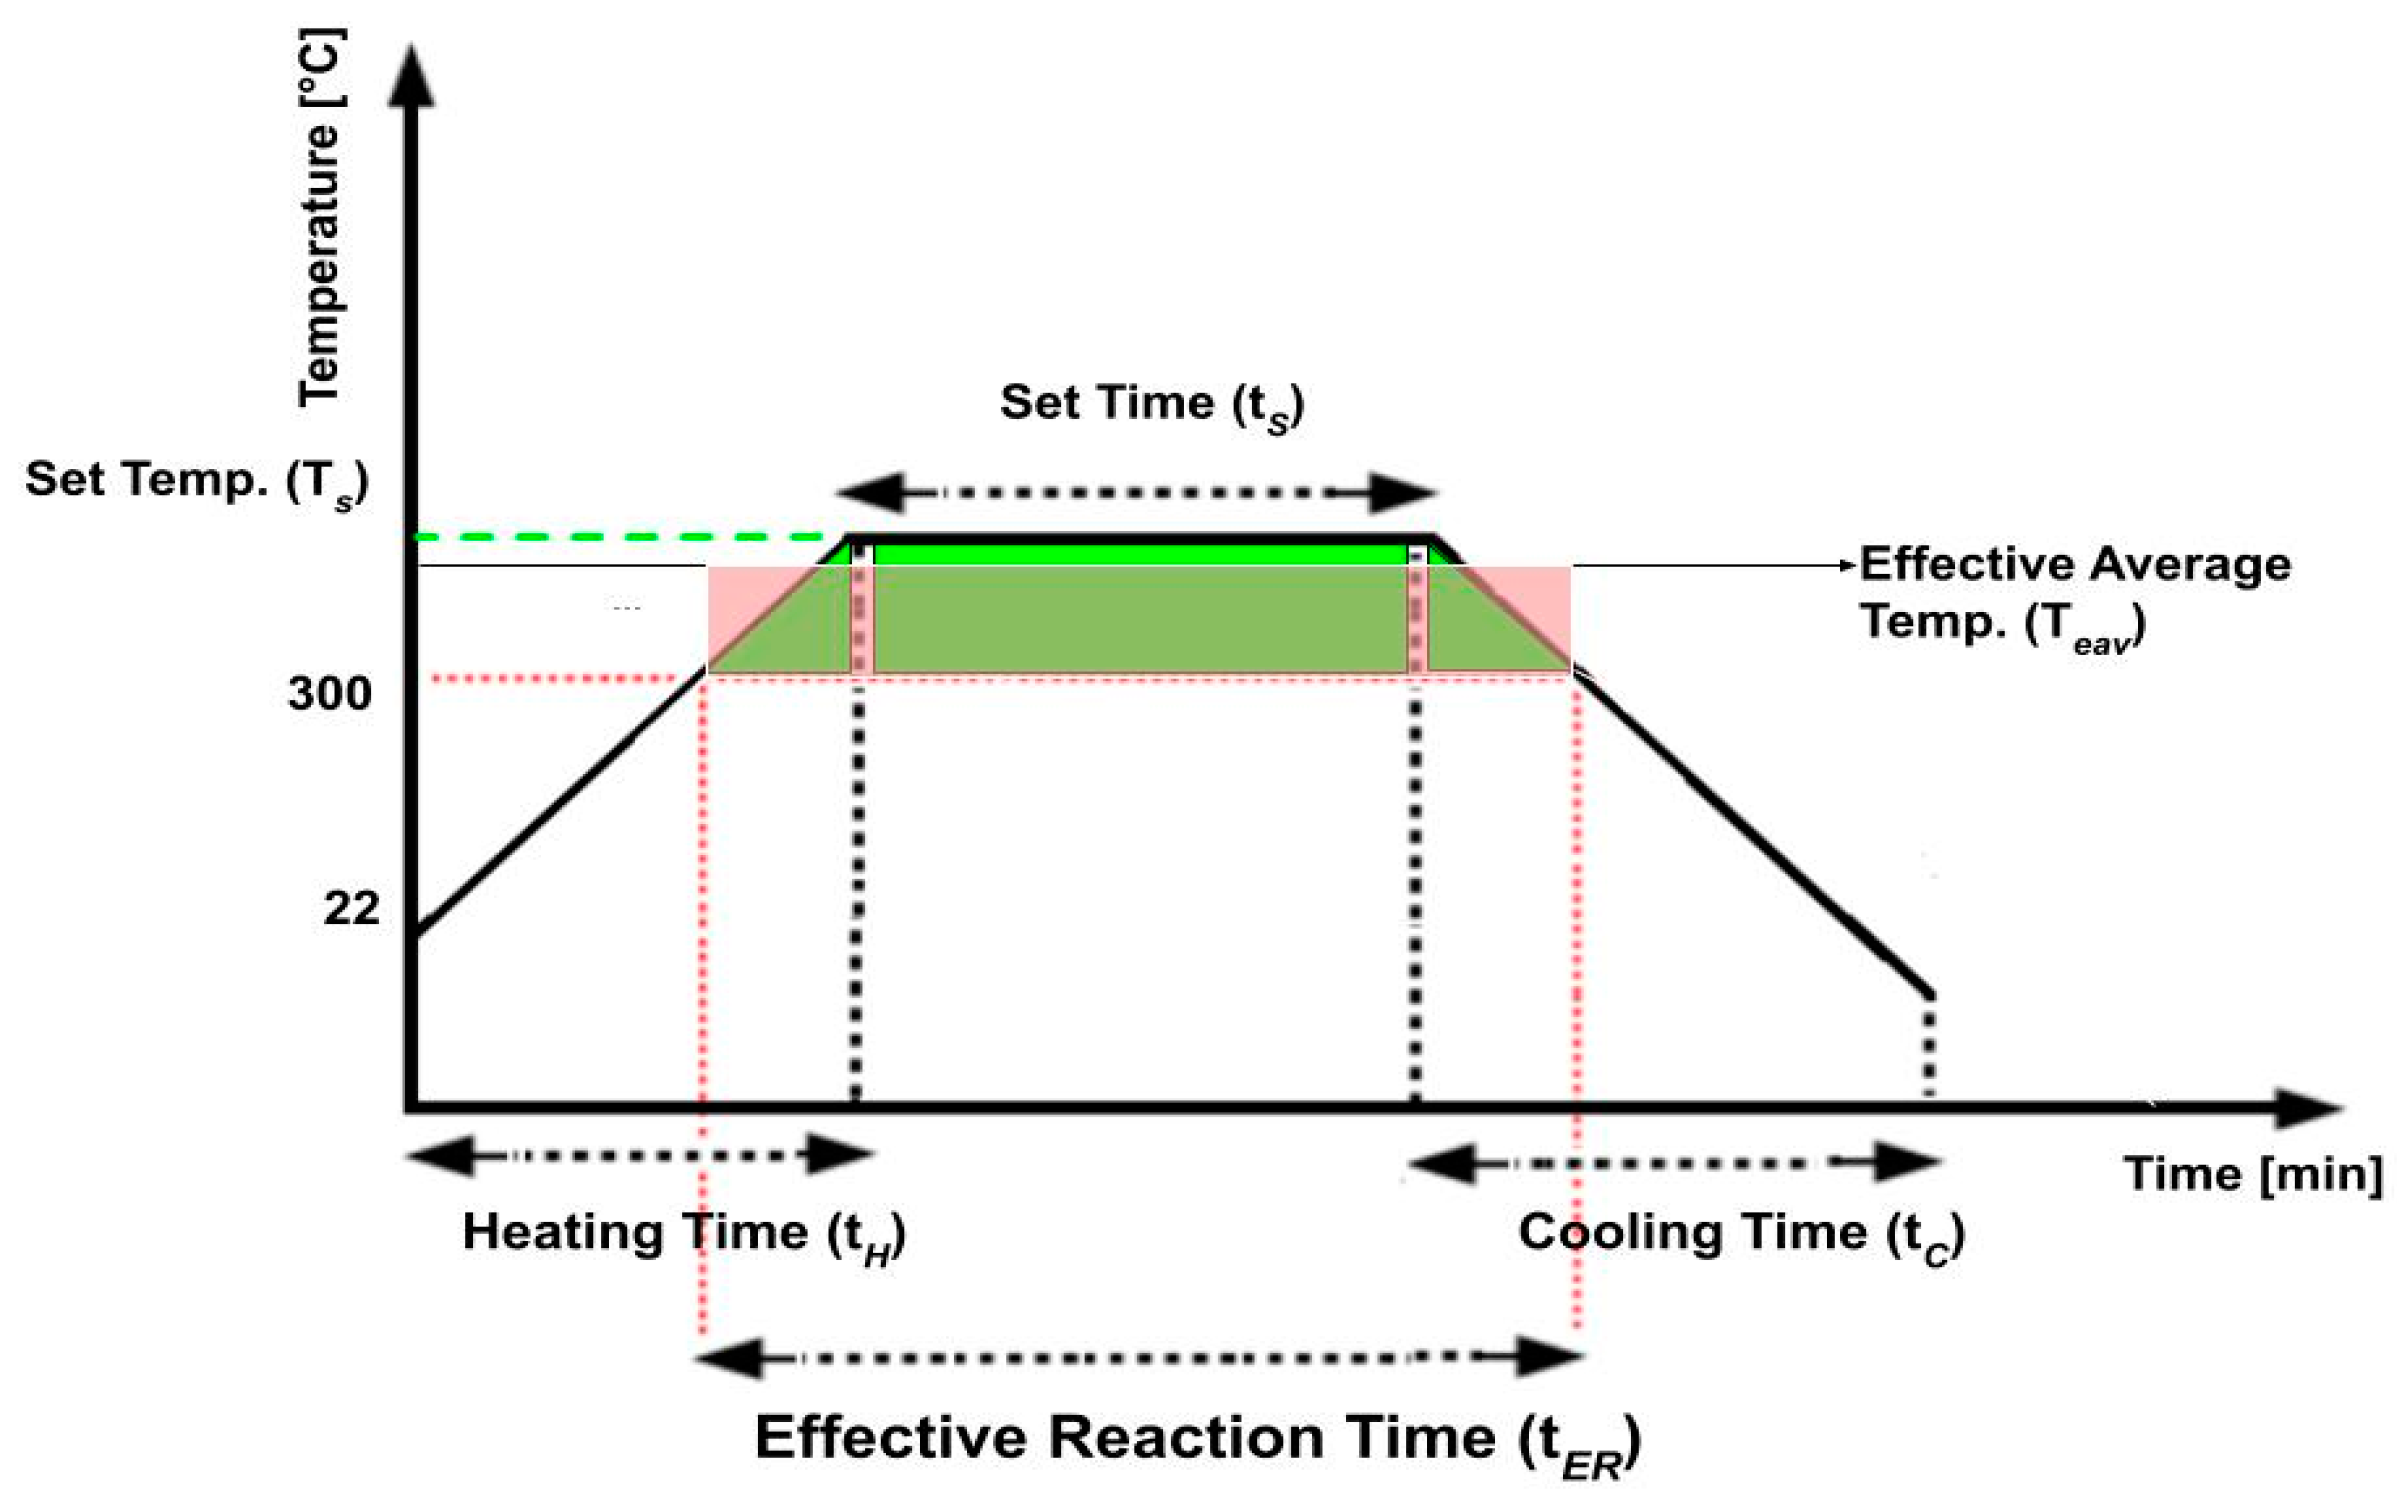
  • Set Temperature (Ts): The temperature to which the feedstocks will be heated to for depolymerization.
  • Set Time (tS): The duration for which the process is operated at the designated set temperature.
  • Heating Time (tH): The time period during which the material is actively heated to reach the desired set temperature.
  • Cooling Time (tC): The time period during which the material is allowed to cool down after the desired set time.
  • Effective Reaction Time (tER): The time period during which the material depolymerized and conversion occurred. Based on preliminary experiments, no reaction was observed below 300 °C. Therefore, 300 °C was specified as the minimum temperature for conversion.
  • Effective Average Temperature (TEAV): The average temperature for conversion throughout the entire effective reaction time (tER). This average temperature is calculated by dividing the area under the temperature profile (shown in green) by the effective reaction time (Figure 2), such that the area under the average temperature profile (shown in red) is equal to the green area.

2.4. Analysis of Liquid Products

2.4.1. Yield Calculation

Gas pressures after the reaction were measured at room temperature to determine the gas yields using ideal gas approximations. The solid yields of wax or char were calculated via direct mass measurements after drying. The oil yields were subsequently calculated using the difference, based on the mass of feedstock used and the measured yields of gas and solid products [19,20].

2.4.2. Distillation

Oil was distilled using a one-stage batch distillation apparatus based on the ASTM D86 standard [20,29]. The oils were separated into three distinct fractions: naphtha (20–170 °C, C4–C13), middle distillate (170–300 °C, C14–C25), and heavy oil (>300 °C, C26+). All fractions were weighed at room temperature.

2.4.3. GC-FID

GC-FID analysis of the oil fractions recovered following batch distillation was conducted using a Shimadzu GC-2010 gas chromatography system paired with an autosampler and flame ionization detector (FID). The detailed method utilized for this analysis is shown in Supplementary Table S1.

2.4.4. GCxGC-FID

The raw oils recovered following LP-HTP, as well as the oil fractions recovered following batch distillation, were analyzed via LECO QuadJet SD comprehensive two-dimensional gas chromatography (GCxGC) system (LECO Corporation, St. Joseph, MI, USA) configured with cryogenic LN2 cooling, an L-PAL3 GC autosampler, a flame ionization detector (FID), and ChromaTOF SD data processing software. The compounds’ classification was established following the methodology outlined in previous literature [30]. The weight percent (wt.%) was determined for carbon numbers ranging from C5 to C31 for each hydrocarbon class (e.g., n-paraffins, isoparaffins, cycloparaffins (including mono-, di-, and tri-cycloparaffins), as well as aromatics (including alkylbenzenes, cycloaromatics, alkylnaphthalenes, and biphenyls)). It is important to note that the GCxGC-FID method cannot distinguish between olefins and cycloparaffins.
To address this limitation, both olefins and cycloparaffins were collectively categorized and referred to as “olefins and cycloparaffins” throughout the analysis. The hydrocarbon content was quantified using the data obtained from GCxGC-FID analysis in accordance with the technique outlined in previous literature [31]. The detailed contents of these analytical methods and results are shown in Supplementary Tables S2 and S3.

3. Results and Discussions
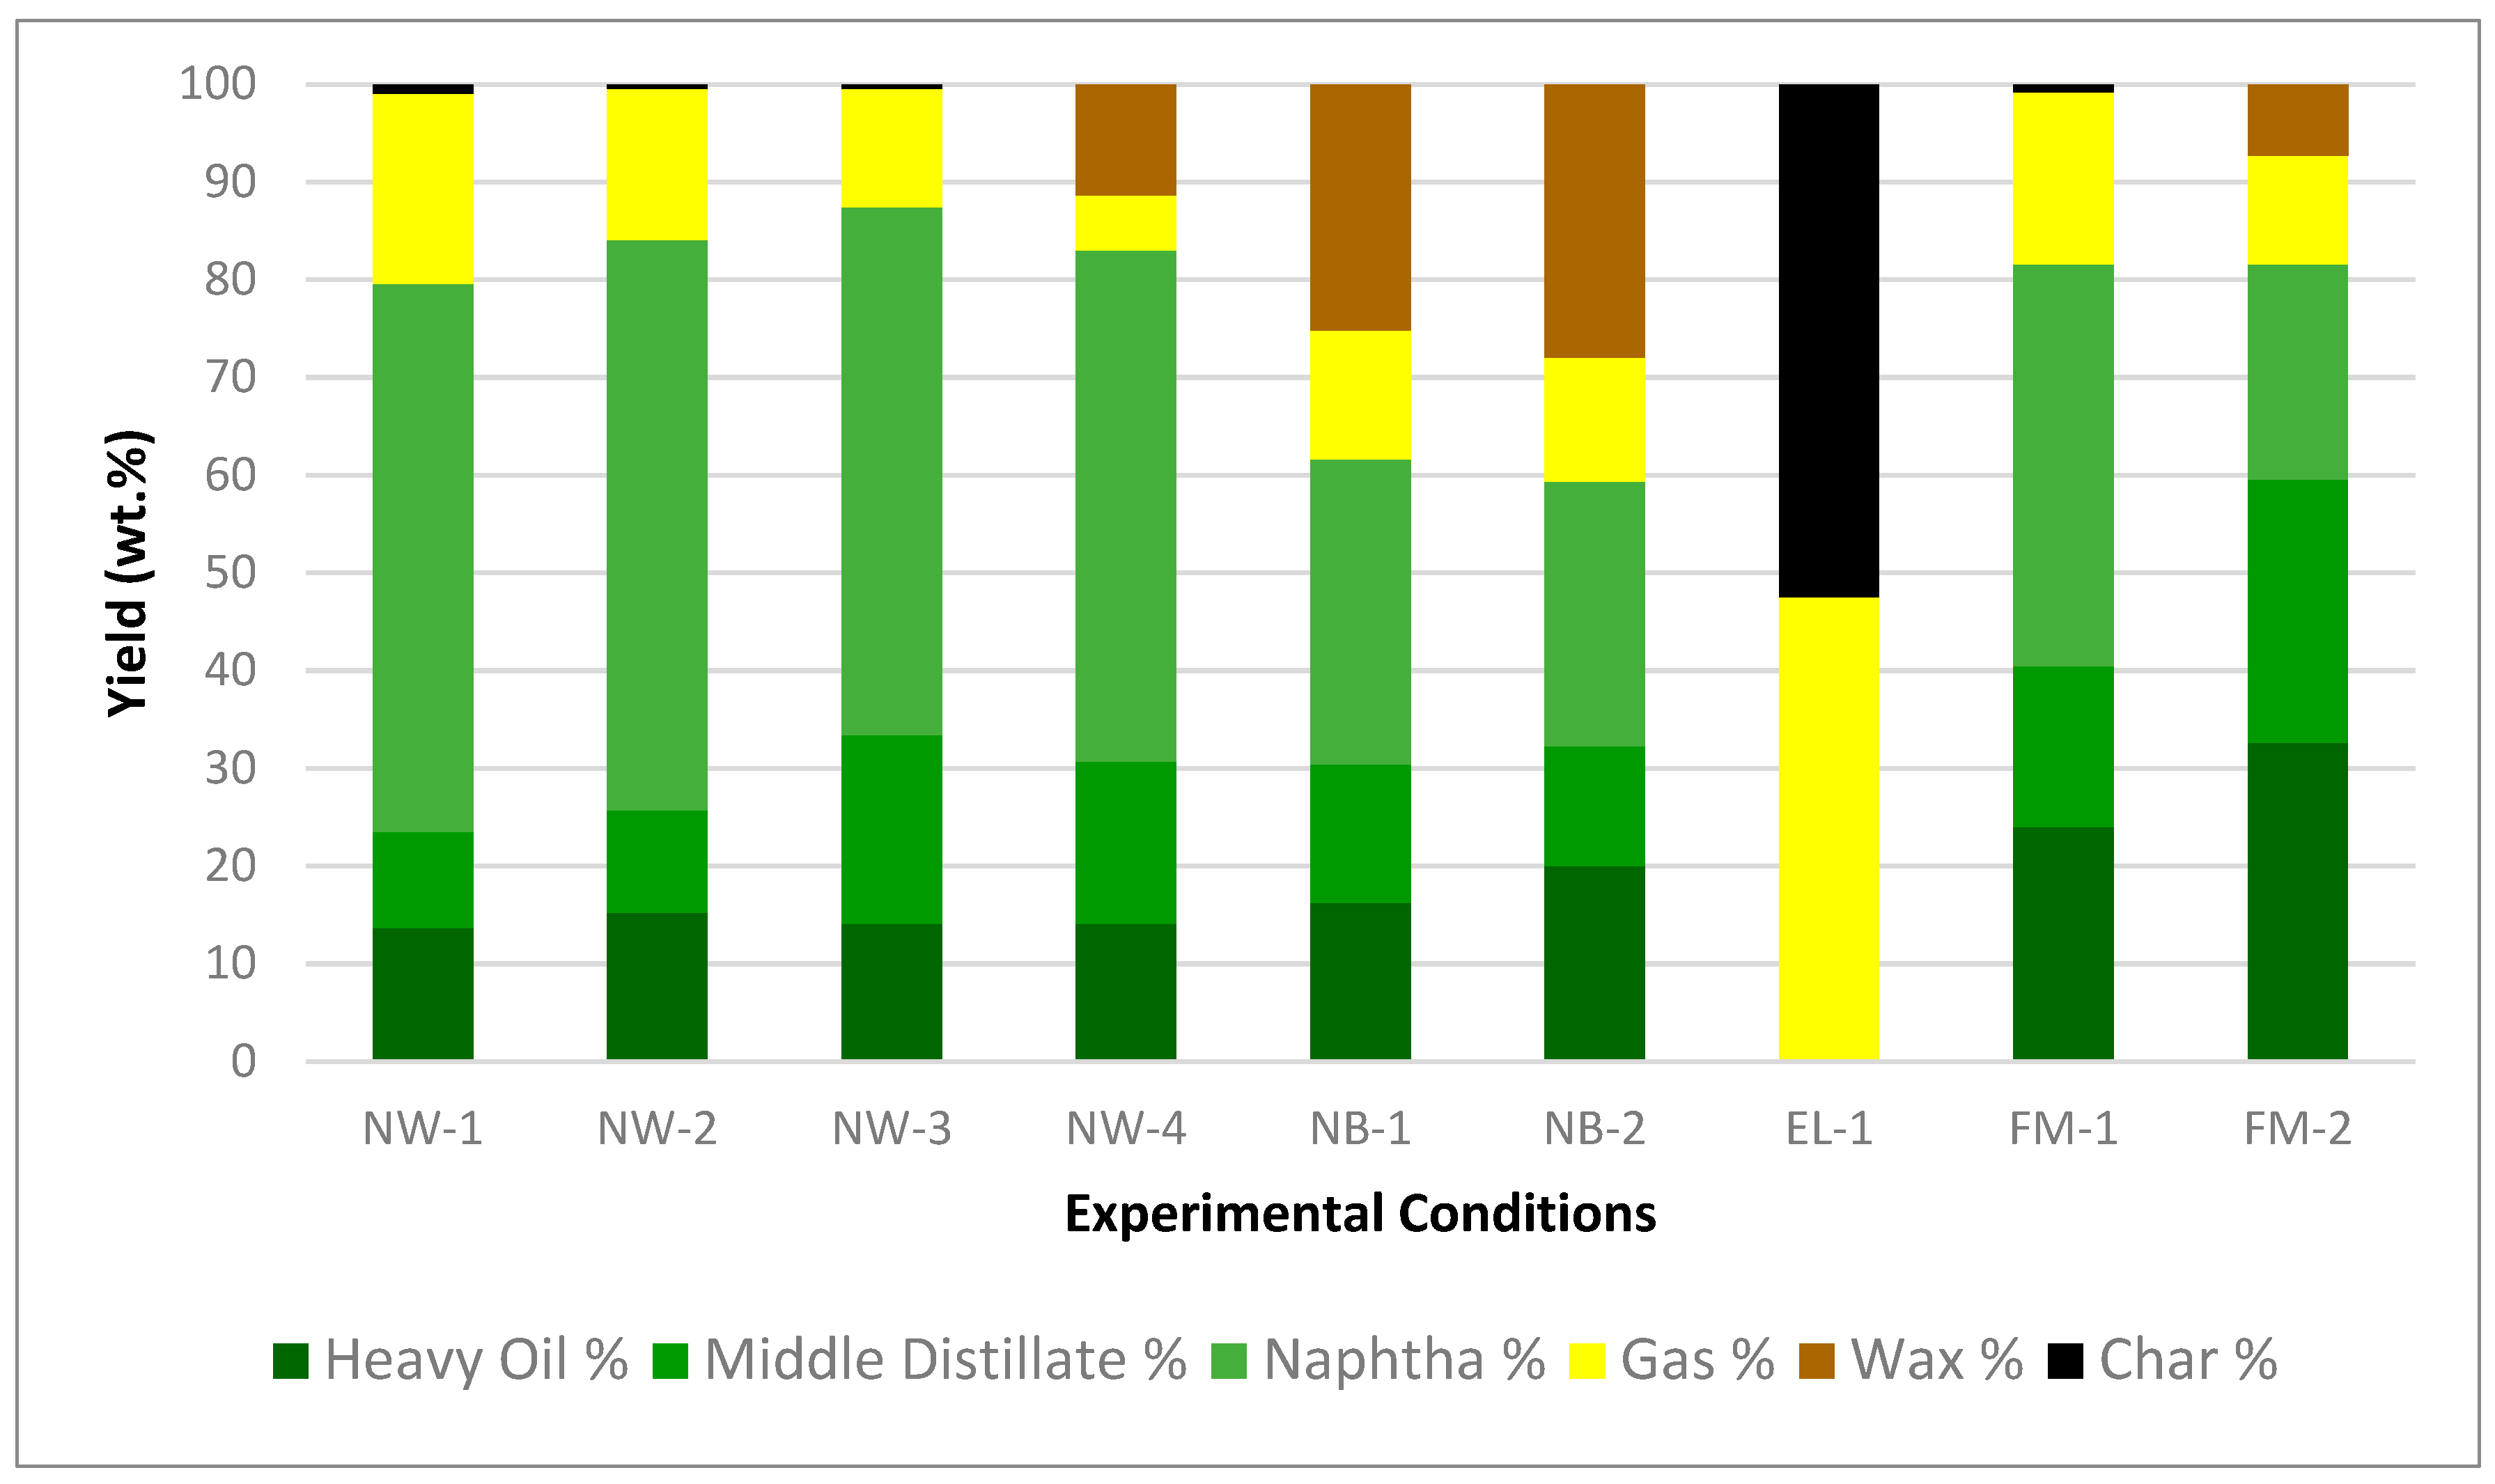
The experiments were conducted using various feedstocks of full face masks and their separated parts and at various reaction temperatures and times. These reactions were conducted to study the effects of different feedstocks and reaction conditions (Table 3) on producing oils, which can be further separated into naphtha (C4–C13), middle distillate (C14–C25), and heavy oil (C26+) fractions. Examples of temperature and pressure histories are shown in Supplementary Figure S1.

3.1. Product Yields

In Table 3, experimental conditions and product yields are listed. Results from previous literature [20] are included for comparison and labeled as “KJ”, as the study featured the conversion of standard PP and HDPE pellets under similar conditions.
For the NW experiments, no conversion was observed below 300 °C. Among the NW experiments, NW-3 achieved the highest oil yield at 87%, which is similar to the highest oil yields obtained from LP-HTP conversion of PP (KJ-1) pellets [20]. However, our study had an average temperature of 392 °C, whereas KJ-1 had a higher average temperature of 428 °C. This difference can likely be attributed to the thickness of the feedstock. KJ-1 used PP pellets (2 mm thickness), while our study utilized thinner non-woven PP layers (1 mm thickness). Following NW experiments conducted at a set temperature of 400 °C, wax was observed due to the lower effective average temperature. An increase in effective average temperature and effective reaction time led to higher gas yields and lower wax yields, which is similar to the results of literature studies using pyrolysis or SWL [19,22,32].
NB feedstocks (HDPE) resulted in higher wax yields and lower oil yields compared to NW feedstocks (PP) under similar reaction conditions. This is due to the more robust nature of HDPE compared to PP, as shown from previous studies using pellets [20]. Furthermore, the thinner fibrous NW may convert more easily than the thicker NB feedstock. NB-1 has a higher oil yield than NB-2 because of a higher average temperature and a longer effective reaction time.
For EL experiments, unreacted solid was observed with low-temperature conversion below 300 °C (EL-2). Formation of gas and char was readily observed at an average temperature of 385 °C for 19 min (EL-1), likely because of the more fragile structure of the polycondensation polymers used (Polyester, Spandex) compared to polyaddition polymers (PP, HDPE).
For FM, the highest oil yield of 82% (FM-1, Table 3) is lower than that of NW-3, 87%. While the two experiments have similar reaction conditions, FM contains 7.9% more robust HDPE (Table 2), while NW is only PP. If the conversion reactions for HDPE, PP, and Polyester + Spandex in FM occur independently, theoretical yields (FM-Theoretical, Table 3 and Supplementary-Figure S2) can be estimated based on their respective weight fractions. While FM-Theoretical predicted a 7% char yield, FM-1 only produced 1% char. The NB and EL components were dispersed throughout the NW feedstock. This dispersion may have helped to reduce char formation from 7% to 1% while increasing oil yield from 75% to 82%. To experimentally confirm these product yields from FM-1, three total runs of FM-1 were conducted. The product yields of each FM-1 run are shown in Supplementary Table S4.
In our previous studies, conditions for converting HDPE and PP pellets were optimized to achieve 87% and 91% oil yields, respectively [19,20]. The 87% oil yield (NW-3) obtained from the NW feedstock made of PP is similar to the 91% oil yield previously observed [19,20]. Knowing the maximum oil yields of 87–91% from previous studies converting polyolefin pellets and that 89% of the full face mask used is made up of polyolefins, the 82% oil yield (FM-1) obtained from face masks in this study is similar to a predicted maximum oil yield of 81% based on the previous studies [19,20]. Therefore, we expect that the conditions for converting face masks to 82% oil yields should be close to the optimal conditions for maximizing oil yields from face masks. However, further studies are needed to confirm the optimal conditions.
The compositional data obtained from the experiments are presented in Figure 3, illustrating the wax, char, gas, and oil yields, as well as the ratios of naphtha, middle distillate, and heavy oil obtained from the distillation process. The weight fractions of these distilled oils are shown in Supplementary Table S5.
For NW-1 to NW-4, increasing the effective average temperature and effective reaction time leads to higher gas yields and lower wax yields. The wax residue in NW-4 is caused by lower reaction temperature and time compared to NW-1 to NW-3. The wax is converted into oil and gas with increasing temperature and time. The highest oil yield of 87% is achieved after conversion at an average temperature of 392 °C for 25 min (NW-3). Naphtha yields increased from 52% to 58% with increasing temperature and time from NW-4 to NW-2.
For NB-1 to NB-2, increasing the reaction temperature and time resulted in higher oil and naphtha yields and lower wax yields. For EL-1, the fragile Polyester and Spandex convert mostly to gas and char. For FM-1 to FM-2, increasing the reaction temperature and time resulted in higher naphtha yields and lower wax yield.
The thinner NW resulted in higher oil and naphtha yields than the thicker NB and EL. The thinner NW was heated and subsequently converted more efficiently. However, the reaction temperature and time, polymer type, and the presence of water are all more important factors affecting yields compared to feedstock shape. Furthermore, the FM made of mixed polymers produced lower overall oil and naphtha yields compared to NW. The results indicated that the varying polymer types, feedstock compositions, and particle sizes have significant impacts on the conversion process and recovered products.

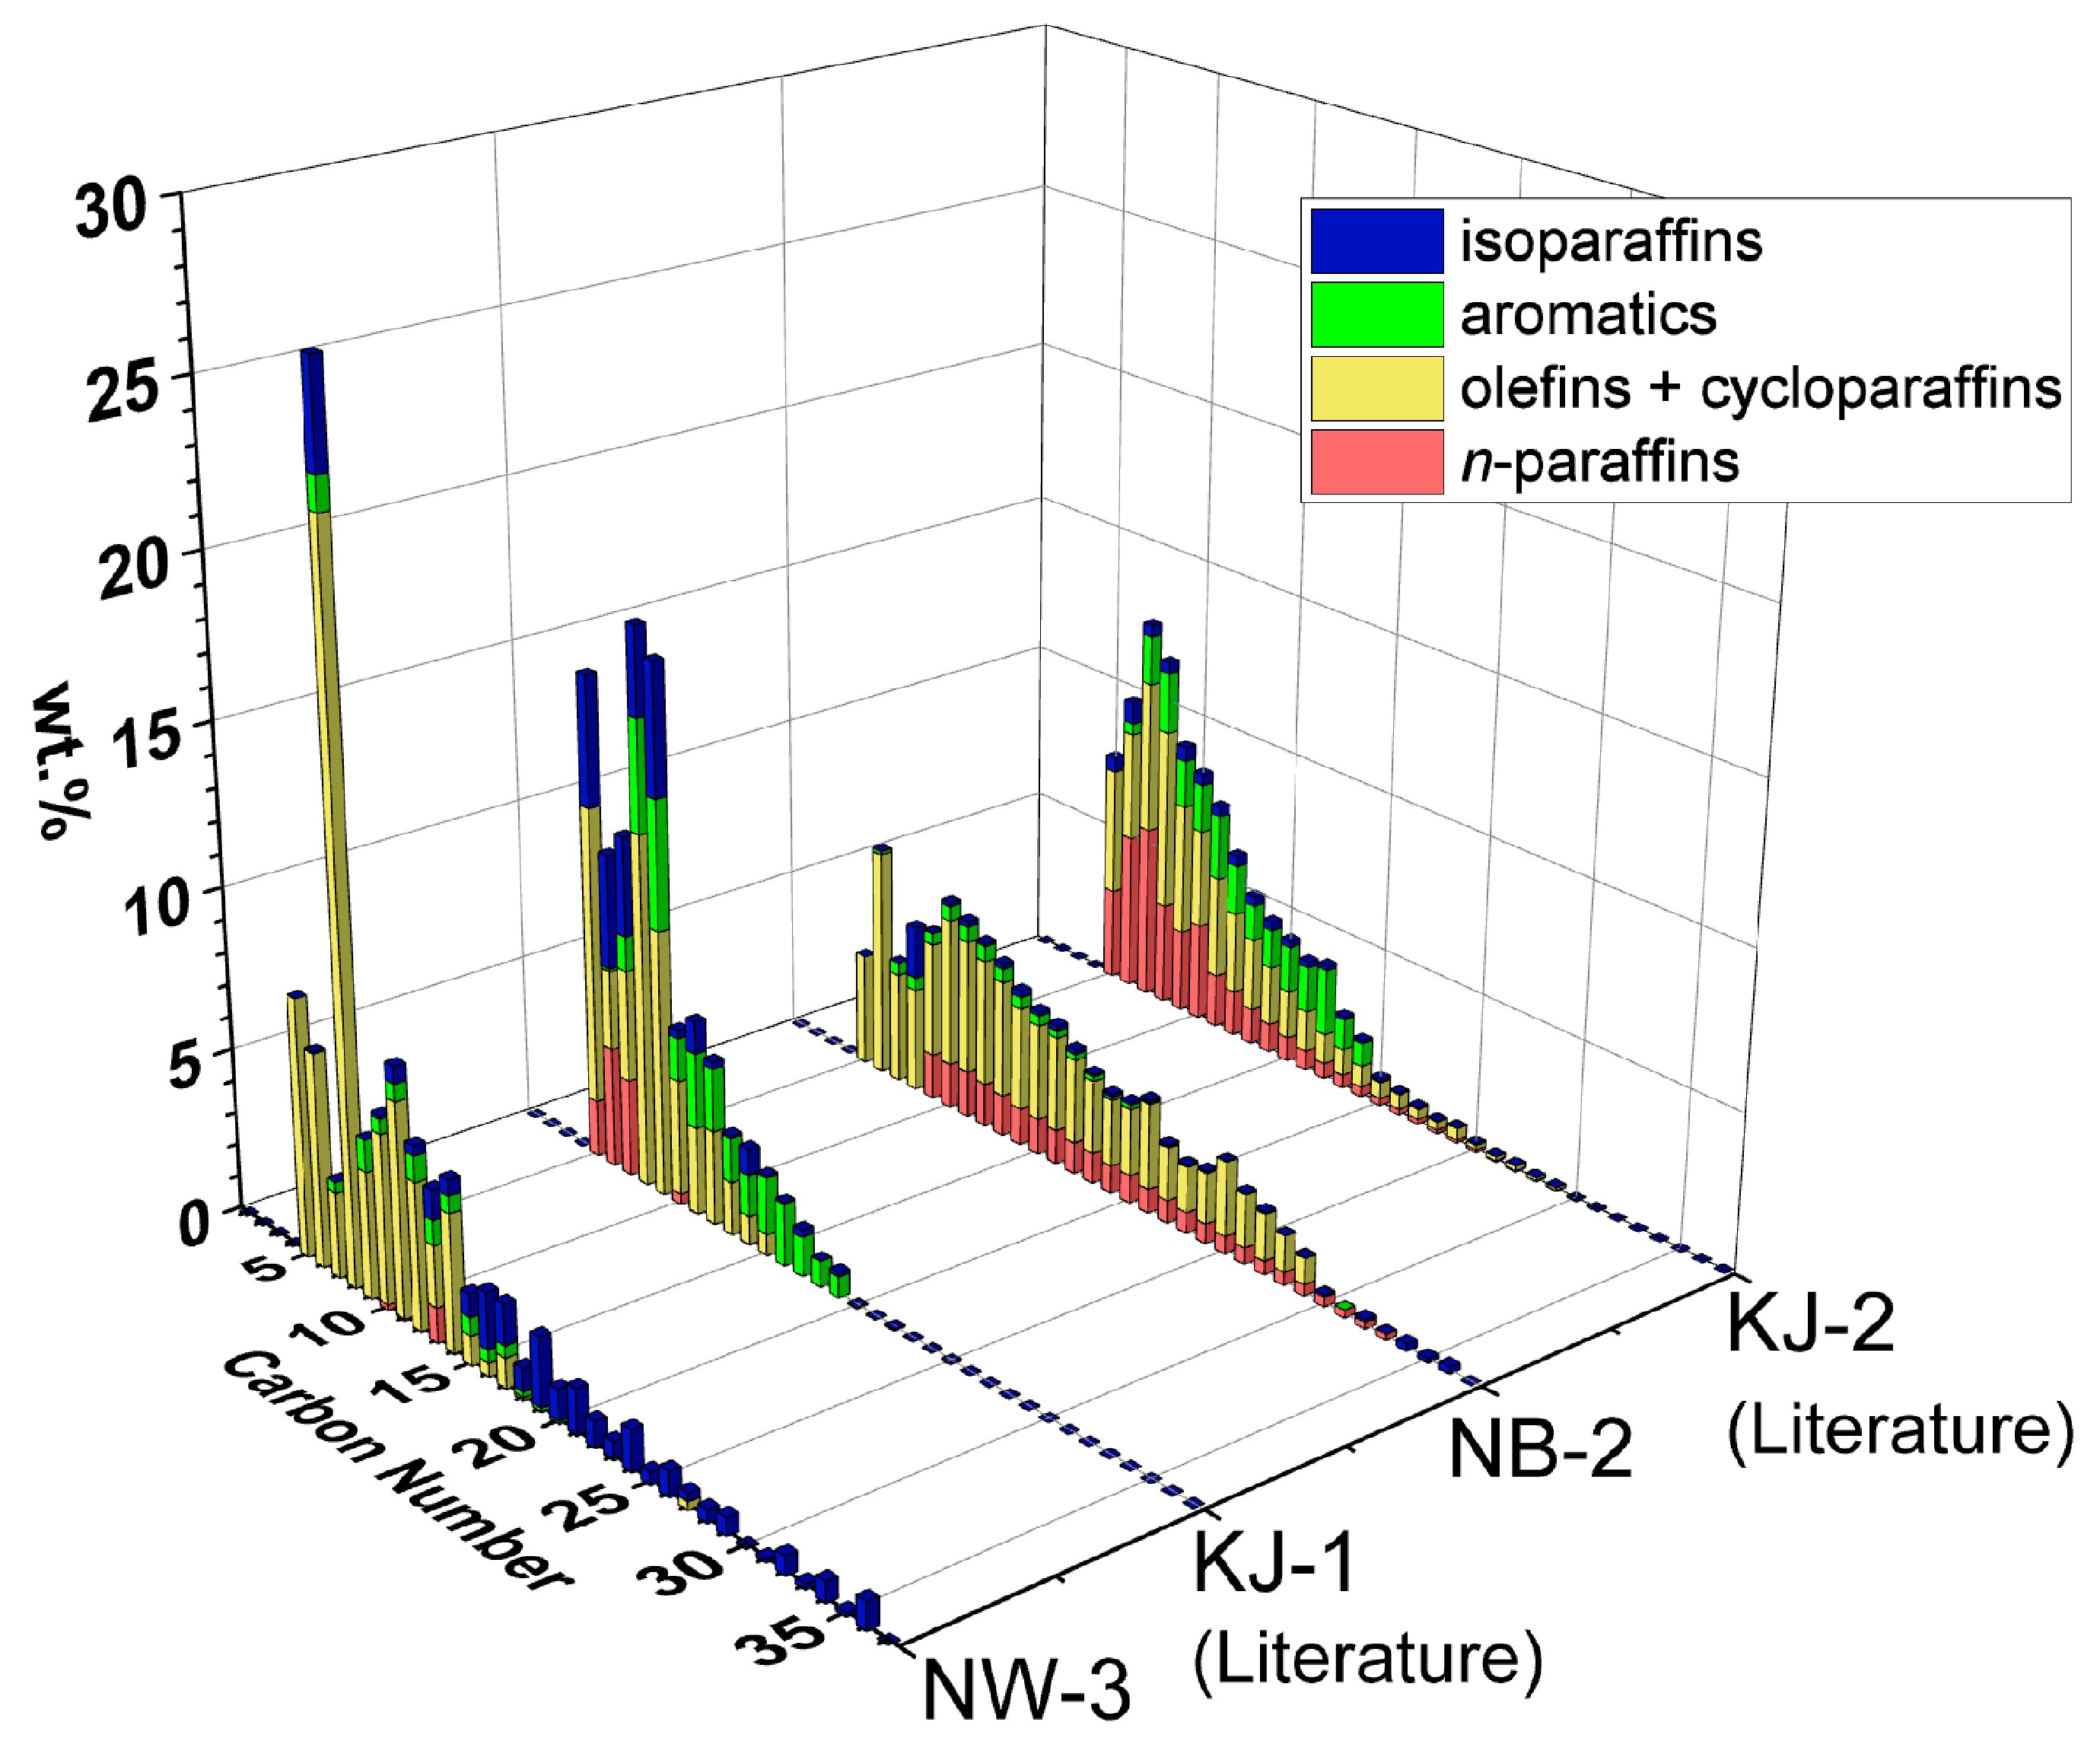
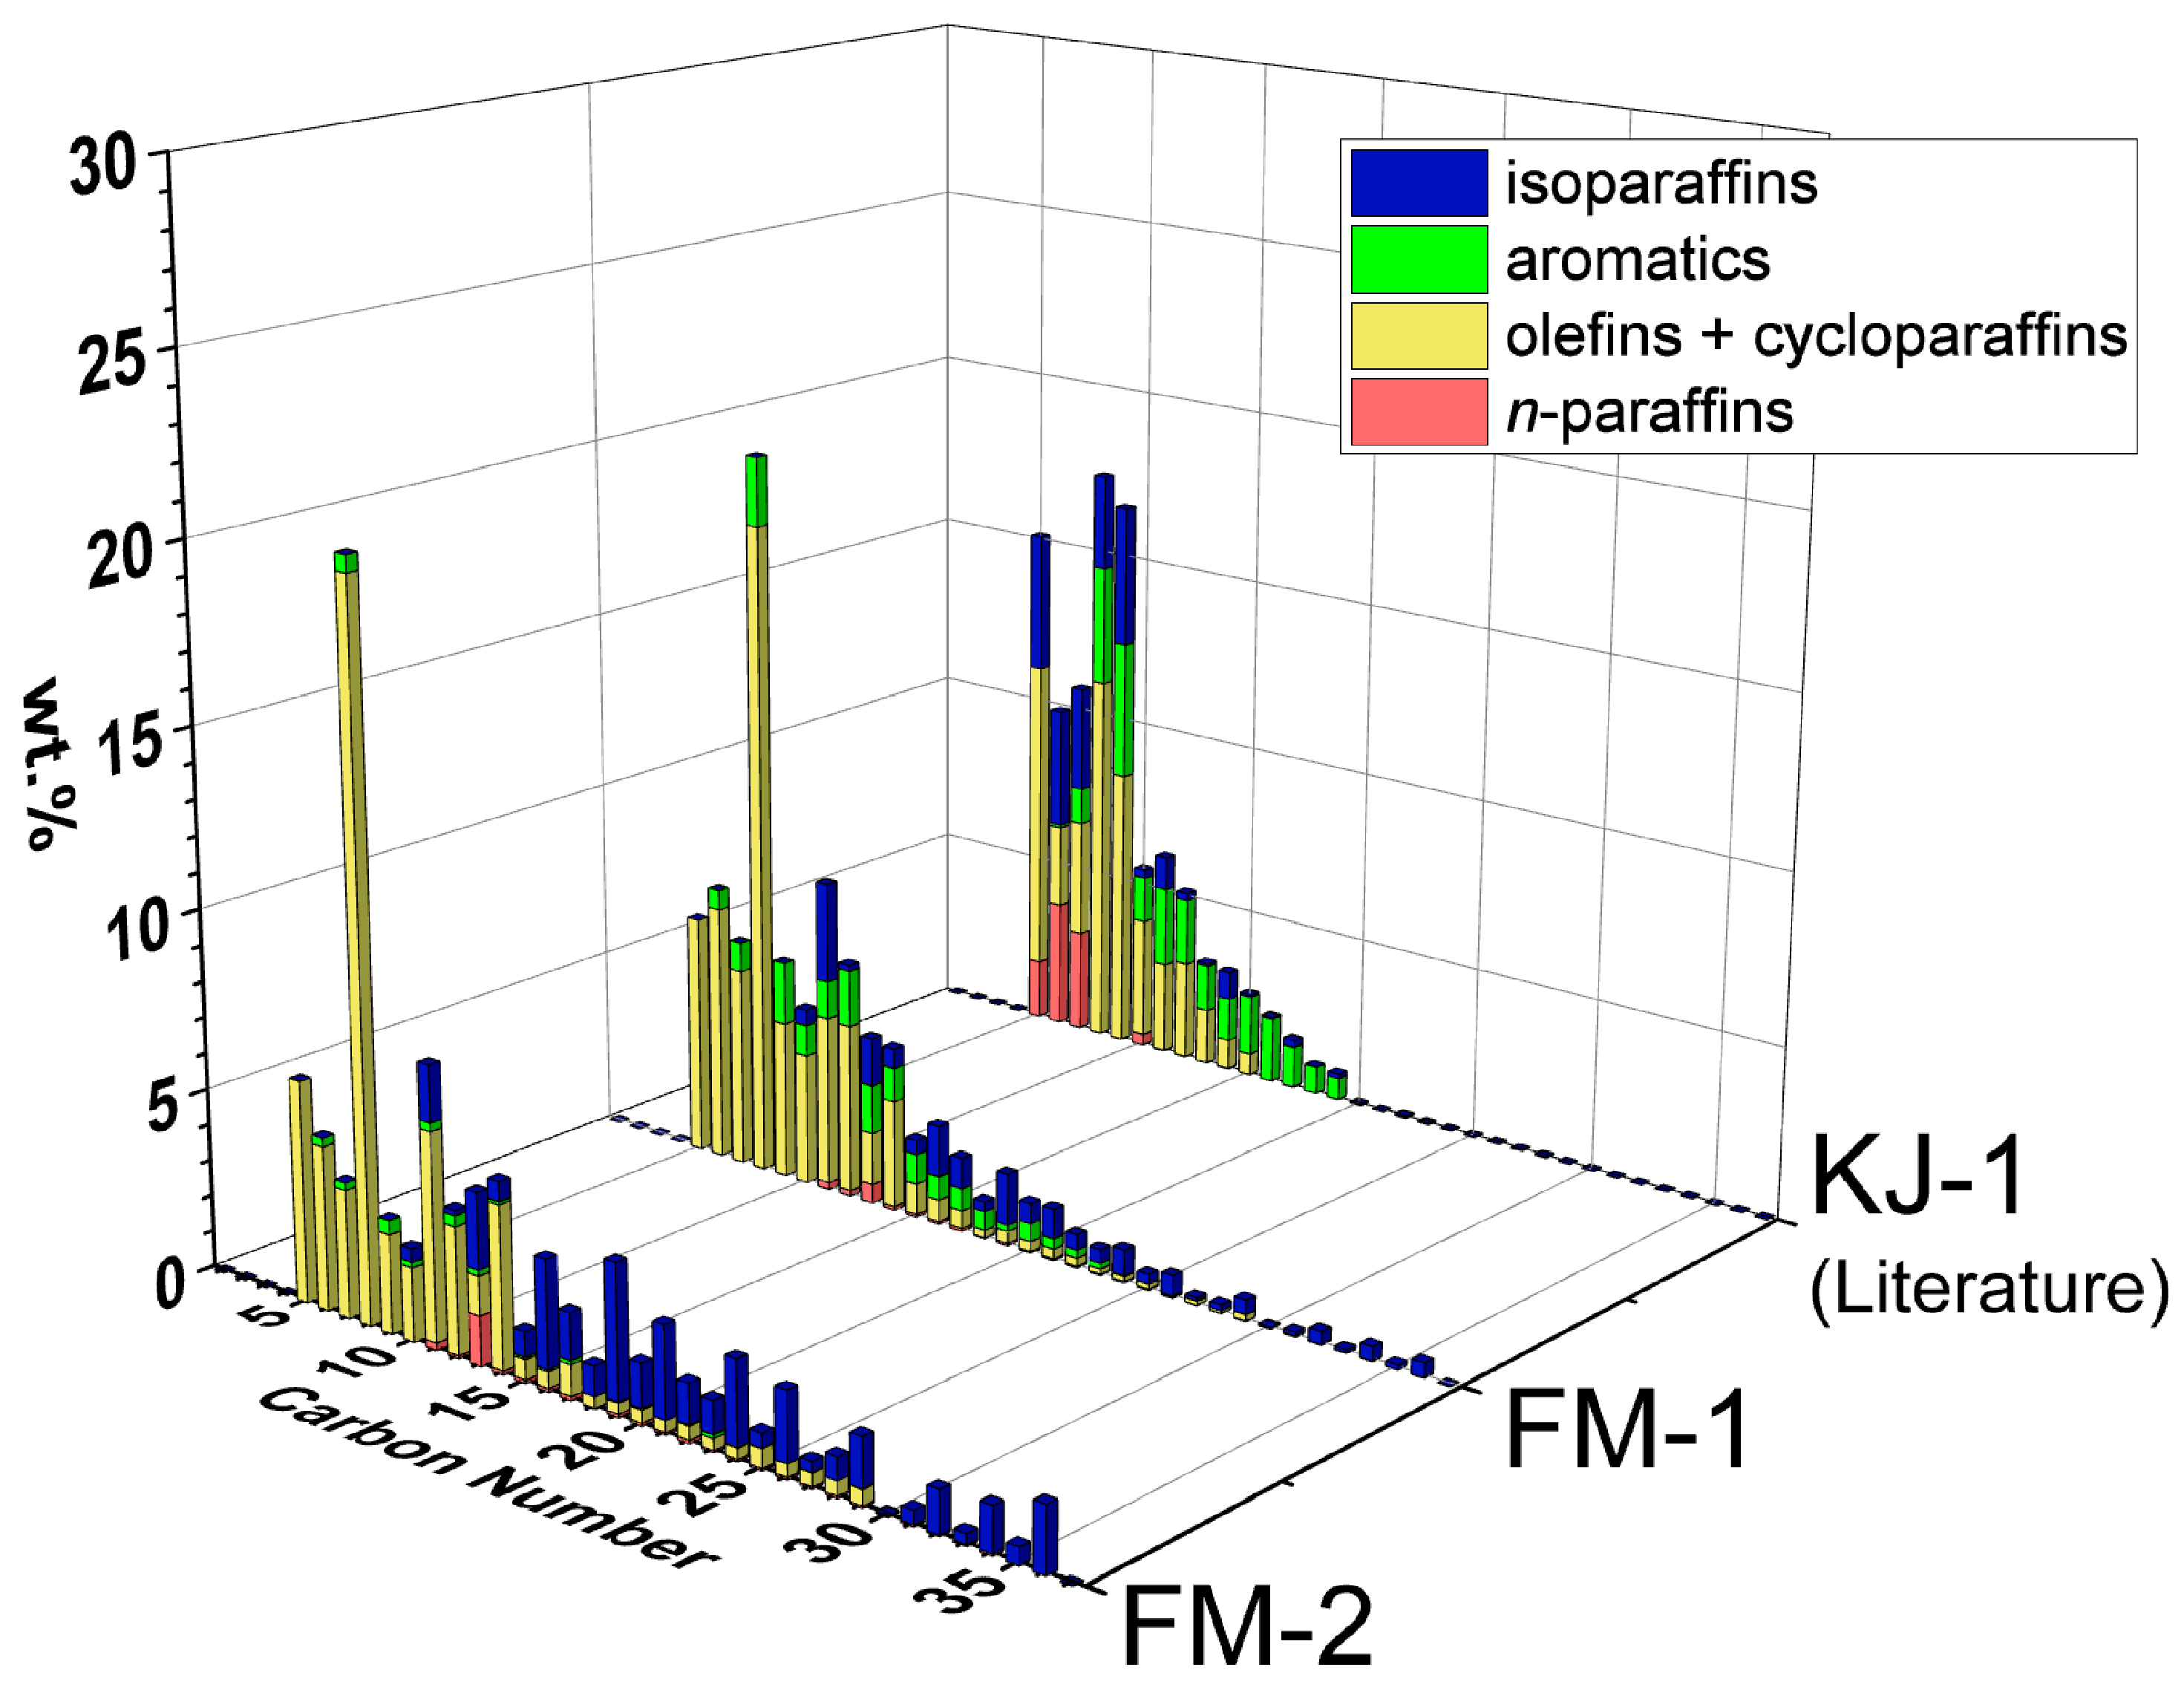
3.2. Chemical Compositions

Figure 4 shows the detailed compositions, carbon number distributions and hydrocarbon types obtained from GCxGC-FID of oil from NW-3 and NB-2. These are compared with the literature results of KJ-1 (PP pellets) and KJ-2 (HDPE pellets), respectively.
A comparison of NW-3 and KJ-1, both being PP feedstocks, shows a similar chemical composition of mostly olefins + cycloparaffins (yellow) and isoparaffins (blue). However, NW-3 has a larger carbon number range and lower aromatic (green) content than KJ-1. This result can be explained by reaction pathways reported previously [20]. With increasing temperature and time, these heavier isoparaffins are expected to convert to lighter isoparaffins, olefins + cycloparaffins, and aromatics.
A comparison of NB-2 and KJ-2, both being HDPE feedstocks, shows a similar chemical composition of mostly olefins + cycloparaffins and n-paraffins (red). However, NB-2 has a larger carbon number range and lower aromatic content than KJ-2. This result can be explained by reaction pathways reported previously [20]. With increasing temperature and time, these heavier hydrocarbons are expected to convert to lighter n-paraffins, olefins + cycloparaffins, and aromatics.
Figure 5 compares the detailed compositions, carbon number distributions and hydrocarbon types obtained from GCxGC-FID of oil from FM-1 and FM-2 with those of KJ-1 (PP pellets).
A comparison of FM-2 and FM-1 shows similar compositions of mostly olefins + cycloparaffins (yellow) and isoparaffins (blue). FM-1 has a higher average temperature and reaction time compared to FM-2, resulting in less heavy oil (C26+) and higher contents of aromatics (green) and olefins + cycloparaffins (yellow). This result can be explained by the PP reaction pathways reported previously [20]. Comparing FM-1 and KJ-1 shows how the carbon number range can be further reduced by increasing temperature and time. The GC-FID results of naphtha and middle distillate, obtained from the distillation of NW experiments, were compatible with the GCxGC-FID results, as shown in Supplementary Figures S3–S7.

3.3. Energy Consumption, GHG Emissions, and Potential Impacts

Estimations of energy inputs, energy outputs, and GHG emissions of LP-HTP methods for face mask conversion were compared to those for conventional methods of incineration and landfilling of face masks. In LP-HTP, the net energy output is 41.73 MJ/kg face masks. This high net energy gain is from the embodied energies of valuable oils and gases. This net energy gain is 3.4 times higher than that from incineration (12.27 MJ/kg face masks), while landfilling requires a net energy input of 0.38 MJ/kg face masks [11,33]. Furthermore, the GHG emissions of LP-HTP methods are similar to those estimated in previous studies, 0.1 kg CO2/kg face masks [20]. LP-HTP methods can reduce GHG emissions by 95% compared to incineration and by 33% compared to landfilling. These net energy and GHG emission calculations can be found in Supplementary Table S6.
Further estimations of energy inputs, energy outputs, and GHG emissions of LP-HTP methods for face mask conversion were compared to methods used in the literature, such as SWL and pyrolysis of face masks. LP-HTP uses a lower water loading of 5 wt.% compared to the 64 wt.% water loading of SWL. The reduced water loading decreases required energy inputs by 79% and GHG emissions by 79%. Furthermore, respective oil and gas yields of 82% and 17% from LP-HTP compared to those of SWL (67% and 12%, respectively) result in a 52% higher net energy gain. While LP-HTP and pyrolysis have comparable energy inputs and GHG emissions, higher oil and gas yields compared to those of pyrolysis (81% and 10%, respectively) result in 9% higher net energy gains.
LP-HTP methods for face mask conversion offer a potential solution for reducing the accumulation of face masks and microplastics from face masks in the environment, air, landfills, and waterways. Based on yields of 82 wt.% oil, this method has the potential to convert the 5.4 million tons [9] of waste face masks produced yearly into 4.4 million tons of valuable oils. These oils can be used as feedstock for new face masks and other plastic products, promoting a circular economy.

4. Conclusions

This study aims to address the urgent issue of face mask waste accumulation in landfills and the environment. A single face mask can quickly release thousands of microplastic fragments into the air and water. It is imperative to develop a method to reduce this waste accumulation. While incineration, gasification, pyrolysis, and SWL methods have been studied for converting face masks to products, these methods have limitations in energy efficiency, GHG emissions, conversion conditions, and product yields. These limitations demonstrate the importance of this study.
In this study, LP-HTP methods were developed for converting face masks to oils. The oil compositions and yields of oil and gas depend on the feedstock polymer type, particle size and shape, and reaction temperature and time. The conditions of 401 ± 4 °C for 30 ± 2 min (FM-1) achieved the highest oil yield of 82% from the full face mask (Table 2). The LP-HTP oil yields are higher than those reported from pyrolysis (81%) and SWL (67%) of face masks. Furthermore, LP-HTP of the full face mask produces very little char (1%) compared to pyrolysis (9%).
The full face mask can be converted to achieve up to 41% naphtha yields. The face mask components can be separated to convert the non-woven mask body (PP) to obtain a higher naphtha yield of 58%. The conditions of 392 °C for 25 min (NW-3) were found to achieve the highest oil yield of 87% from the non-woven mask body. The detailed oil compositions showed higher aromatic contents and narrower carbon number ranges with increasing reaction temperature and time. The results of NW (PP) and NB (HDPE) experiments are consistent with previously reported reaction pathways for PP and HDPE pellets, respectively [20]. However, these thinner NW (PP) and NB (HDPE) feedstocks convert at lower average temperatures and times compared to thicker pellets.
LP-HTP methods for face masks can have 3.4 times higher net energy gains and 95% lower GHG emissions compared to incineration. Compared to landfilling, which recovers no energy, LP-HTP can reduce GHG emissions by 33% and generate products with a net energy gain of 42 MJ from 1 kg of face mask waste. Furthermore, compared to SWL, LP-HTP operating with a lower water loading can decrease operating pressure by 88%, reduce GHG emissions by 79%, and improve net energy gain by 52%. Finally, LP-HTP has minimal char formation, higher oil and gas yields, and 9% higher net energy gain than pyrolysis.
The findings of this study can be used for developing LP-HTP methods to convert face masks to oils at larger scales. These methods have the potential to enable the production of 4.4 million tons of oil and 0.9 million tons of gases from 5.4 million tons of face masks annually. The oils produced from face masks can be used as chemical feedstocks to help establish a circular hydrocarbon economy.

Supplementary Materials

The following supporting information can be downloaded at: https://www.mdpi.com/article/10.3390/pr11102819/s1.

Author Contributions

Conceptualization, C.U., C.G. and N.-H.L.W.; formal analysis, C.U., C.G., K.A., H.G., P.V. and N.-H.L.W.; investigation, C.U., C.G., K.A., P.V. and N.-H.L.W.; data curation, C.U., C.G., K.A., H.G. and P.V.; writing—original draft preparation, C.U., C.G., K.A., P.V. and N.-H.L.W.; writing—review and editing, C.U., C.G., K.A., H.G., P.V. and N.-H.L.W.; supervision, N.-H.L.W. All authors have read and agreed to the published version of the manuscript.

Funding

Cagri Un was supported by the Scientific and Technological Research Council of Türkiye (TÜBİTAK) 2219-Post-Doctoral Research Fellowship Program. Clayton Gentilcore was supported by the Maxine Spencer Nichols Endowment of Davidson School of Chemical Engineering, Purdue University. Kathryn Ault was supported by the 2023 Summer Undergraduate Research Fellowship (SURF) of Purdue University. Hung Gieng is the recipient of a CREST fellowship, and was supported by an NSF HRD-2112554 grant.

Data Availability Statement

No additional data are available online.

Conflicts of Interest

The authors declare no conflict of interest.

References

  1. OECD. Global Plastics Outlook: Economic Drivers, Environmental Impacts and Policy Options; OECD Publishing: Paris, France, 2022. [Google Scholar]
  2. Jung, S.; Lee, S.; Dou, X.; Kwon, E.E. Valorization of disposable COVID-19 mask through the thermo-chemical process. Chem. Eng. J. 2021, 405, 126658. [Google Scholar] [CrossRef] [PubMed]
  3. Phelps Bondaroff, T.; Cooke, S. Masks on the Beach: The Impact of COVID-19 on Marine Plastic Pollution; OceansAsia: Hong Kong, China, 2020. [Google Scholar]
  4. Plastics Pandemic: The COVID-19 Pandemic is Adding to the Glut of Plastic Waste, United Nations Environment Programme. Available online: https://news.un.org/en/story/2020/07/1069151 (accessed on 30 August 2023).
  5. Yang, Q.; Yang, S.; Jiao, Y. Assessing disposable masks consumption and littering in the post COVID-19 pandemic in China. Environ. Pollut. 2023, 334, 122190. [Google Scholar] [CrossRef] [PubMed]
  6. Liang, H.; Ji, Y.; Ge, W.; Wu, J.; Song, N.; Yin, Z.; Chai, C. Release kinetics of microplastics from disposable face masks into the aqueous environment. Sci. Total Environ. 2022, 816, 151650. [Google Scholar]
  7. Cao, J.; Shi, Y.; Yan, M.; Zhu, H.; Chen, S.; Xu, K.; Wang, L.; Sun, H. Face Mask: As a Source or Protector of Human Exposure to Microplastics and Phthalate Plasticizers? Toxics 2023, 11, 87. [Google Scholar] [CrossRef] [PubMed]
  8. Allison, A.L.; Ambrose-Dempster, E.; Aparsi, D.T.; Bawn, M.; Casas Arredondo, M.; Chau, C.; Chandler, K.; Dobrijevic, D.; Hailes, H.; Lettieri, P. The Environmental Dangers of Employing Single-Use Face Masks as Part of a COVID-19 Exit Strategy. UCL Open Environ. 2020. [Google Scholar] [CrossRef]
  9. Aragaw, T.A. Surgical face masks as a potential source for microplastic pollution in the COVID-19 scenario. Mar. Pollut. Bull. 2020, 159, 111517. [Google Scholar]
  10. Cudjoe, D.; Wang, H. Thermochemical treatment of daily COVID-19 single-use facemask waste: Power generation potential and environmental impact analysis. Energy 2022, 249, 123707. [Google Scholar] [CrossRef]
  11. Vlasopoulos, A.; Malinauskaite, J.; Żabnieńska-Góra, A.; Jouhara, H. Life cycle assessment of plastic waste and energy recovery. Energy 2023, 277, 127576. [Google Scholar]
  12. Ilyas, S.; Srivastava, R.R.; Kim, H. Disinfection technology and strategies for COVID-19 hospital and bio-medical waste management. Sci. Total Environ. 2020, 749, 141652. [Google Scholar]
  13. Nam, J.Y.; Tokmurzin, D.; Yoon, S.M.; Ra, H.W.; Lee, J.G.; Lee, D.H.; Seo, M.W. Carbon dioxide gasification characteristics of disposable COVID-19 masks using bubbling fluidized bed reactor. Environ. Res. 2023, 235, 116669. [Google Scholar] [CrossRef]
  14. Nam, J.Y.; Lee, T.R.; Tokmurzin, D.; Park, S.J.; Ra, H.W.; Yoon, S.J.; Mun, T.Y.; Yoon, S.M.; Moon, J.H.; Lee, J.G.; et al. Hydrogen-rich gas production from disposable COVID-19 mask by steam gasification. Fuel 2023, 331, 125720. [Google Scholar] [PubMed]
  15. Shah, H.H.; Amin, M.; Iqbal, A.; Nadeem, I.; Kalin, M.; Soomar, A.M.; Galal, A.M. A review on gasification and pyrolysis of waste plastics. Front. Chem. 2023, 10, 960894. [Google Scholar] [PubMed]
  16. Aydin, K.; Ün, Ç. Development of Solid Waste Management System for Adana Metropolitan Municipality. In Exergy for A Better Environment and Improved Sustainability 2; Aloui, F., Dincer, I., Eds.; Springer: Cham, Switzerland, 2018; pp. 115–131. [Google Scholar]
  17. Aragaw, T.A.; Mekonnen, B.A. Current plastics pollution threats due to COVID-19 and its possible mitigation techniques: A waste-to-energy conversion via Pyrolysis. Environ. Syst. Res. 2021, 10, 8. [Google Scholar]
  18. Fu, Z.; Zhang, Y.S.; Ji, G.; Li, A. Hydrothermal transformation behavior and degradation pathway analysis of waste surgical masks in supercritical water. Process Saf. Environ. Prot. 2023, 176, 776–785. [Google Scholar] [CrossRef]
  19. Chen, W.T.; Jin, K.; Wang, N.H.L. Use of Supercritical Water for the Liquefaction of Polypropylene into Oil. ACS Sustain. Chem. Eng. 2019, 7, 3749–3758. [Google Scholar] [CrossRef]
  20. Jin, K.; Vozka, P.; Gentilcore, C.; Kilaz, G.; Wang, N.H.L. Low-pressure hydrothermal processing of mixed polyolefin wastes into clean fuels. Fuel 2021, 294, 120505. [Google Scholar]
  21. Yousef, S.; Eimontas, J.; Stasiulaitiene, I. Pyrolysis of all layers of surgical mask waste as a mixture and its life-cycle assessment. Sustain. Prod. Consum. 2022, 32, 519–531. [Google Scholar] [CrossRef]
  22. Li, C.; Yuan, X.; Sun, Z.; Suvarna, M.; Hu, X.; Wang, X.; Ok, Y.S. Pyrolysis of waste surgical masks into liquid fuel and its life-cycle assessment. Bioresour. Technol. 2022, 346, 126582. [Google Scholar]
  23. Park, C.; Choi, H.; Lin, K.Y.A.; Kwon, E.E.; Lee, J. COVID-19 mask waste to energy via thermochemical pathway: Effect of Co-Feeding food waste. Energy 2021, 230, 120876. [Google Scholar]
  24. Lee, S.B.; Lee, J.; Tsang, Y.F.; Kim, Y.M.; Jae, J.; Jung, S.C.; Park, Y.K. Production of value-added aromatics from wasted COVID-19 mask via catalytic pyrolysis. Environ. Pollut. 2021, 283, 117060. [Google Scholar]
  25. Sun, X.; Liu, Z.; Shi, L.; Liu, Q. Pyrolysis of COVID-19 disposable masks and catalytic cracking of the volatiles. J. Anal. Appl. Pyrolysis 2022, 163, 105481. [Google Scholar] [CrossRef] [PubMed]
  26. Full Plastic Nose Wire Specification Report. Available online: https://www.fysensi.com/products/full-plastic-nose-wire/ (accessed on 30 August 2023).
  27. Hubbard, V.M.; Brunson, W.K. Face Mask with Ear Loops and Method for Forming. U.S. Patent 4941470, 17 July 1990. [Google Scholar]
  28. Kameel, N.I.A.; Daud, W.M.A.W.; Patah, M.F.A.; Zulkifli, N.W.M. Influence of reaction parameters on thermal liquefaction of plastic wastes into oil: A review. Energy Convers. Manag. X 2022, 14, 100196. [Google Scholar]
  29. ASTM D86-23; ASTM Standard Test Method for Distillation of Petroleum Products and Liquid Fuels at Atmospheric Pressure. ASTM International: West Conshohocken, PA, USA, 2023. Available online: https://www.astm.org/d0086-23.html (accessed on 30 August 2023).
  30. Vozka, P.; Kilaz, G. How to obtain a detailed chemical composition for middle distillates via GCxGC-FID without the need of GCxGC-TOF/MS. Fuel 2019, 247, 368–377. [Google Scholar] [CrossRef]
  31. Šindelářová, L.; Luu, E.N.; Vozka, P. Comparison of gas and kerosene oils chemical composition before and after hydrotreating using comprehensive two-dimensional gas chromatography. J. Chromatogr. Open 2022, 2, 100068. [Google Scholar] [CrossRef]
  32. Ortega, F.; Martín-Lara, M.Á.; Pula, H.J.; Zamorano, M.; Calero, M.; Blázquez, G. Characterization of the Products of the Catalytic Pyrolysis of Discarded COVID-19 Masks over Sepiolite. Appl. Sci. 2023, 13, 3188. [Google Scholar]
  33. Tenhunen-Lunkka, A.; Rommens, T.; Vanderreydt, I. Greenhouse Gas Emission Reduction Potential of European Union’s Circularity Related Targets for Plastics. Circ. Econ. Sust. 2023, 3, 475–510. [Google Scholar]
Figure 1. Overview of LP-HTP methods for converting disposable face masks into oils, followed by distillation into fractions.
Processes 11 02819 g001
Figure 2. Schematic definition of set temperature (Ts), set time (tS), heating time (tH), cooling time (tC), effective reaction time (tER) and effective average temperature (tEAV).
Processes 11 02819 g002
Figure 3. Product yields from experiments using NW, NB, EL, and FM feedstocks.
Processes 11 02819 g003
Figure 4. Carbon number distributions and hydrocarbon types of NW-3 (PP) and NB-2 (HDPE). The literature results of KJ-1 (PP pellets) and KJ-2 (HDPE pellets) are included for comparison [20]. Detailed compositions are tabulated in Supplementary Table S3.
Processes 11 02819 g004
Figure 5. Carbon number distributions and hydrocarbon types of FM-2 and FM-1 (full masks, Table 2). The literature results of KJ-1 (PP pellets) are included for comparison [20]. Detailed compositions are tabulated in Supplementary Table S3.
Processes 11 02819 g005
Table 1. The list of literature studies and product yields.
AuthorsYearMaterialMethodTemp.
(°C)
Pressure
(psig)
Time
(min.)
Oil Yield
%
Gas Yield
%
Solid Yield
(Char/Wax)
%
S. Yousef et al. [21]2022Non-WovenPyrolysis500-6042544 (char)
Chao Li et al.
[22]
2022Non-WovenSlow pyrolysis in
fixed-bed reactor
500-9081154 (char)
Park C. et al. [23]2021Non-Woven + Ear LoopPyrolysis in
split-hinge tube furnace
500–900--52–59 *48–41No char
Lee et al. [24]2021Full MaskNon-catalytic pyrolysis
in fixed bed reactor
550-3081109 (char)
Sun X. et al. [25]2022Full MaskCatalytic cracking
pyrolysis in
vertical quartz
tube reactor
440-1 **75232 (solid)
Fu et al. [18]2023Full MaskSupercritical water
(SWL)
400-60671221 (solid)
Chen et al. [19]2019PP PelletsSupercritical water
(SWL)
455333630–609190
Jin et al. [20]2021PP PelletsLP-HTP4502256087121 (char)
This Study2023Non-WovenLP-HTP450 (392 ***)350~1 (25 ****)87121 (char)
This Study2023Full MaskLP-HTP450 (396 ***)40010
(32 ****)
82171 (char)
* Between 52% and 59% of the mass of the disposable face mask underwent conversion into condensable substances, which were subsequently collected using a condensable trap. ** The heating stopped after 1 min at the set temperature. *** Effective average temperature (See Section 2.3). **** Effective reaction time (See Section 2.3).
Table 2. The properties full mask components.
PartsWeight Percentage
(wt.%)
Chemical
Compositions
Dimensions
L × W × T *
(cm)
Non-Woven (NW) Mask Body80.7Polypropylene (PP)1.5 × 1.5 × 0.1
Nose band (NB)7.9High-Density Polyethylene (HDPE) ** [26]1.5 × 0.4 × 0.1
Ear Loops (EL)11.4Polyester (90.3%)
+ Spandex (9.7%)
[27]
1.5 × 0.5 × 0.5
* L = length; W = width; T = thickness (after feedstock preparation). ** Type of full plastic nose wire.
Table 3. The experimental conditions and product yields of NW, NB, EL, FM, and KJ.
Exp.
No.
Set Temp., TS (°C)
and
Set Time, tS(min.)
Effective Average
Temp., TEAV
(°C)
Effective Reaction
Time, tER
(min.)
Oil
Yield
%
Gas
Yield
%
Wax
Yield
%
Char
Yield
%
NW-1450–30 42359801901
NW-2450–1540838841501
NW-3450–1039225871201
NW-4400–036216836110
KJ-1 (PP)
[20]
450–6042687871201
NB-1450–10 404316213250
NB-2450–0395195913280
KJ-2 (HDPE) [20]450–6042684861301
EL-1450–0 38519-48052
EL-2275–0<3000-199 *0
FM-1 (3 trials)450–10401 ± 430 ± 282 ± 0.217 ± 0.201 ± 0.2
FM-2430–037519821161
FM-Theoretical
(see Supplementary-Figure S2)
450–1039632751627
* un-reacted solid.
Disclaimer/Publisher’s Note: The statements, opinions and data contained in all publications are solely those of the individual author(s) and contributor(s) and not of MDPI and/or the editor(s). MDPI and/or the editor(s) disclaim responsibility for any injury to people or property resulting from any ideas, methods, instructions or products referred to in the content.

