Article

150USRT Class R-513A Refrigerant Two-Stage Centrifugal Compressor Design Point and Separation Point Flow Field Simulation Analysis

1
Industrial Technology Research Institute, Green Energy & Environment Research Laboratories, 195, Sec 4, Chung Hsing Rd, Hsinchu 31040, Taiwan
2
Department of Refrigeration, Air Conditioning and Energy Engineering, National Chin-Yi University of Technology, Taichung City 41170, Taiwan
*
Author to whom correspondence should be addressed.
Processes 2023, 11(1), 253; https://doi.org/10.3390/pr11010253
Submission received: 29 November 2022 / Revised: 22 December 2022 / Accepted: 10 January 2023 / Published: 12 January 2023

Abstract

:
This study used computational fluid dynamics for low greenhouse effect refrigerant (R-513A) simulation analysis in the two-stage 150 USRT class oil-free centrifugal refrigerant compressor using integrated part load value (IPLV) and internal flow field. The compressor rotor speed and mass flow rate for the IPLV working conditions with various loads were planned using Stage 1 and Stage 2 simulations, respectively. The performance and flow field numerical simulation analyses for the two-stage centrifugal compressor is discussed. This study used Ansys-CFX software for numerical simulation analysis and the conservation form of a 3D steady-state Navier–Stokes equation set with the finite volume discretization method for computation. The computing mode produced better computing efficiency and flexible mesh setting using the k-omega (k-ω) model, which has better computational performance in the near wall boundary layer and low Reynolds number flow field (used as the turbulence model) for simulation. The R-513A refrigerant property setting was calculated using the Soave–Redlich–Kwong gas equation. This study discusses the shaft work, pressure ratio, and isentropic efficiency and also describes the main research findings with the meridional pressure, isentropic efficiency contour maps, and flow field velocity vector diagrams. According to the numerical simulation results, in Stage 1 and Stage 2 simulations, the isentropic efficiency produced the highest numerical results in the 75% load case, which are 88.19% and 89.06%, respectively. The isentropic efficiency decreased to 75.93% and 82.26%, respectively, in the 25% load case. The flow field velocity vector diagram shows that in the 25% load case, there was back-flow field distribution near the impeller shroud. The compressor performance was also analyzed.

1. Introduction

1.1. Development and Introduction of Magnetic Levitation Oil-Free Centrifugal Refrigerant Compressor

In present air conditioning equipment, the compressor is the power source that maintains the operation of all fluid and gas equipment. The air conditioning systems of commercial buildings, hospitals, and public buildings in the market depend on high efficiency compressors to cope with the demand for uninterrupted air conditioning capacity all year round. According to Equation (1) of integrated part load value (IPLV) in AHRI 551/591 [1], the practical application operating time is a coefficient. The full load operation time coefficient is much smaller than the operation time coefficients for various part loads, so the part load efficiency is very important in the chiller operation. In comparison to a conventional centrifugal compressor, the magnetic bearing mechanical loss is much lower than the dynamic bearing mechanical loss. The magnetic levitation centrifugal compressor is characterized by low noise, small volume, low power consumption, long life, and is free of refrigeration oil [2]. In the 200 RT to 700 RT class interval, the operating efficiency difference between the magnetic levitation centrifugal compressor and conventional centrifugal compressor decreases gradually as the refrigerating capacity increases [3].
IPLV = 0.01 A + 0.42 B + 0.45 C + 0.12 D
  • A = COP at 100% load; B = COP at 75% load
  • C = COP at 50% load; D = COP at 25% load

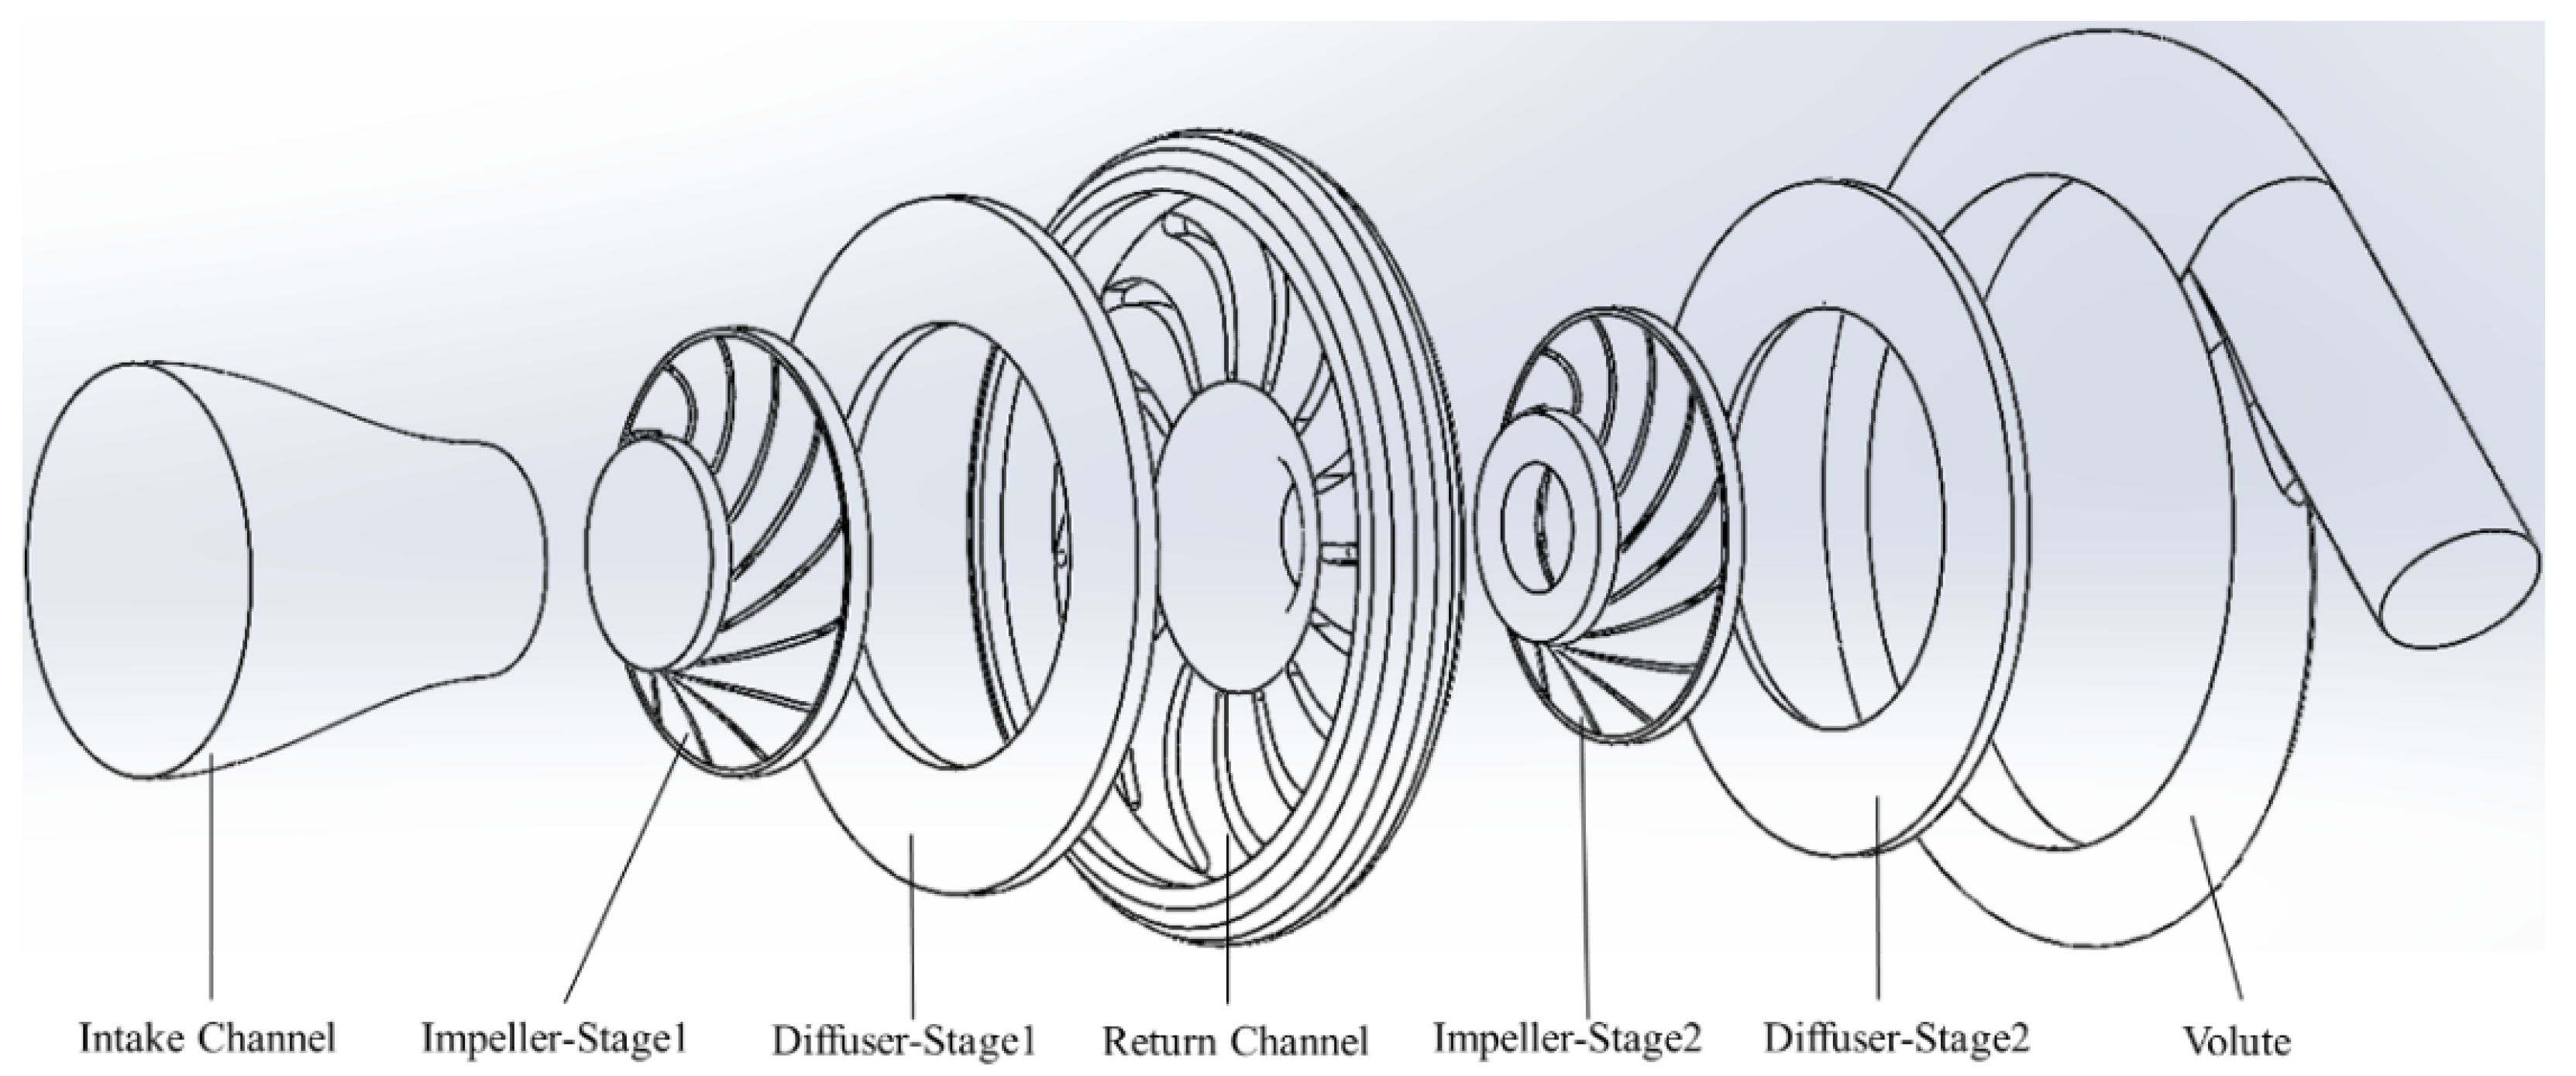
1.2. Magnetic Levitation Oil-Free Centrifugal Refrigerant Compressor Structure

The magnetic levitation centrifugal compressor drives the impeller to rotate through the magnetic bearing. The refrigerant is sucked into the impeller through the inlet tube and radially delivered from the impeller by high-speed centrifugation into the diffuser. The fluid dynamic energy is reduced by the diffuser and converted into pressure energy. This energy conversion form occurs continuously at the volute casing. The pressure ratio and mass flow rate for the chiller system are achieved using high efficiency impeller compression, so the flow field characteristics and flow element performance effectiveness are the keys to compressor performance.
The two-stage compression-type magnetic levitation centrifugal compressor discussed in this study is comprised five flow elements: the inlet zone, impeller zone, diffuser zone, deswirl vane zone, and volute casing. The numerical simulation was performed in stages in this study. The first stage compression includes the inlet zone, impeller zone, diffuser zone, and deswirl vane zone. The second stage compression includes the inlet zone, impeller zone, diffuser zone, and volute casing. The inlet zone is a flow element configuration without inlet guide vanes. The impeller zone is an enclosed impeller that reduces the influence of leakage loss. The diffuser zone is a vaneless diffuser. The major function of the deswirl vane zone is to compress refrigerant using the first stage smooth flow into second stage impeller inlet. The volute casing collects the refrigerant flowing out of the diffuser zone and delivers it to the compressor outlet. The fluid kinetic energy is converted into pressure energy in the process. The compressor flow elements are shown in Figure 1.

1.3. Literature Review

1.3.1. Documents about Centrifugal Compressors

Tre’binjac [4] discussed the values of a centrifugal compressor at three operating points, including choked flow, peak efficiency, and near surge, using simulation and experiments. Their study showed that at the operating points chock to surge, shock waves in the diffuser internal flow field moved upstream to somewhere near the impeller vane’s suction side.
Shafieian et al. [5] designed a nonlinear controller according to the Lyapunov Law, used in the Moore-Greitzer (MG) centrifugal compressor model, and the simulation results showed that the controller could avoid the influence of surge.
Wang [6] performed numerical simulation analysis of the centrifugal pump volute, used the ICEM-CFD to make a simulation network, and used Ansys-CFX simulation software for computation. They found that the circular cross section volute had the highest efficiency among different volute cross-section geometries.
Zhang [7] used Ansys CFX for numerical simulation analysis of the unsteady-state flow field of a high-speed centrifugal compressor. The simulation results showed that the total pressure ratio increased as the mass flow rate decreased. The backflow and eddy current around the impeller shroud intensified as the flow decreased. This disordered flow field would increase the flow loss and damage the compressor.
Zhang et al. [8] used experiments and simulation to analyze the influence of the four different vaneless diffusers’ geometric shapes on the centrifugal compressor performance. The simulation results showed that the diffuser pressure gradient could be reduced by changing the diffuser geometric shape to improve the compressor’s internal flow field back-flow phenomenon.

1.3.2. Documents about R-513A Refrigerant

Sun et al. [9] used a mathematical model to simulate the two-stage compression system via an economizer. The R134a and R513A refrigerants were analyzed and compared in system capacity, available energy failure rate, energy efficiency, and available energy efficiency. The analysis results show that under most operating conditions, the system refrigeration capacity was reduced by 12%, the COP value was reduced by 9%, and the exergy efficiency was reduced by 14% after the R134a refrigerant was substituted with R513A refrigerant. The compressor was the first flow element redesigned to increase the R8513A refrigerant efficiency.
Yang et al. [10] experimentally filled general household refrigerators with 85 g R134a refrigerant and 80 g R513A refrigerant for comparison. The experimental results showed that the R513A refrigerant had a lower compressor exhaust temperature and pressure ratio than the R134a refrigerant. It also had a higher cooling rate, meaning the R513A refrigerant had better refrigerating capacity than the R134a refrigerant.
Saadoon et al. [11] experimentally replaced the original air conditioning equipment R134a refrigerant with R513A refrigerant, and performed a comparison under different ambient temperatures, different internal loads, and different compressor speeds. The experimental results showed that the COP value of R513A refrigerant was a little higher than that of R134a refrigerant by 1% to 2%. The mass flow rate was increased by 1.6% to 3% and 15% to 17%, respectively, under average refrigerating capacity. The pressure ratio and exhaust temperature were lower than that of the R134a refrigerant by about 4.6%. The R513A refrigerant performance demonstrated it was a good replacement for R134a.
Zhang et al. [12] used a thermodynamic model to compare the R513A refrigerant and R134a refrigerant performances in the twin-screw compressor. They simulated the compressor leakage and heat transfer between the refrigerant and lubricating oil, and the volumetric efficiency and adiabatic efficiency. The simulation results showed that the R513A refrigerant system had a lower temperature lift and pressure ratio, and high differential pressure. The experimental results showed that the R134a and R513A refrigerant systems had minor differences in volumetric efficiency and adiabatic efficiency. The COP value was a little lower than that of R134a. Considering the equipment replacement cost and GWP value, the R513A refrigerant could directly replace the R134a refrigerant fluid in the twin-screw compressor.
Vicente [13] tested R-134a refrigerant, R-450A refrigerant, and R-513A refrigerant in a system with an internal heat exchanger (IHX) and found that the R-513A refrigerant was the best choice for medium and low temperature systems with an IHX.

1.3.3. Documents about R-1234yf Refrigerant and R-1234ze Refrigerant

Meng et al. [14] used R-1234ze(E) refrigerant, R-152a refrigerant, and the blending of said two refrigerants as alternative refrigerants for R-134a refrigerant, and performed a comparative analysis of compressor performance. The findings showed that the R-152a refrigerant had a better coefficient of performance than R-134a refrigerant, but the R-152a refrigerant with higher inflammability was limited to temperature during operation. In addition, the refrigerating capacity of R-1234ze(E) refrigerant was much lower than that of R-134a refrigerant.
Adrián et al. [15] mentioned that it was infeasible to directly substitute R-134 refrigerant with R-1234ze(E) refrigerant because the cooling capacity difference between the two refrigerants was very large. Hence, this study used an internal heat exchanger in the R-1234ze(E) refrigerant test to reduce the cooling capacity difference between the two fluids.
Ho et al. [16] indicated that after the working fluid of 280USRT single-stage centrifugal compressor was changed from R-134a refrigerant to R-1234yf refrigerant and R-513A refrigerant, in the condition of IPLV100%, the isentropic efficiency of the magnetic levitation centrifugal compressor was reduced by about 10%.
Yi et al. [17] directly substituted the working fluid R-134a refrigerant of a centrifugal compressor with R-1234yf refrigerant and R-1234ze(E) and performed a comparative analysis of performance. The results showed that at the same rotation speed, the compressor with R-1234yf refrigerant had higher refrigerating capacity, but the COP was reduced by 12.5%. Additionally, the refrigerating capacity decreased after the R-1234ze(E) refrigerant was used instead, and the COP was reduced by 7%.

2. Materials and Methods

2.1. Symbol Description

  • ρ Density   ( kg / m 3 )
  • Partial   Derivative
  • U Velocity   m / s
  • t Time   s
  • Particularly   in   vector   calculus
  • P Pressure   kPa
  • g Gravity   Vector   m / s 2
  • μ Dynamic   Viscosity   kg / m · s
  • Tensor   Product
  • τ Molecular   Stress   Tensor
  • S M Momentum   Source
  • δ Identity   Matrix
  • h t o t Total   Enthalpy   kJ / kg
  • λ Thermal   Conductivity   W / m · K
  • S E Energy   Source
  • h Static   Enthalpy   kJ / kg

2.2. Research Methods

With the advance of science and technology, and the enhancement of software and hardware equipment performance and computer computation capability, computing time is shortened. As a result, numerous engineering studies often use computational fluid dynamics (CFD) to predict fluid flow performance or the phenomena reflected by the fluid before experiments. These technological advances greatly reduce the research monetary and labor costs.
However, the Navier–Stokes Equations (2) are a set of second order nonlinear partial differential equations, so it is difficult to obtain the analytical solution in most flow regimes. Hence, to be closer to the actual solution, this study used the finite volume discretization method to solve the continuity equation conservation (3), momentum equation conservation (4), and total energy equation conservation (5), which are expressed as follows [18].
Navier–Stokes Equation [19]
U t + U · U = 1 ρ P + μ 2 U
Continuity Equation [20]
ρ t + · ρ U = 0
Momentum Equation [20]
ρ U t + · ρ U U = p + · τ + S M
τ = μ U + U T 2 3 δ · U
Total Energy Equation [20]
ρ h t o t t p t + · ρ U h t o t = · λ T + · U · τ + U · S M + S E
h t o t = h + 1 2 U 2
In terms of the turbulence model, under the same centrifugal refrigerant compressor geometric and boundary conditions, the Shear Stress Transport (SST), k-epsilon (k-ε), and k-omega (k-ω) models were compared. The findings show that the k-omega (k-ω) model had a shorter computing time. It was relatively accurate in the comparison between numerical simulation results and experimental results. This study selected the k-omega (k-ω) model to predict the turbulent flow regime in numerical simulation calculation [16].

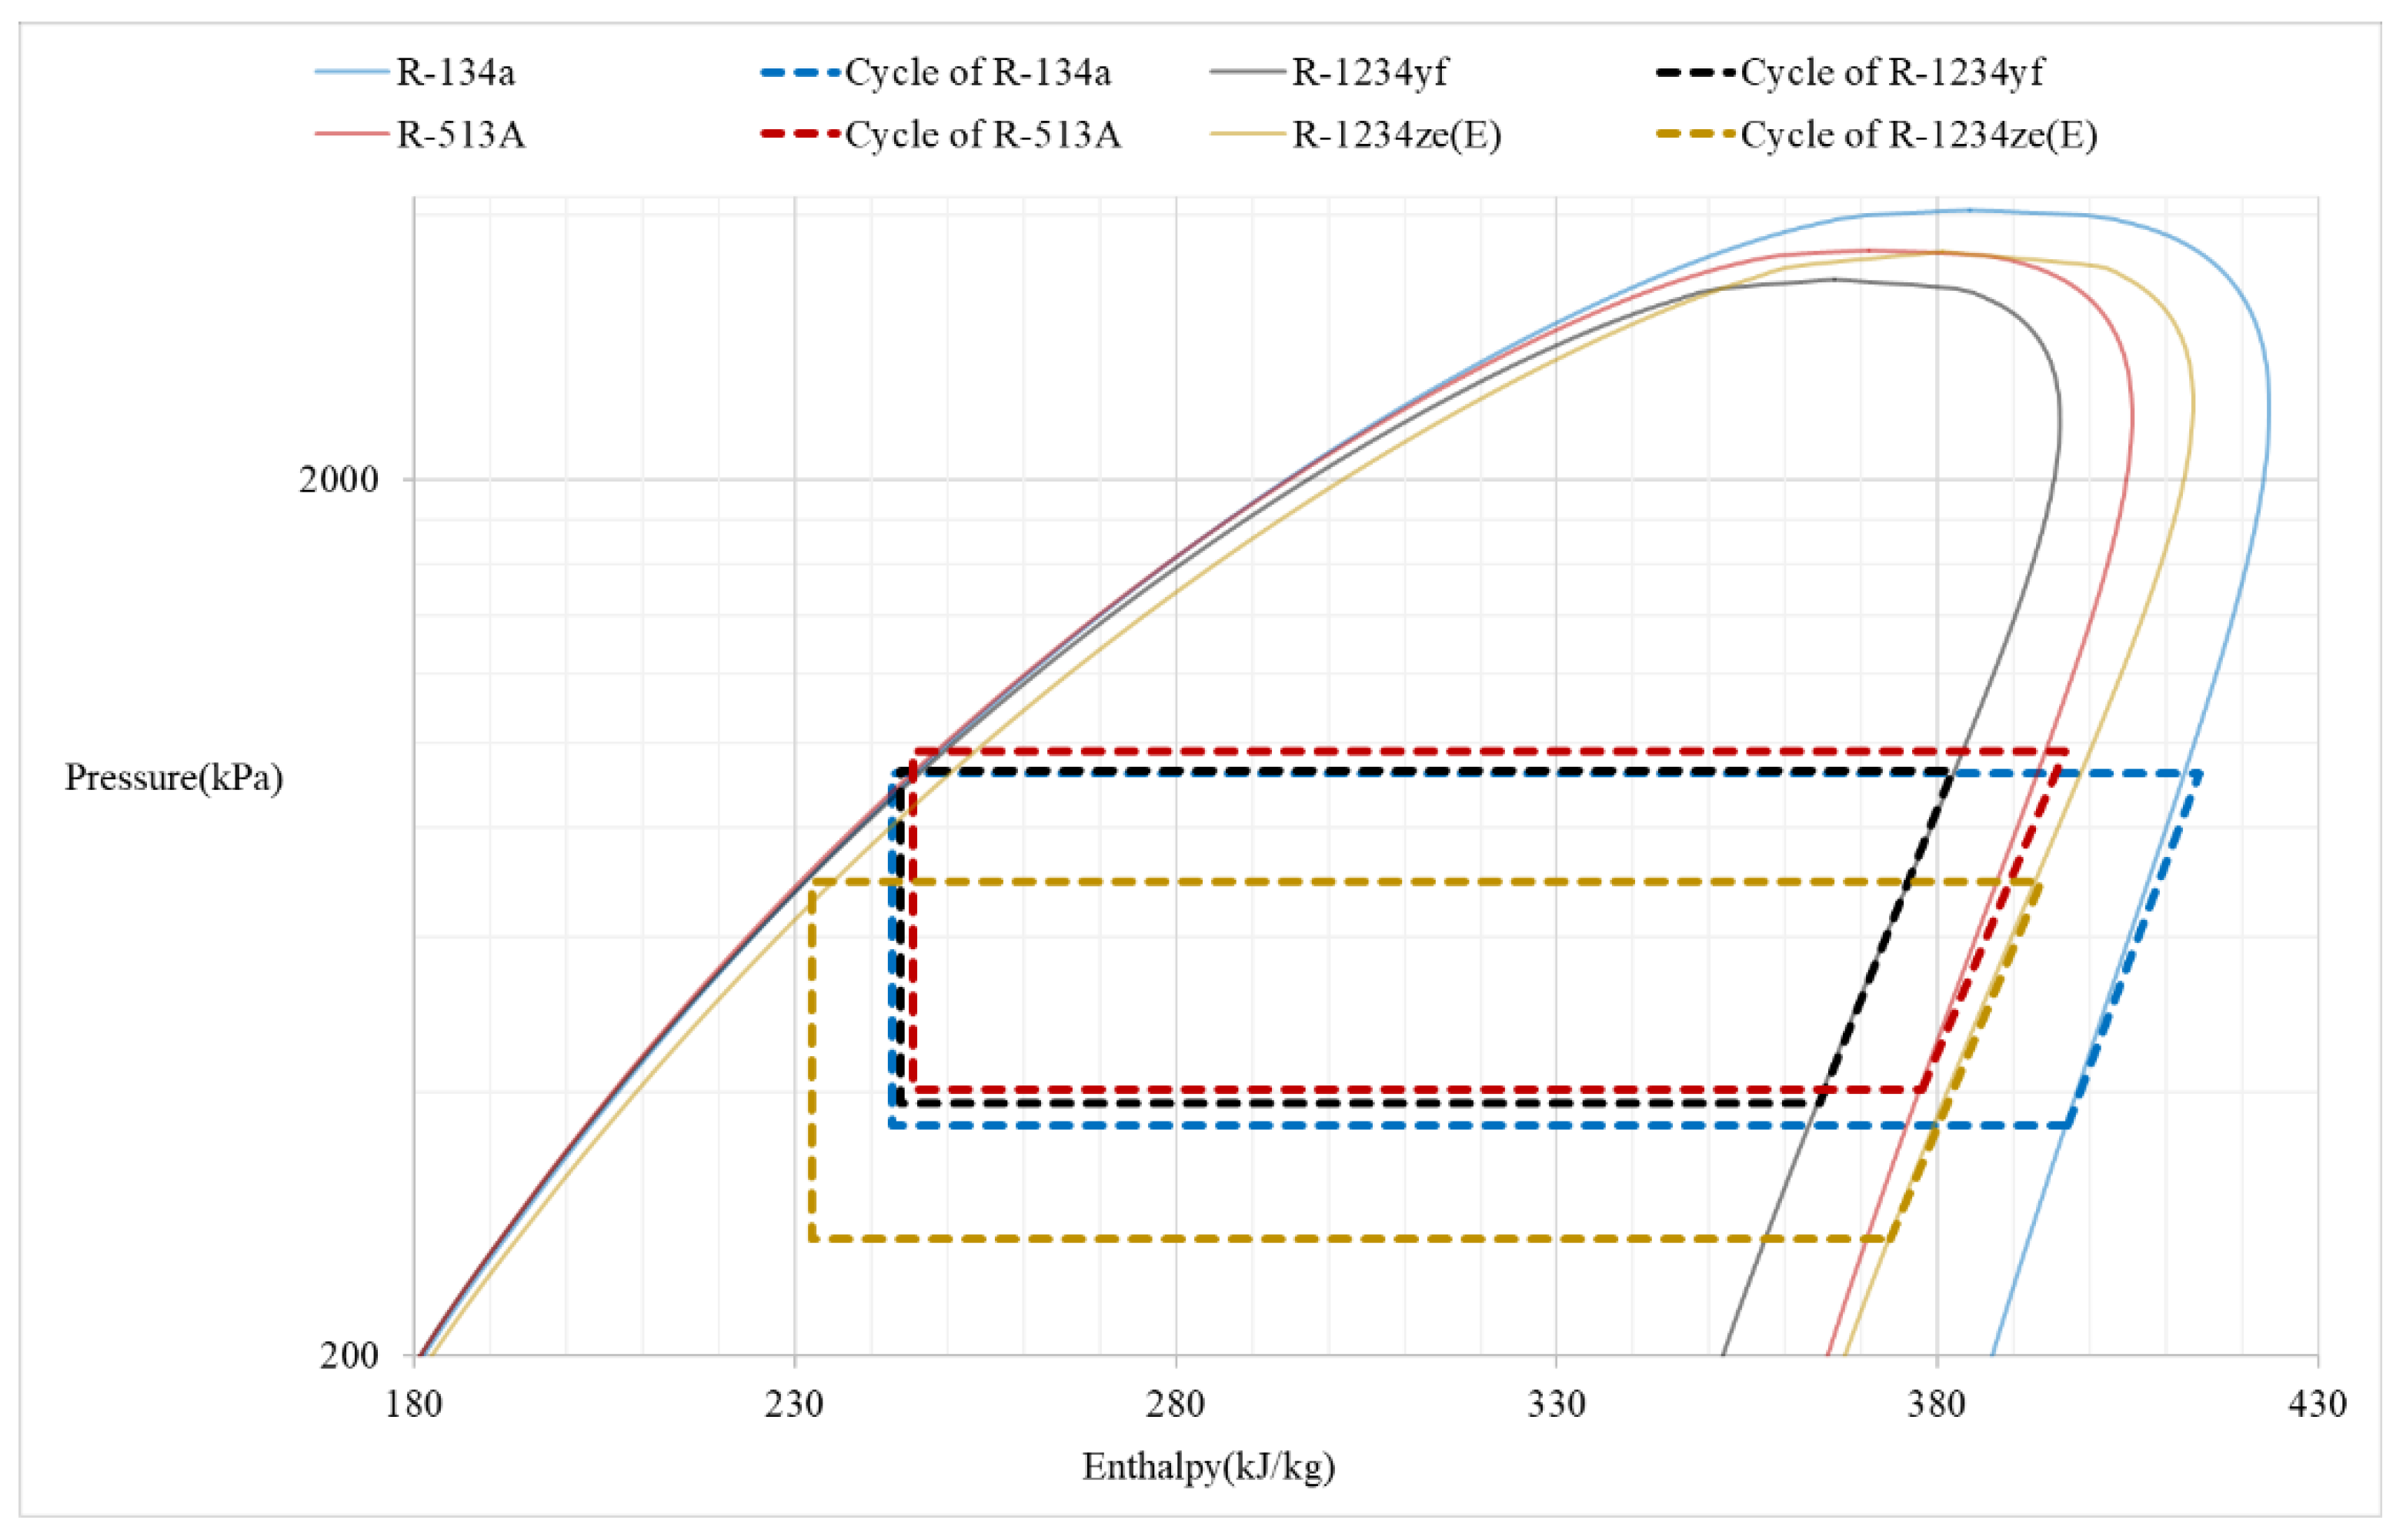
2.3. Refrigerant Selection

According to Montreal Protocol–Kigali Amendment [21], countries around the world will scale down or prohibit the selling and using of air conditioning equipment with hy-drofluorocarbon (HFC) refrigerant in the future. Hence, the replacement of HFC refrigerant is imperative in the future. At present, the promising alternative refrigerants include R-1234yf refrigerant, R-1234ze(E) refrigerant, and R-513A refrigerant. According to the comparison diagram of the refrigerants, in the same evaporation condition, the R-1234yf refrigerant has a smaller enthalpy difference. Thus, if R-134a refrigerant is replaced by R-1234yf refrigerant, the compressor power consumption may increase. Furthermore, as the saturation pressure of R-1234ze(E) refrigerant decreases too much in the same evaporation condition, R-1234ze(E) refrigerant is not discussed herein, as shown in Figure 2.
Ho et al. [16] indicated that after the working fluid of 280USRT single-stage centrifugal compressor was changed from R-134a refrigerant to R-1234yf refrigerant and R-513A refrigerant, in the full load condition, the isentropic efficiency was reduced by about 10%. Therefore, this study laid emphasis on the newly designed R-513A refrigerant in two-stage centrifugal compressor.
The R-513A refrigerant is a mixture refrigerant, comprising 44% R134a refrigerant and 56% R1234yf refrigerant, so the enthalpy difference of R-513A refrigerant is between that of R-134a refrigerant and R-1234yf refrigerant. Its GWP is 573, ODP is 0, and the safe level is A1 [22,23], which are more conformable to the specifications of the future air conditioning equipment in comparison to R-134a refrigerant, as shown in Table 1 and Table 2.

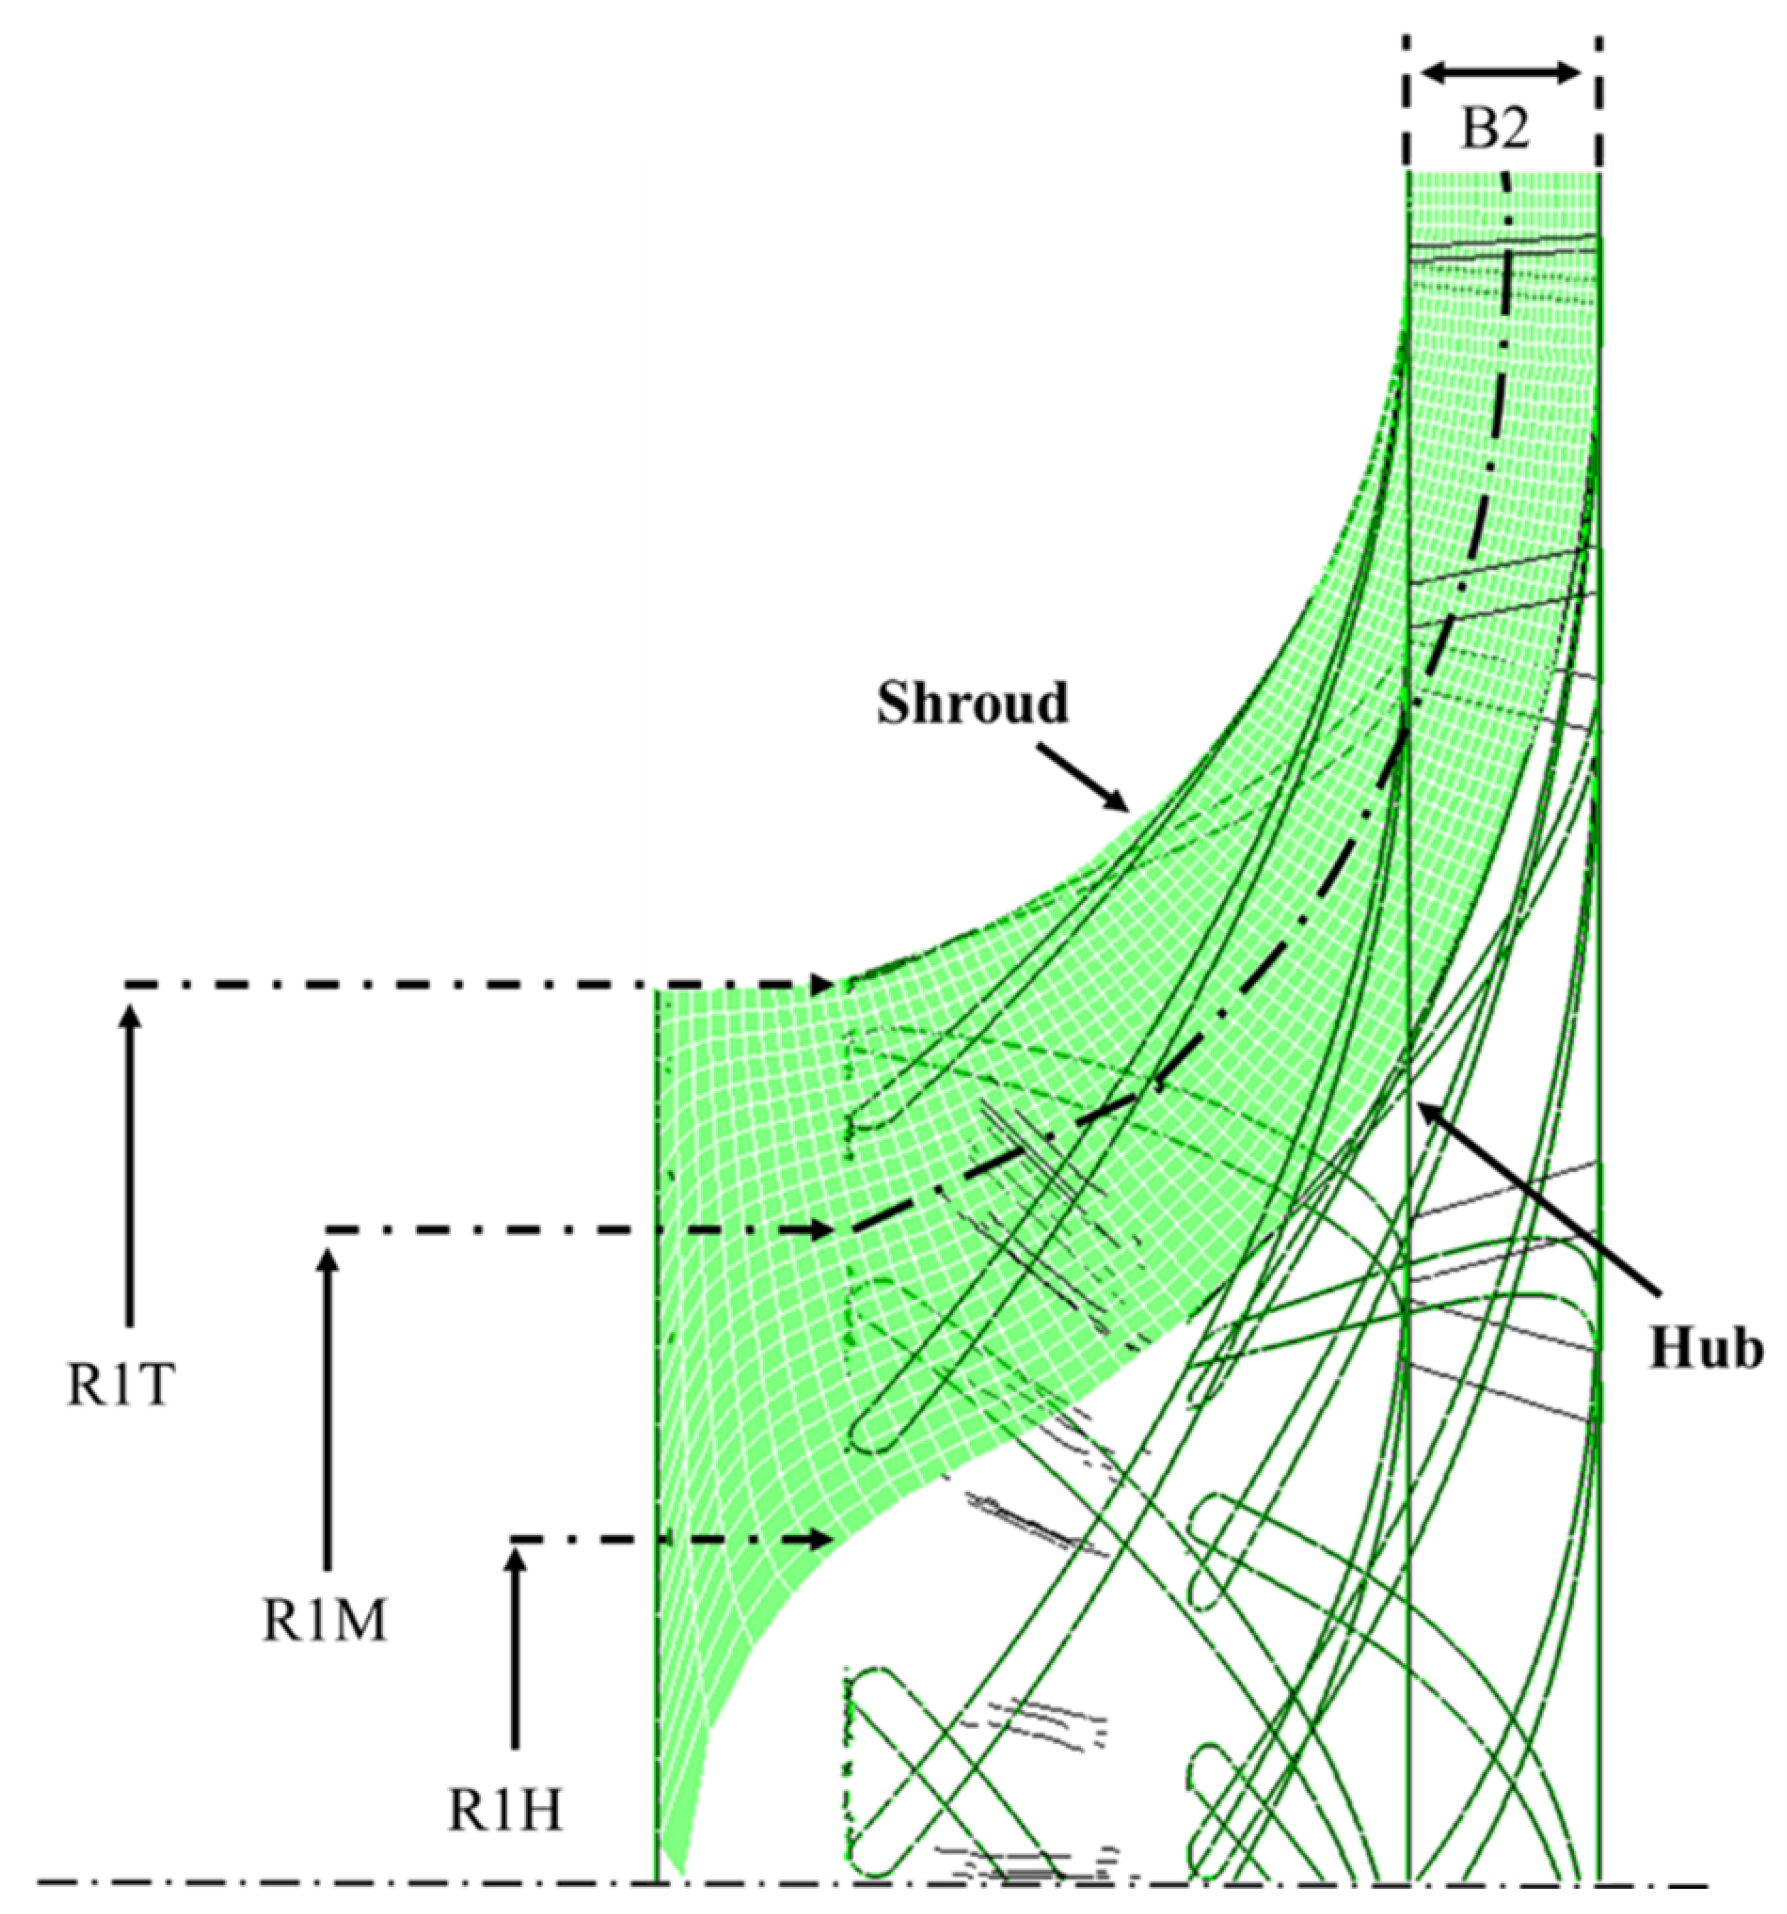
2.4. Design of Compressor Flow Element

The coolant circulation analysis of R513A,150USRT two-stage magnetic levitation centrifugal compressor in AHRI 551/591 [1] part load IPLV condition is shown in Table 3. The respective isentropic compression works of Stage 1 and Stage 2 impellers are 8840 and 7990 J/kg. The impeller mass flow rates calculated with the rated refrigerating capacity of 422 kW of optimum efficiency design point are 2.797 and 3.227 kg/s, and the corresponding volumetric flow rates are 0.1325 and 0.00973 m3/s. According to the Ns-Ds diagram of centrifugal impellers, the target-specific speed Ns of the Stage 1 impeller is 0.81, i.e., the rated speed of 19,450 rpm. At this rotation speed condition, the specific speed of the Stage 2 impeller is 0.75, the diameters of the two-stage impellers are 132.5 and 129 mm, and the specific diameter Ds values are 3.53 and 3.91. According to the Ns and Ds, the efficiency of this impeller is higher than 85%.
The runner design of the two-stage compressor was based on the concept design result. In the condition of the rated speed of 19,450 rpm, the impeller exit tangential velocity U2 was 136.44 and 130.09 m/s, the number of blades was 13, and the R1T size of Stage 1 and Stage 2 impellers was designed as 36 mm. However, the Stage 2 impeller eye pressure and temperature increased, so the density increased. In order to keep a certain gas velocity, R1H was increased to reduce the gas cross-section area and increase the gas velocity, with R1H being 22.5 and 26 mm, respectively. The impeller back rake beta2 and impeller exit width B2 were adjusted to meet the pressure ratio requirement and efficiency; the respective impeller exit back rakes were −48.5 and −52.5°, and the respective impeller exit widths were 7.6 and 6.1 mm. The geometric parameters of an impeller are shown in Table 4 and Figure 3.

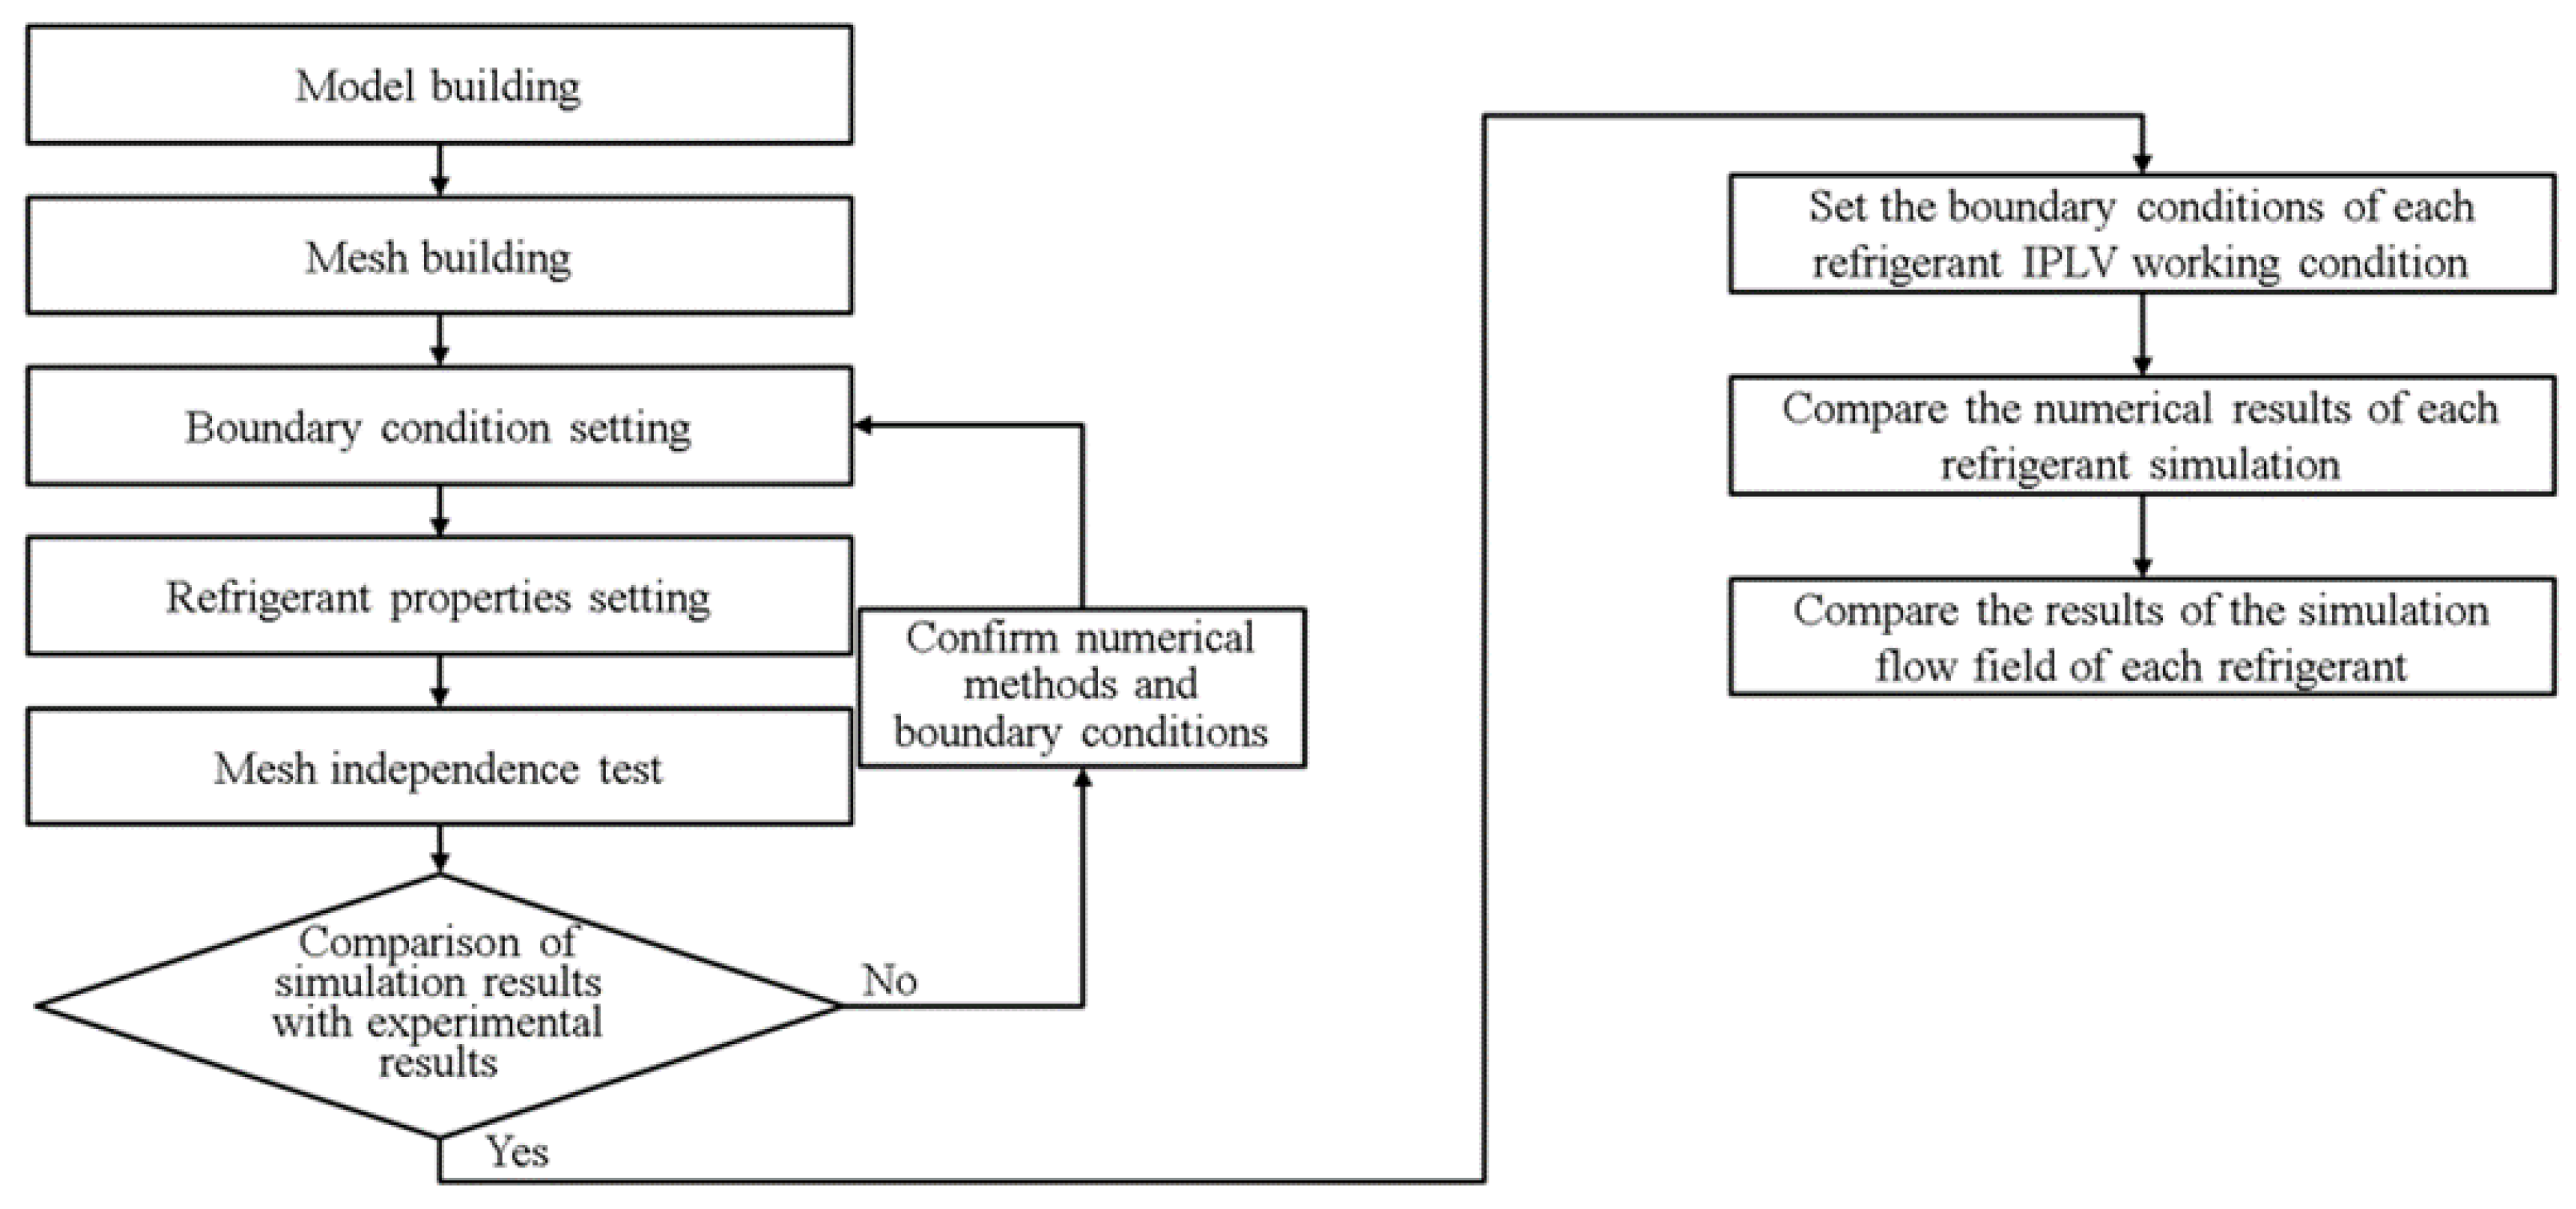
2.5. Research Process
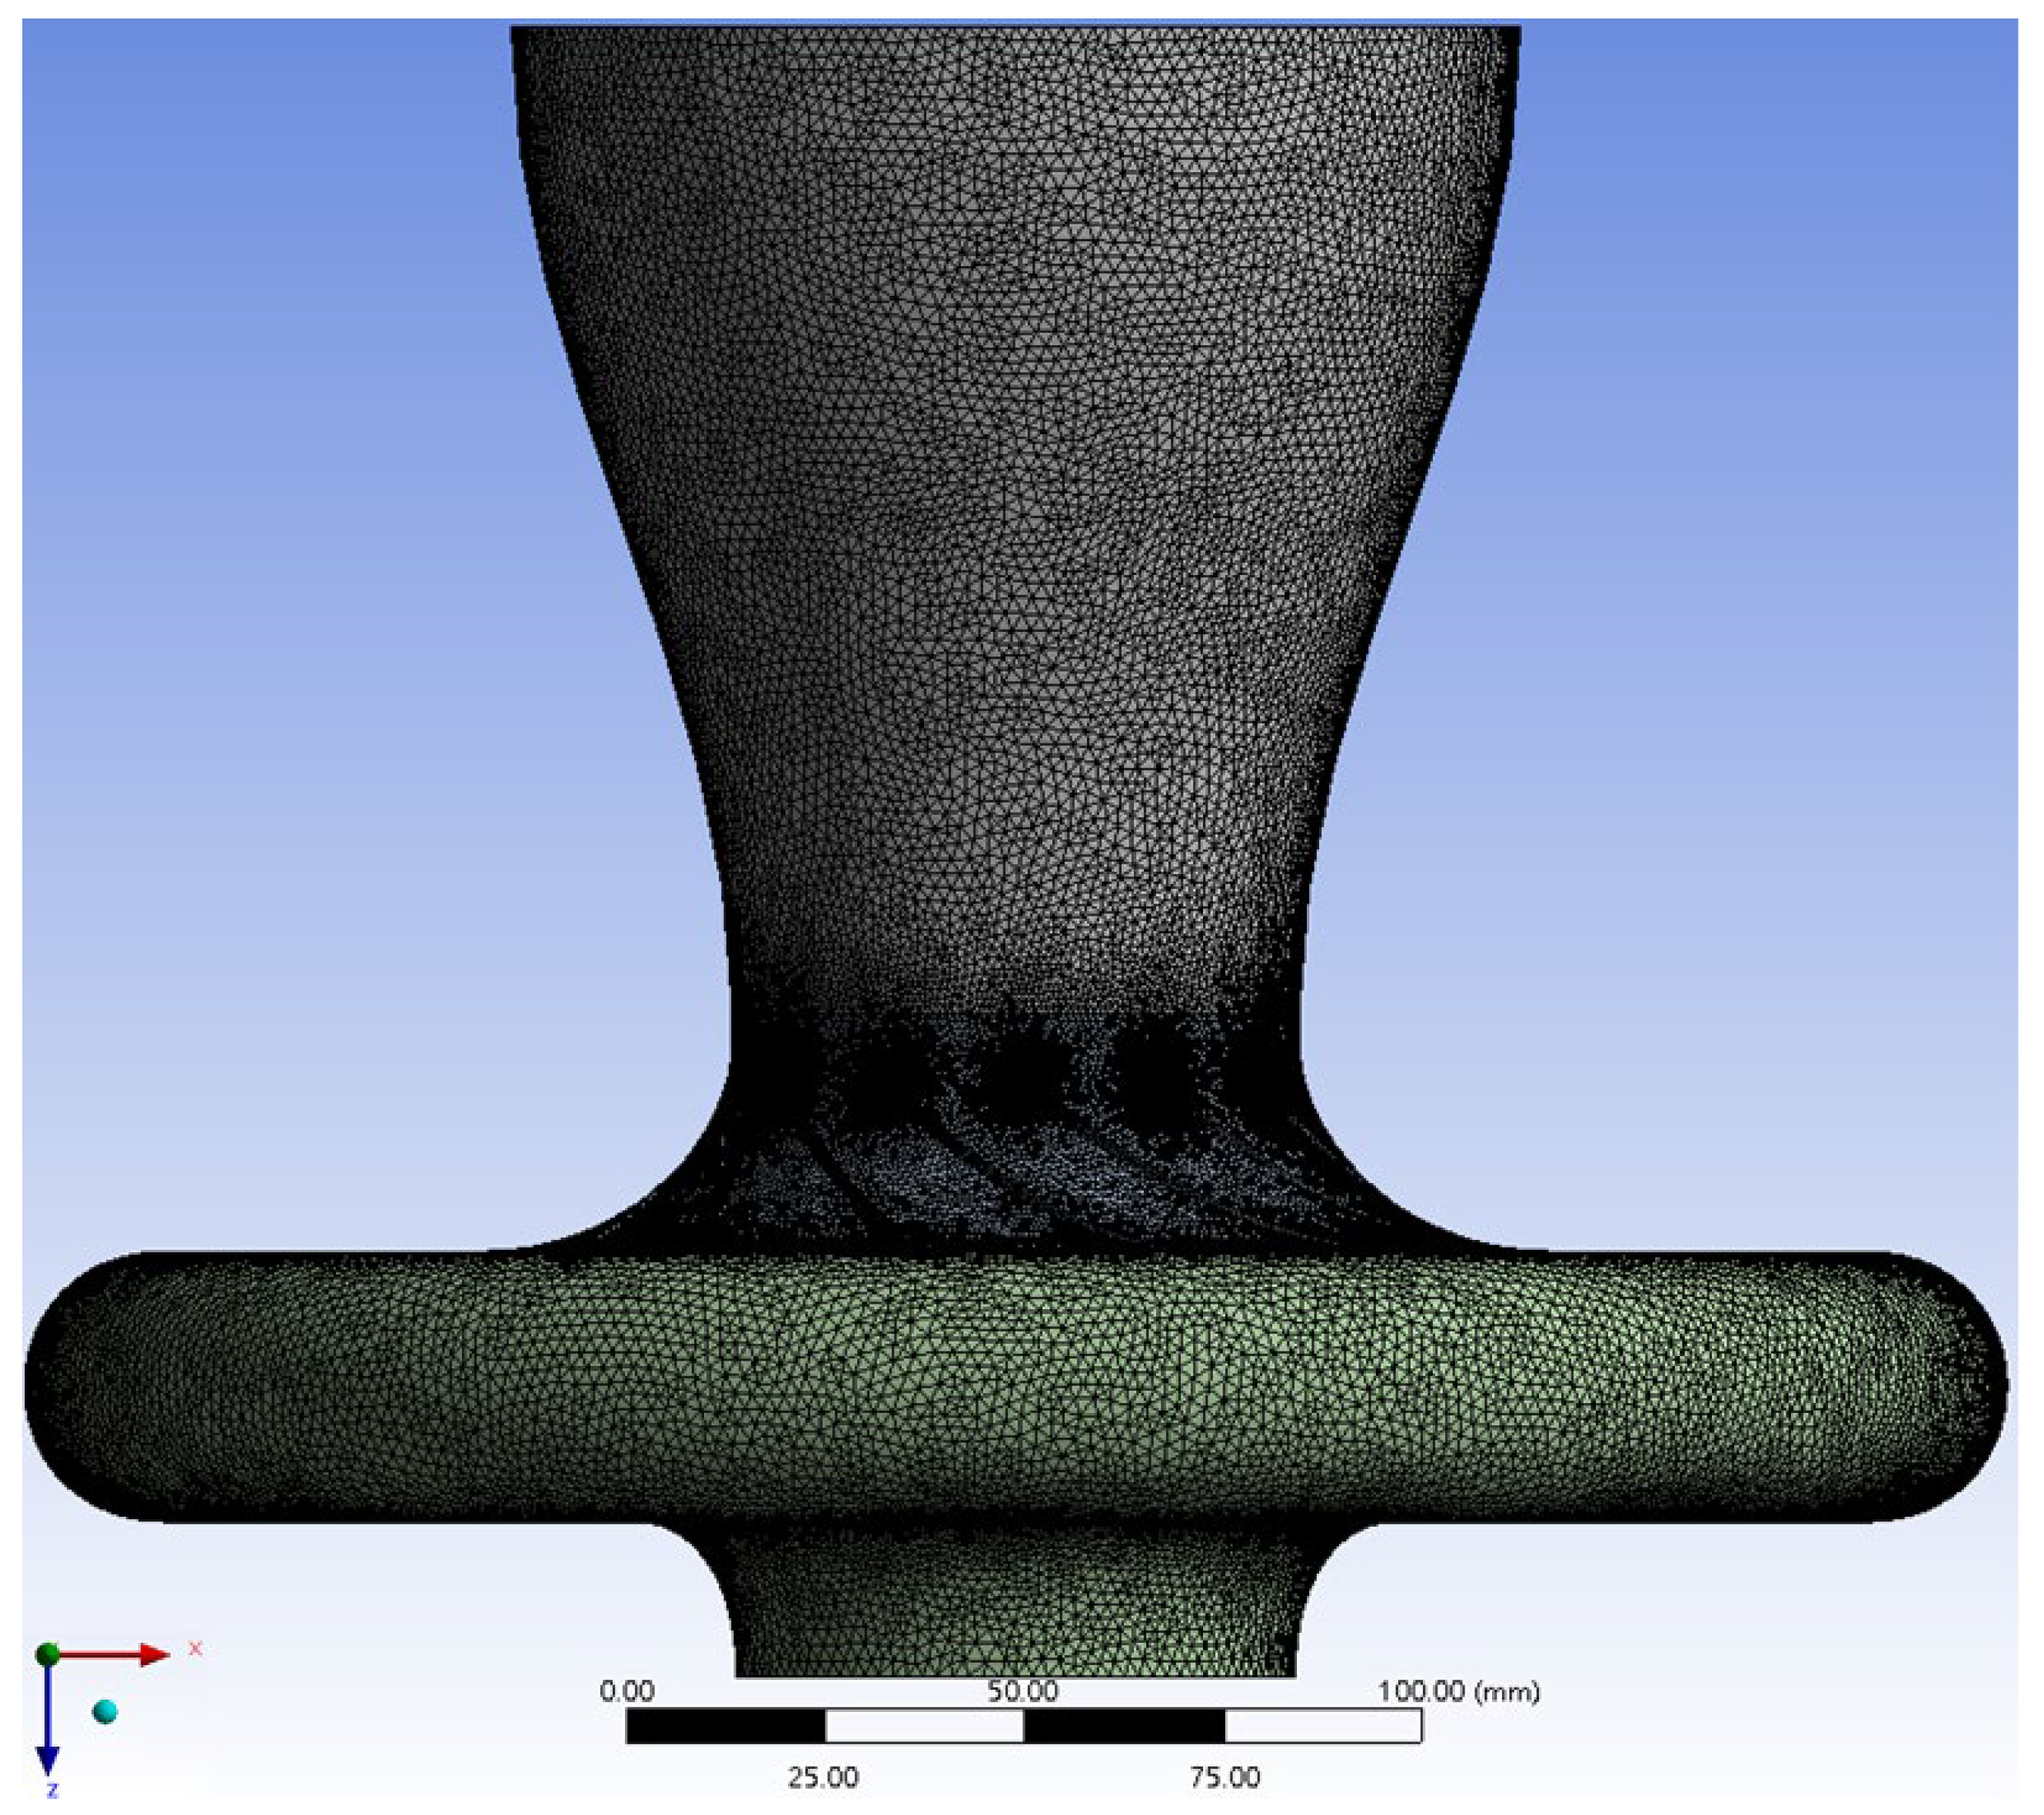
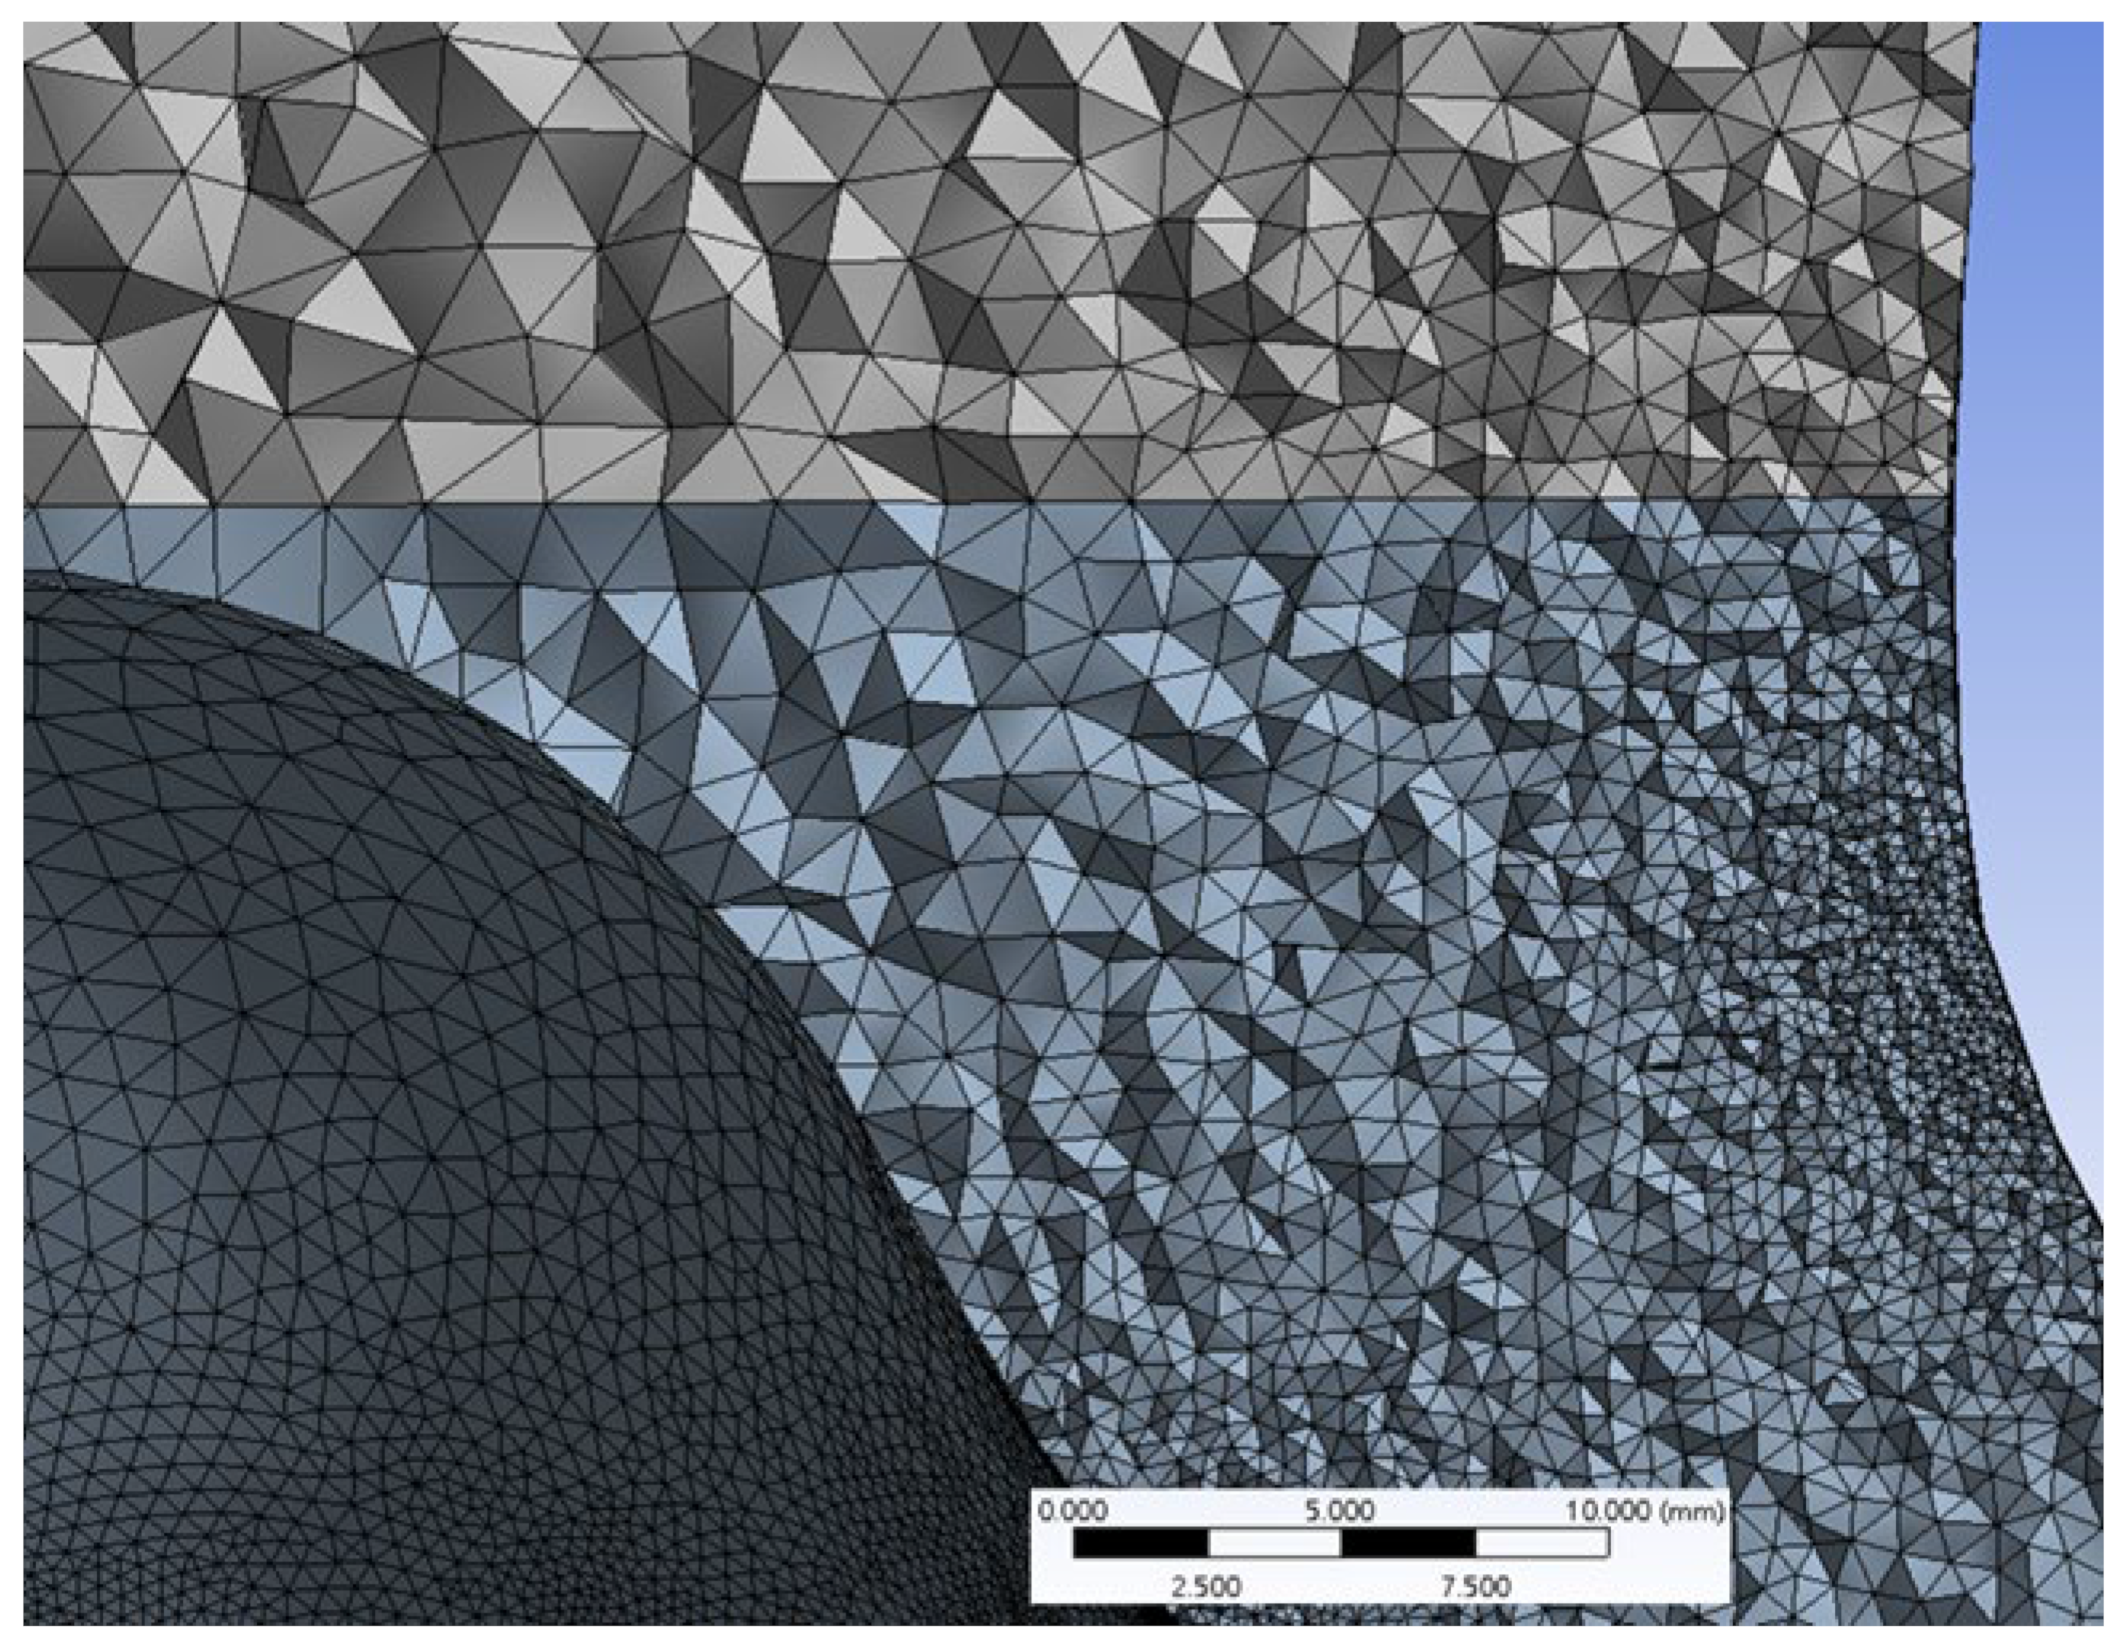
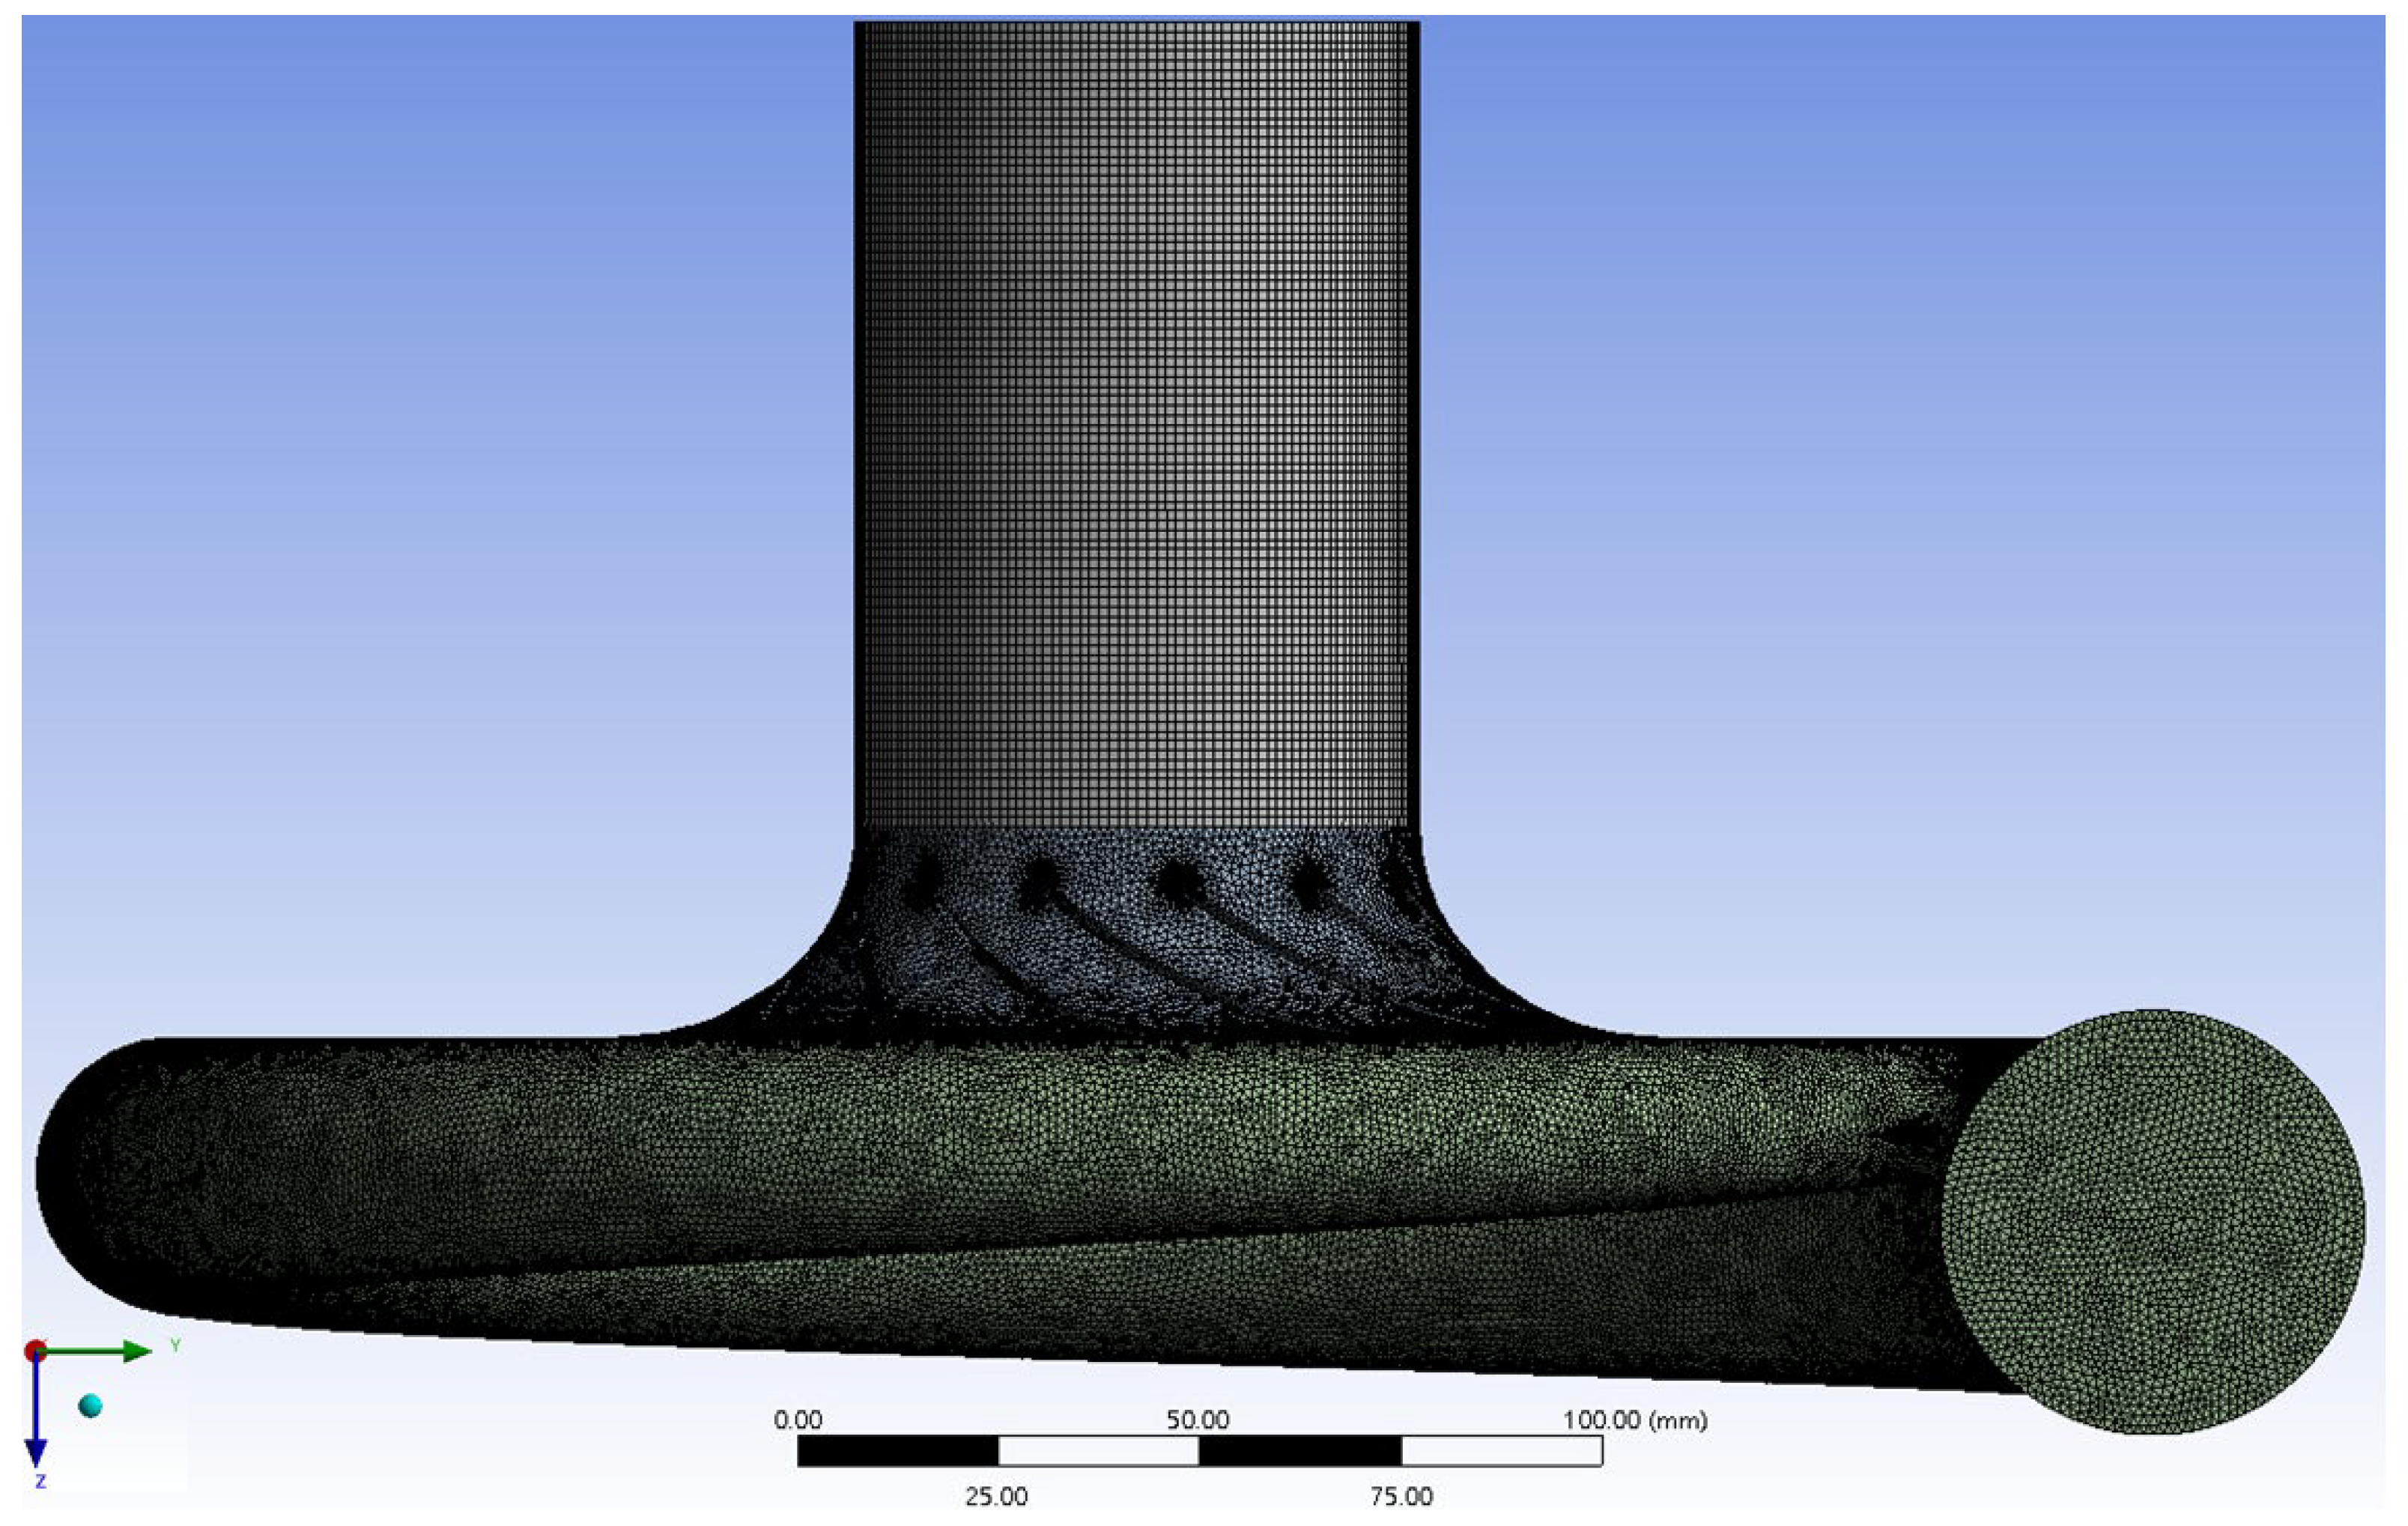
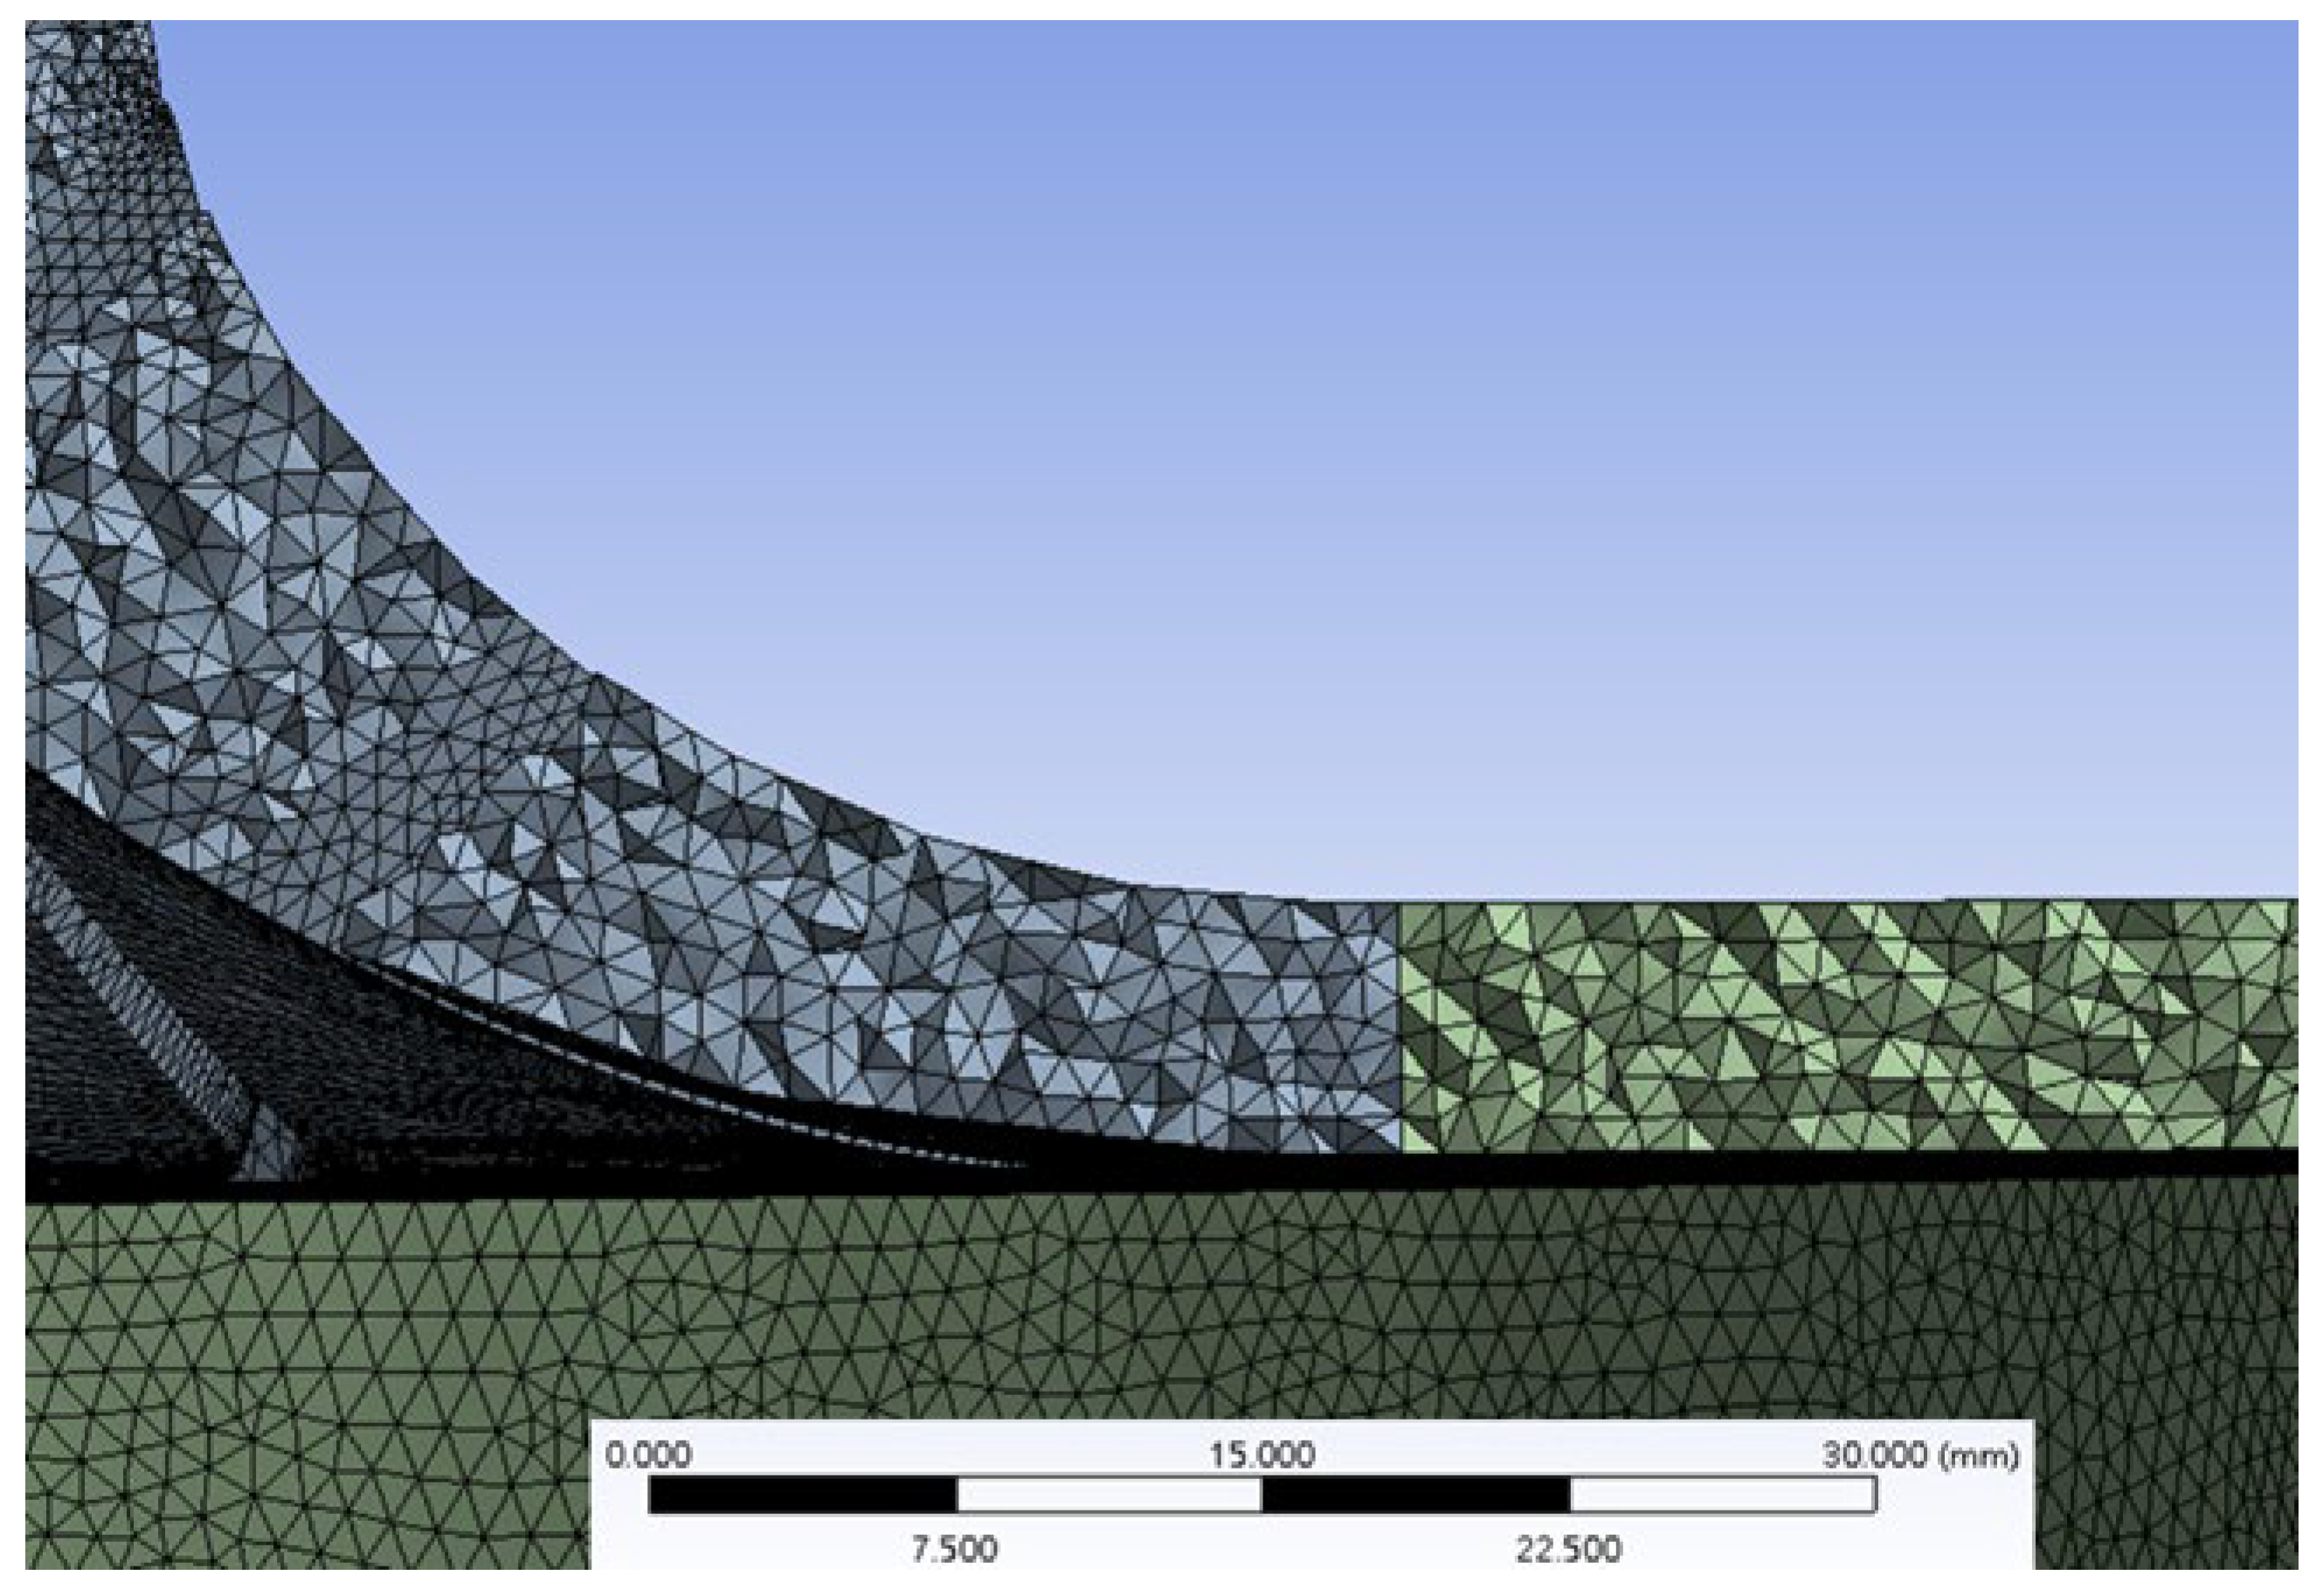
This study referred to the method of Ho et al. [16]. A compressor 3D model was built using SolidWorks drawing software and converted into a .step file, drawn in the Ansys-SpaceClaim drawing software for model building. Ansys-Meshing created the simulation mesh and the IPLV numerical simulation of R-513A refrigerant was then performed. The simulation result and the flow field were analyzed to observe if abnormal flow behavior occurred. The characteristic curves and compression ratio and flow efficiency curves were solved. The above method compared the numerical simulation results with shaft power and total pressure ratio experimental results in the literature. The results show that the simulation and experiment exhibited a consistent growth trend and confirmed the reliability of the procedure proposed in this study. Figure 4 shows the research procedure.

2.6. Meshing

Meshing is an important part of CFD simulation analysis. Improper meshing or incorrect boundary conditions can significantly influence the numerical simulation results. Creating a good mesh is especially important in CFD application. The mesh size will determine the quantity of cells and the calculation results. The mesh quality will determine the calculation convergence difficulty and the simulation results accuracy. Therefore, the two-stage centrifugal compressor mesh geometry was grown repeatedly. The mesh quality was verified and the computing time was considered. As a result, a mesh with excellent quality and about 6 million cells was grown. Additionally, this study performed numerical simulations of the first stage compression and the second stage compression individually. So, in the Stage 2 simulation model, an inlet straight pipe must be created in front of the impeller, which is helpful to the correctness of numerical simulation analyses, as shown in Figure 5, Figure 6, Figure 7 and Figure 8.

2.7. Boundary Condition Setting

The 150USRT magnetic levitation centrifugal refrigerant compressor channels were designed according to thermodynamic cycle analysis while searching for the appropriate relationship between the wheel diameter and rotation speed. The boundary conditions and IPLV parameters were determined, including the compressor inlet/outlet pressure. The actual compressor inlet temperature, pressure, and refrigeration cycle mass flow rate were then calculated. The boundary conditions for various loads are shown in Table 5, Table 6, Table 7 and Table 8.

3. Results

3.1. Description of Equations

(1)
Total Pressure Ratio
T o t a l   P r e s s u r e   R a t i o = P t o t , o u t P t o t , i n
P t o t , i n = Inlet Total Pressure (kPa); P t o t , o u t = Outlet Total Pressure (kPa)
(2)
Isentropic Efficiency
I s e n t r o p i c   E f f i c i e n c y = h t o t , s , o u t h t o t , i n h t o t , o u t h t o t , i n
  • h t o t , i n = Inlet Total Enthlpy (kJ/kg)
  • h t o t , o u t = Outlet Total Enthlpy (kJ/kg)
  • h t o t , s , o u t = Outlet Isentropic Total Enthalpy (kJ/kg)
(3)
Shaft Power
Shaft Power = Torque × ω
Torque = Torque of Impeller (Nm); ω = Rotating Speed of Impeller (rad/s)
After setting the boundary conditions, the results of simulation analysis in each IPLV load are shown in Table 9.

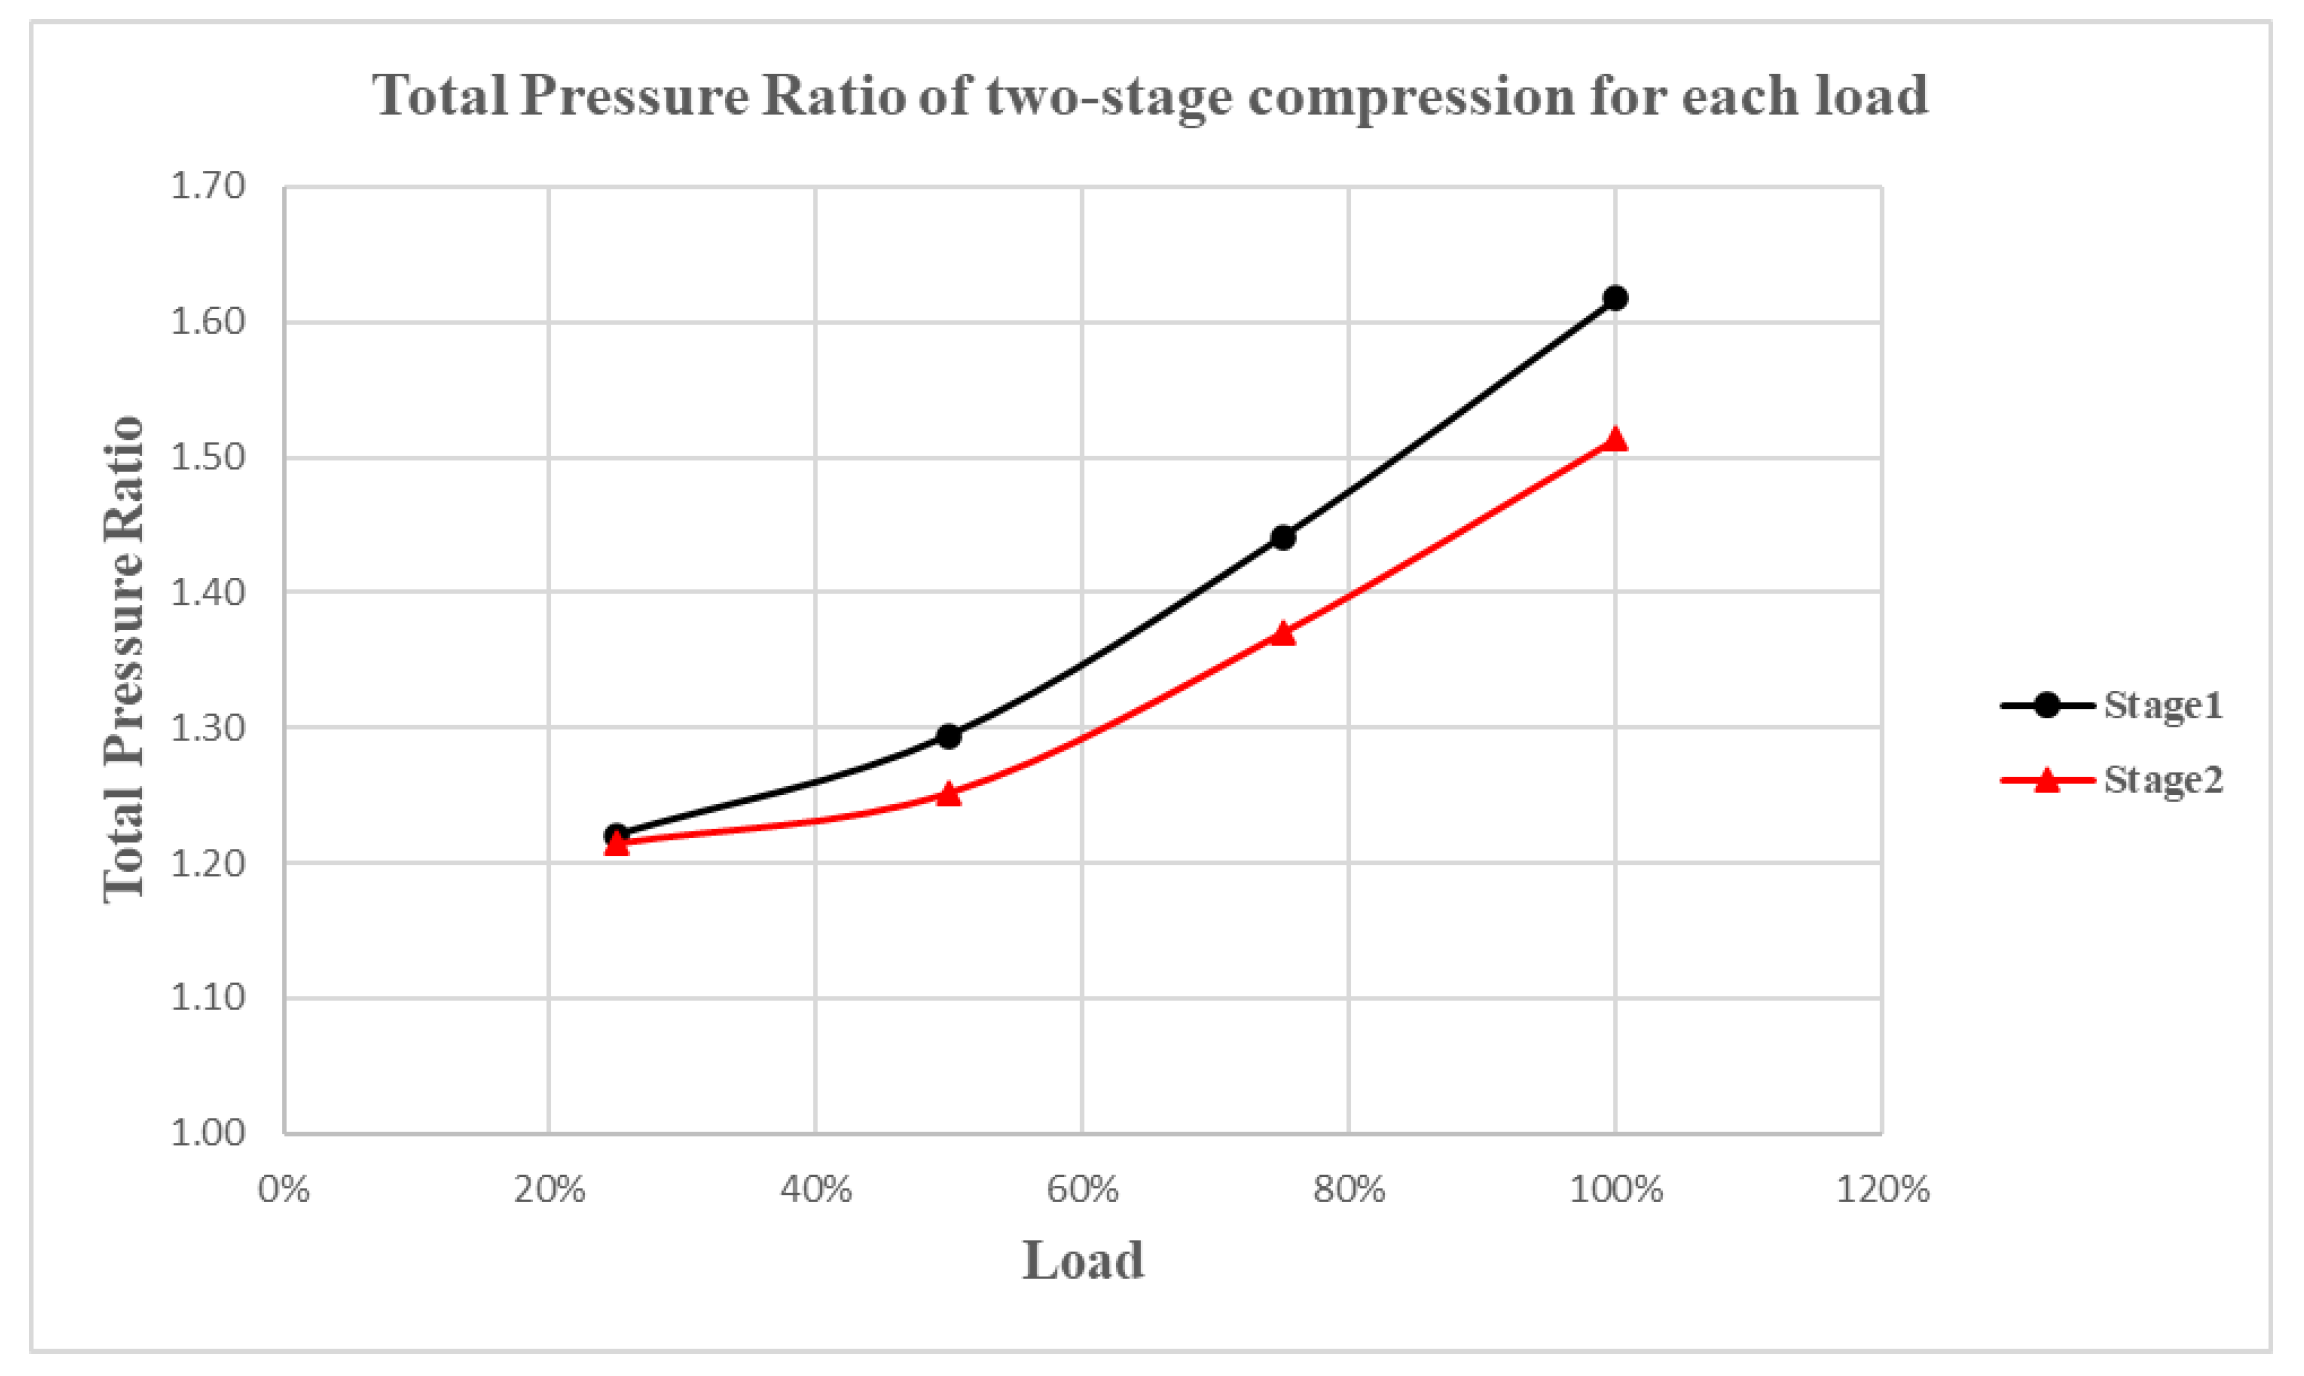
3.1.1. Total Pressure Ratios Comparison

According to the thermodynamic cycle system analysis, under the full load condition, the estimated first stage compression target pressure ratio is 1.60, and the second stage estimated target compression ratio is 1.52. According to the simulation results, in the 100% load case, the first stage and second stage total compression pressure ratios are 1.62 and 1.52, respectively. The total pressure ratio predicted by the numerical simulation can satisfy the operating condition for the centrifugal compressor thermodynamic cycle system with the refrigerating capacity. The total pressure ratio in the 75% load to 25% load separation point condition decreases to 1.22 and 2.21, respectively, as the rotor speed decreases, as shown in Figure 9.

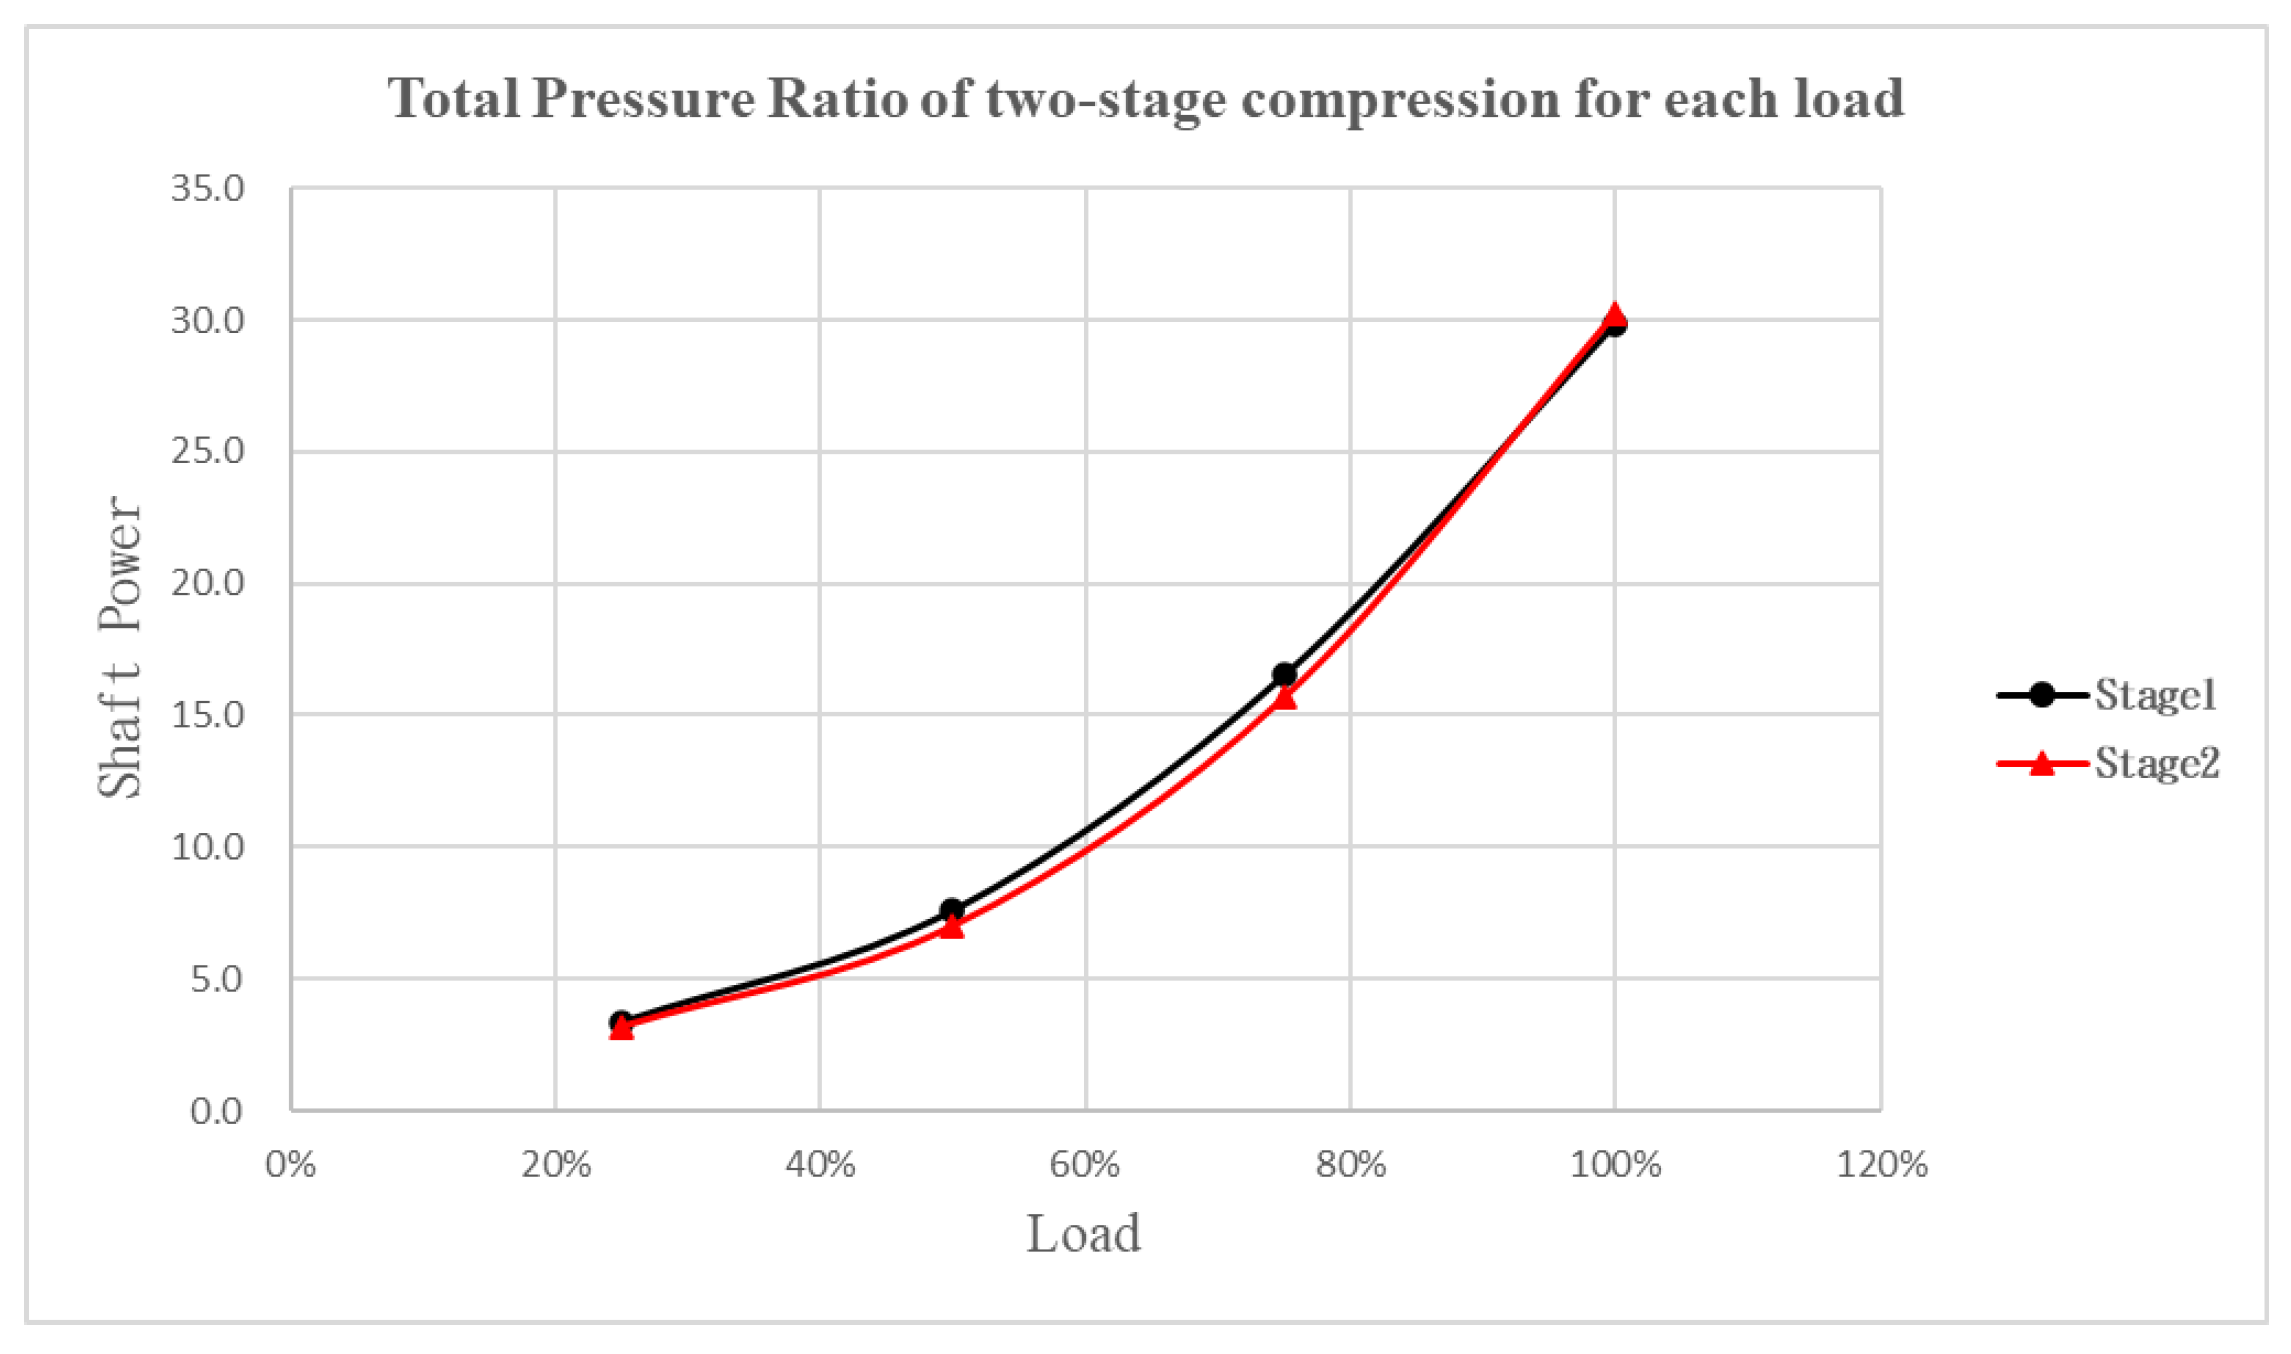
3.1.2. Shaft Power Comparison

Shaft power is the product of rotation speed and torque. The first and second stages have the same design speed condition under various loads, so their shaft power values will not differ much under various loads. The overall shaft power variation trend is consistent from 100% load to 25% load. The shaft power values for the first and second stage compression decrease from 29.8 kW to 3.4 kW and from 30.3 kW to 3.2 kW, respectively, as shown in Figure 10.

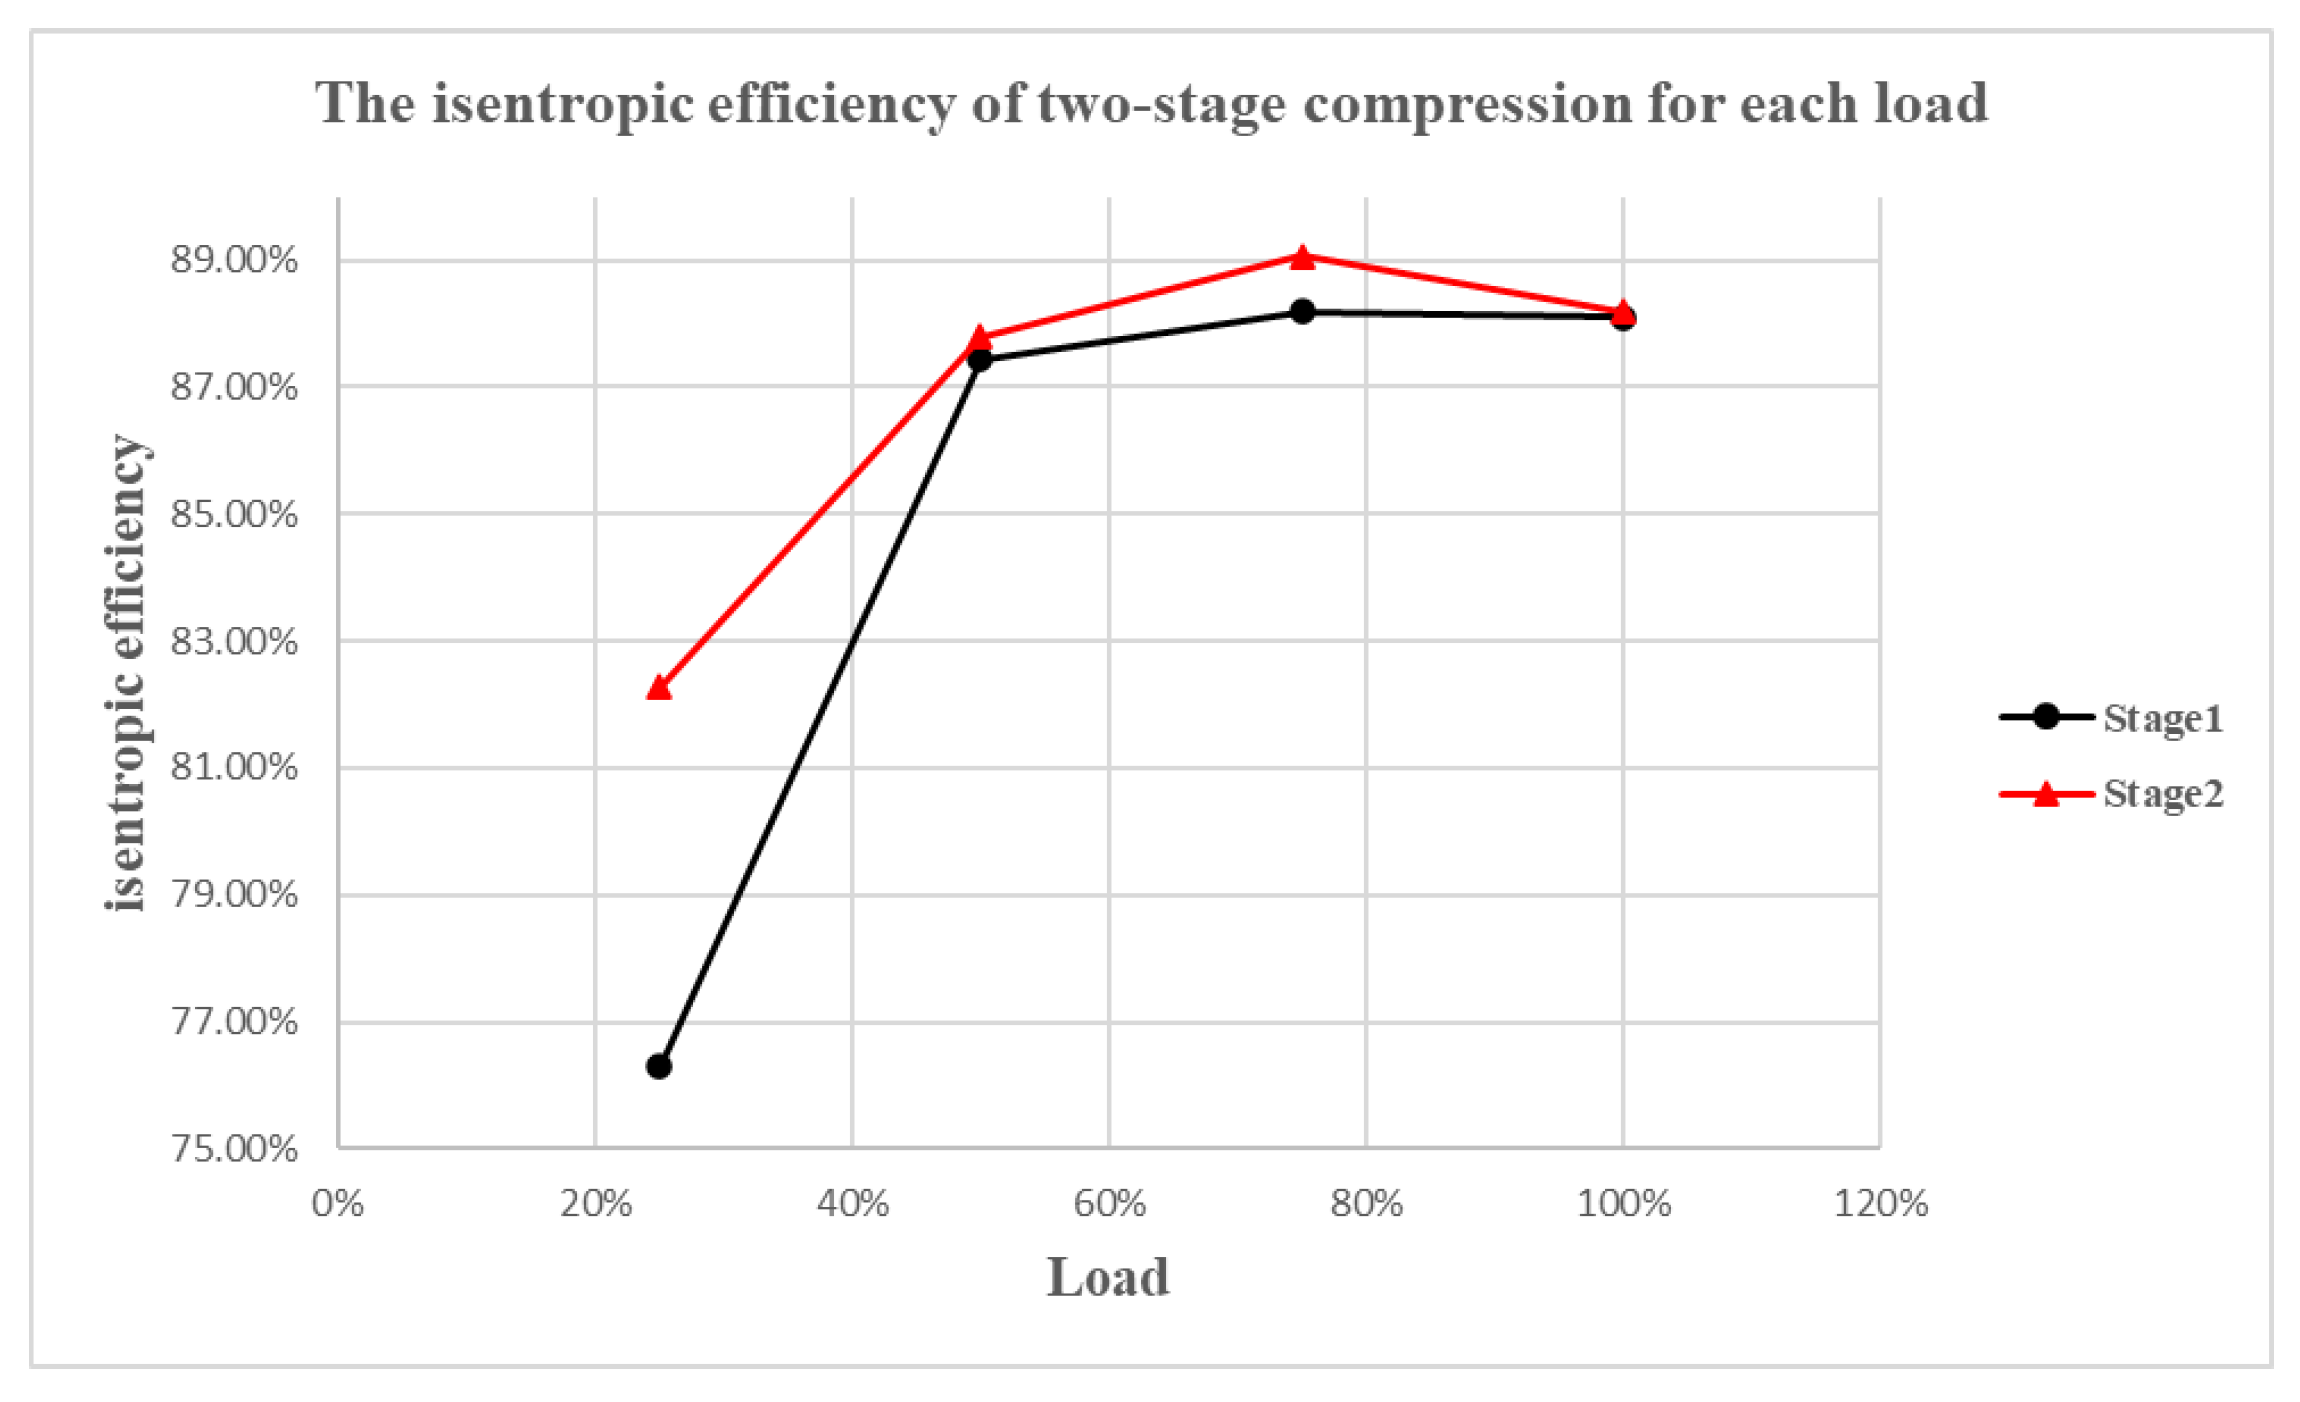
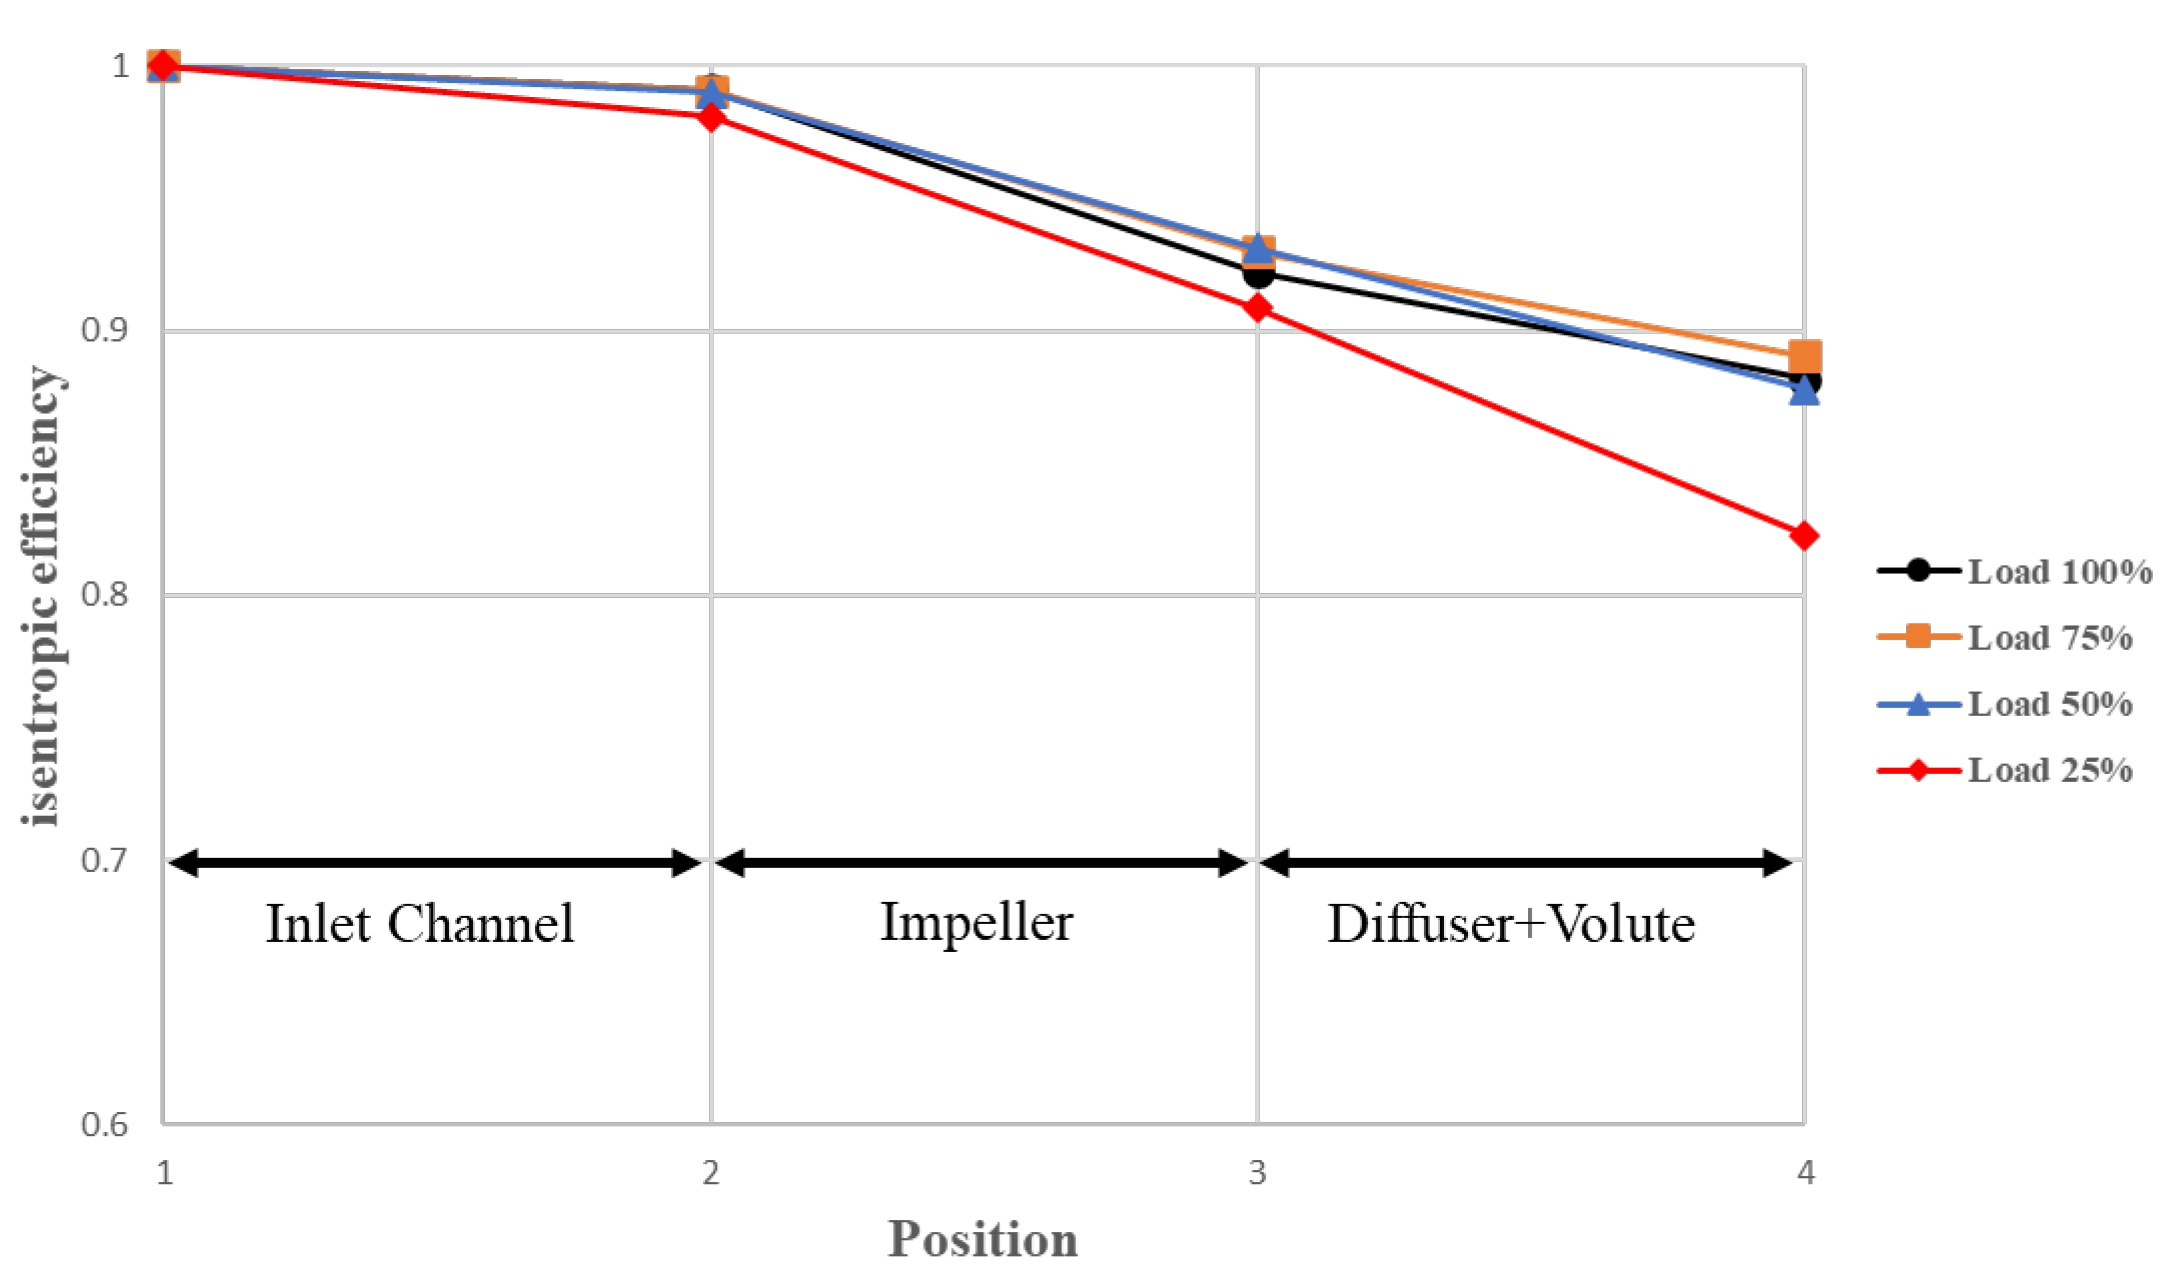
3.1.3. Comparison of Isentropic Efficiency

From 100% to 75% loads, the isentropic efficiency of the first and second stage compression was higher than 87%. In the 75% load case, the first and second stage compression had the maximum isentropic efficiency values, at 88.19% and 89.06%, respectively. In the 25% load case, the isentropic efficiency values for the first and second stage compression decreased to 76.30% and 82.28%, respectively. According to the isentropic efficiency value variation, the isentropic efficiency value was obviously lower in the 25% load case. This might be because the flow field was relatively disordered inside the compressor, leading to losses, as shown in Figure 11.
This study performed numerical simulation analysis according to the compressor flow elements configuration, including the inlet tube, impeller, diffuser, deswirl vane, and volute casing. The inlet face was taken as the reference plane to judge the isentropic efficiency variation in the compressor flow elements. As shown in Figure 12 and Figure 13, the first and second stage fluid compression moved from the inlet tube to the deswirl vane or volute casing through various flow elements. The isentropic efficiency decreased and the isentropic efficiency slope descended further in the 25% load case than in the other three cases.

3.2. Flow Field Simulation Result Analysis

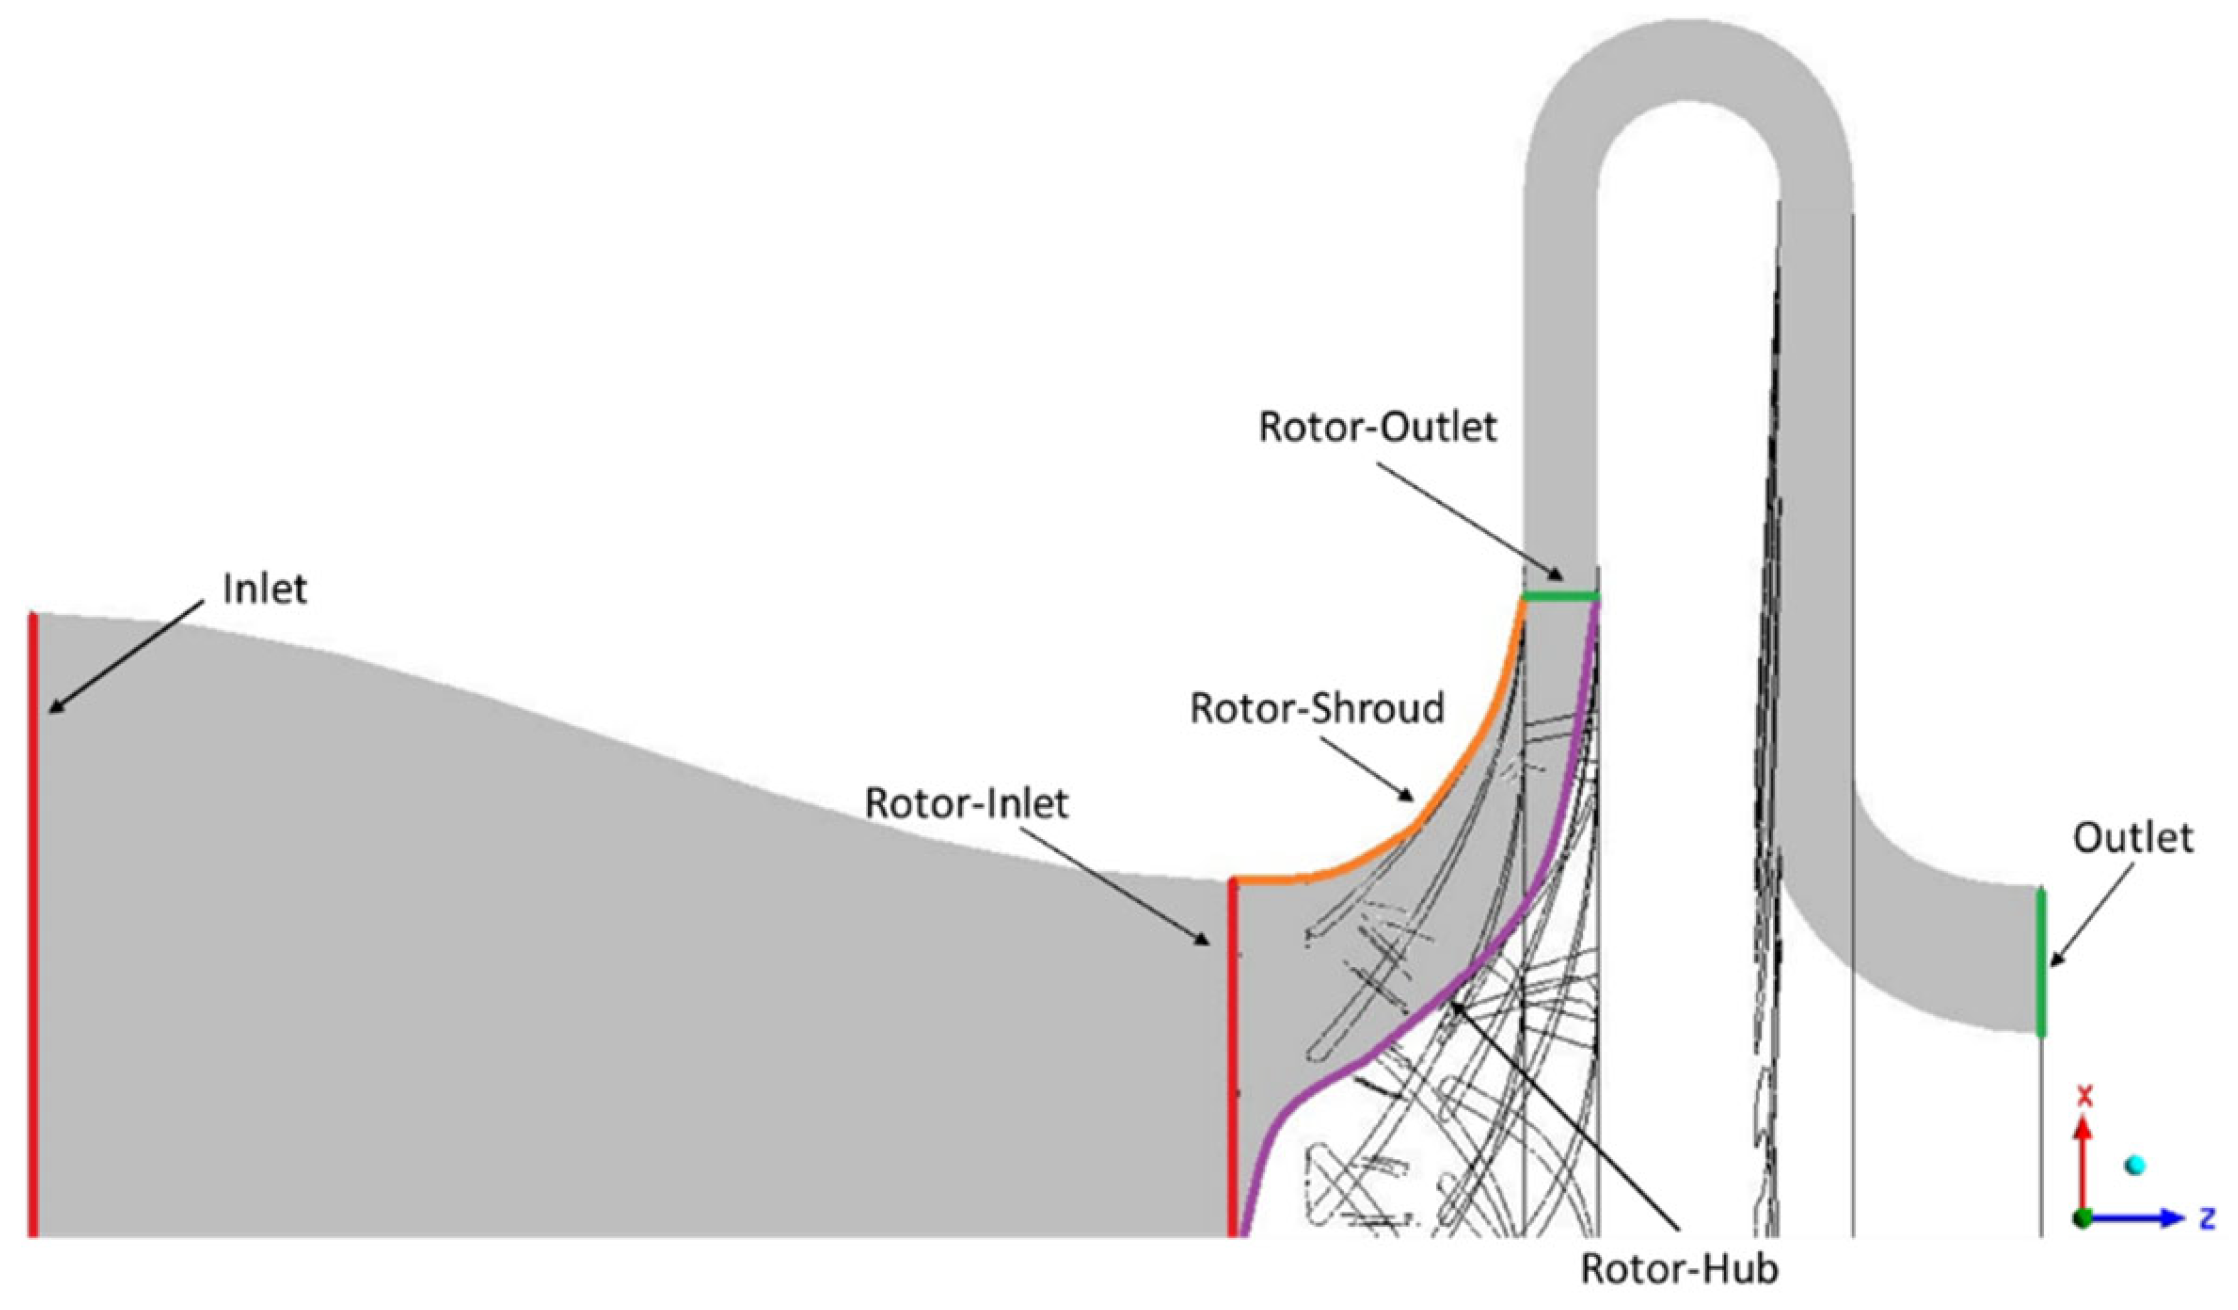
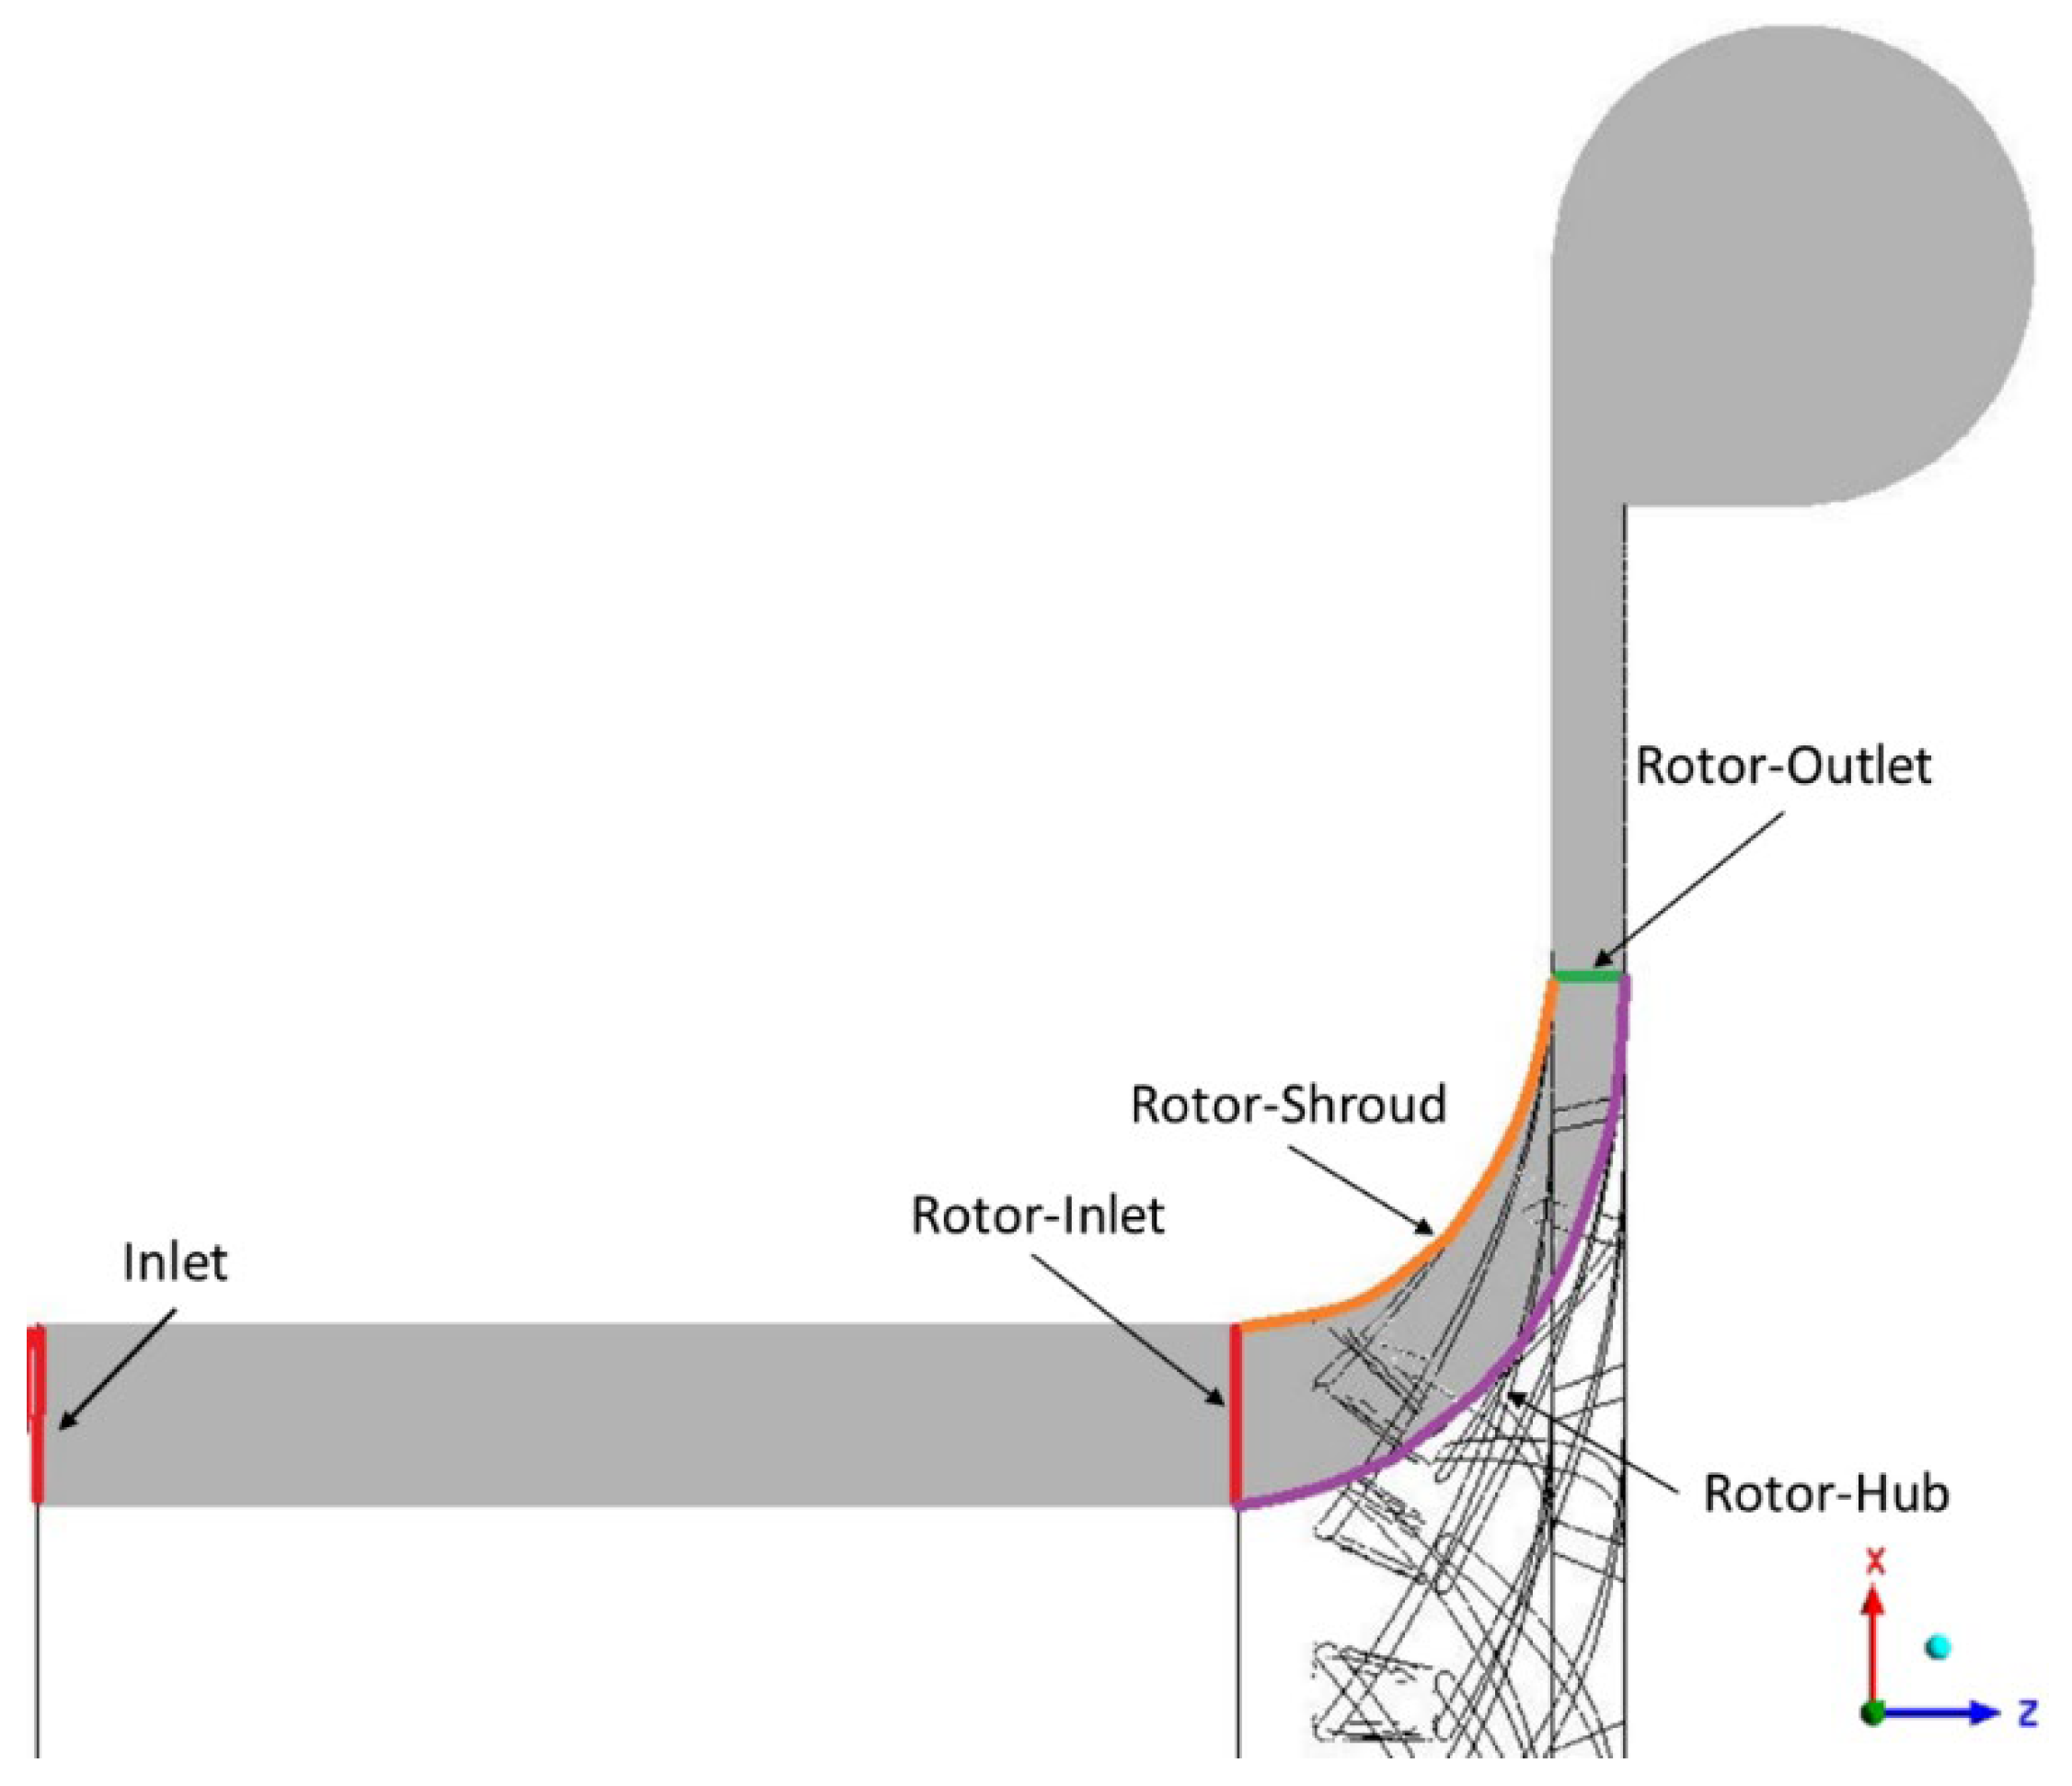
3.2.1. Flow Field Simulation Analysis Description

The first stage meridional flow field sampling location is on the ZX plane based on the rotor revolving shaft. The meridional flow field variation is displayed as a half section. The first stage R-513A refrigerant fluid moved into the inlet marked in red and out of the outlet marked in green. The orange mark represents the impeller shroud, the purple mark represents the impeller hub, and the impeller rotation direction is indicated in the z-axis. All of the above marks are shown in Figure 14 and Figure 15.

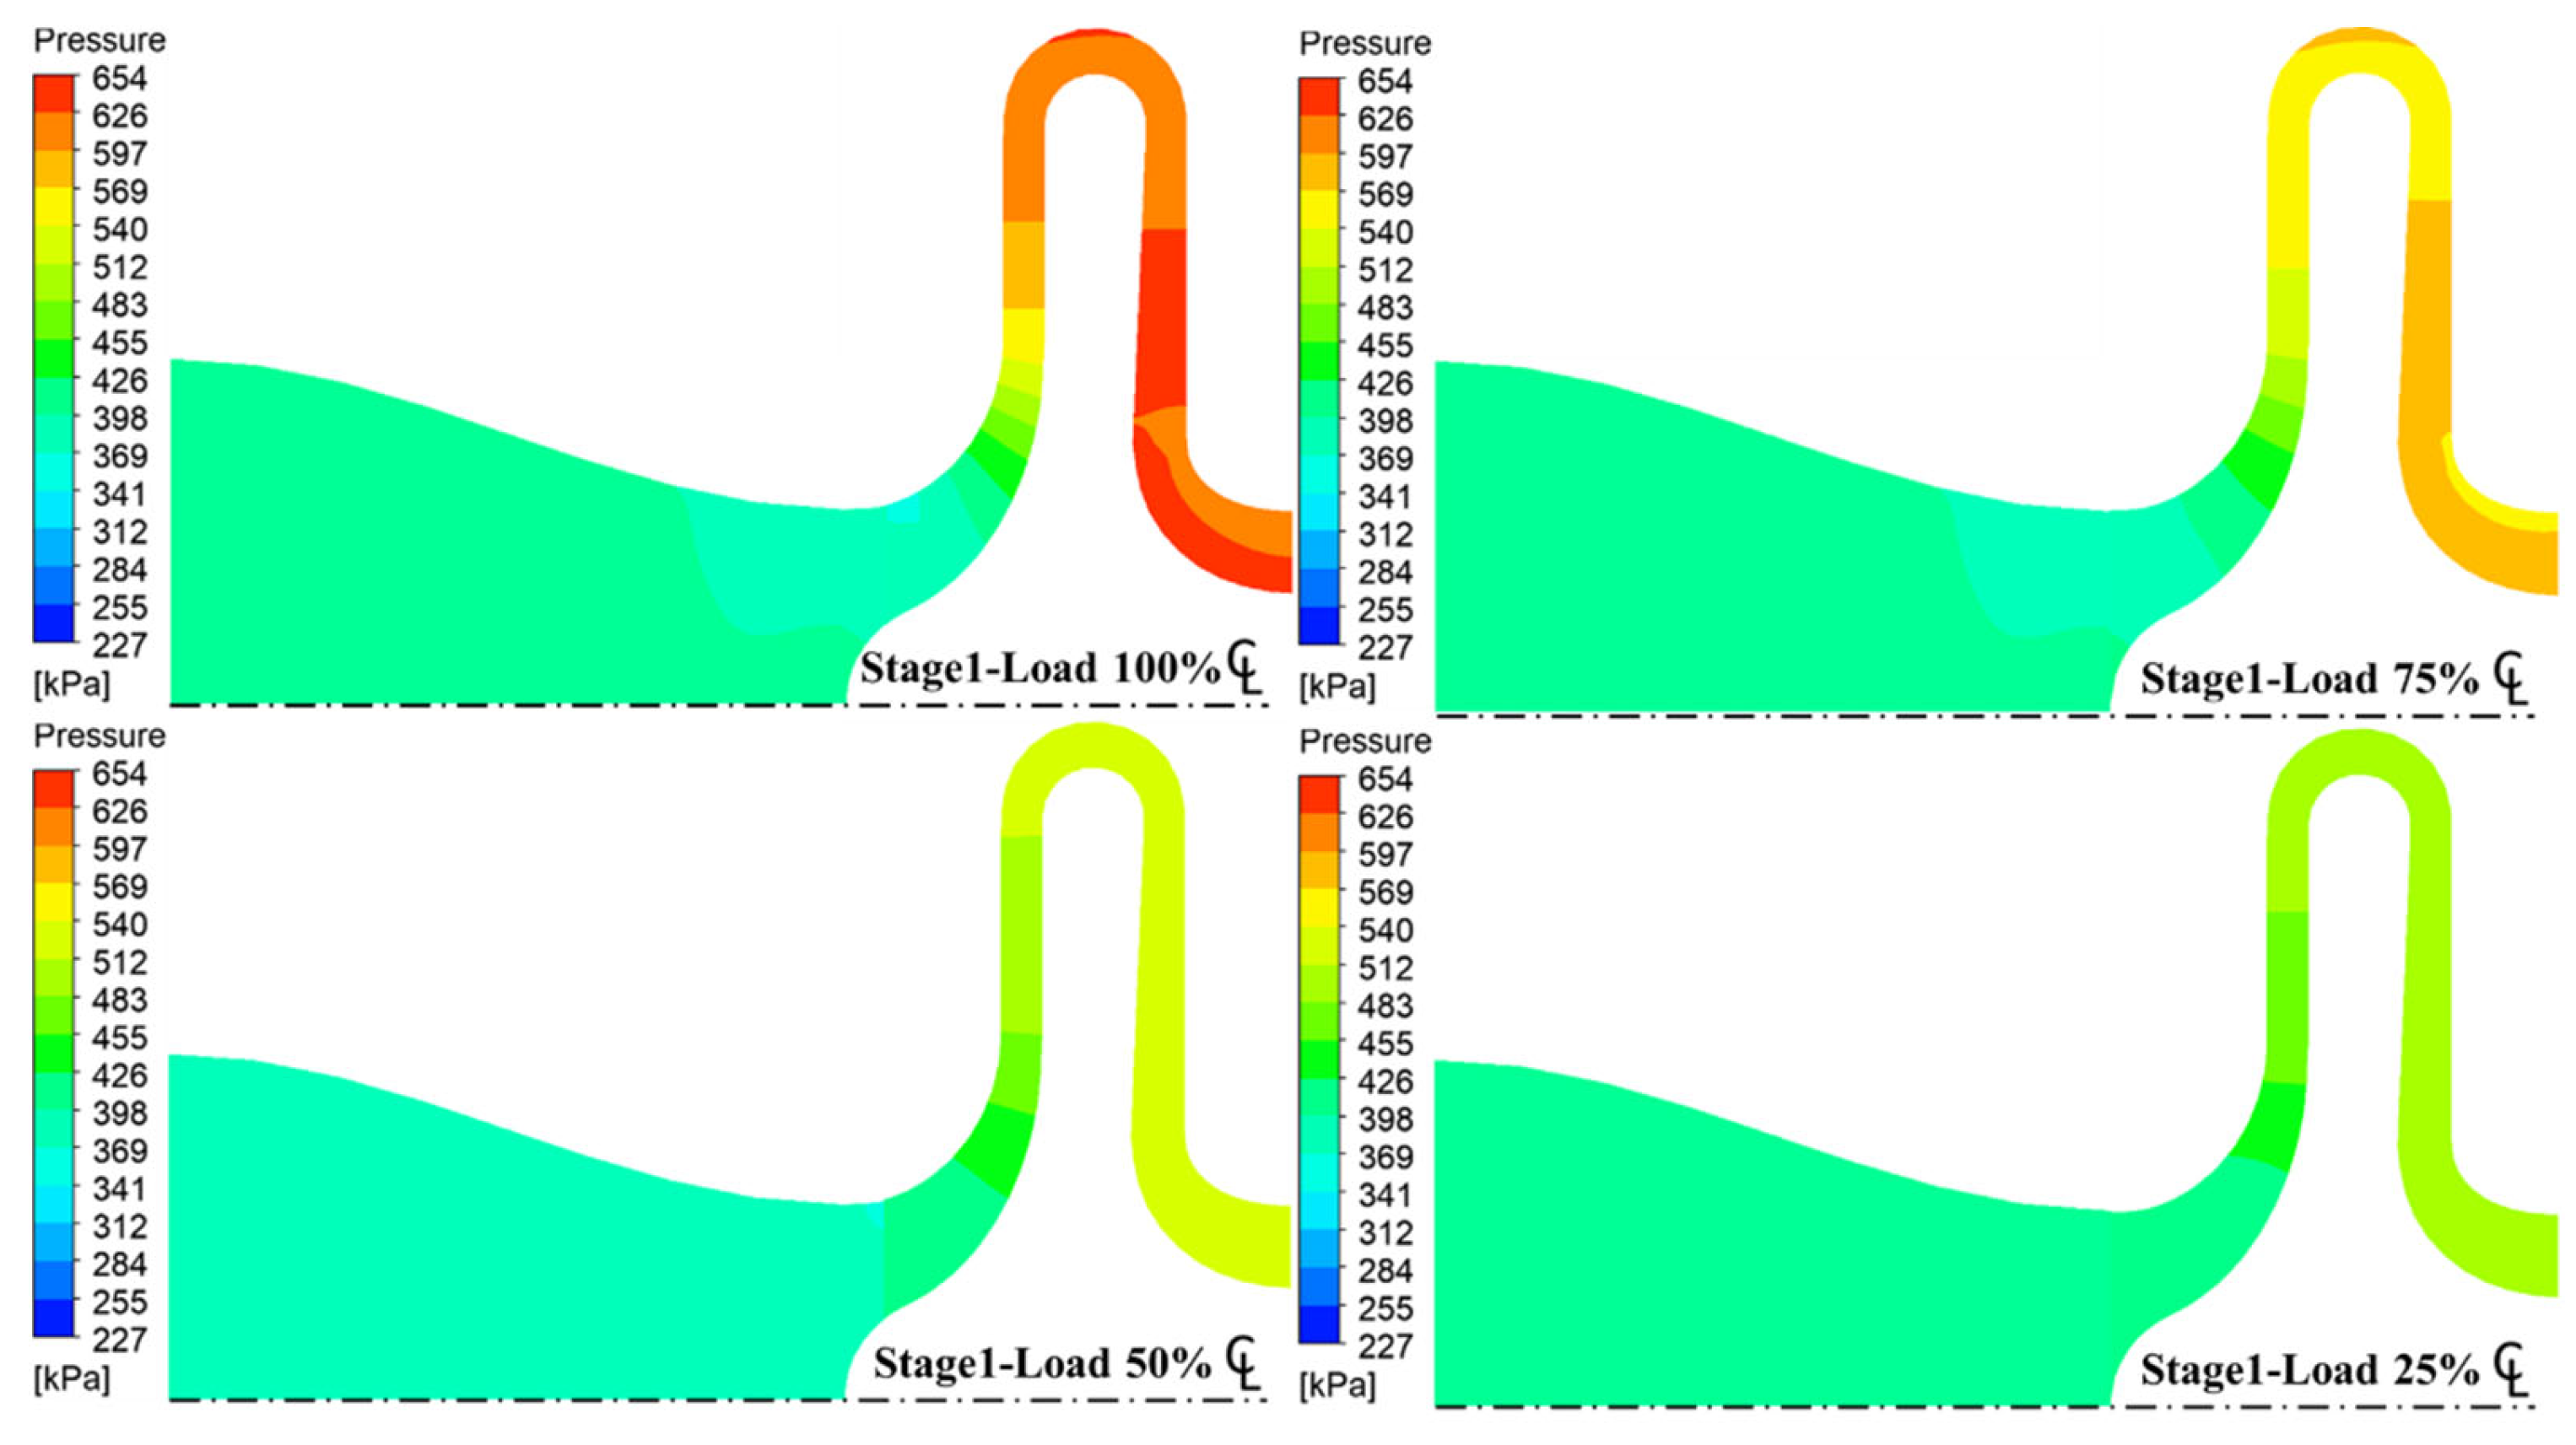
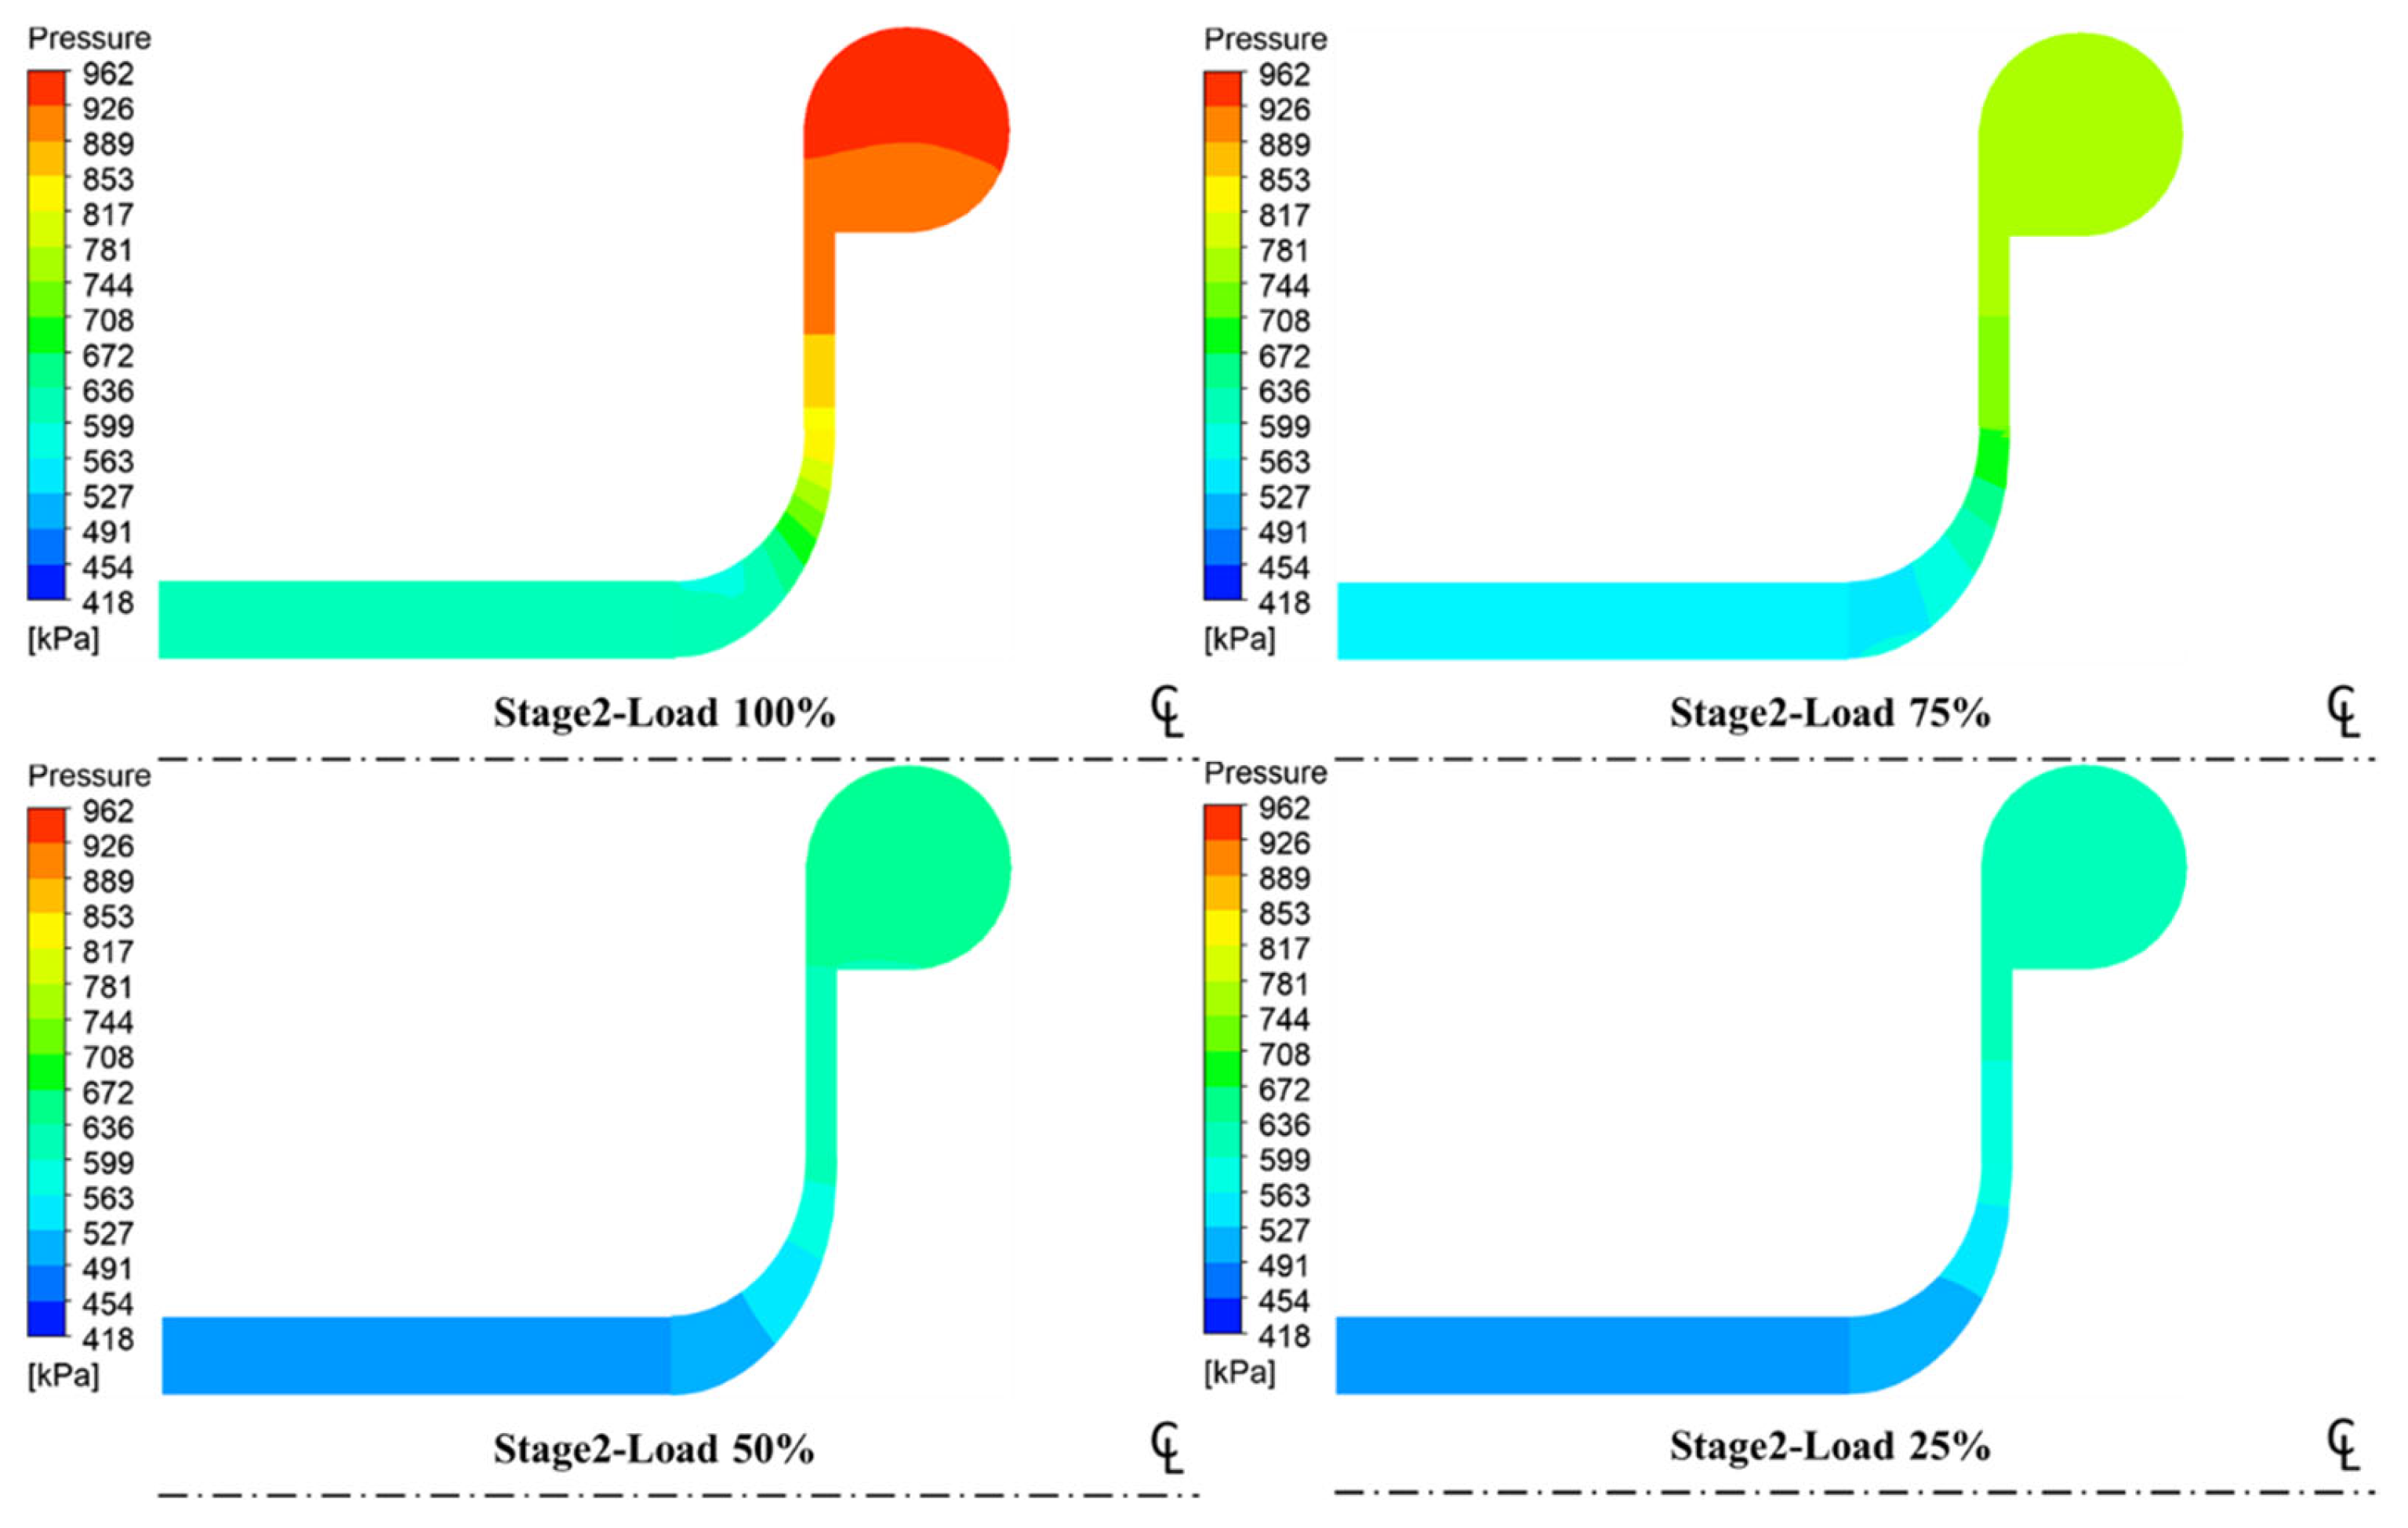
3.2.2. Pressure Contour

According to the pressure meridional contour maps under various loads, the maximum pressures of the first and second stage compressions occurred at the outlet under the full load condition. The minimum first stage compression occurred at the impeller inlet under the full load condition and 75% load. The pressure rose gradually in the direction normal to the streamline when passing through the impeller flow elements. As a result, the maximum pressure gradient was on the meridian plane of the first stage compression under full load condition. As the load decreased to 25%, the first stage compression impeller inlet pressure rose, the outlet pressure decreased, and the second stage inlet pressure and outlet compression decreased, as shown in Figure 16 and Figure 17.

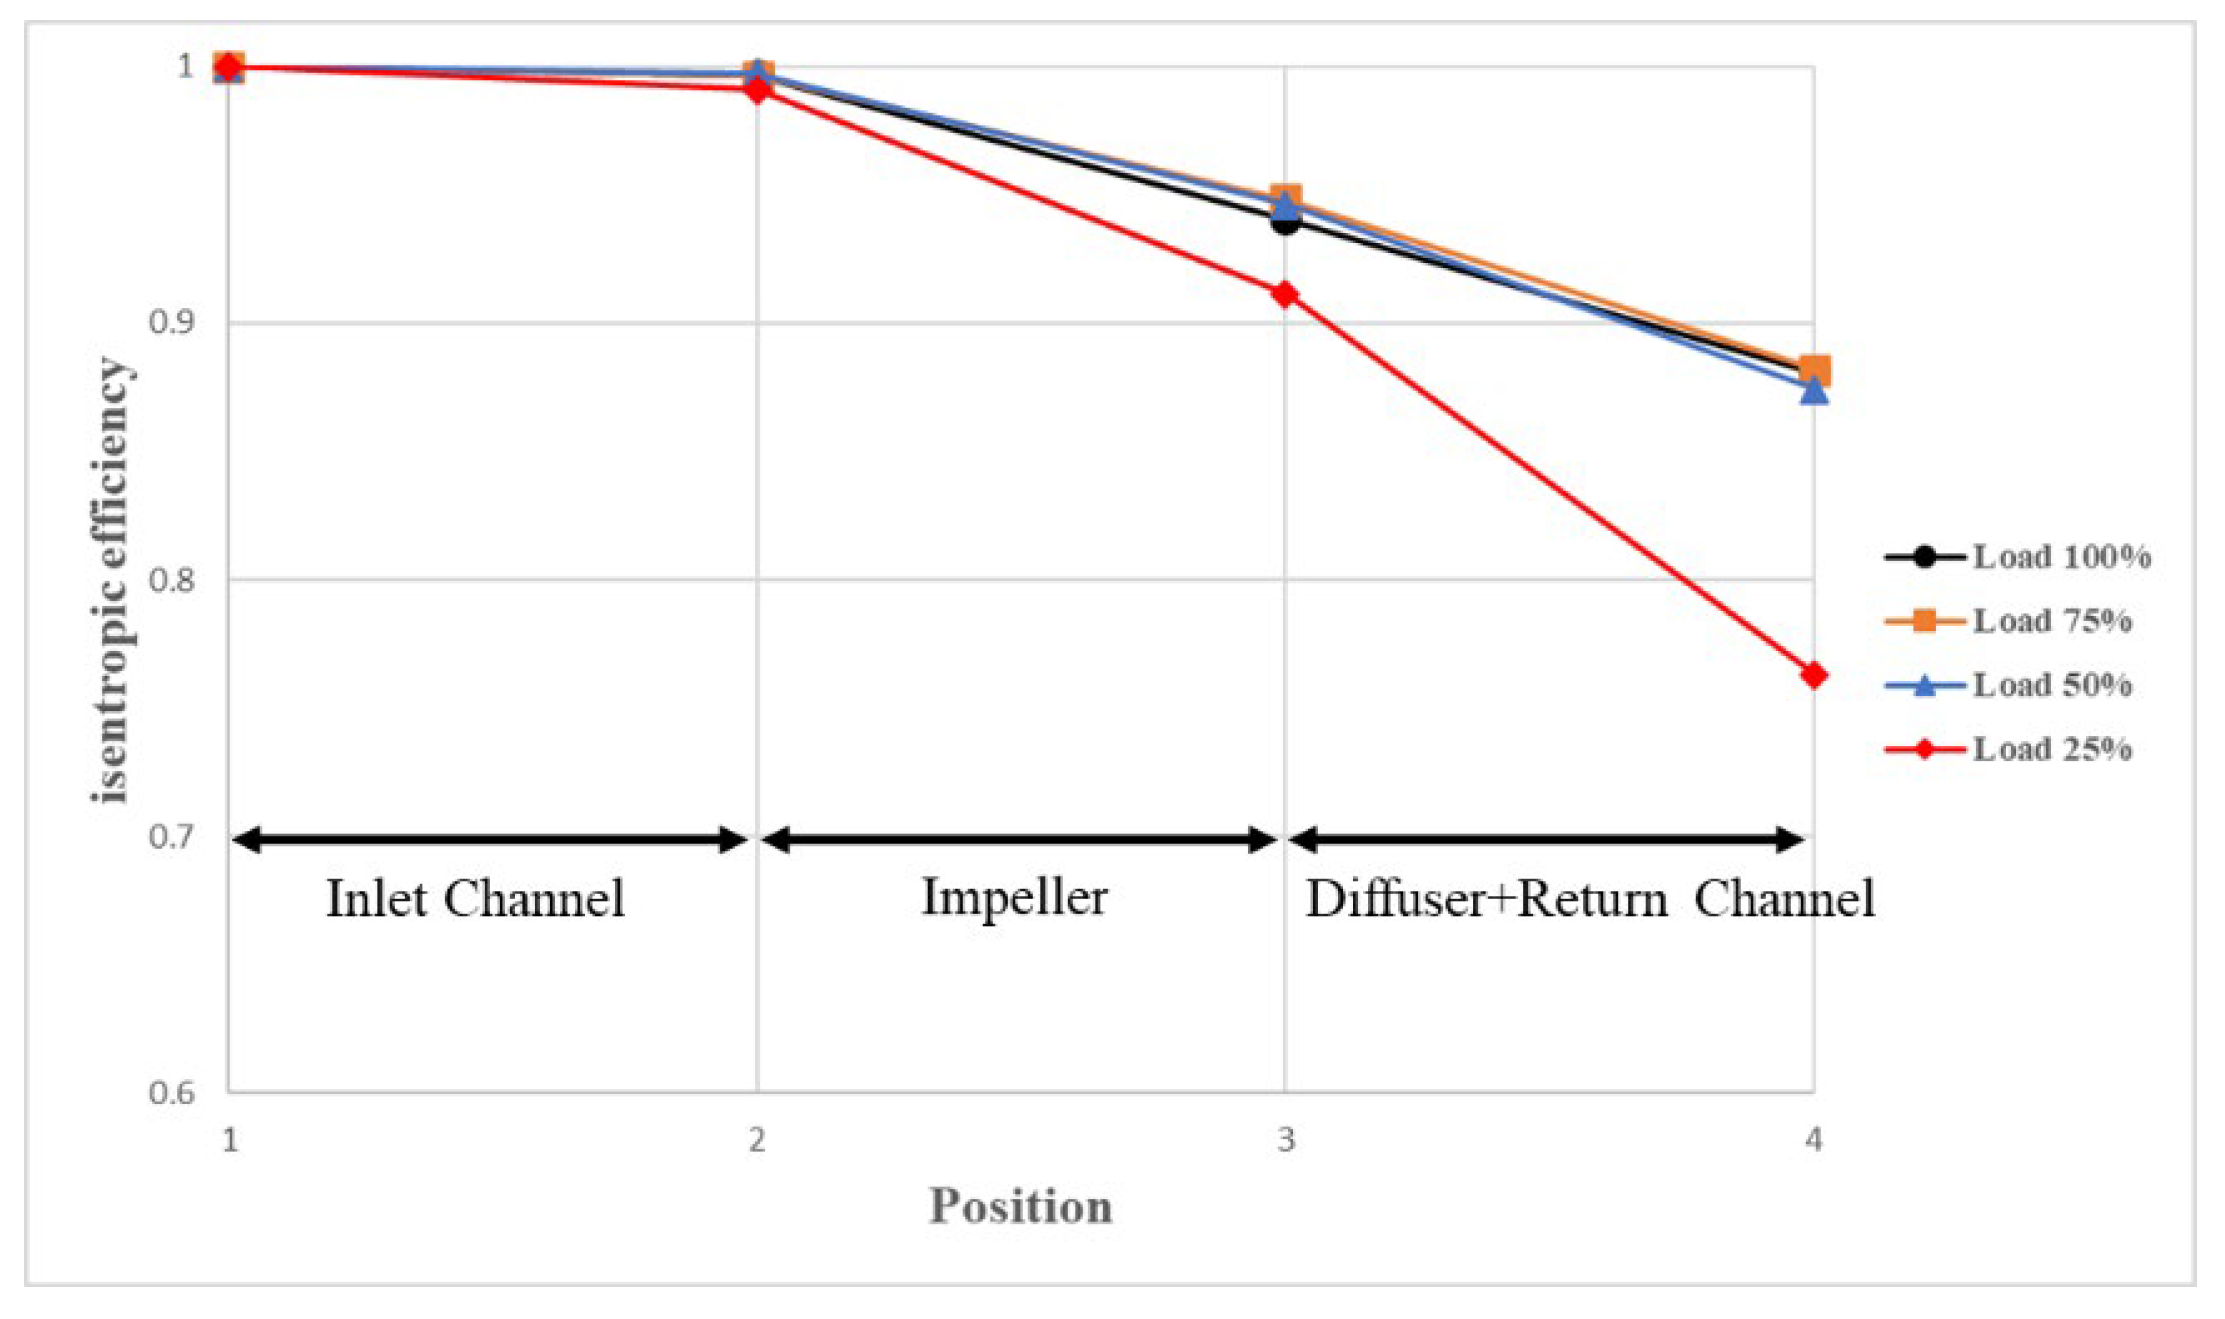
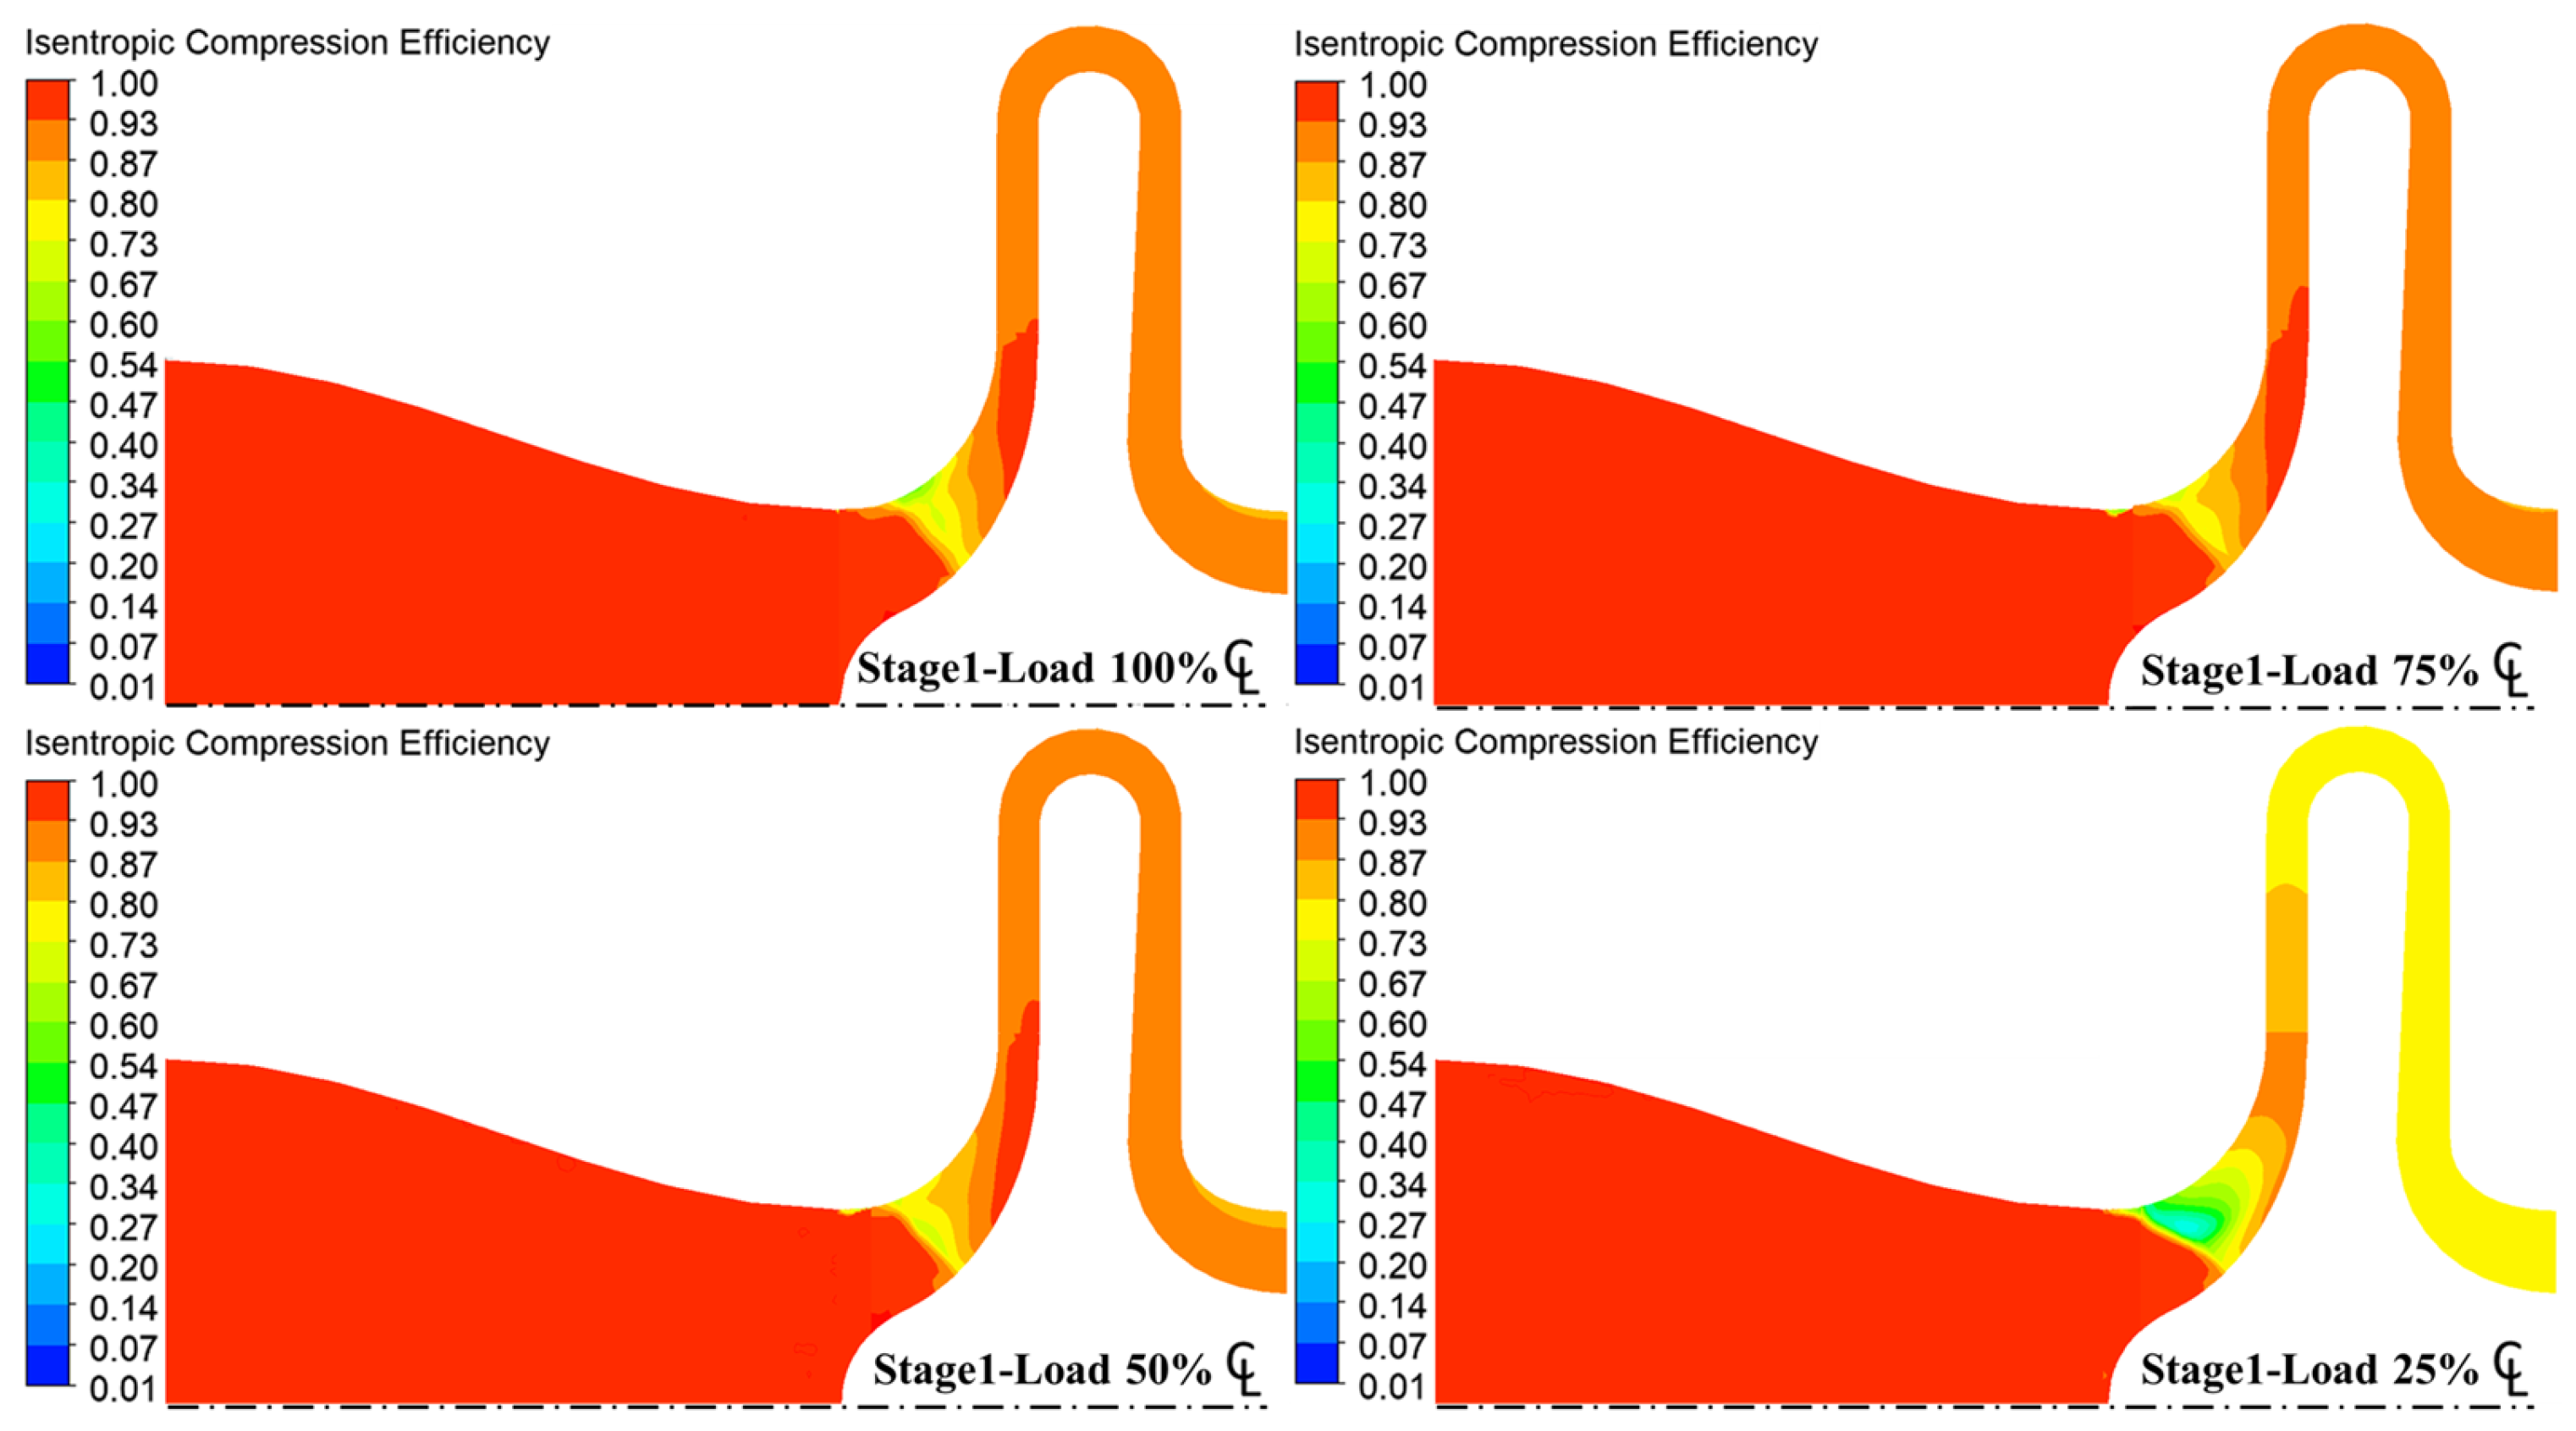
3.2.3. Isentropic Compression Efficiency Contour

According to the meridional contour maps for isentropic efficiency at various loads, the isentropic efficiency values for the first and second stage compressions at the inlet remain approximated to 1. However, the isentropic efficiency value decreased as the impeller flow elements rotated. The isentropic efficiency value at the outlet was influenced directly. In the first and second stage compressions, the isentropic efficiency values at the impeller and outlet decreased with the load. In the 25% load case, the isentropic efficiency drop in the first stage compression was larger than that in the second stage compression, as shown in Figure 18 and Figure 19.

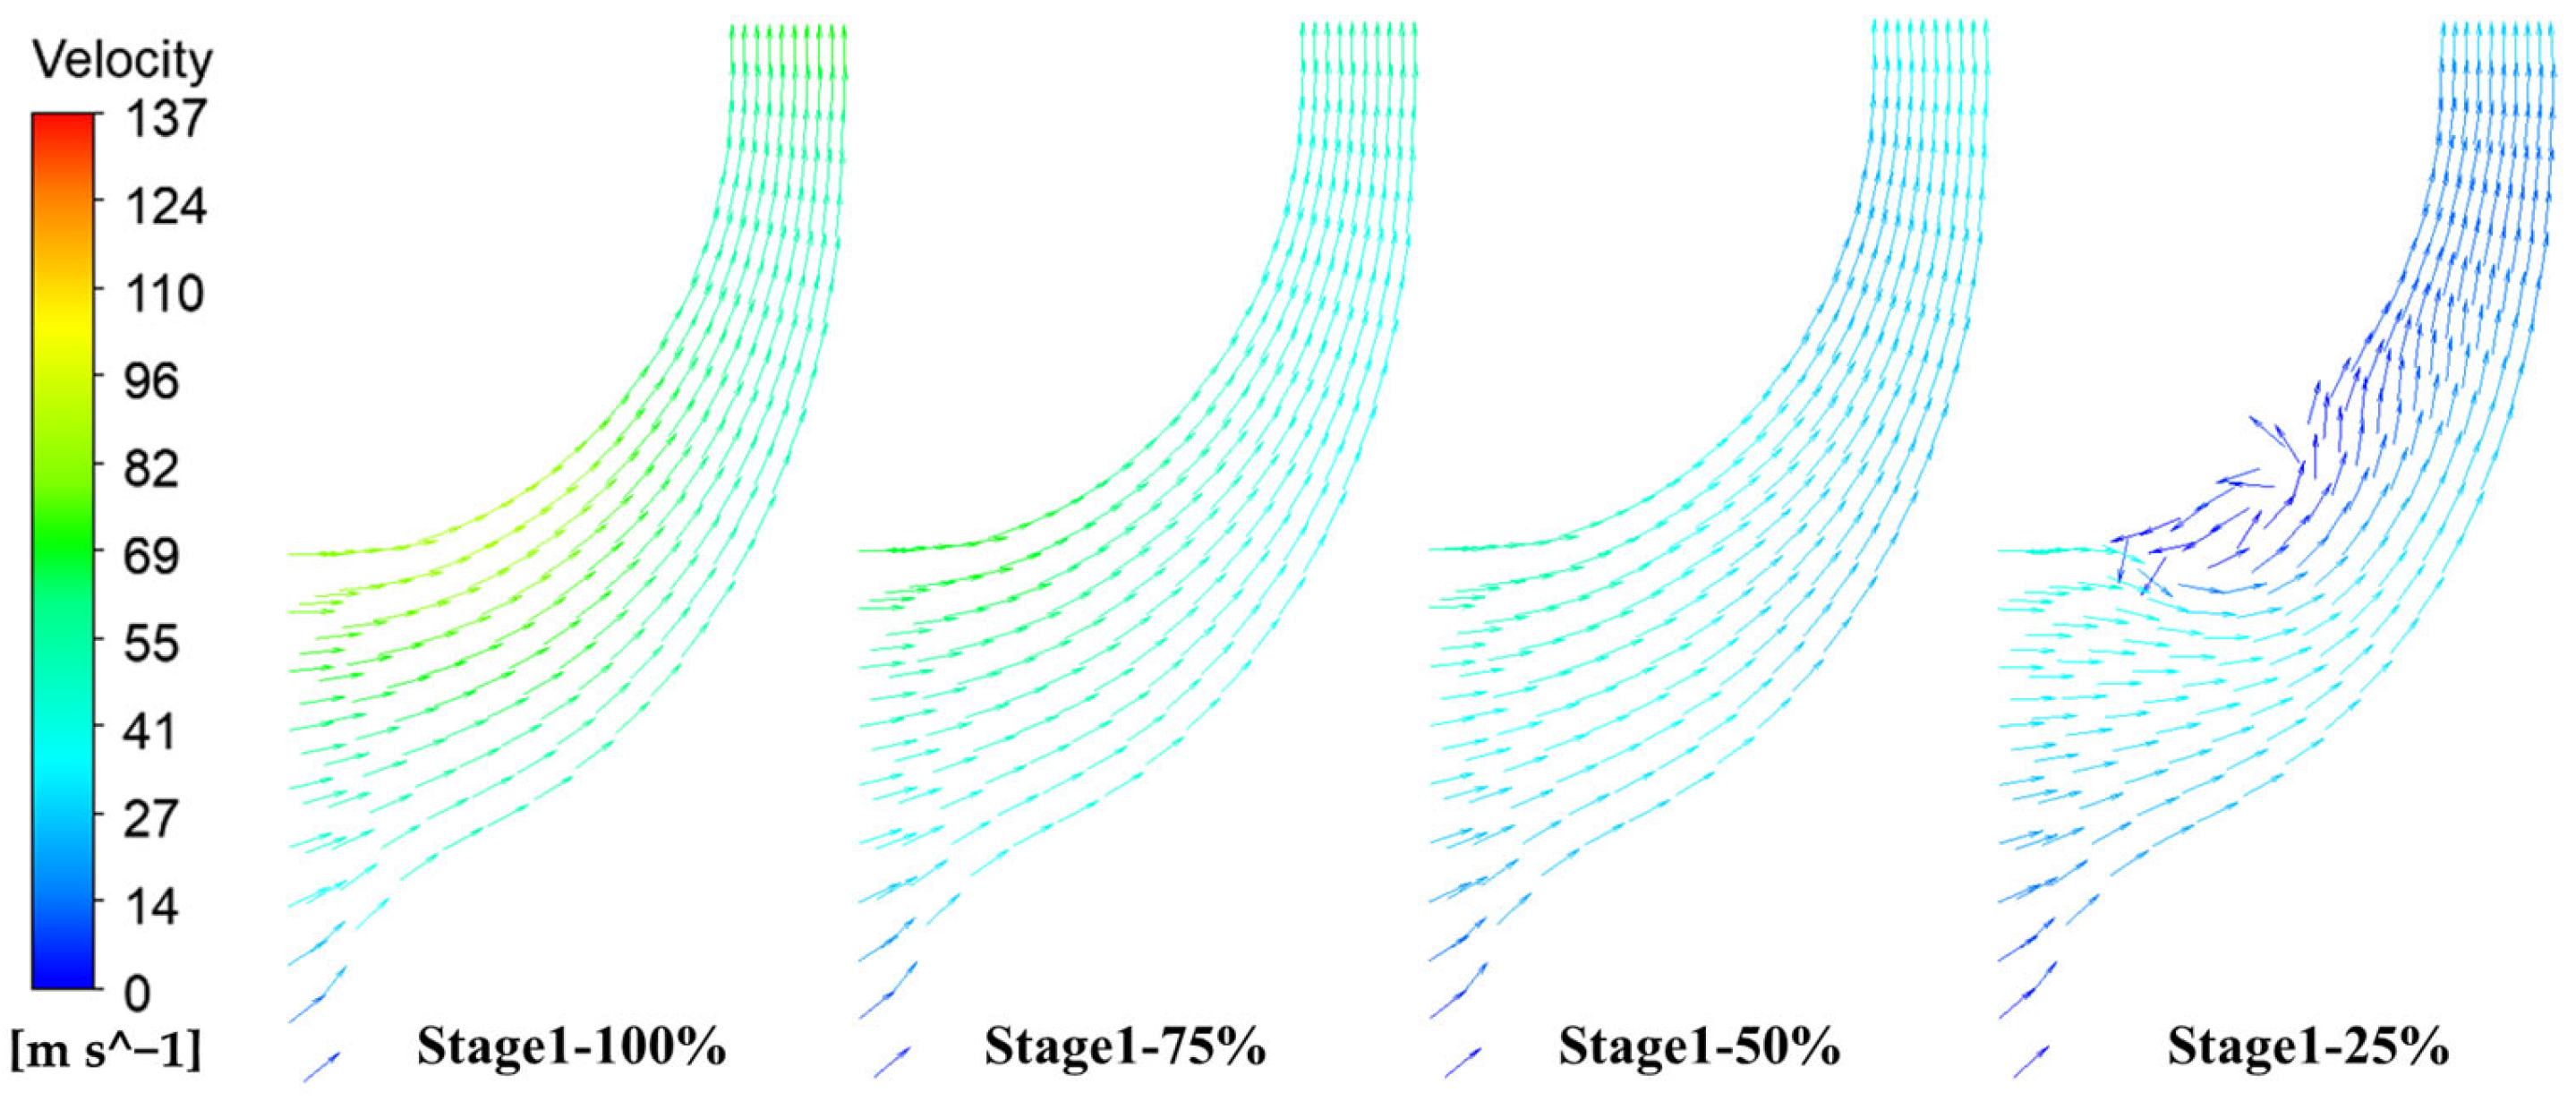
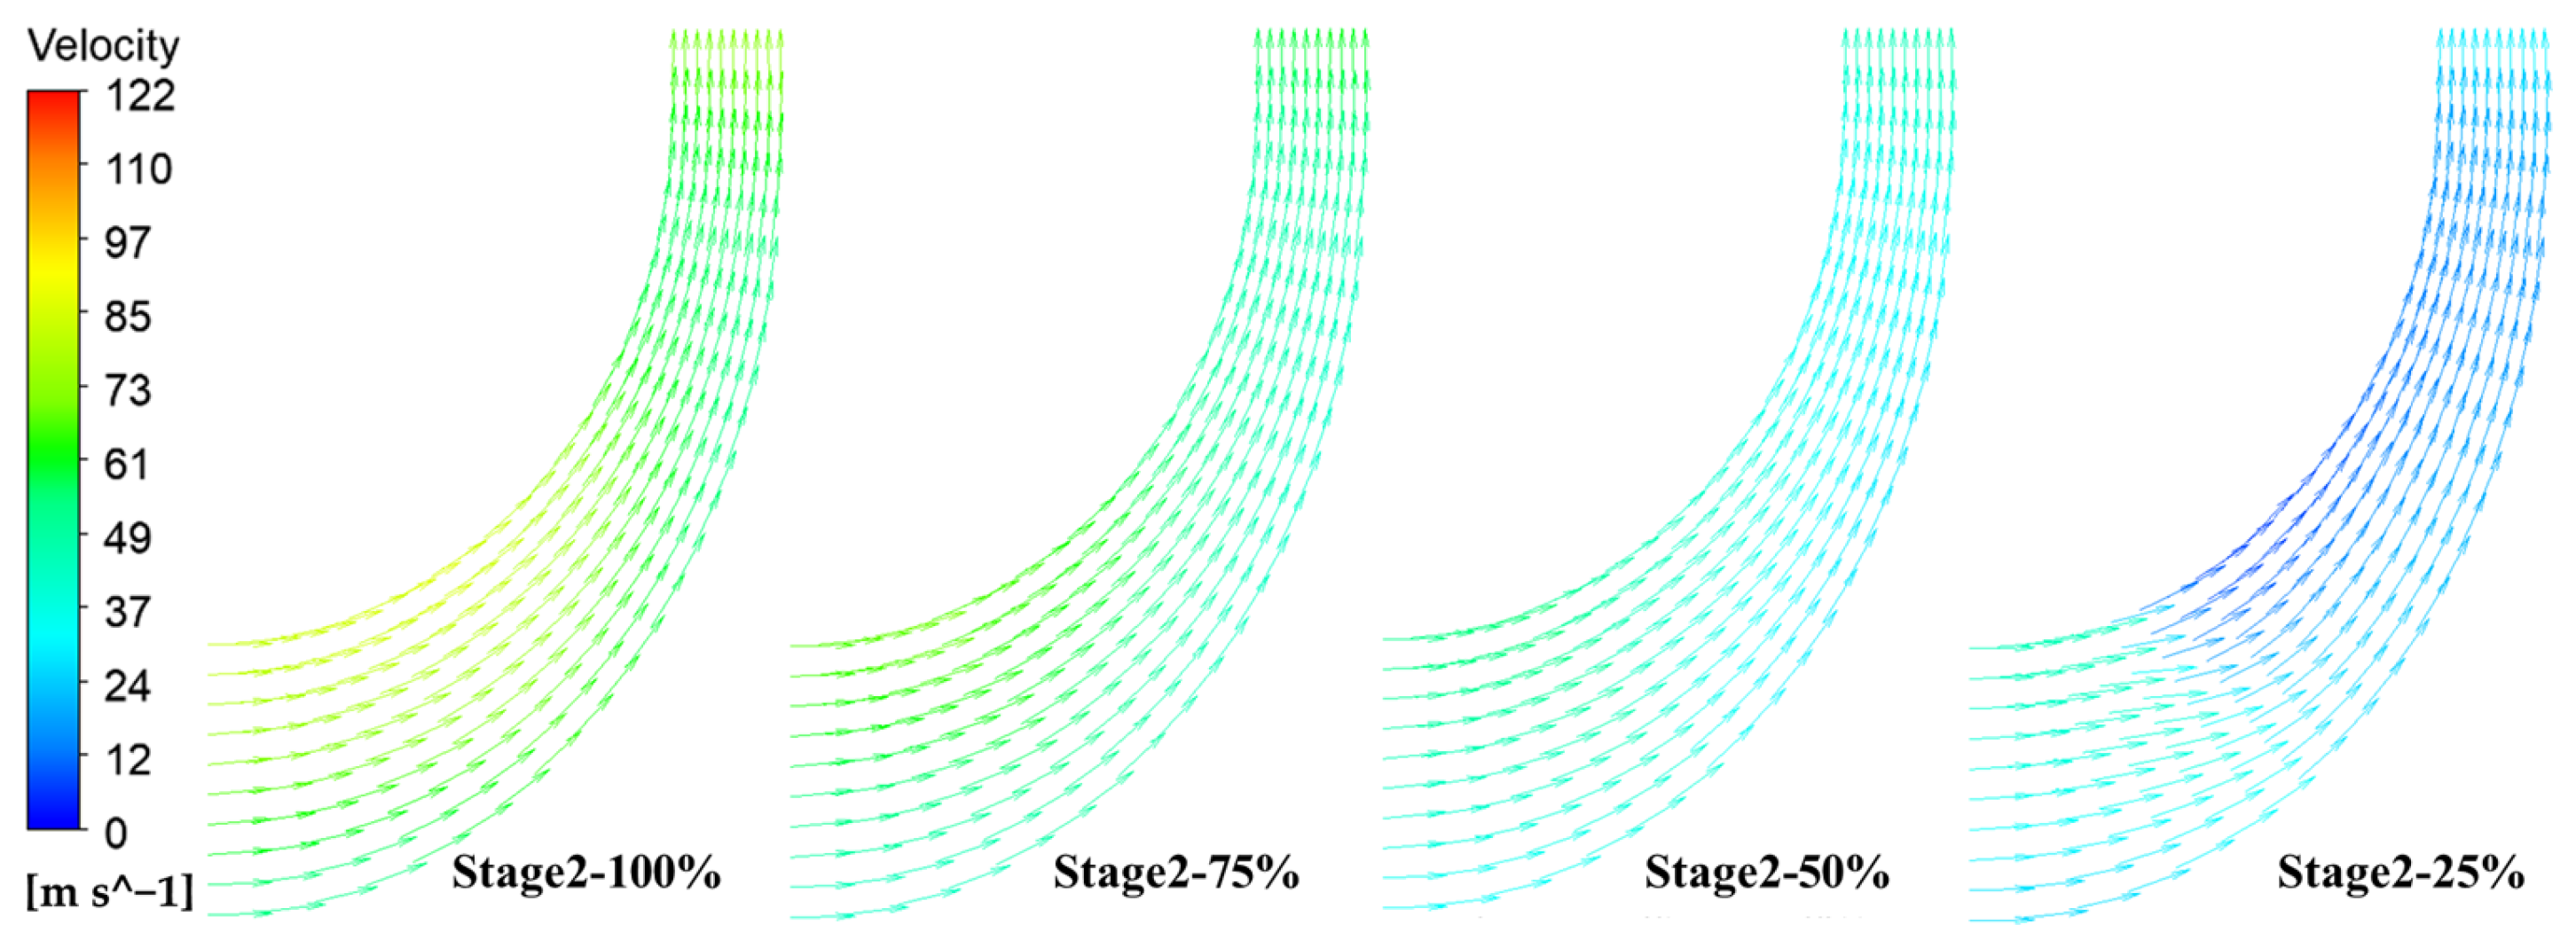
3.2.4. Velocity (Rotor) Vector

According to the impeller meridional velocity vector diagrams under various loads, the maximum flow velocity for the first and second stage compressions occurred near the impeller shroud under the full load condition and decreased gradually from the shroud to hub. The minimum flow velocity occurred at the shroud under 25% load. In the first stage compression under 25% load, there was an obvious eddy current at the impeller inlet shroud. This might be because this condition was relatively close to the compressor surge point. This eddy current significantly influenced the overall compressor efficiency, as shown in Figure 20 and Figure 21.
According to the study by Carlo Cravero et al., in the case without the ported shroud configuration, the compressor back-flow phenomenon extends from the impeller shroud to the impeller inlet when near the surge. This flow field pattern is the same as that in the simulation results from this study [24].

4. Discussion and Conclusions

A two-stage centrifugal compressor with a refrigeration capacity of 150USRT was successfully designed in this study using R-513A refrigerant. The design point verification was completed using CFD simulation. The compressor performances under four IPLV conditions were compared and discussed using the separation point simulation examples.
The numerical simulation analysis results for the R-513A refrigerant two-stage centrifugal compressor under various IPLV loads indicate that:
  • In the 75% load case, the first and second stage compressors had the maximum isentropic efficiency values, 88.19% and 89.06%, respectively. The isentropic efficiency values were minimized in the 25% load case to 76.30% and 82.28%, respectively.
  • The pressure ratios for the first and second stage compressors decreased with the load. The pressure ratio for the first stage compressor decreased from 1.62 to 1.22. The pressure ratio for the second stage compressor decreased from 1.51 to 1.21.
  • In the 25% load case, an obvious eddy flow field distribution occurred at the impeller shroud of the first stage compressor. There was no eddy flow field distribution at the impeller shroud for the second stage compressor. Nonetheless, the flow velocity at the impeller shroud was approximated to 0 m/s, leading to a decrease in isentropic efficiency.

Author Contributions

Conceptualization, Y.-D.K. and K.-S.H.; methodology, Y.-D.K. and K.-S.H.; software, W.-C.H. and Y.-C.L. investigation, Y.-D.K. and K.-S.H.; resources, Y.-D.K. and K.-S.H.; datacuration, W.-C.H. and Y.-C.L.; writing—original draft preparation, W.-C.H. and Y.-C.L.; writing—review and editing, Y.-D.K. and K.-S.H.; visualization, W.-C.H. and Y.-C.L.; supervision, Y.-D.K. and K.-S.H.; project administration, Y.-D.K. and K.-S.H.; funding acquisition, Y.-D.K. and K.-S.H. All authors have read and agreed to the published version of the manuscript.

Funding

This research was funded by Industrial Technology Research Institute, Taiwan grant number [NCUT22TER022].

Data Availability Statement

Data sharing not applicable.

Conflicts of Interest

The authors declare no conflict of interest.

References

  1. AHRI 551/591 (SI/2020): Performance Rating of Water-Chilling and Heat Pump Water-Heating Packages Using the Vapor Compression Cycle (with Addendum 1), “Performance Rating of Water-Chilling and Heat Pump Water-Heating Packages Using the Vapor Compression Cycle.” [Online]. Available online: www.ahrinet.org (accessed on 11 January 2022).
  2. Huang, J.-M.; Tsai, Y.-H. Design and Analysis of a Split Deswirl Vane in a Two-Stage Refrigeration Centrifugal Compressor. Adv. Mech. Eng. 2014, 6, 130925. [Google Scholar] [CrossRef]
  3. Hsu, C.-N.; Wang, S.-H. Evaluating the Performance of Water Chillers Equipped with Constant- or Variable-Frequency Centrifugal Compressors. Processes 2021, 9, 1039. [Google Scholar] [CrossRef]
  4. Trébinjac, I.; Bulot, N.; Buffaz, N. Analysis of the flow in a transonic centrifugal compressor stage from choke to surge. Proc. Inst. Mech. Eng. Part A J. Power Energy 2011, 225, 919–929. [Google Scholar] [CrossRef]
  5. Shafieian, M.; Zavar, M.; Rahmanian, M. Simulation and Control of Surge Phenomenon in Centrifugal Compressors. Trait. Du Signal 2019, 36, 259–264. [Google Scholar] [CrossRef]
  6. Wang, W.; Li, Z. Influence of different types of volutes on centrifugal aviation fuel pump. Adv. Mech. Eng. 2021, 13, 16878140211005202. [Google Scholar] [CrossRef]
  7. Zhang, N.; Zhang, P.; Wu, J.; Li, Q. Numerical Study of Unsteady Flow in Centrifugal Cold Compressor. Phys. Procedia 2015, 67, 153–157. [Google Scholar] [CrossRef] [Green Version]
  8. Zhang, Q.; Huo, Q.; Zhang, L.; Song, L.; Yang, J. Effect of Vaneless Diffuser Shape on Performance of Centrifugal Compressor. Appl. Sci. 2020, 10, 1936. [Google Scholar] [CrossRef] [Green Version]
  9. Sun, J.; Li, W.; Cui, B. Energy and exergy analyses of R513a as a R134a drop-in replacement in a vapor compression refrigeration system. Int. J. Refrig. 2019, 112, 348–356. [Google Scholar] [CrossRef]
  10. Yang, M.; Zhang, H.; Meng, Z.; Qin, Y. Experimental study on R1234yf/R134a mixture (R513A) as R134a replacement in a domestic refrigerator. Appl. Therm. Eng. 2018, 146, 540–547. [Google Scholar] [CrossRef]
  11. Saadoon, Y.G. EXPERIMENTAL ANALYSIS OF MOBILE AIR CONDITIONING SYSTEM USING R513A AS ALTERNATIVE REFRIGERANTS TO R134A. J. Mech. Contin. Math. Sci. 2019, 14, 450–469. [Google Scholar] [CrossRef]
  12. Zhang, Z.; Wang, Y.; Wu, X.; Pan, X.; Xing, Z. Theoretical and experimental research on the performance of twin screw compressor using R513A as R134a replacement Author. Proc. Inst. Mech. Eng. Part E J. Process Mech. Eng. 2021, 235, 170–177. [Google Scholar] [CrossRef]
  13. Pérez-García, V.; Mota-Babiloni, A.; Navarro-Esbrí, J. Influence of operational modes of the internal heat exchanger in an experimental installation using R-450A and R-513A as replacement alternatives for R-134a. Energy 2019, 189, 116348. [Google Scholar] [CrossRef]
  14. Meng, Z.; Zhang, H.; Qiu, J.; Lei, M. Theoretical analysis of R1234ze(E), R152a, and R1234ze(E)/R152a mixtures as replacements of R134a in vapor compression system. Adv. Mech. Eng. 2016, 8, 1687814016676945. [Google Scholar] [CrossRef] [Green Version]
  15. Mota-Babiloni, A.; Navarro-Esbrí, J.; Mendoza-Miranda, J.M.; Peris, B. Experimental evaluation of system modifications to increase R1234ze(E) cooling capacity. Appl. Therm. Eng. 2017, 111, 786–792. [Google Scholar] [CrossRef]
  16. Hung, K.-S.; Ho, K.-Y.; Hsiao, W.-C.; Kuan, Y.-D. The Characteristic of High-Speed Centrifugal Refrigeration Compressor with Different Refrigerants via CFD Simulation. Processes 2022, 10, 928. [Google Scholar] [CrossRef]
  17. Yi, K.; Zhao, Y.; Liu, G.; Yang, Q.; Yu, G.; Li, L. Performance Evaluation of Centrifugal Refrigeration Compressor Using R1234yf and R1234ze(E) as Drop-In Replacements for R134a Refrigerant. Energies 2022, 15, 2552. [Google Scholar] [CrossRef]
  18. Acharya, R. Investigation of Differences in Ansys Solvers CFX and Fluent. Master’s Thesis, Royal Institute of Technology, Stockholm, Sweden, 2016. [Google Scholar]
  19. Henningson, D.S.; Berggren, M. “Fluid Dynamics: Theory and Computation.” 2005. [Online]. Available online: https://www.semanticscholar.org/paper/Fluid-Dynamics%3A-Theory-and-Computation-Henningson-Berggren/4d5e197e452441c421e53250dd802f6d8b32c972 (accessed on 11 January 2022).
  20. “ANSYS CFX-Solver Theory Guide”; Release 14.0; ANSYS: Canonsburg, PA, USA, 2011; Volume 15317, pp. 724–746. Available online: http://www1.ansys.com/customer/content/documentation/140/cfx_thry.pdf (accessed on 11 January 2022).
  21. UNEP. Amendment to the Montreal Protocol on Substances That Deplete the Ozone Layer, Kigali, no. 1522 UNTS 3; 26 ILM 1550; UNEP: Nairobi, Kenya, 2016. [Google Scholar]
  22. Bell, I.H.; Domanski, P.A.; McLinden, M.O.; Linteris, G.T. The hunt for nonflammable refrigerant blends to replace R-134a. Int. J. Refrig. 2019, 104, 484–495. [Google Scholar] [CrossRef] [PubMed]
  23. ANSI/ASHRAE Addendum f to ANSI/ASHRAE Standard 34-2019. 2019. [Online]. Available online: www.ashrae.org (accessed on 11 November 2022).
  24. Cravero, C.; Leutcha, P.J.; Marsano, D. Simulation and Modeling of Ported Shroud Effects on Radial Compressor Stage Stability Limits. Energies 2022, 15, 2571. [Google Scholar] [CrossRef]
Figure 1. Exploded diagram of 150USRT class two-stage centrifugal compressor flow element configuration.
Processes 11 00253 g001
Figure 2. Refrigerants pressure–enthalpy comparison diagram.
Processes 11 00253 g002
Figure 3. Schematic diagram of nominal dimensions of impeller.
Processes 11 00253 g003
Figure 4. Research procedure flow chart.
Processes 11 00253 g004
Figure 5. Global mesh for the first stage compression.
Processes 11 00253 g005
Figure 6. Joint of inlet tube and impeller of mesh. (Stage 1).
Processes 11 00253 g006
Figure 7. Global mesh for the second stage compression.
Processes 11 00253 g007
Figure 8. Joint of impeller and diffuser of mesh. (Stage 2).
Processes 11 00253 g008
Figure 9. Comparison diagram of pressure ratios of R-513A refrigerant two-stage compression under various loads.
Processes 11 00253 g009
Figure 10. R-513A refrigerant two-stage compression shaft power comparison diagram under various loads.
Processes 11 00253 g010
Figure 11. R-513A refrigerant two-stage compression isentropic efficiency comparison diagram under various loads.
Processes 11 00253 g011
Figure 12. First stage isentropic compression efficiency comparison diagram with R-513A refrigerant in various flow element configurations.
Processes 11 00253 g012
Figure 13. Second stage isentropic compression efficiency with R-513A refrigerant in various flow element configurations.
Processes 11 00253 g013
Figure 14. Schematic diagram of first stage compression meridian plane with R-513A refrigerant.
Processes 11 00253 g014
Figure 15. Schematic diagram of second stage compression meridian plane with R-513A refrigerant.
Processes 11 00253 g015
Figure 16. Pressure meridional contour maps of the first stage compression with R-513A refrigerant under various loads.
Processes 11 00253 g016
Figure 17. Pressure meridional contour maps of the second stage compression with R-513A refrigerant under various loads.
Processes 11 00253 g017
Figure 18. Meridional contour maps of the first stage compression isentropic efficiency with R-513A refrigerant under various loads.
Processes 11 00253 g018
Figure 19. Meridional contour maps of the second stage compression isentropic efficiency with R-513A refrigerant under various loads.
Processes 11 00253 g019
Figure 20. Impeller velocity vector diagram for the first stage compression with R-513A refrigerant under various loads.
Processes 11 00253 g020
Figure 21. Impeller velocity vector diagram for the second stage compression with R-513A refrigerant under various loads.
Processes 11 00253 g021
Table 1. Physical properties of R-134a refrigerant and R-513A refrigerant [22].
RefrigerantTypeCritical Specific Volume
(m3/mol)
Critical Temperature
(K)
Critical Pressure
(kPa)
Boiling Temperature
(K)
R-134aHFC-134a0.0002008374.264059247.04
R-513AHFO-1234yf/HFC-134a(56/44)0.000221092368.063647.8243.68
Table 2. Properties of R-134a refrigerant and R-513A refrigerant [23].
RefrigerantODPGWP100Safety Classifications
R-134a01430A1
R-513A0573A1
Table 3. USRT two-stage flow element concept design rotating speed and impeller diameter.
Total Pressure RatioMass Flow Rate
(kg/s)
Isentropic Compression Power
(J/kg)
Rotating Speed
(rpm)
Impeller Diameter
(mm)
Specific Speed
Ns
Specific Diameter
Ds
Stage 11.62.797884019,450132.50.813.53
Stage 21.523.227799019,4501290.753.91
Table 4. Preliminary design of R513A, 150USRT two-stage flow element.
R1TR1HR2B2Beta2SANumber of Blades
R-513AStage 136 mm22.5 mm66.25 mm7.6 mm−48.5°45°13
150USRTStage 236 mm26 mm64.5 mm6.1 mm−52.5°45°13
B2: impeller outlet width, Beta2: impeller blade back rake, SA: blade angle at impeller inlet.
Table 5. Boundary conditions for two-stage IPLV load 100%.
Load100%
Rotating Speed (RPM)19,450
-Stage 1Stage 2
Inlet Total Temperature (℃)6.424.8
Inlet Total Pressure (kPa)398635
Outlet Mass Flow Rate (kg/s)2.7973.227
Table 6. Boundary conditions for two-stage IPLV load 75%.
Load75%
Rotating Speed (RPM)16,650
-Stage 1Stage 2
Inlet Total Temperature (°C)6.720.5
Inlet Total Pressure (kPa)403575
Outlet Mass Flow Rate (kg/s)2.0322.248
Table 7. Boundary conditions for two-stage IPLV load 50%.
Load50%
Rotating Speed (RPM)13,650
-Stage 1Stage 2
Inlet Total Temperature (°C)6.814.25
Inlet Total Pressure (kPa)406521
Outlet Mass Flow Rate (kg/s)1.3161.404
Table 8. Boundary conditions for two-stage IPLV load 25%.
Load25%
Rotating Speed (RPM)12,150
-Stage 1Stage 2
Inlet Total Temperature (°C)6.813.6
Inlet Total Pressure (kPa)407508
Outlet Mass Flow Rate (kg/s)0.65330.6931
Table 9. Numerical simulation results for R-513A refrigerant two-stage centrifugal compressor loads.
IPLVStageMass Flow Rate
(kg/s)
Inlet Pressure
(kPa)
Outlet Pressure
(kPa)
Isentropic Efficiency
(%)
Shaft Power
(kW)
Pr
100%Stage 12.80398641.888.0929.81.62
Stage 23.23635959.588.1830.31.51
75%Stage 12.03403579.388.1916.51.44
Stage 22.25575783.289.0615.71.37
50%Stage 11.32406523.987.447.61.29
Stage 21.40521649.787.797.01.25
25%Stage 10.65407495.176.303.41.22
Stage 20.70508614.882.283.21.21
Disclaimer/Publisher’s Note: The statements, opinions and data contained in all publications are solely those of the individual author(s) and contributor(s) and not of MDPI and/or the editor(s). MDPI and/or the editor(s) disclaim responsibility for any injury to people or property resulting from any ideas, methods, instructions or products referred to in the content.

