Article

Estimation of the Levelized Cost of Nuclear Hydrogen Production from Light Water Reactors in the United States

Department of NPP Engineering, KEPCO International Nuclear Graduate School, 658-91 Haemaji-ro, Seosaeng-myeon, Ulju-gun, Ulsan 45014, Korea
*
Author to whom correspondence should be addressed.
Processes 2022, 10(8), 1620; https://doi.org/10.3390/pr10081620
Submission received: 17 June 2022 / Revised: 4 August 2022 / Accepted: 13 August 2022 / Published: 16 August 2022
(This article belongs to the Section Energy Systems)

Abstract

:
In June 2021, the United States (US) Department of Energy (DOE) hosted the first-ever Hydrogen Shot Summit, which lasted for two days. More than 3000 stockholders around the world were convened at the summit to discuss how low-cost clean hydrogen production would be a huge step towards solving climate change. Hydrogen is a dynamic fuel that can be used across all industrial sectors to lower the carbon intensity. By 2030, the summit hopes to have developed a means to reduce the current cost of clean hydrogen by 80%; i.e., to USD 1 per kilogram. Because of the importance of clean hydrogen towards carbon neutrality, the overall DOE budget for Fiscal Year 2021 is USD 35.4 billion and the total budget for DOE hydrogen activities in Fiscal Year 2021 is USD 285 million, representing 0.81% of the total DOE budget for 2021. The DOE hydrogen budget of 2021 is estimated to increase to USD 400 million in Fiscal Year 2022. The global hydrogen market is growing, and the US is playing an active role in ensuring its growth. Depending on the electricity source used, the electrolysis of hydrogen can have no greenhouse gas emissions. When assessing the advantages and economic viability of hydrogen production by electrolysis, it is important to take into account the source of the necessary electricity as well as emissions resulting from electricity generation. In this study, to evaluate the levelized cost of nuclear hydrogen production, the International Atomic Energy Agency Hydrogen Economic Evaluation Program is used to model four types of LWRs: Exelon’s Nine Mile Point Nuclear Power Plant (NPP) in New York; Palo Verde NPP in Arizona; Davis-Besse NPP in Ohio; and Prairie Island NPP in Minnesota. Each of these LWRs has a different method of hydrogen production. The results show that the total cost of hydrogen production for Exelon’s Nine Mile Point NPP, Palo Verde NPP, Davis-Besse NPP, and Prairie Island NPP was 4.85 ± 0.66, 4.77 ± 1.36, 3.09 ± 1.19, and 0.69 ± 0.03 USD/kg, respectively. These findings show that, among the nuclear reactors, the cost of nuclear hydrogen production using Exelon’s Nine Mile Point NPP reactor is the highest, whereas the cost of nuclear hydrogen production using the Prairie Island NPP reactor is the lowest.

1. Introduction

In line with the 2015 Paris agreement, the world has been striving for inexhaustible, clean, and cheap energy to mitigate the effects of climate change. Hydrogen is expected to be a major source of energy in the near future, with the potential for carbon neutrality. Organic matter and water are two well-known hydrogen-containing substances. However, the ocean is the world’s largest hydrogen reservoir [1]. Moreover, there are numerous sources and methods of producing hydrogen for fuel. The most common methods include Steam Methane Reforming (SMR), electrolysis (water splitting with electricity), and thermochemical processes, such as the sulfur–iodine (S–I) process [1,2,3,4]. In this study, we considered Low-Temperature Electrolysis (LTE), High-Temperature Steam Electrolysis (HTSE), and the Polymer Electrolyte Membrane or Proton Exchange Membrane (PEM) water electrolysis. Hydrogen is classified into different colors based on the primary energy source used in producing it. The primary energy sources include fossil fuel (gas, oil, and coal), renewables (solar, wind, and hydroelectricity), and nuclear energy (atomic fission and fusion energy) [5]. In the SMR method, heat and pressure are used to convert the methane in natural gas into hydrogen and carbon dioxide, which accounts for roughly three quarters of the global hydrogen production. This type of hydrogen is classified as gray hydrogen, which accounts for 6% of the total global natural gas consumption; however, it is associated with increased greenhouse gas emissions into the atmosphere. Brown hydrogen is produced by coal gasification, which is also considered the least environmentally friendly since it produces as much carbon dioxide as burning the primary fuel would have. Conversely, blue hydrogen is a novel approach used to produce hydrogen similar to the SMR of natural gas or coal gasification, with carbon dioxide capture and storage known as carbon sequestration. Since 2020, only two commercial-scale blue-hydrogen reactors have been in operation: Shell in Alberta, Canada, and Air Products in Texas, USA. The method of producing blue hydrogen is categorized as carbon neutral because no CO2 is emitted. However, this description is not true since not all CO2 emissions can be absorbed, with some CO2 emitted during the production process [5]. Green hydrogen is produced when power is generated from a clean, renewable source, such as hydro, wind, or solar. In 2009, green hydrogen was not cost competitive with gray hydrogen; however, this is changing as renewable energy costs continue to fall and electrolysis gets improved. Nonetheless, it appears that the future supply of green hydrogen will be limited for at least the next several decades [2,5]. The electrical power and heat from a Nuclear Power Plant (NPP) can be used to split water molecules into hydrogen and oxygen. The hydrogen obtained using this method is also known as green hydrogen because it emits no CO2 into the atmosphere [6], although some sources refer to it as pink hydrogen because it is also produced by electrolyzing water with electricity from nuclear power plant.
Whereas the focus of this study is on nuclear hydrogen production using light water reactors (LWRs) in this study, another study compared and contrasted the environmental impact, cost, and energy efficiency of various potential hydrogen-manufacturing technologies based on renewable and nonrenewable sources. Some of the potential primary energy sources investigated in that study include electrical, thermal, biochemical, photonic, electro-thermal, photoelectric, and photo-biochemical. Their findings revealed that photonic energy-based hydrogen production (e.g., photo-catalysis, photo-electrochemical technique, and artificial photosynthesis) is more environmentally friendly than the other methods when utilized as the major energy source.
Environmentally friendly results also have been produced by hybrid thermochemical cycles (e.g., CuCl, SI, and MgCl) and thermochemical water splitting (e.g., CuCl, SI, and MgCl). Both the photo-electrochemical approach and PV electrolysis are found to be the least appealing in terms of production costs and efficiencies. Moreover, hybrid thermochemical processes have seemed to become the most hopeful options for producing hydrogen in a cost-effective and environmentally friendly manner [7]. Electrolysis uses electricity to break down water molecules into hydrogen and oxygen components. The most basic piece of equipment used for the breakdown is an electrolyzer, which consists of two electrodes (anode and cathode) separated by an electrolyte. This electrolysis is classified into two as follows: low temperature, if the water molecules are divided into hydrogen and oxygen constituents using electrical energy at a low temperature (100 °C) and usually at atmospheric pressure; and high temperature, if water vapor instead of liquid water is used during electrolysis. The PEM method, which is a low-temperature water electrolysis method, uses a polymer electrolyte membrane as a medium of ion transfer. In this method, the water molecule is separated safely, generating oxygen at the anode or positive electrode and hydrogen at the cathode or negative electrode. In the HTSE method, the entire system can be operated at high temperatures (at least above 200 °C). The principle of this method is based on the fact that the electrical power required to split a water molecule at 700 °C is less than that required to split water at 100 °C. When we raise the temperature of steam, the enthalpy and entropy increases, but the Gibbs energy required decreases. Gibbs energy is proportional to the total amount of reversible voltage required to decompose water into its two components. This amount of reversible voltage is proportional to the amount of electrical work, defined by the voltage multiplied by twice the Faraday constant [1,2,3].
Different studies have also discussed the generation of hydrogen from nuclear reactors. In a study to perform a techno-economic evaluation of generating hydrogen using NPP-generated electricity in Korea, Andhika Yudha Prawira et al. used Hydrogen Economic Evaluation Program (HEEP) software [8] to investigate the cost of hydrogen production by utilizing operational local NPPs. These operational local NPPs were used to determine the economic viability of hydrogen-production infrastructure. The results of their study indicated that hydrogen production could be a viable option for improving the utilization of Korea’s NPP. According to the findings of a techno-economics examination of three different NPPs considered, the cost of hydrogen produced by nuclear energy ranges from 3.18 to 6.77 USD/kg H2. This cost estimate shows that nuclear hydrogen generation can assist in meeting South Korea’s target price for hydrogen, which is 3000 KRW/kg H2 (2.5 USD/kg H2) [9].
Rami S. El-Emam conducted a comparative price valuation of some carefully chosen nuclear hydrogen generation systems with several options of storing and transporting hydrogen using HEEP software developed by the International Atomic Energy Agency (IAEA). This price valuation comparison considers three different options: pebble bed (PBR), prismatic core (PMR), and high-temperature reactor (HTGR). Four different layouts were introduced for cost comparison and plant contributions to the total cost of the system by adjusting many factors. The 6-unit, 600-MWth system costs 3.41 CAD/kg, which is the lowest price; however, the prices of hydrogen for the metal hydride storage plant were greater than both the liquefaction storage option and the compressed gas storage option [10].
In a study to analyze the product flexibility and market viability of hydrogen production, the authors developed a financial model based on a theory of real options to evaluate the profitability of various nuclear hydrogen production technologies in developing electricity and hydrogen markets. In contrast to other studies on economics of nuclear hydrogen technologies that have concentrated on levelized costs and ignoring significant risks and uncertainties, the study concluded that the assessment placed special emphasis on the levelized hydrogen cost calculations because of its attempt to discover and discuss some of the budgetary risks and opportunities associated with producing hydrogen from nuclear energy technologies [11].
In Turkey, F. Sorgulu and I. Dincer used HEEP software to assess the cost of generating hydrogen from two proposed NPPs. These two possible NPPs are intended to be constructed in the Turkish cities of Akkuyu and Sinop, and they are expected to be pressurized water reactors (PWR) with electrical capacity of up to 4800 and 4480 MW for Akkuyu and Sinop, respectively. The results of this study showed that the price of producing hydrogen from either plant would range from 3.18 to 6.17 USD/kg H2 [12].
M. G. McKellar et al. conducted research on evaluating and analyzing the economics of a nuclear reactor that employs high-temperature electrolysis (HTE) to produce hydrogen. A benchmark concept for a commercial-scale HTE power station for producing hydrogen was established to provide a means of comparing the HTE concept with other approaches of generating hydrogen. The benchmark power plant design is powered by a high-temperature, helium-cooled nuclear reactor linked to a direct Brayton power cycle. The benchmark power plant has a reactor power of 600 MWth, a primary system pressure of 7.0 MPa, and reactor inlet and output fluid temperatures of 540 °C and 900 °C, respectively. The electrolysis unit used to generate hydrogen consists of 4,009,177 cells, each with an active region of 225 cm2. This plant’s economics were examined utilizing the standardized hydrogen analysis approach created by the DOE hydrogen program, as well as reasonable financial and cost-estimate assumptions. The monetary examination results showed that the HTE facility for producing hydrogen, which is powered by a high-temperature NPP that uses helium as a coolant, could deliver hydrogen at a competitive price of 3.23 USD/kg, after making an assumption of a 10% internal rate of return [13]. To compete with gasoline, the cost of the hydrogen supply was calculated to improve the thermal power provided by an NPP in Japan. The whole cost of the central hydrogen production was assessed, which included production, distribution, and transportation expenses. The results showed that both the S-I thermochemical and water-splitting electrolysis methods could supply hydrogen for a 3000 MWth NPP, with the cost of the power generation from hydrogen being less than 3 JPY/kWh and transportation distances less than 200 km [14].
Moreover, recent studies have thoroughly examined the possibilities of converting existing PWRs in the Midwest to hydrogen cogeneration using high-temperature steam electrolysis (HTSE), in which a thorough discussion and analysis of the HTSE process’ functioning, requirements, and flexibility were conducted to allow for such an integration. The comprehensive cost estimations in the APEA (Aspen Process Economic Analyser) and H2A (Hydrogen Analysis) models were established to assess the capital and operational costs related to the production, compression, and distribution of hydrogen from a nuclear facility based on the extensive examination of the nuclear integration and HTSE process design. In addition, a Levelized Cost of Hydrogen (LCOH) study was also done to determine how much it would cost to convert an existing NPP to produce only hydrogen in comparison to an SMR plant, both with and without Carbon Culture and Storage (CCS). Nuclear operation and maintenance (O&M) costs of USD 17, USD 22, and USD 35/MWh would be necessary to achieve breakeven nuclear O&M in order to produce hydrogen at a lower cost than an SMR plant without CCS for low, medium, and high natural gas prices, respectively. On the other hand, Nuclear O&M costs must be below USD 27, USD 33, and USD 46/MWh in order to be cost-effective compared to SMR with CCS for low, medium, and high natural gas prices, respectively. Therefore, it is possible to manufacture hydrogen at these values for a lot less money than an SMR plant would cost. In reality, the results have shown that it is possible to create hydrogen at a cost as low as USD 1.20–1.60/kg in a market with low electricity prices (USD 15–25/MWh) [15,16].
The current study’s objective is to evaluate the levelized cost of producing hydrogen using existing LWRs in the US. This study focuses on four types of LWRs, in line with the Hydrogen Shot Summit and the four DOE-funded small-scale projects, to produce hydrogen from LWRs in various ways. These four utilities have received DOE cost-share funding for pilot projects that will demonstrate LTE at Energy Harbor’s Davis-Besse NPP in Ohio, HTSE at Xcel Energy’s Prairie Island NPP in Minnesota, low-temperature PEM electrolysis at Exelon’s Nine Mile Point NPP in New York, and the Palo Verde NPP. These small-scale systems will produce small amounts of hydrogen, which will be used to power the NPP, local public transportation, and local industrial customers [17].

2. Materials and Methods
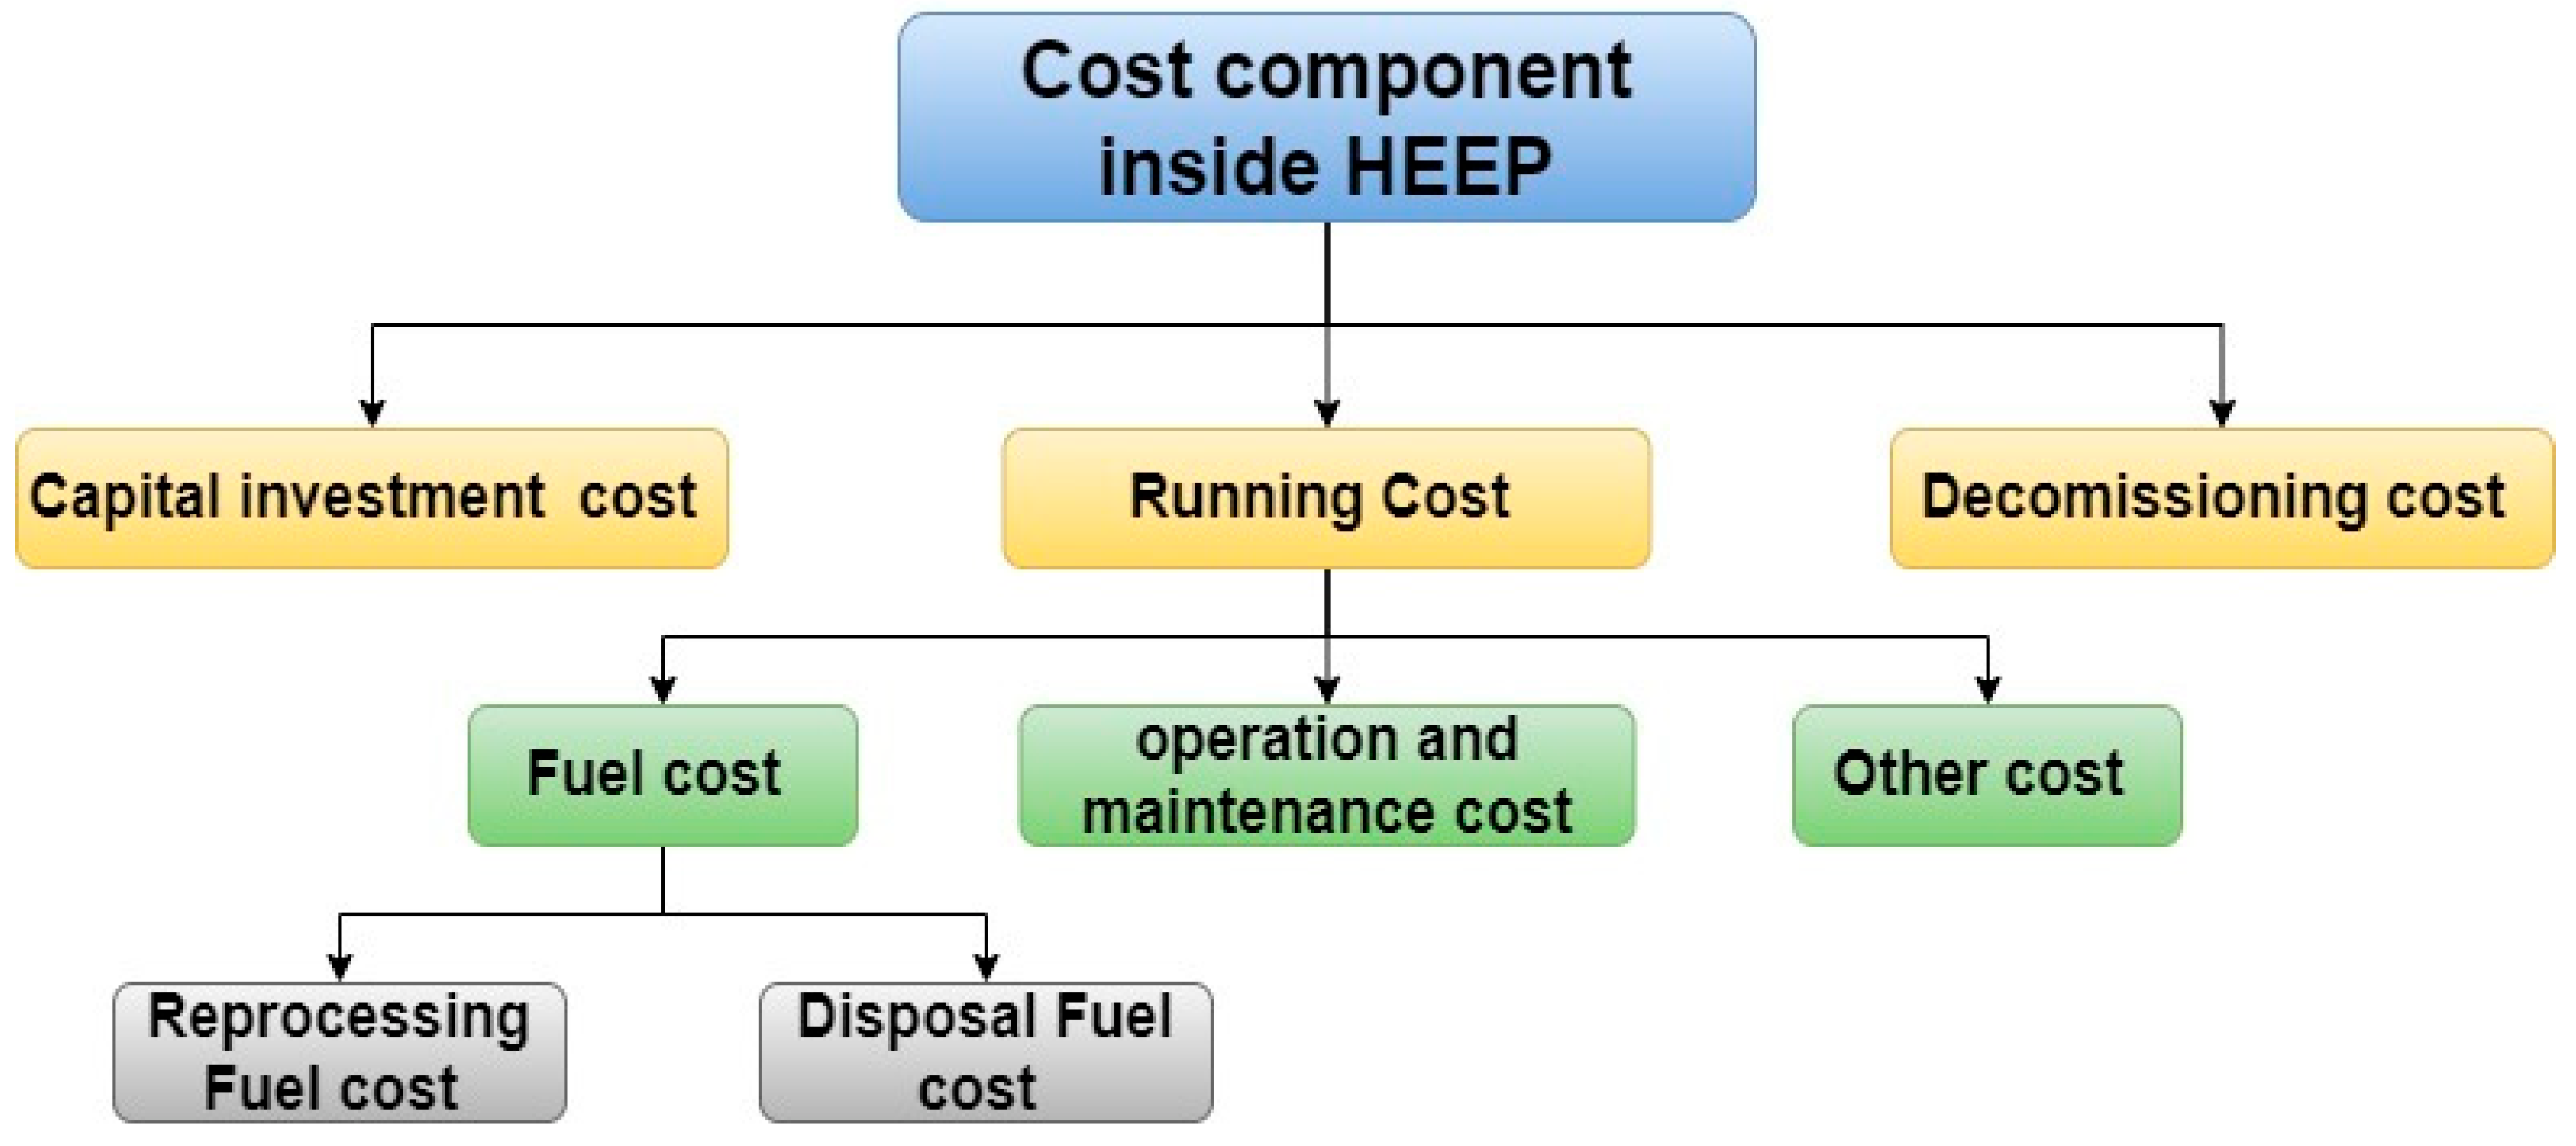
In this study, four types of existing LWRs in the US were employed to evaluate the levelized cost of producing hydrogen. These reactors include the Davis-Besse NPP in Ohio, Prairie Island NPP in Minnesota, Nine Mile Point NPP in New York, and Arizona Public Service’s Palo Verde NPP. Table 1 presents the reactors’ parameters used.
On 18 August 2021, Exelon Generation obtained a fund from the DOE to investigate the economic benefits of on-site hydrogen generation at the Nine Mile Point NPP. Nel Hydrogen Company is a partner in that project. The project will demonstrate the 1.25 MW containerized MC250-PEM electrolyzers at the same site as the Nine Mile Point NPP, with operations set to begin in 2022. The project will use the facility’s existing hydrogen storage system and infrastructure [22,23,24,25]. On 7 October 2021, the DOE announced that it funded the Arizona Public Service to install a hydrogen-production utility at the Palo Verde NPP in Phoenix, Arizona. PNW Hydrogen LLC will lead the project and demonstrate the electrolyzer unit at the Palo Verde site [17,26,27]. On 9 November 2020, Idaho National Laboratory announced a demonstration of a hydrogen project with Xcel Energy. Xcel Energy, which is located in Minneapolis, will work to establish the Prairie Island Nuclear Generating Station’s first system for splitting water using steam and electricity from an NPP [28,29,30]. The DOE-funded small project will determine the technical and economic feasibility of a hybrid hydrogen-production system to facilitate large-scale commercialization. Hydrogen will be produced at Energy Harbor’s Davis-Besse power station via LTE using PEM technology [23].

2.1. HEEP

The IAEA created HEEP to help US member states in evaluating the techno-economic aspects of hydrogen production. HEEP models hydrogen production in four stages of hydrogen: NPP as the primary energy source, plant for generating hydrogen, and storing and transportation of hydrogen. For each stage, the model requires economic and technical input data for simulation. The program consists of three modules: the first one being the pre-processing module that allows the user to input data; the second module is an executing module that computes the cost of hydrogen from the given input data; and the third is the post-processing module that shows the output after the execution. There are two groups of input parameters: the first is country or region-specific economic data, which is shared by all plants and facilities and includes the fiscal parameters and details for a given period; and the second type of parameter is the facility-dependent parameters, which include information about the technical features and cost components of each facility. HEEP calculates the levelized cost of producing hydrogen by considering various aspects of capital investments that ultimately affect the estimated cost. The investment of capital can be increased at a specific equity-to-debt ratio; i.e., project money can be increased through equities, market loans, or a mixture of both. HEEP calculates the levelized cost of hydrogen generation using Equation (1) [9,31,32,33].
C H 2 = E N P P t 0 + E H 2 G P t 0 + E H 2 T t 0 G H 2 t 0   ( USD   k g )
where C H 2 is the levelized cost of producing hydrogen, ENPP(t0) is the current value of expenditures or of a NPP at time t0, EH2GP(t0) is the current value of expenditures of a plant generating and storing hydrogen at time t0, EH2T(t0) is the current value of expenditures of transporting hydrogen at time t0, and C H 2 (t0) is the current value of gross hydrogen generation at time t0.
The current value of expenditures is estimated by employing Equation (2).
E t 0 = t s t a r t t e n d C I t 1 + r t t 0 + t s t a r t t e n d R t 1 + r t t 0 + t s t a r t t e n d D C t 1 + r t t 0
where CIt is the investment on capital expenses at year t, Rt are the expenses of running the plant in the year t, DCt is the cost of decommissioning at year t, t0 is the base year of comparison, and r is the true discount rate.
Gross hydrogen generation over the years is calculated using Equation (3).
G H 2 t 0 = t s t a r t t E n d G H 2 t 1 + r t t 0
When a portion of the thermal energy generated by an NPP is diverted for the production of electricity, the cost of thermal energy, as well as the cost of electricity generation and electrical power, must be estimated using Equation (4).
P e l e c = P t h P t h e r m a l   f o r   H y d r o g e n H 2   g e n e r a t i o n × N P P e f f i c i e n c y

2.2. HEEP Input Data

For each plant, the HEEP software requires input data for the three major components that affect the economics of nuclear hydrogen generation. These components are technical details, time periods for various events, and various cost components. Figure 1 illustrates the cost categorization needed for the HEEP software. Moreover, before we can provide cost details, we must first provide real finance data for the country under simulation. Finance data include currency type, real discount rate, and inflation rate. The DOE Hydrogen Analysis (H2A) Project provided the economic assumptions used in this analysis. The H2A team has developed a set of this information based on realistic assumptions for both market and technology. Additionally, they performed a selectivity analysis on these values, to see the most critical assumption on the cost [34]. The real discount rate used in this study is 0.25% [35] and the inflation rate is 1.9%, but with a consequent H2 cost in constant USD in the base year. They also assumed 100% equity of the capital cost; i.e., without debt capital cost, the depreciation period is 20 years, the tax rate is 10% [36], and the borrowing interest is 3.25% [37]. The second part of input data is the technical information and cost component of the NPP. Table 2 presents the technical details of the input parameters for the four US NPPs that were used to simulate the levelized cost of nuclear hydrogen generation in HEEP.
Table 3 shows the technical specifications of the hydrogen-generation plant that was used in each reactor. We chose a co-located plant as the location of the hydrogen-generation plant. Here, the thermal energy and electricity are obtained from the NPP; otherwise, the electricity required to generate hydrogen is obtained from the grid. Furthermore, HEEP assumes that if the total electricity required for hydrogen generation and transportation exceeds the net electricity generated by the NPP, the excess electricity will be obtained from the grid. Table 3 shows the amount of annual hydrogen generation, heat consumed to generate the hydrogen (if required), electricity consumed, capital cost, operation and maintenance (O&M) cost, and decommissioning cost for each power plant. The storage and transportation technical data are listed in Table 4 and Table 5. The storage technique considered was compressed gas for all plants and methods of hydrogen production. Details of the input parameters used are presented in Table 4. In this study, the vehicle transportation method was adopted to transport the hydrogen from each plant to the nearest city, and the distance traveled was estimated using Google maps. The variation in transportation cost from Prairie Island and Nile Mile Point to the nearest city depends on the distance, average fuel cost, and driver pay. Although, both plants have approximately the same distance of 50 km from the generation plant to the nearest city. These parameters vary from one state to another.

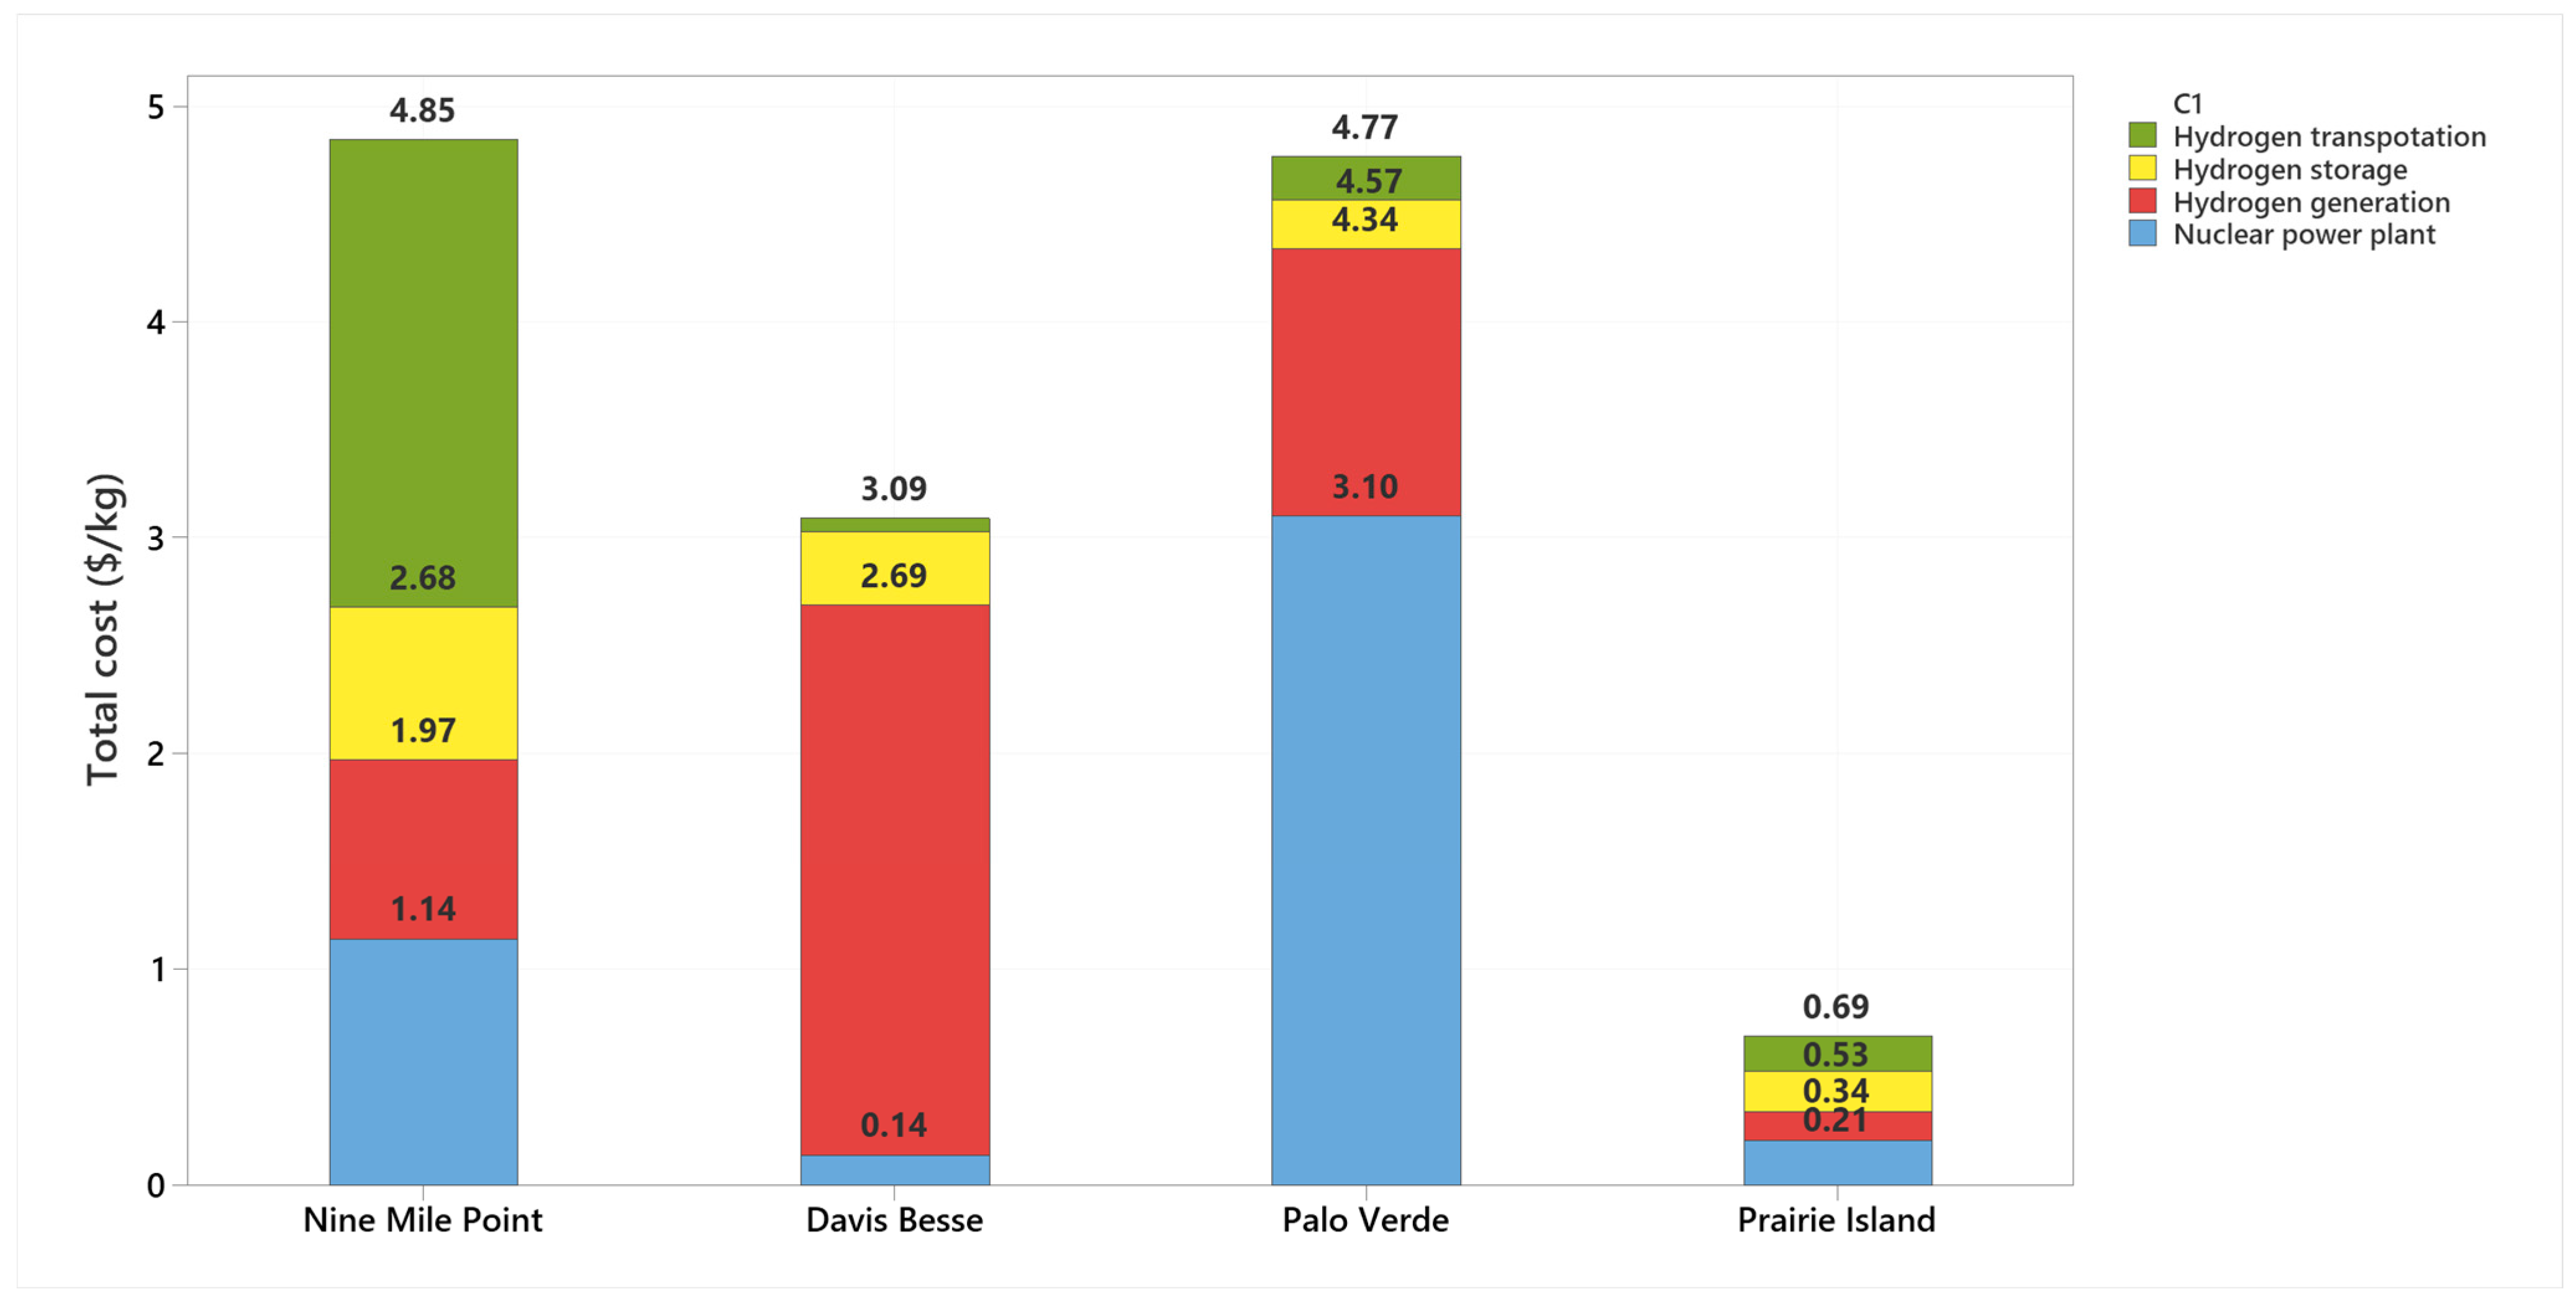
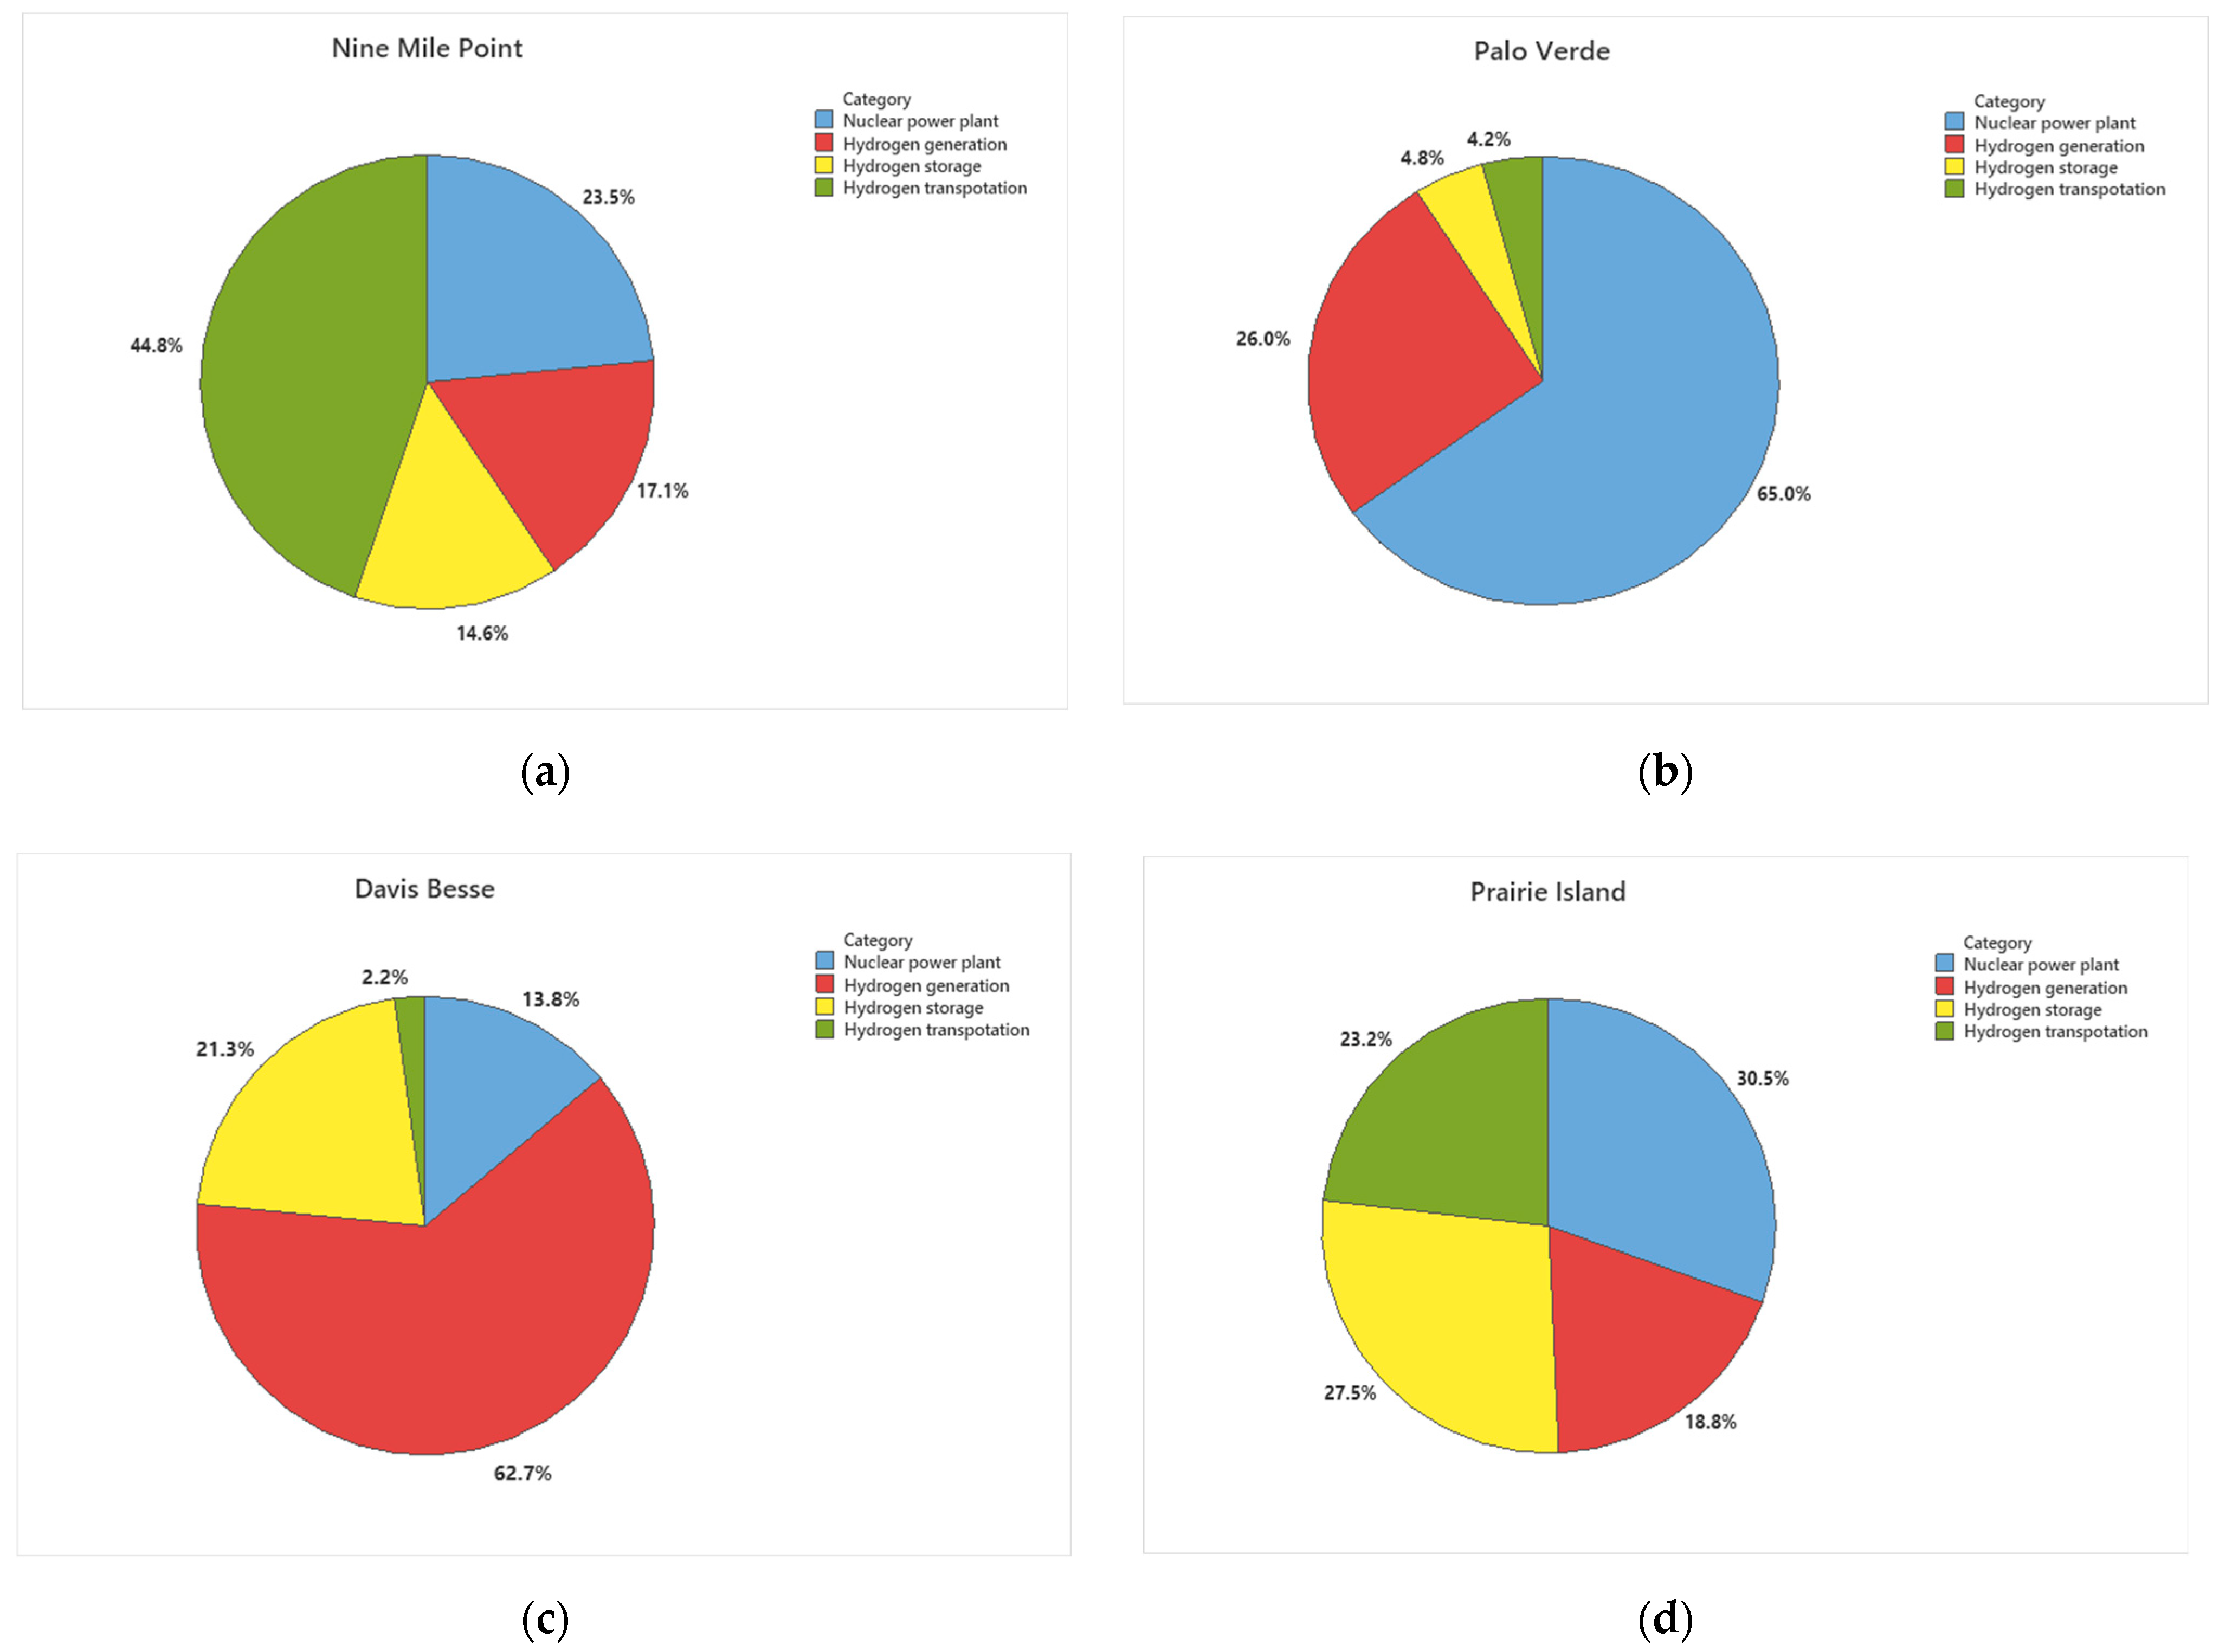
3. Results and Discussion

The HEEP software outputs the levelized cost of nuclear hydrogen production. It includes the cost of the NPP used to generate electricity or steam, the cost of the hydrogen plant connected to the NPP, and the costs of storage and transportation. Thus, Figure 2 introduces the results of the four different types of NPPs used to produce hydrogen using various methods, including LTE and HTSE.
Figure 2a shows the results for Exelon’s Nile Mile Point NPP, which employs LTE-PEM technology to generate hydrogen. The total cost of hydrogen production is 4.85 ± 0.66 USD/kg. This cost is divided into various percentages: 23.51% from NPP, 17.11% from the hydrogen-generation plant, 14.64% from hydrogen storage using compressed gas, and 44.74% from hydrogen transportation with a vehicle for a distance of 50 km.
Figure 2b shows the results of the Palo Verde NPP of Arizona Public Services, which employs LTE for hydrogen production. The total cost of hydrogen production is 4.77 ± 1.36 USD/kg. This cost is divided into different percentages: 64.99% from the NPP, 26% from the hydrogen-generation plant, 4.82% from hydrogen storage, and 4.19% from vehicle hydrogen transportation for a distance of 72 km. Figure 2c shows the results of the Davis-Besse NPP in Ohio of Energy Harbor, which uses LTE for hydrogen production. The total cost of hydrogen production is 3.09 ± 1.19 USD/kg. This cost is divided into different percentages: 4.5% from the NPP, 82.5% from the hydrogen generation plant, 11% from hydrogen storage, and 1.9% from vehicle hydrogen transportation for a distance of 16 km. Figure 2d shows the results of Xcel Energy’s Prairie Island NPP in Minnesota of Xcel Energy, which employs HTSE for hydrogen production. The steam has a high temperature and requires less power to decompose the water molecules. Hence, the electricity required for this method is low compared to the electricity needed by LTE nuclear hydrogen-generating plants The total cost of hydrogen production is 0.69 ± 0.03 USD/kg. This cost is divided into different percentages: 30.43% from the NPP, 18.84% from the hydrogen-generation plant, 27.54% from hydrogen storage, and 23.19% from vehicle hydrogen transportation for a distance of 50 km.
Figure 3 shows the levelized costs of the four different types of NPPs used to generate hydrogen using various methods. Exelon’s Nile Mile Point NPP’s total cost of producing hydrogen using the LTE technology is USD 4.85 ± 0.66/kg. This cost was distributed as follows: 1.14 USD/kg for the nuclear power plant, 0.83 USD/kg for the hydrogen-production facility, 0.71 USD/kg for the compressed gas storage, and 2.17 USD/kg for the vehicle transportation of hydrogen for a distance of 50 km. The total cost of producing hydrogen at Palo Verde NPP, utilizing the LTE method, is 4.77 ± 1.36 USD/kg. This cost is divided across various technologies: 3.10 USD/kg for the NPP, 1.24 USD/kg for the hydrogen-production facility, 0.23 USD/kg for the compressed gas storage, and 0.2 USD/kg for vehicle transportation over a 72 km distance. The overall cost of hydrogen generation for the Davis-Besse NPP, utilizing the LTE method, is 3.09 ± 1.19 USD/kg. The cost accounts for 0.14 USD/kg for the NPP, 2.55 USD/kg for the hydrogen production facility, 0.34 USD/kg for compressed gas storage of hydrogen, and 0.06 USD/kg for delivery by vehicle across a 16 km distance. The entire cost of hydrogen production for Xcel Energy’s Prairie Island NPP, utilizing the HTSE method, is 0.69 ± 0.03 USD/kg. This cost was split as follows: 0.21 USD/kg accounts for the NPP, 0.13 USD/kg for the hydrogen-production facility, 0.19 USD/kg to store hydrogen as compressed gas, and 0.16 USD/kg for vehicle transportation of hydrogen over a distance of 50 km. These results demonstrate that the cost of producing nuclear hydrogen using Exelon’s Nine Mile Point NPP reactor is the highest among the nuclear reactors, while the cost of producing nuclear hydrogen using the Prairie Island NPP reactor is the lowest. The results further show that the cost of vehicle hydrogen transportation is lower for Palo Verde, Davis-Besse, and Praire Island, but higher for Exelon’s Nile Mile.
The dominant factors for the levelized cost of hydrogen production comprise all the technical and economic parameters used for NPP, hydrogen generation plants, and storage and transportation, whereby any change in a particular parameter could result in a change in the levelized cost of hydrogen production.

4. Conclusions

The primary source of energy in today’s world is provided by fossil fuels, which are non-renewable by nature and their use thus limited to availability. Fossil fuel depletion, rising energy consumption, and the escalating environmental effects of greenhouse gas emissions have been noted as the three main issues with the global energy infrastructure at the start of the twenty-first century. Due to their established infrastructure, fossil fuels provide inexpensive energy, but have severe defects and a negative influence on the environment. As a result, alternative sources of renewable energy are being considered as potential candidates to meet most energy needs. Hydrogen is regarded as the most environmentally benign of these fuels. As its visibility continues to rise, hydrogen can complement renewables and help decarbonize those parts that renewables cannot reach. This study introduces the levelized cost of four different cases with various techniques of nuclear hydrogen production (each case has its own inputs). The aim of this study is to evaluate the levelized cost of producing hydrogen using existing LWRs in the US. HEEP software was employed in estimating the levelized cost of hydrogen production for four LWRs in the US, in line with the Hydrogen Shot Summit that was launched by the DOE in June 2021. Case 1 is on-site hydrogen generation at the Nine Mile Point NPP (600 MWe). The production method was PEM electrolysis; Case 2 is hydrogen generation at the Palo Verde NPP (1400 MW). The production method was the LTE method; Case 3 is hydrogen generation at the Prairie Island NPP (522 MWe). The production method was the HTSE method; and Case 4 is hydrogen generation at the Davis-Besse NPP (900 MW). The production method was LTE using PEM technology.
The result shows that the total cost of hydrogen production would be approximately 4.85 ± 0.66, 4.77 ± 1.36, 3.09 ± 1.19, and 0.69 ± 0.03 USD/kg for the Nile Mile Point, Palo Verde, Davis-Besse, and Prairie Island NPPs, respectively. For the Nile Mile Point NPP, the total cost of hydrogen production increased after considering transportation of the hydrogen to Oswego, which is the nearest city to the plant. The transportation has a 44.7% contribution to the total cost. For the Palo Verde NPP, the total cost of hydrogen production is approximately the same as that of the Nile Mile Point NPP. However, the contribution of the NPP cost is very high (65%) compared to that of the Nile Mile Point NPP because the investment and O&M costs of Palo Verde are higher than those of the Nile Mile Point NPP due to power differences. For the Davis-Besse NPP, 82.5% of the total cost arose from the hydrogen-generation plant. Prairie Island NPP had the lowest cost of hydrogen production of 0.69 ± 0.03 USD/kg, considering all four stages of nuclear hydrogen production; therefore, it is the best case of hydrogen production for economic viability.
The levelized cost of hydrogen is the summation of the NPP cost, hydrogen generation cost, storage, and transportation cost divided by the amount of production per year. The cost of the hydrogen-generation technique is apart from the total levelized cost. From Figure 2, the contribution of hydrogen generation to the total levelized cost was 17.1% at the Nine Mile Point NPP, which generate the hydrogen by LTE using the PEM electrolysis technique. On other hand, the contribution of hydrogen generation to the total levelized cost was 18.8% at Prairie Island NPP, which generate the hydrogen by the HTSE technique. From Table 3, the overnight capital cost for the Nine Mile Point NPP was 2.6 × 10⁶ USD/unit, which is lower than the overnight capital cost for the Prairie Island NPP, which was 5.78 × 10⁸ USD/unit. However, the total cost of hydrogen production at the Nine Mile Point NPP will be 4.77 ± 1.36 USD/kg while the total cost of hydrogen generation at the Prairie Island NPP will be 0.69 ± 0.03 USD/kg. In conclusion, the levelized cost of the Prairie Island NPP was small, not because of the low cost of the hydrogen generation technique, but because of the amount of hydrogen generation per year. For the Palo Verde site, due to the overnight capital cost, the Palo Verde NPP was 1.2 × 10¹⁰ USD/unit, which was relatively high, and the contribution of the nuclear power plant to the total levelized cost of hydrogen was 65.0%. In addition, the overnight capital cost of the hydrogen plant was 3 × 10⁹ USD/unit. This led to the total levelized cost of the hydrogen being relatively high, although the amount of hydrogen production was 2.52 × 10⁸ kg/yr, which is high. For the Davis-Besse site, due to the high overnight cost of the hydrogen-generation plant of 1.6 × 10⁸ USD/unit, with the amount of hydrogen produced being 7.9 × 10⁶ kg/yr, which is low, the predominate cost contributing to the total levelized cost of the hydrogen here came from the hydrogen-generation plant, which represents 82.5% from the total cost. It can be concluded that the final price of the hydrogen depends not only on the production method but also on the cost of the nuclear power plant and the production rate of the hydrogen plant.

Author Contributions

Conceptualization, A.A.E.-H., R.J.S. and H.H.R.; methodology, A.A.E.-H. and R.J.S.; software, J.K.; investigation, J.H.H., M.N. and H.H.R.; resources, J.K., R.J.S. and J.H.H.; data curation, M.N. and H.H.R.; writing—original draft preparation, A.A.E.-H.; writing—review and editing, J.K., A.A.E.-H., R.J.S., M.N. and H.H.R.; supervision, J.K.; funding acquisition, J.K. All authors have read and agreed to the published version of the manuscript.

Funding

This research was supported by the Nuclear Safety Research Program through the Korea Foundation of Nuclear Safety (KoFONS) using the financial resources granted by the Nuclear Safety and Security Commission (NSSC) of the Republic of Korea (No. 2003015). This research was also supported by the 2022 Research Fund of the KEPCO International Nuclear Graduate School (KINGS), the Republic of Korea.

Institutional Review Board Statement

Not applicable.

Informed Consent Statement

Not applicable.

Data Availability Statement

The data are available upon request.

Conflicts of Interest

The authors declare no conflict of interest.

References

  1. Yan, X.L.; Hino, R. Nuclear Hydrogen Production; CRC: Boca Raton, FL, USA, 2011. [Google Scholar]
  2. Iulianelli, A.; Basile, A. Advances in Hydrogen Production, Storage and Distribution; Elsevier: Amsterdam, The Netherlands, 2014. [Google Scholar]
  3. Riis, T.; Hagen, E.; Sandrock, G.; Vie, P.; Ulleberg, O. Hydrogen Production and Storage; International Energy Agency: Paris, France, 2006. [Google Scholar]
  4. Jovan, D.J.; Dolanc, G. Can green hydrogen production be economically viable under current market conditions. Energies 2020, 13, 6599. [Google Scholar] [CrossRef]
  5. Howarth, R.W.; Jacobson, M.Z. How green is blue hydrogen? Energy Sci. Eng. 2021, 9, 1676–1687. [Google Scholar] [CrossRef]
  6. Reuters Events. Nuclear Seen Keeping Costs Down for ‘Green’ Hydrogen. Available online: https://www.reutersevents.com/nuclear/nuclear-seen-keeping-costs-down-green-hydrogen (accessed on 4 August 2022).
  7. Dincer, I.; Acar, C. Review and evaluation of hydrogen production methods for better sustainability. Int. J. Hydrogen Energy 2015, 40, 11094–11111. [Google Scholar] [CrossRef]
  8. IAEA. Nuclear Hydrogen Production. Available online: https://www.iaea.org/topics/non-electric-applications/nuclear-hydrogen-production (accessed on 4 August 2022).
  9. Prawira, A.Y.; Kim, P.S.; Yim, M.-S. Techno-Economic Analysis of Hydrogen Production Using Nuclear Power Plant Electricity Generation in Korea. Fuel 2020, 30390, 24000. [Google Scholar]
  10. El-Emam, R.S.; Ozcan, H.; Dincer, I. Comparative cost evaluation of nuclear hydrogen production methods with the Hydrogen Economy Evaluation Program (HEEP). Int. J. Hydrogen Energy 2015, 40, 11168–11177. [Google Scholar] [CrossRef]
  11. Botterud, A.; Yildiz, B.; Conzelmann, G.; Petri, M.C. Nuclear hydrogen: An assessment of product flexibility and market viability. Energy Policy 2008, 36, 3961–3973. [Google Scholar] [CrossRef]
  12. Sorgulu, F.; Dincer, I. Cost evaluation of two potential nuclear power plants for hydrogen production. Int. J. Hydrogen Energy 2018, 43, 10522–10529. [Google Scholar] [CrossRef]
  13. McKellar, M.G.; Harvego, E.A.; Gandrik, A.A. System Evaluation and Economic Analysis of a HTGR Powered High-Temperature Electrolysis Hydrogen Production Plant; Idaho National Laboratory (INL): Idaho Falls, ID, USA, 2010.
  14. Karasawa, H. Cost evaluation for centralized hydrogen production. Prog. Nucl. Energy 2005, 47, 512–518. [Google Scholar] [CrossRef]
  15. Frick, K.; Wendt, D.; Talbot, P.; Rabiti, C.; Boardman, R. Technoeconomic assessment of hydrogen cogeneration via high temperature steam electrolysis with a light-water reactor. Appl. Energy 2022, 306, 118044. [Google Scholar] [CrossRef]
  16. Frick, K.L.; Talbot, P.W.; Wendt, D.S.; Boardman, R.D.; Rabiti, C.; Bragg-Sitton, S.M.; Ruth, M.; Levie, D.; Frew, B.; Elgowainy, A. Evaluation of Hydrogen Production Feasibility for a Light Water Reactor in the Midwest; Idaho National Lab. (INL): Idaho Falls, ID, USA, 2019.
  17. Nuclear Newswire. Palo Verde Gets $20 Million to Make Hydrogen while the Sun Shines. Available online: https://www.ans.org/news/article-3323/palo-verde-gets-20-million-to-make-hydrogen-while-the-sun-shines/ (accessed on 29 November 2021).
  18. IAEA-PRIS. PRAIRIE ISLAND-1. Available online: https://pris.iaea.org/PRIS/CountryStatistics/ReactorDetails.aspx?current=633 (accessed on 30 November 2021).
  19. IAEA-PRIS. NINE MILE POINT-1. Available online: https://pris.iaea.org/pris/CountryStatistics/ReactorDetails.aspx?current=607 (accessed on 30 November 2021).
  20. IAEA-PRIS. DAVIS BESSE-1. Available online: https://pris.iaea.org/pris/CountryStatistics/ReactorDetails.aspx?current=676 (accessed on 30 November 2021).
  21. IAEA-PRIS. PALO VERDE-1. Available online: https://pris.iaea.org/PRIS/CountryStatistics/ReactorDetails.aspx?current=789 (accessed on 30 November 2021).
  22. Exelon. Exelon Generation Receives DOE Grant to Support Hydrogen Production Project at Nine Mile Point Nuclear Station. Available online: https://www.exeloncorp.com/newsroom/Pages/DOE-Grant-to-Support-Hydrogen-Production-Project-at-Nine-Mile-Point.aspx (accessed on 30 November 2021).
  23. World Nuclear News. Nine Mile Point to Produce Hydrogen for Self-Supply. Available online: https://www.world-nuclear-news.org/Articles/Nine-Mile-Point-to-produce-hydrogen-for-self-suppl (accessed on 30 November 2021).
  24. Nuclear Engineering International. Exelon Receives US DOE Grant to Support Hydrogen Production. Available online: https://www.neimagazine.com/news/newsexelon-receives-us-doe-grant-to-support-hydrogen-production-9021782 (accessed on 30 November 2021).
  25. Nuclear Newswire. Nine Mile Point Picked for Hydrogen Demonstration Project. Available online: https://www.ans.org/news/article-3180/nine-mile-point-picked-for-hydrogen-demonstration-project/ (accessed on 30 November 2021).
  26. Energy.gov. DOE Announces $20 Million to Produce Clean Hydrogen from Nuclear Power. Available online: https://www.energy.gov/articles/doe-announces-20-million-produce-clean-hydrogen-nuclear-power (accessed on 30 November 2021).
  27. Mullin, R. Palo Verde Hydrogen Demo Gets $20M from DOE. Available online: https://www.rtoinsider.com/articles/28810-palo-verde-hydrogen-demo-doe (accessed on 25 November 2021).
  28. Nuclear Newswire. Xcel Energy’s Prairie Island Likely Hydrogen Demo Site. Available online: https://www.ans.org/news/article-2366/xcel-energys-prairie-island-likely-hydrogen-demo-site/ (accessed on 30 November 2021).
  29. Hughlett, M. Xcel looking at clean-energy hydrogen projects. Star Tribune, 28 October 2021. [Google Scholar]
  30. Green Car Congress. Xcel Energy, INL to Use Nuclear Energy for Clean Hydrogen Production; HTSE. 2020. Available online: https://www.greencarcongress.com/2020/12/20201213-xcel.html (accessed on 30 November 2021).
  31. Antony, A. Examining the Technoeconomics of Nuclear Hydrogen Production and Benchmark Analysis of the IAEA HEEP Software; International Atomic Energy Agency (IAEA): Vienna, Austria, 2018; (IAEA-TECDOC—1859(COMPANION CD-ROM)). [Google Scholar]
  32. El-Emam, R.; Khamis, I. International collaboration in the IAEA nuclear hydrogen production program for benchmarking of HEEP. Int. J. Hydrogen Energy 2017, 42, 3566–3571. [Google Scholar] [CrossRef]
  33. Khamis, I.; Malshe, U. HEEP: A new tool for the economic evaluation of hydrogen economy. Int. J. Hydrogen Energy 2010, 35, 8398–8406. [Google Scholar] [CrossRef]
  34. Energy.Gov. Assumptions and Ground Rules. Available online: https://www.hydrogen.energy.gov/h2a_prod_rules.html (accessed on 30 November 2021).
  35. FRED. Interest Rates, Discount Rate for United States. Available online: https://fred.stlouisfed.org/series/INTDSRUSM193N (accessed on 30 November 2021).
  36. Bankrate. 2021–2022 Tax Brackets and Federal Income Tax Rates. Available online: https://www.bankrate.com/taxes/tax-brackets/ (accessed on 30 November 2021).
  37. CEIC. United States Bank Lending Rate. Available online: https://www.ceicdata.com/en/indicator/united-states/bank-lending-rate (accessed on 30 November 2021).
  38. U.S.NRC. Nine Mile Point Nuclear Station, Unit 1. Available online: https://www.nrc.gov/info-finder/reactors/nmp1.html (accessed on 30 November 2021).
  39. Py, J.-P.; Capitaine, A. Hydrogen Production by High Temperature Electrolysis of Water Vapour and Nuclear Reactors. In Proceedings of the WHEC16: 16 World Hydrogen Energy Conference, Lyon, France, 13–16 June 2006. [Google Scholar]
  40. Adams, R. Nuclear Energy Is Cheap and Disruptive; Controlling the Initial Cost of Nuclear Power Plants is a Solvable Problem. Available online: https://atomicinsights.com/nuclear-energy-is-cheap-and-disruptive-controlling-the-initial-cost-of-nuclear-power-plants-is-a-solvable-problem/ (accessed on 30 November 2021).
  41. Nel, M. Series Containseized Proton Exchange Membrane (PEM) Hydrogen Generation Systems; Nel ASA: Oslo, Norway, 2020. [Google Scholar]
  42. Koleva, M.; Azubike, C.; Rustagi, N. Hydrogen Production Potential from Nuclear Power; DOE Hydrogen Program; DOE U.S. Department of Energy, Office of Nuclear Energy: Washington, DC, USA, 2020. [Google Scholar]
  43. Peterson, D.; Vickers, J.; DeSantis, D. Hydrogen Production Cost from PEM Electrolysis-2019; DOE Hydrogen Fuel Cells Program Record; U.S. Department of Energy: Washington, DC, USA, 2020; p. 19009.
  44. U.S.NRC. Davis-Besse Nuclear Power Station, Unit 1. Available online: https://www.nrc.gov/info-finder/reactors/davi.html (accessed on 30 November 2021).
  45. U.S.NRC. Palo Verde Nuclear Generating Station, Unit 1. Available online: https://www.nrc.gov/info-finder/reactors/palo1.html (accessed on 30 November 2021).
  46. U.S.NRC. Prairie Island Nuclear Generating Plant, Unit 1. Available online: https://www.nrc.gov/info-finder/reactors/prai1.html (accessed on 30 November 2021).
Figure 1. The cost components considered in HEEP.
Processes 10 01620 g001
Figure 2. Percentage contribution of the nuclear power plant, H2 generation, storage, and transportation cost for (a) shows percentage contribution of H2 generation steps for Nile Mile Point nuclear power plant, (b) shows percentage contribution of H2 generation steps for Palo Verde nuclear power plant (c) shows percentage contribution of H2 generation steps for Davis Besse nuclear power plant and (d) shows percentage contribution of H2 generation steps for Prairie Island nuclear power plant.
Processes 10 01620 g002
Figure 3. Cost of nuclear hydrogen production from four nuclear facilities in the US.
Processes 10 01620 g003
Table 1. Nuclear power plant parameters.
Reactor NamePower Output (MWe)Thermal Output (MWth)Reactor TypeManufacturer
Prairie Island [18]5.50 × 1021.65 × 103PWRNorth State Power Company, Xcel Energy (Minneapolis, MN, USA)
Nine Mile Point [19]6.44 × 1021.85 × 103BWRExelon (Chicago, IL, USA) and EDF (Houston, TX, USA)
Davis-Besse [20]9.00 × 1022.82 × 103PWREnergy Harbor Nuclear Corporation (Akron, OH, USA)
Palo Verde [21]1.31 × 1033.94 × 103PWRArizona Public Service (Phoenix, AR, USA)
Table 2. Nuclear power plant input data for estimation of the hydrogen-production cost.
Nuclear Plant DataNine Mile PointDavis-BessePalo VerdePrairie Island
Power plant typeBWR [38]PWR [20]PWR [21]PWR [18]
Power plant nameNine Mile Point NPP—Unit 1Davis-Besse NPPPalo Verde NPPPrairie Island NPP
Start year of construction12 April 1965 [19]1 September 1970 [20]25 May 1976 [21]25 June 1968 [18]
Construction period (Years)4 (Commission date 1 December 1969) [19]8 (Commission date 31 July 1978) [20]10 (Commission date 28 January 1986) [21]5 (Commission date 16 December) 1973 [18]
Operation period (Years)60 (License end: 22 August 2029) [38]30 [20]33 [21]60 [18]
Thermal rating (MWth/unit)1.85 × 103 [38]2.82 × 10³ [20]3.99 × 10³ [21]1.68 × 10³ [18]
Heat for H2 plant (MWth/unit)---6.00 × 102 [39]
Electricity rating (MWe/unit)6.44 × 102 [38]8.94 × 10² [20]1.31 × 10³ [21]5.22 × 10² [18]
Unit number1111
Initial fuel load (kg/unit)07.50 × 104 [12]7.50 × 10⁴ [12]7.50 × 10⁴ [12]
Annual fuel feed (kg/unit)12.50 × 104 [12]2.50 × 10⁴ [12]2.50 × 10⁴ [12]
Overnight capital cost (USD/unit)1.07 × 109 2.21 × 10⁸ 1.2 × 10¹⁰ [12]1.2 × 10⁹
Capital cost fraction for electricity generating infrastructure (default)25252525
Fuel cost (USD/kg)31.5 × 106 [40]1.50 × 10³ [12]1.50 × 10³ [12]1.50 × 10³ [12]
O&M cost (% of capital cost) [34]5555
Decommissioning cost (% of capital cost) [34]10101010
Table 3. Hydrogen plant input data for estimation of the hydrogen-production cost.
H2 Plant DataNine Mile PointDavis-BessePalo VerdePrairie Island
Location of the H2-generation plantCo-LocatedCo-LocatedCo-LocatedCo-Located
Generation methodPEMPEMLTEHTSE
Unit capacity factor (%)90909090
Unit availability factor (%)100100100100
H2 generation per unit (kg/yr)1.94 × 105 [41]7.9 × 10⁶ [42]2.52 × 10⁸ [13]8.83 × 10⁸ [39]
Heat consumption (MWth/unit)---600 [39]
Electricity required (MWe/unit)1.25 [41]1.25 [41]1311 [12]233 [39]
Number of units1111
Overnight capital cost (USD/unit)2.6 × 106 [23]1.6 × 10⁸ [9]3.0 × 10⁹ [12]5.78 × 10⁸ [39]
Other O&M cost (% of capital cost)2.611 [43]2.6 [43]5.5 [12]10
Decommissioning cost (% of capital cost) [34]10101010
Table 4. Input data for hydrogen storage using the compressed gas method.
H2 Storage DataNine Mile PointDavis-BessePalo VerdePrairie Island
Storage capacity (Kg)3.72 × 1031.52 × 105 4.83 × 1061.69 × 109
Compressor cooling water (L/h)1.15 × 1034.69 × 1041.50 × 1065.24 × 106
Electricity requirement (KWe)5.07 × 1012.06 × 1036.59 × 1042.31 × 105
Overnight capital cost (USD)1.5 × 1062.00 × 1074.59 × 1081.25 × 109
Other O&M cost (% of capital cost) [30]5555
Decommissioning cost (% of capital cost) [34]10101010
Table 5. Input data for hydrogen transport using vehicle.
Distance for transport (km)50167250
Nearest city to the reactorOswego, NY, USA [38]Toledo, OH, USA [44]Phoenix, AZ, USA [45]Minneapolis, MN, USA [46]
Overnight capital cost (USD) [31]5.0 × 1051.0 × 105 1.0 × 10⁵ 5.0 × 10⁵
Fuel cost and drive pay (USD) [31]3.98 × 1057.36 × 103 5.09 × 1078.24 × 105
Other O&M cost (% of capital cost) [31]1111
Decommissioning cost (% of capital cost) [31]10101010
Publisher’s Note: MDPI stays neutral with regard to jurisdictional claims in published maps and institutional affiliations.

