Article

Study on the Disinfection Efficiency of the Combined Process of Ultraviolet and Sodium Hypochlorite on the Secondary Effluent of the Sewage Treatment Plant

1
Key Laboratory of Songliao Aquatic Environment, Ministry of Education, Jilin Jianzhu University, Changchun 130118, China
2
Urban Construction College, Changchun University of Architecture, Changchun 130000, China
*
Author to whom correspondence should be addressed.
Processes 2022, 10(8), 1622; https://doi.org/10.3390/pr10081622
Submission received: 12 July 2022 / Revised: 15 August 2022 / Accepted: 15 August 2022 / Published: 16 August 2022

Abstract

:
The combined disinfection process of ultraviolet and sodium hypochlorite has more advantages than the single disinfection method in reducing the disinfectant dosage, shortening the reaction time, and resisting the impact of water quality changes and inhibiting the light reactivation of microorganisms. Given this, using the secondary effluent of a sewage plant as the research object, the disinfection efficiency of the combined process of ultraviolet and sodium hypochlorite was investigated. The experimental results showed that the inactivation effect of UV followed by sodium hypochlorite on fecal coliform and the inhibition of microbial photoreactivation was more significant than that of simultaneous disinfection of UV and sodium hypochlorite disinfection. When the UV dose was 24 mJ/cm2, after disinfection with UV followed by sodium hypochlorite, only 1 mg/L of sodium hypochlorite was required to be added, and a contact reaction time of 1 min for the fecal coliform index to meet the first-Class A emission standard. After disinfection, the effluent’s maximum reactivation rate of fecal coliform was 26.96%. However, the simultaneous disinfection of ultraviolet and sodium hypochlorite required the addition of 3 mg/L of sodium hypochlorite. After disinfection, the maximum reactivation rate of the fecal coliform group reached 30.81%.

1. Introduction

The traditional sewage treatment plant is divided into three levels of treatment processes. The primary treatment is a physical treatment, which removes the sewage’s stones, sand, fat, grease, etc., through mechanical treatment, such as grid, sedimentation, or air floatation. The secondary treatment is biochemical treatment, in which the pollutants in the sewage are degraded and transformed into sludge under the action of microorganisms. Finally, the tertiary treatment is the advanced treatment of sewage, which includes the removal of nutrients and disinfection of sewage by chlorination, ultraviolet radiation, or ozone technology. Nevertheless, after the primary and secondary treatment processes, the solids, organic matter, and some harmful microbial populations in the sewage can be removed [1]. However, the microbial indicators cannot meet the requirements of direct discharge. Therefore, to prevent the spread of diseases and protect human and ecological health and safety, it is imperative to conduct tertiary disinfection treatment of secondary effluent to reduce microorganisms (for example, Escherichia coli, a representative bacterium in sewage) to a level that meets discharge standards [2,3,4,5]. Presently, the commonly used sewage disinfection technologies mainly include chemical disinfection (such as sodium hypochlorite, chlorine dioxide, ozone, etc.) and physical disinfection (such as ultraviolet (UV)) [6,7]. Sodium hypochlorite is the most commonly used disinfectant in sewage treatment plants, but it reacts with natural organic matter (NOM) in sewage. As a result, it produces many toxic halogenated disinfection by-products (DBPs), potentially adversely affecting the water environment and human health [8,9,10,11,12]. Compared with traditional chemical disinfection, UV disinfection barely produces by-products of “carcinogenicity, teratogenicity, and mutagenicity”. However, its disinfection effect is unstable in practical application, and the inactivated microorganisms have photoreactivation [13,14,15]. These problems limit the application and development of the above single disinfection method in sewage disinfection, so the combined disinfection process emerges as time requires.
Studies have shown that the combined disinfection process synergistically affects the inactivation of heterotrophic bacteria and total coliform bacteria and the removal of antibiotic resistance genes, which significantly reduces the dosage of sodium hypochlorite and contact reaction time, effectively overcomes the problem of tailing phenomenon in single-group UV disinfection, and greatly improves the disinfection efficiency [16,17]. For example, Ha J.H. et al. [18] studied the inactivation effect of different concentrations of sodium hypochlorite and different doses of UV on Bacillus cereus F4810/72, Crono-bacter sakazakii KCTC 2949, Staphylococcus aureus ATCC 35556, Escherichia coli ATCC 10536, and Salmonella Typhimurium novobiocin/nalidixic acid in vitro. The results showed that the number of bacteria decreased significantly with the combination of sodium hypochlorite and UV compared to a single disinfection method. Chaúque, B.J. et al. [19] found that the inactivation of all A. castellanii trophozoites could be achieved by adding 2.0 mg/L of sodium hypochlorite and irradiating ultraviolet C (243 μW/cm2) for 150 min. Furthermore, by adding 1.0 mg/L of sodium hypochlorite, UV C (243 μW/cm2) irradiation for 90 min, all A. castellanii cysts (cysts) were inactivated. It can be seen that sodium hypochlorite can effectively inactivate chlorine-resistant microorganisms (A. castellanii) under the action of ultraviolet photolysis.
Therefore, this study examined the disinfection efficiency of the combined process of UV and sodium hypochlorite using the secondary effluent of a sewage plant in Changchun City as the research object. First, the experiment investigated the inactivation effect of the combined disinfection process on fecal coliform and the light reactivation of fecal coliform under different light intensity and irradiation times. At the same time, the changes of various indexes, such as NH4+-N, total phosphorus (TP), turbidity, chemical oxygen demand (COD), and UV254, of effluent after combined disinfection and the effects of temperature, turbidity, and COD load on the inactivation effect of fecal coliform were investigated. Then, the disinfection efficiency of the disinfection method of UV followed by sodium hypochlorite (for the sake of brevity, abbreviated as “Method A”) was compared with the other method of simultaneous disinfection of UV and sodium hypochlorite (abbreviated as “Method B”) to determine the better disinfection method and specific reaction conditions most suitable for the experimental water quality conditions. Thus, this study is of great significance to improve the operation effect of the disinfection process, deepen the understanding of the disinfection mechanism of the ultraviolet and sodium hypochlorite disinfection processes, improve the social water environment, and enhance water quality safety.

2. Materials and Methods

2.1. Experimental Materials

2.1.1. Experimental Water

The experimental water was the secondary effluent of a sewage treatment plant in Changchun City, using the oxidation ditch process. The main water quality parameters (COD, biochemical oxygen demand (BOD5), NH4+-N, total nitrogen (TN), TP, pH, and suspended solids (SS)) are shown in Table 1.

2.1.2. Experimental Reagent

The main reagents used in the experiment are shown in Table 2.

2.1.3. Conventional Water Quality-Index Detection Method

The detection methods of various conventional water quality indicators are shown in Table 3.

2.1.4. Microbial Detection Method

The experiment was based on the filter method specified in HJ/T 347-2007 standard to determine fecal coliform. First, the sterilized experimental water was shaken vigorously before the measurement to separate the microbes encapsulated by the particles and aggregated together in the water sample. Afterward, an appropriate dilution was selected according to the density of fecal coliforms in the secondary effluent. Again, an appropriate amount of sample was injected into a triangular beaker filled with sterile water according to the selected dilution. A vacuum pump was then used to filter the mixed water samples. After the suction filtration, the microporous membrane (i.e., filter membrane) with the aperture of 0.45 μm was clamped by the pretreated tweezers, and then the membrane was pasted on the MFC culture medium. The culture medium was placed upside down in the constant temperature incubator and incubated at 44.5 ± 0.5 °C for 24 ± 2 h.

2.1.5. Experimental Instrument

The main instrument used in the experiment was the quasi-parallel beam instrument, composed of the low-pressure UV lamp, parallel beam cylinder, Petri dish, and magnetic stirrer. Among them, the low-pressure ultraviolet lamp could emit monochromatic ultraviolet light with a wavelength of about 254 nm. The ultraviolet light was collimated by placing a baffle (parallel beam tube) along the ultraviolet light path. In order to prevent the ultraviolet light from being reflected inside the baffle, it was necessary to ensure the roughness inside the baffle. The magnetic stirrer was used to mix the samples in the culture dish evenly and ensure that the rotation speed was not high to avoid the formation of a vortex in the water sample. Its structure is shown in Figure 1. Other instruments used in the experiment are shown in Table 4.

2.2. Experimental Method

The secondary effluent of the sewage plant was collected for the disinfection experiment, and the parameters such as the number of fecal coliforms, NH4+-N, TP, turbidity, COD, and UV254 were detected. Afterward, the test water samples were disinfected using the two disinfection schemes, “Method A” and “Method B”. Three parallel samples were set up in each group of experiments, and the average value of the readings of the three parallel samples was taken as the result. In the disinfection experiment of “Method A”, the ultraviolet dose was controlled to 24 mJ/cm2, the UV irradiation time was calculated according to the UV dose equation (Equation (1)) [20], and 0.5, 1, 2, 3, 4 and 5 mg/L sodium hypochlorite solutions were added to the water sample after ultraviolet disinfection, respectively. The contact reaction time was 1, 3, and 5 min, respectively. In the experiment of “Method B”, 0.5, 1, 2, 3, 4, and 5 mg/L sodium hypochlorite solution were added to the water sample, respectively, and then the UV lamp was immediately switched on for irradiation. The UV lamp was turned off when the UV dose reached 24 mJ/cm2.
UV dose equation:
D = E c × 1 10 A 254 d A 254 d × l n ( 10 ) × L L + d × P f × ( 1 R f ) × t
where:
  • D—UV dose, mJ/cm2;
  • E C —Light intensity at the center of the Petri dish, mW/cm2;
  • A254—The absorbance of water sample when UV wavelength is 254 nm;
  • t—Ultraviolet irradiation time, s;
  • L—The distance from the UV lamp to the sample surface, cm;
  • d—The thickness of the water layer, cm;
  • P f —Petri Factor;
  • R f —Reflection Factor.
With the appropriate amount of water samples treated by the two different disinfection methods, the number of viable fecal coliforms was detected using the filter membrane method. The degree of photoreactivation of fecal coliforms was investigated under light intensity (15, 30, and 45 μm/cm2) and light time (2, 4, 6, and 8 h). At the same time, the parameters such as NH4+-N, TP, turbidity, COD, and UV254 were measured. Finally, the influent temperature was adjusted to 7, 14, 21, 28, and 35 °C, and turbidity was 3, 8, 13, 18, 23, 28, and 33 NTU, COD load was 20, 30, 40, 50, 60, 70, and 80 mg/L, respectively. The effects of temperature, turbidity, and COD load on the disinfection efficacy of fecal coliforms were investigated.

3. Results and Discussion

3.1. Disinfection Efficacy of Different Disinfection Methods

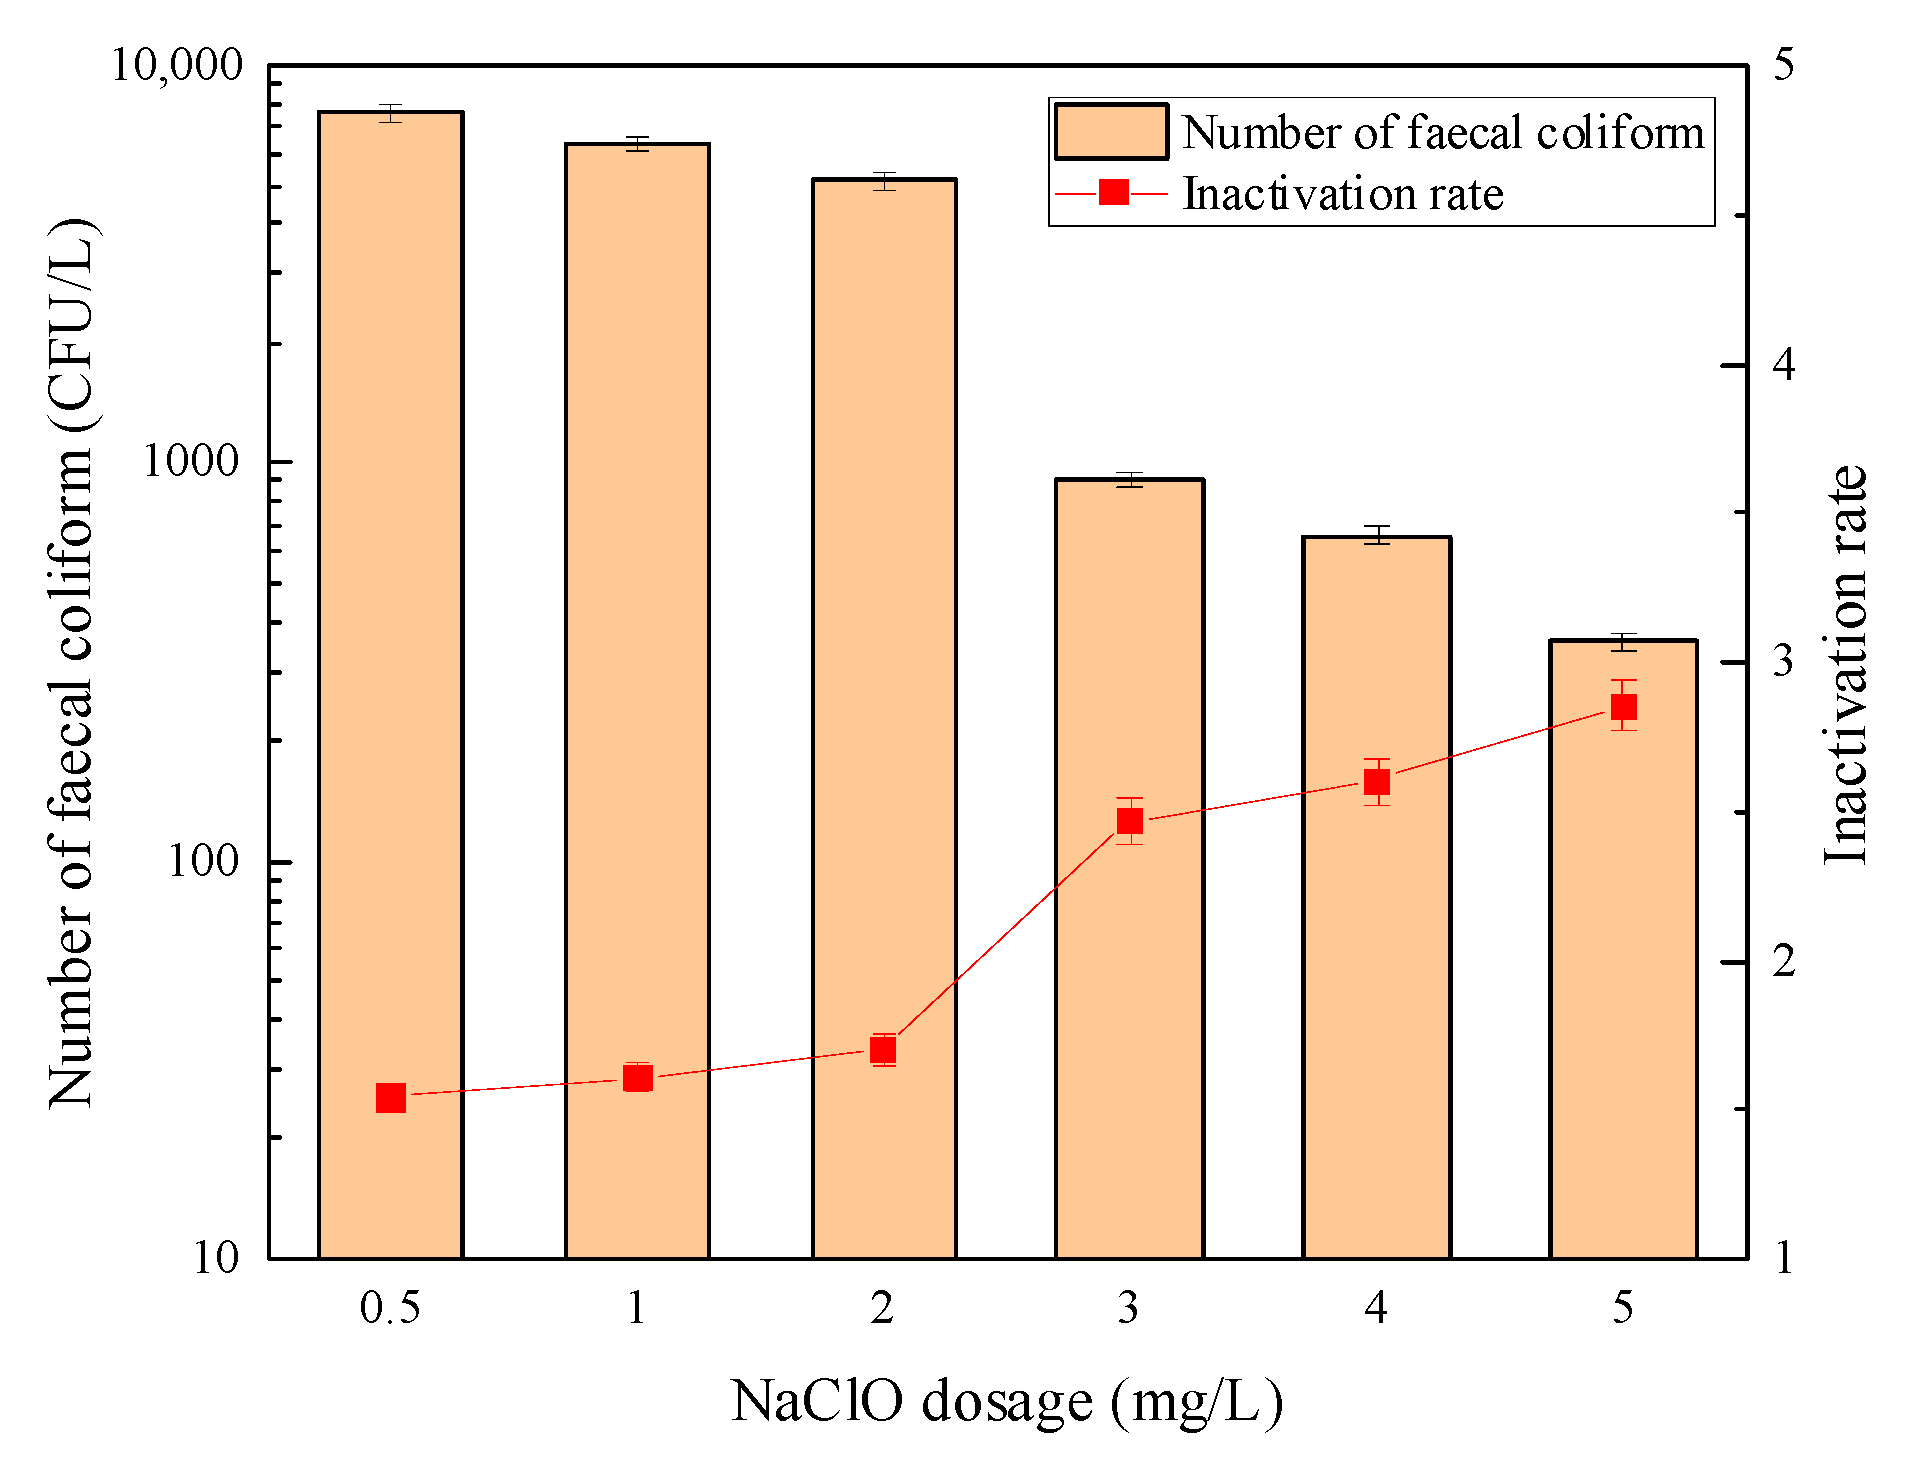
3.1.1. Inactivation of Fecal Coliforms

Figure 2 and Figure 3 show the sterilization effects of “Method A” and “Method B”, respectively. It can be seen from Figure 2 that when “Method A” was adopted, under the condition of an ultraviolet dose of 24 mJ/cm2, only 1 mg/L sodium hypochlorite solution was required to be added at a contact reaction time of 1 min. As a result, the number of fecal coliform in the effluent was reduced to 480 CFU/L, meeting the first-Class A discharged standard of “Discharge standard of pollutants for municipal wastewater treatment plant (GB18918-2002)”, thus, 103 CFU/L. However, as shown in Figure 3, when “Method B” was used, the dosage of sodium hypochlorite needed to be increased to 3 mg/L, and the number of fecal Escherichia coli met the provisions of the above standards after disinfection.
The above experimental results showed that to achieve the ideal disinfection effect when the UV dose was constant, “Method A” significantly reduced the dosage of sodium hypochlorite. Moreover, at the same time, it showed stronger microbial inactivation ability than “Method B”. This was because, during the disinfection process of UV before sodium hypochlorite, UV light caused a certain degree of damage to fecal coliform cells, which improved the possibility that sodium hypochlorite penetrated the cell wall and oxidized the protein or phosphate dehydrogenase inside the cell, to improve the disinfection efficiency. However, when UV and sodium hypochlorite concurrently exists in the water, the hydrolysis products (HClO/ClO) of sodium hypochlorite produce active oxidation radicals (HO), chlorine atoms (Cl), Cl2· and O· under the action of UV photolysis, which was used to degrade the pollutants in water. The reaction process is shown in Figure 4, which is considered a new advanced oxidation process (AOP) [21,22,23,24]. Fang J. et al. [25] believed that the organic matter quickly consumed the strong oxidizing radicals generated by the AOP mentioned above in the secondary effluent, causing it to lose the chance of contact oxidation with microorganisms, thereby resulting in a poor sterilization effect. Therefore, to obtain the ideal disinfection effect, increasing the dosage of sodium hypochlorite is necessary.
In order to verify this conclusion, three-dimensional fluorescence spectroscopy was used to determine the change law of organic components in water samples before and after combined disinfection. The results are shown in Figure 5. The peak value of the three-dimensional fluorescence spectrum at an excitation wavelength of 250~280 nm and emission wavelength < 380 nm were related to soluble microbial metabolites (Region IV). The peak at excitation wavelength > 280 nm and emission wavelength > 380 nm was related to humic acids (Region V). Therefore, the fluorescence intensity value in the figure was used to infer the content of the substance in the water sample to explore the change law of each organic component before and after disinfection [26,27]. The experimental results in Figure 5 show that in the combined mode when “Method B” was adopted, the fluorescence intensity in Area IV and V was significantly lower than that in raw water. This showed that the water sample had dissolved microbial metabolites, and humic acids were oxidized and decomposed and lost their fluorescence, significantly reducing these two organic components. Under the condition of “Method A”, the reduction of dissolved microbial metabolites and humic acids was considerably weaker than simultaneous disinfection with ultraviolet and sodium hypochlorite, which allowed more oxidants to participate in the disinfection process and improve the disinfection efficiency [28].

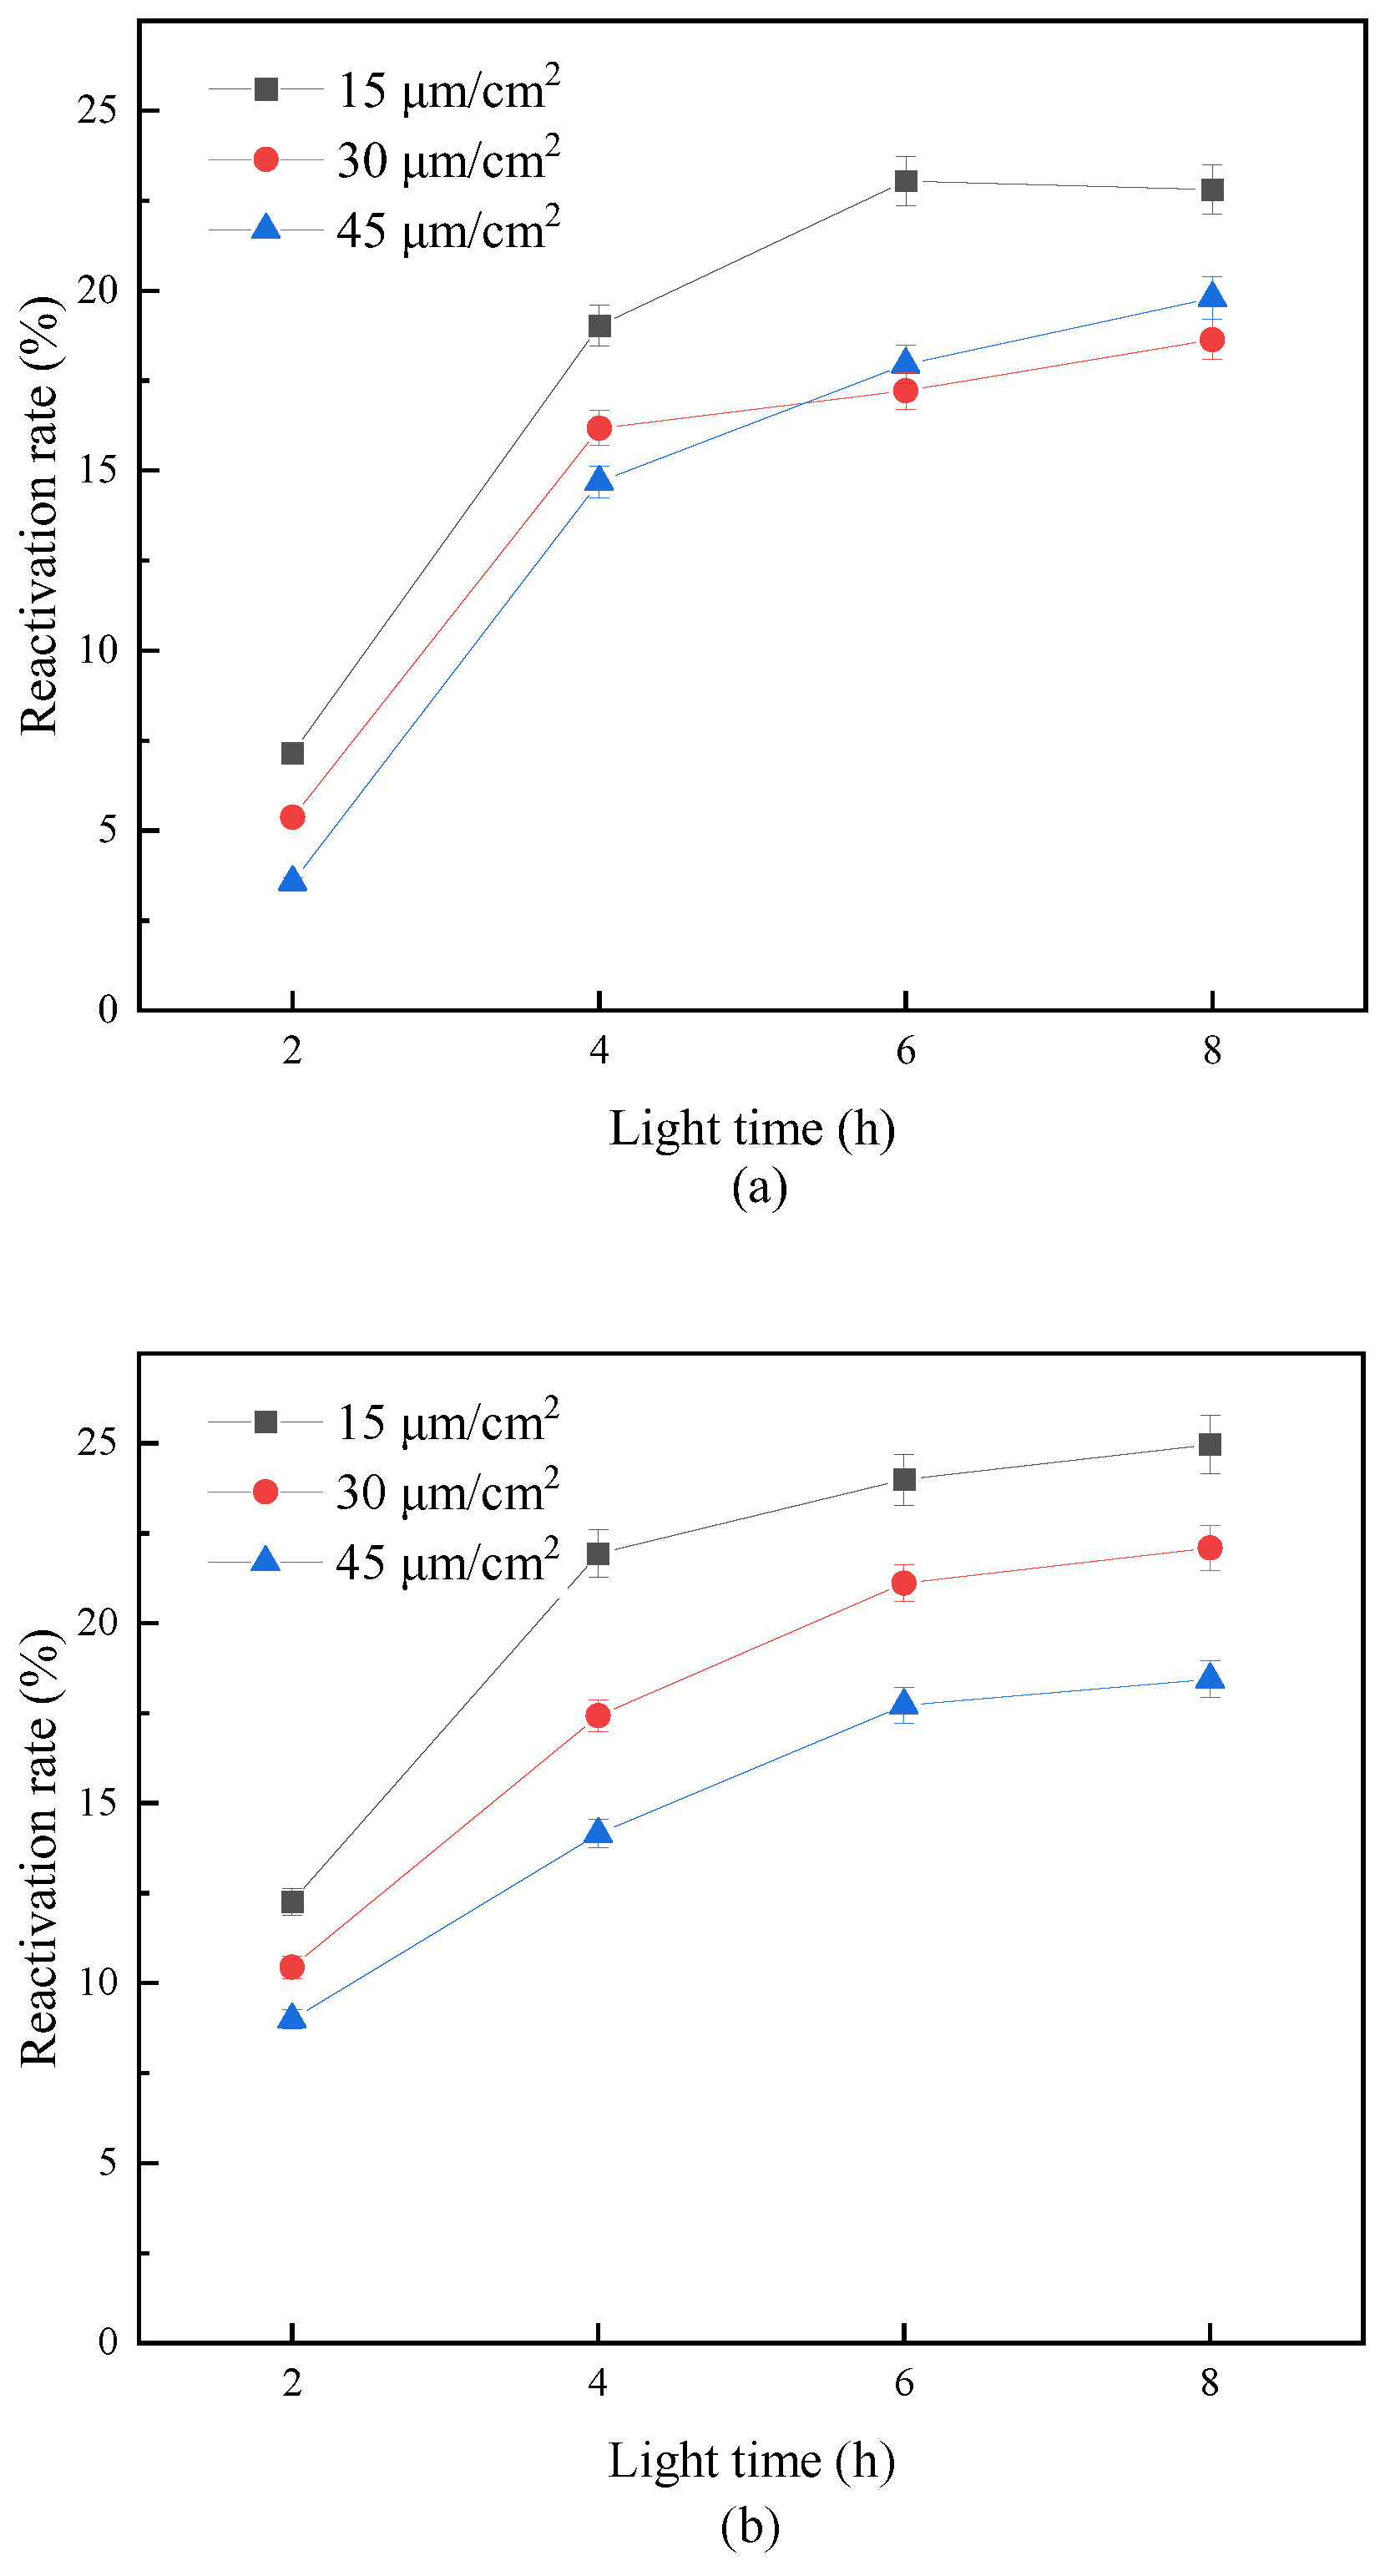
3.1.2. Photoreactivation of Fecal Coliforms

Figure 6 shows the effect of different illumination times and light intensity on the photoactivation of fecal coliform. It can be seen from Figure 6 that the reactivation rate of fecal coliforms in water samples after combined disinfection increased with the extension of light time. However, when the light time increased to 8 h, the reactivation rate of fecal coliforms in “Method A” and “Method B” under different reactivation light intensities gradually tended to the same level. This indicated that the light intensity affected the reactivation rate of fecal coliform at the initial stage of light exposure but did not significantly improve its reactivation degree. This is consistent with the research results of Guo M.T. et al. [29]. They found in the experiment that when the light time was 2 h, the larger the light intensity was, the faster the average resurrection rate of E. coli was. However, with the light reactivation time reaching 8 h, E. coli had reached the same maximum value of reactivation under different light intensities. In addition, it can be seen from the figure that the reactivation rate of fecal coliforms also increased with the enhancement of the reactivation light intensity. Under the conditions of 8 h of light revival time and 15, 30, and 45 μm/cm2 of revival light intensity, the revival rates of fecal coliforms in “Method A” were 16.88%, 21.09%, and 26.96%, respectively. This showed that the stronger the reactivation light intensity, the greater the energy provided to the damaged bacteria for light reactivation, and the stronger the corresponding light reactivation ability. In “Method B”, when the reactivation light intensity was 15 and 30 μm/cm2, there was little difference in the reactivation rate of fecal coliforms, which were 25.8% and 24.64%, respectively. With the increase of light intensity to 45 μm/cm2, the reactivation rate increased to 30.81%. The comparison results showed that the reactivation rate of fecal coliforms disinfected by “Method B” was higher than that of “Method A”. This may be due to more significant damage to the fecal coliform group caused by UV disinfection and sodium hypochlorite disinfection, resulting in most microorganisms losing the repair function of DNA dimer. Thus, effectively inhibiting the occurrence of microbial photoreactivation and ensuring the safety and stability of microbial indicators in the effluent.

3.2. Effects of Different Disinfection Methods on Secondary Effluent Quality Indexes

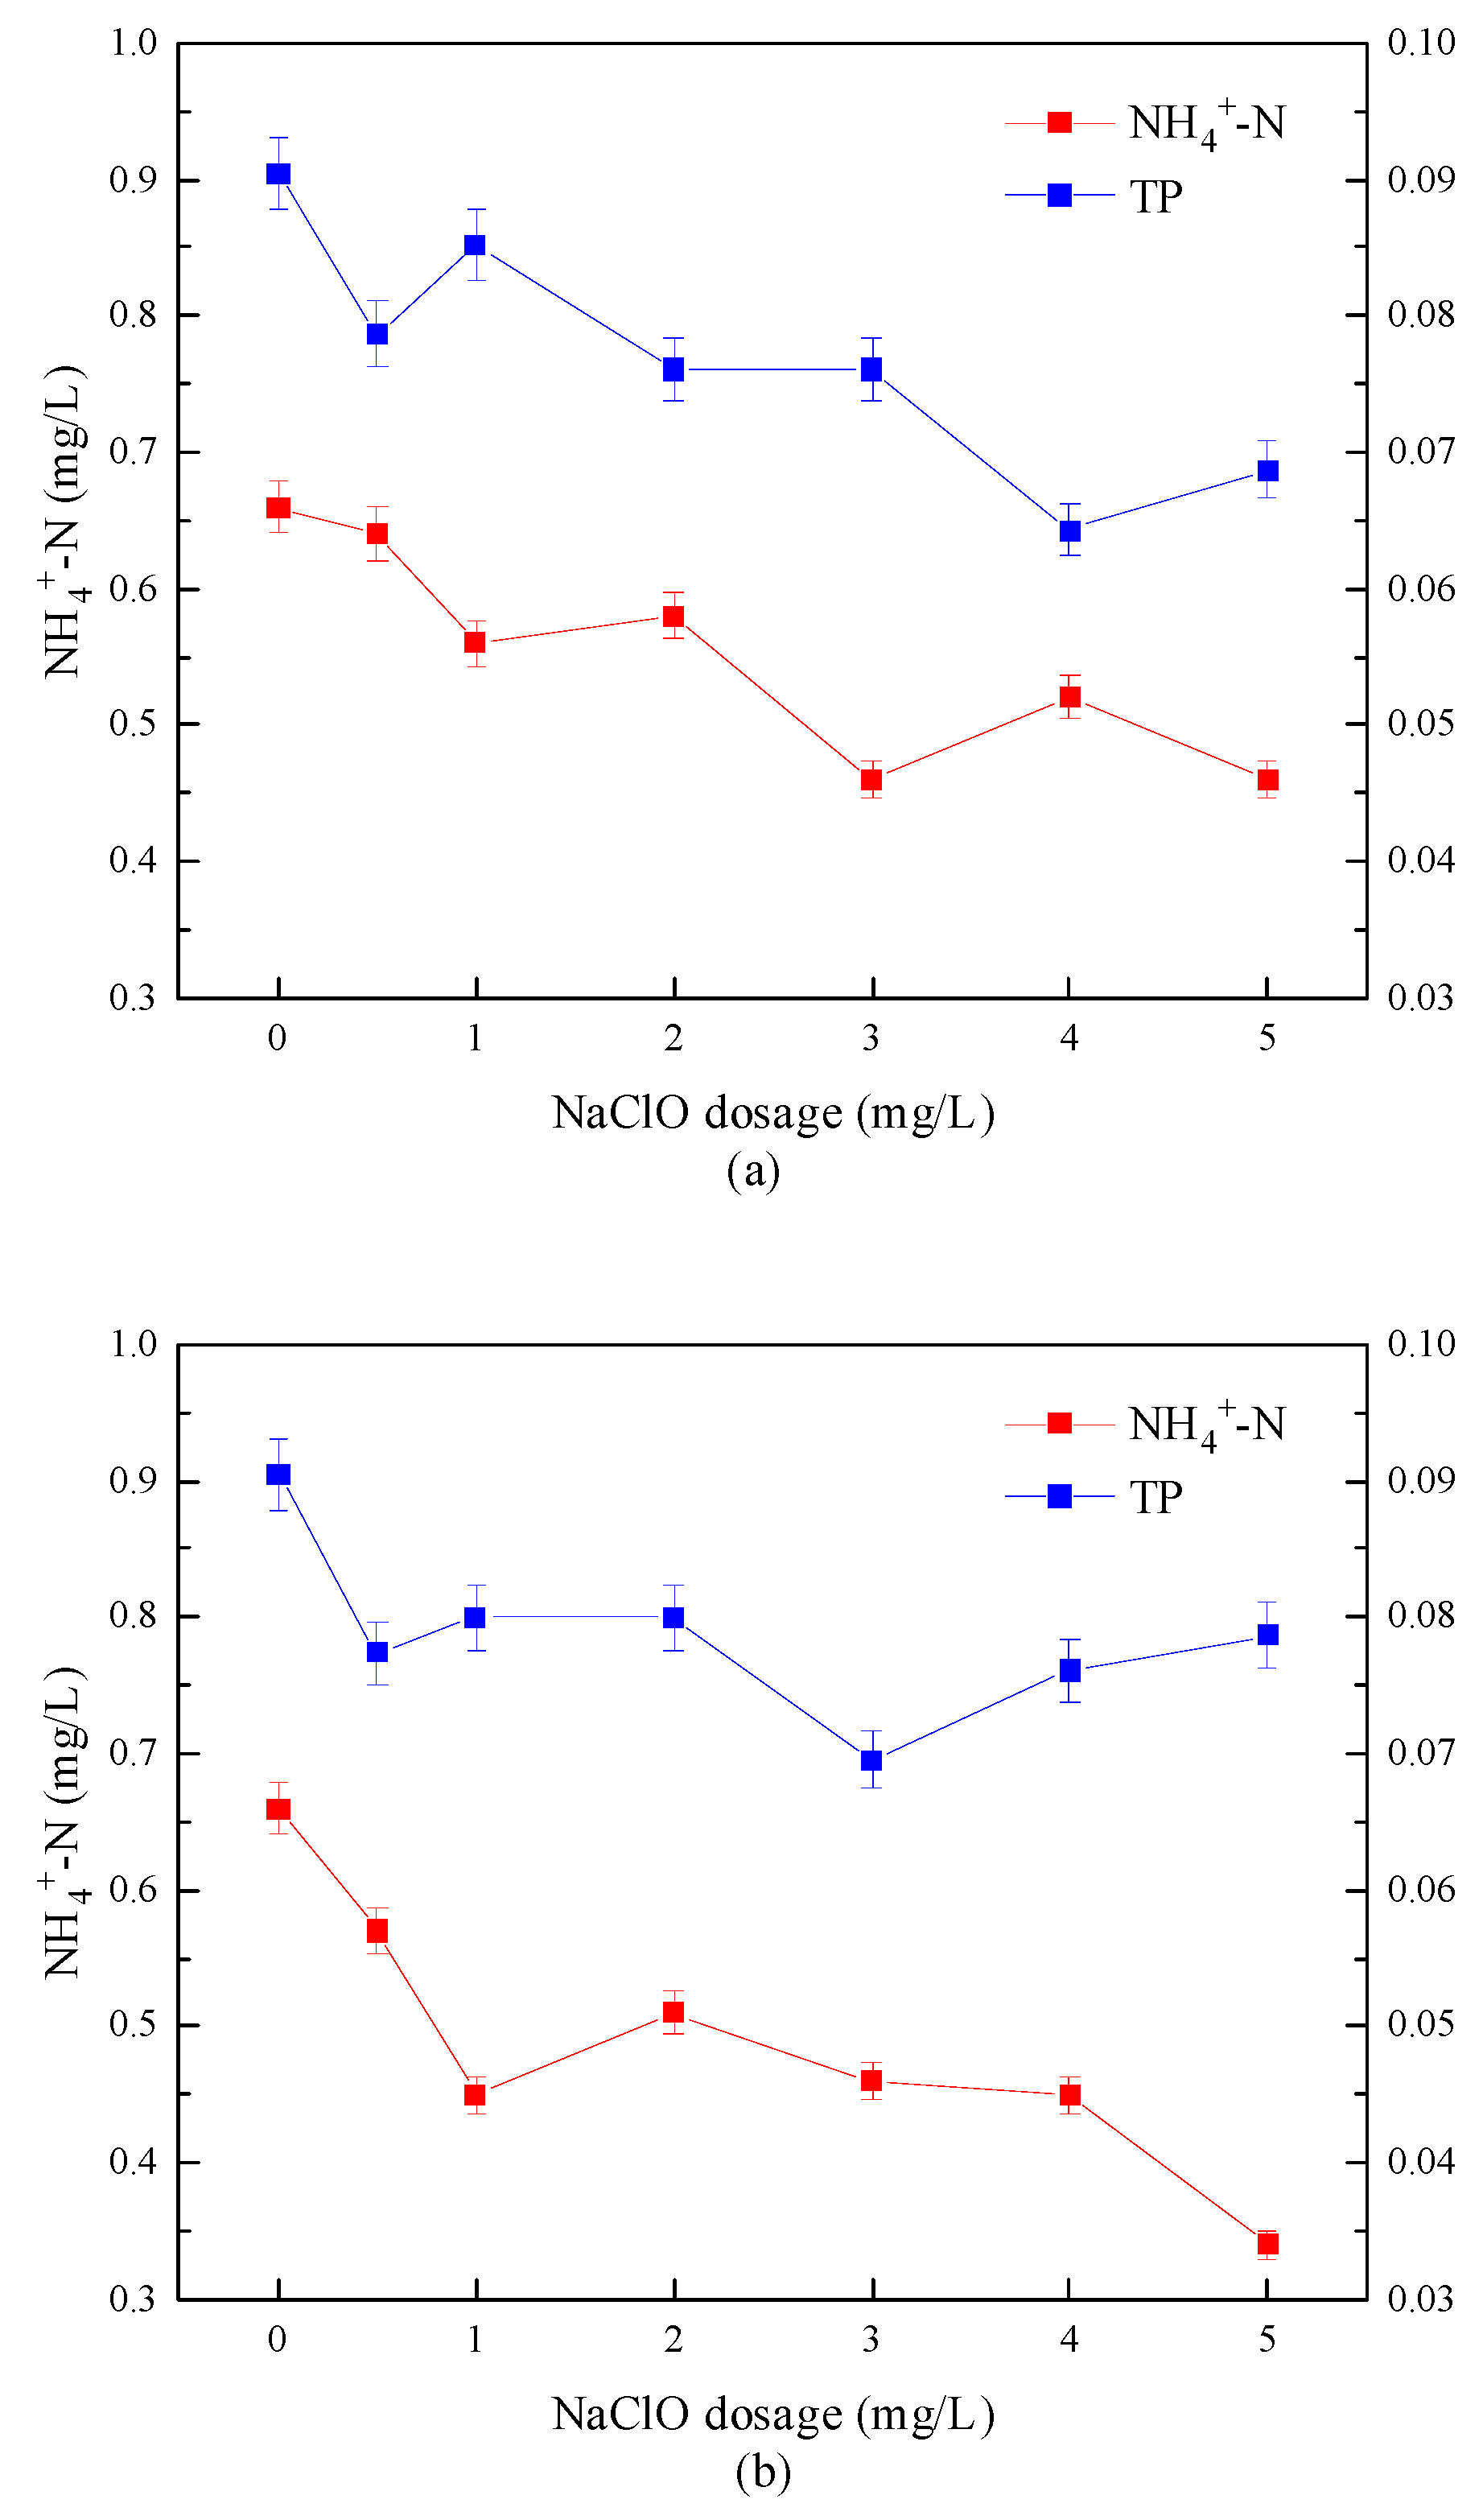
3.2.1. Changes in NH4+-N and TP

The removal effect of the combined disinfection method on NH4+-N and TP is shown in Figure 7. It can be seen from Figure 7 that after the combined disinfection treatment, the TP content in the water sample was between 0.06 and 0.09 mg/L, which was already at a low level and had not changed significantly, while the NH4+-N content had decreased. Among them, the removal rate of NH4+-N was 30.3% for “Method A”; the removal rate of NH4+-N was 48.5% for “Method B”. This showed that “Method B” showed a stronger NH4+-N removal ability than “Method A”. Gao, Z.C. et al. [30] believe that this was due to the process of simultaneous disinfection of UV and sodium hypochlorite. On the one hand, sodium hypochlorite converted NH4+-N in sewage into chloramine through a substitution reaction, and ultraviolet light effectively cracked the N-Cl bond of chloramine. See Equation (2) for the reaction process. On the other hand, the hydrolysate of sodium hypochlorite (HClO/ClO) generated hydroxyl radical (OH) and Cl and other reactive chlorine species (RCS) under ultraviolet irradiation, which is a new advanced oxidation process [22,23,24]. In this process, the generated ·OH and ·Cl reacted with NH4+-N to remove it from the water [31,32,33]. See Equations (3) and (4) for the reaction process.
NH2Cl + hv → NH2 + Cl
OH + NH3 → NH2 + H2O
Cl + NH3 → NH2 + H++ Cl

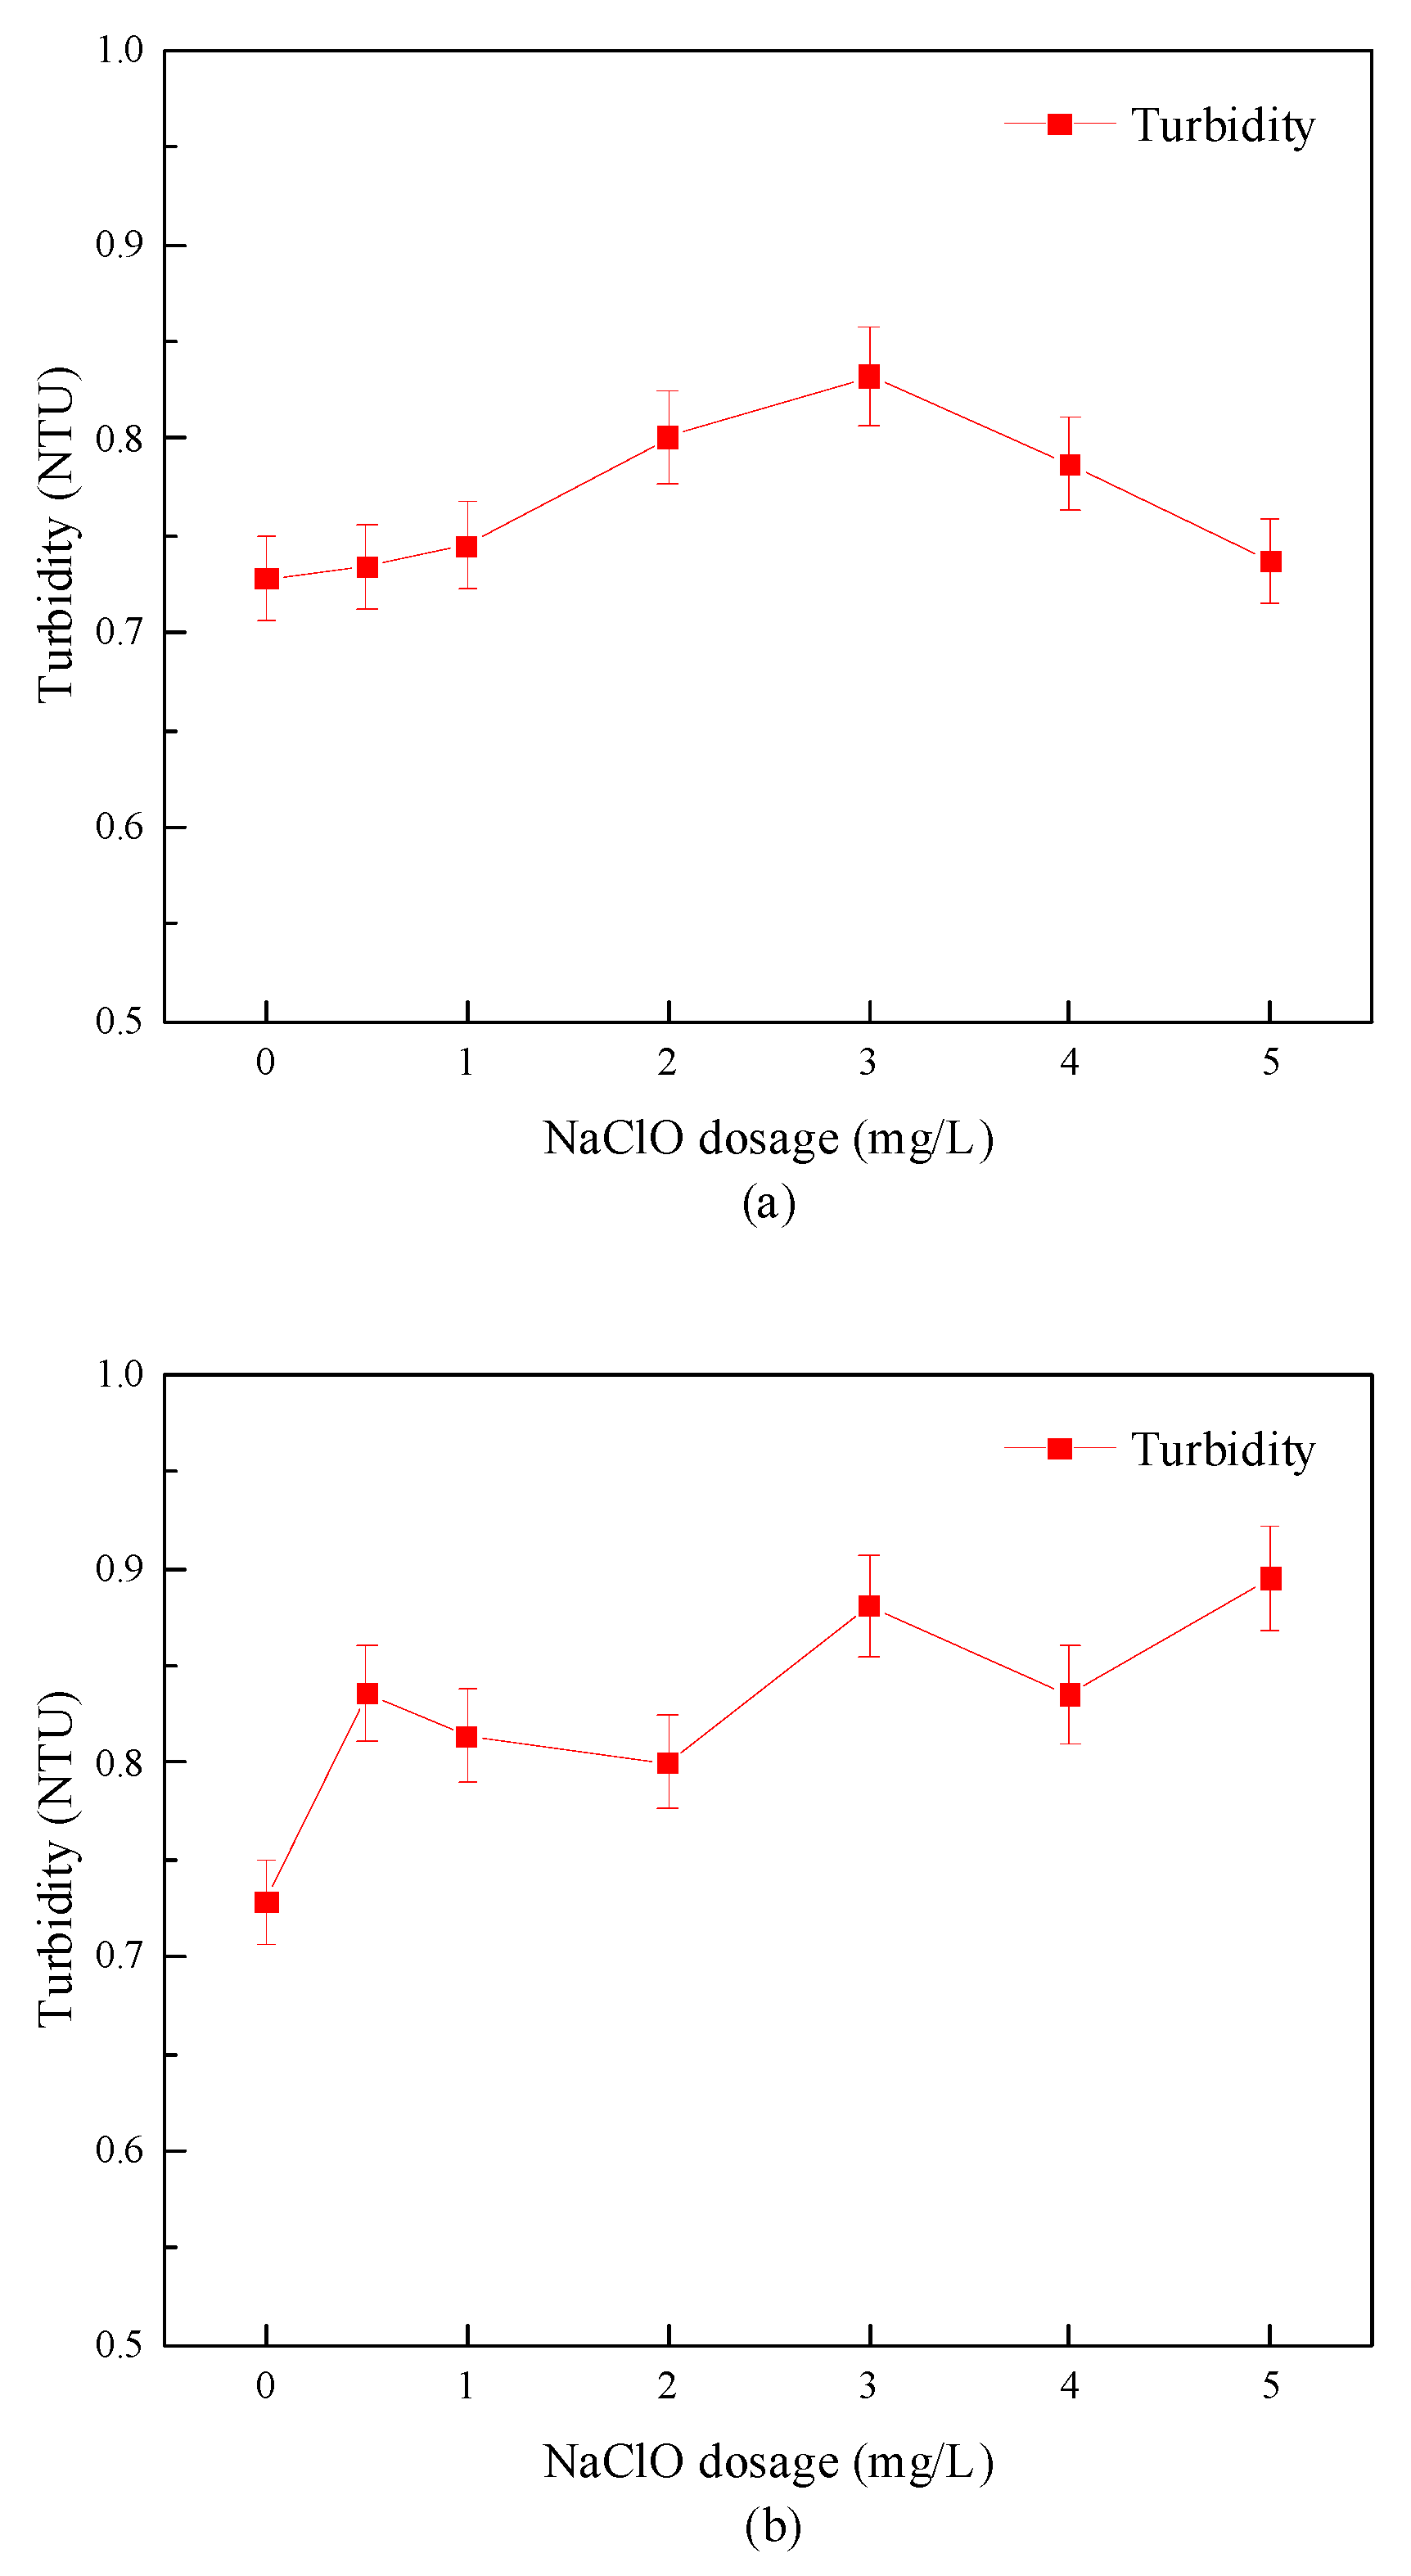
3.2.2. Change in Turbidity

Figure 8 shows the turbidity change of the sewage plant’s secondary effluent after combined disinfection treatment. The experimental results showed that “Method A” had little effect on the turbidity in water samples. However, the turbidity increased slightly with the increase in sodium hypochlorite dosage in “Method B”. The increase of turbidity may be that the strong oxidizing free radicals produced in the advanced oxidation process destroyed the pollutants in the water body, broke the larger particles in the sewage, and separated them into multiple smaller particles, which played a specific role in slime stripping. In addition, Zhao J. et al. [34] found that the shape, size, and refractive index of particulate matter in the water body and other factors affecting turbidity changed after disinfection, resulting in an increase in effluent turbidity after disinfection.

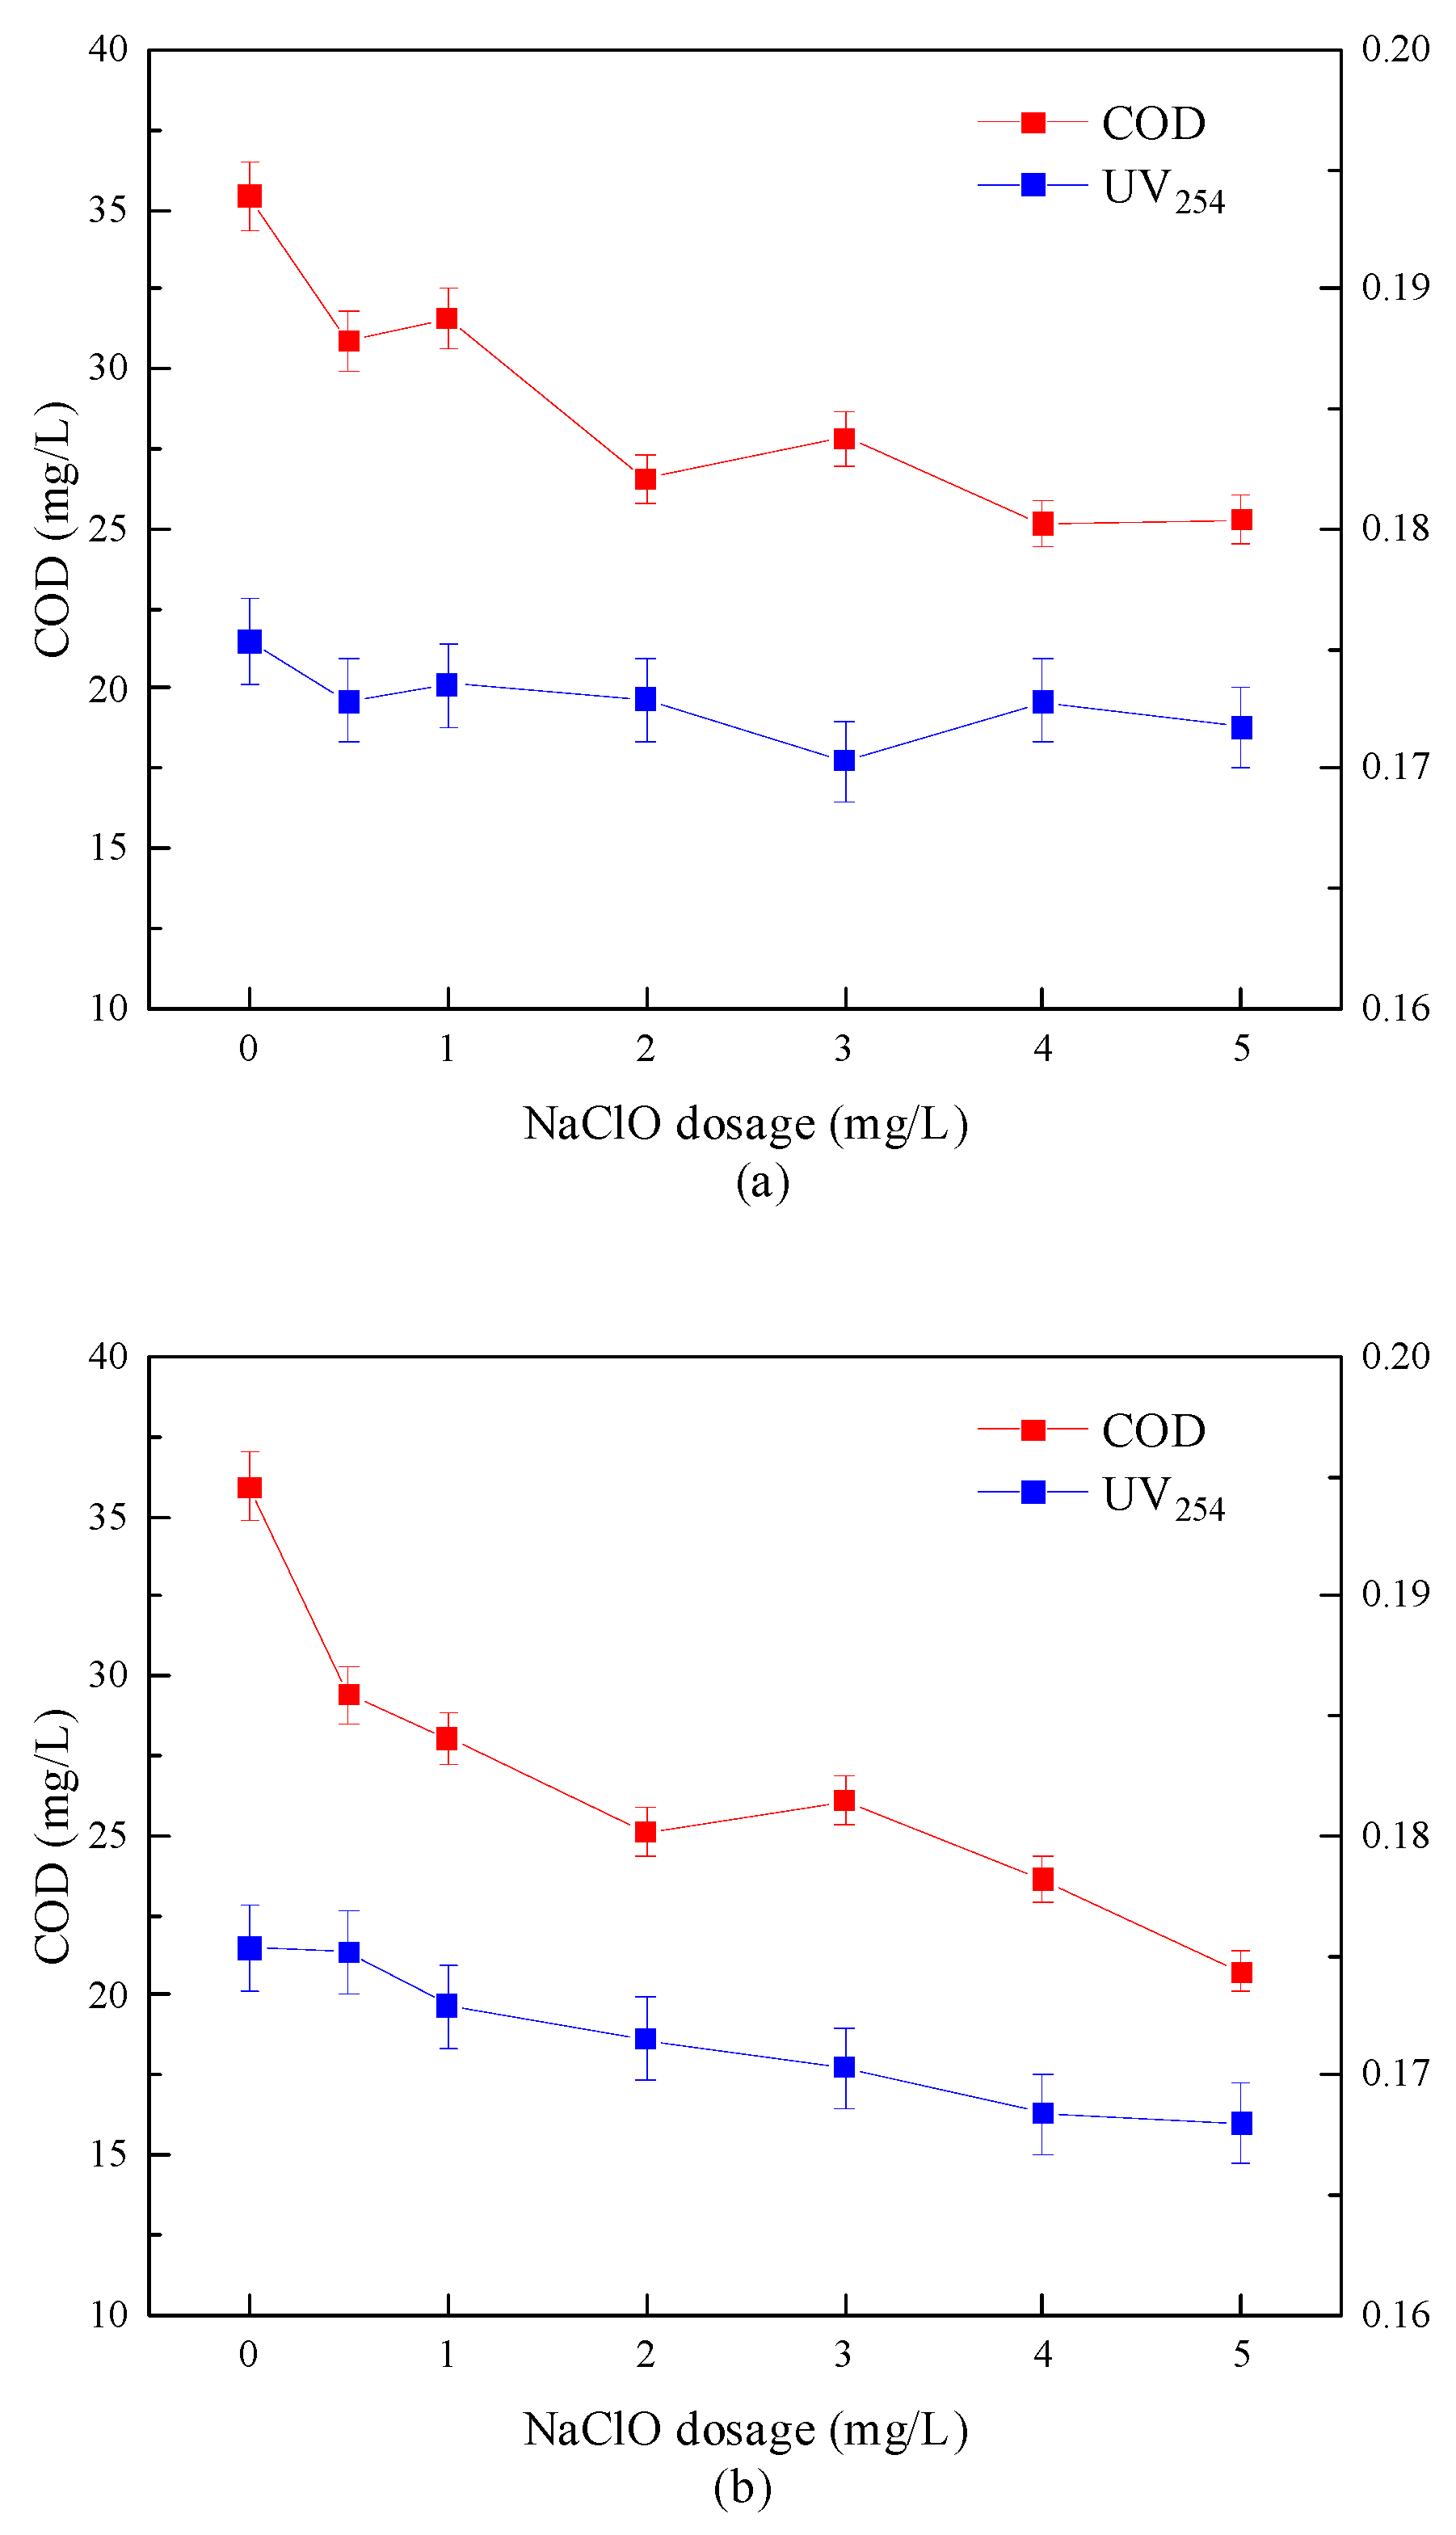
3.2.3. Changes in COD and UV254

The removal efficiency of the combined disinfection method on COD and UV254 is shown in Figure 9. The experimental results showed that COD in water samples decreased after combined disinfection treatment, but the removal effect of UV254 was not pronounced. When “Method A” was adopted, the COD was reduced from 35.42 to 25.30 mg/L, and the removal rate was 28.6%, UV254 decreased from 0.175 to 0.172 cm−1, and the removal rate was only 1.7%. When using “Method B”, the removal rate of COD reached 42.2%, and the removal rate of UV254 could be increased to 4%. This showed that the removal effect of “Method B” on COD and UV254 was more significant than that of “Method A”.
Buchanan W. et al. [35] pointed out that the oxidative degradation of organic matter by sodium hypochlorite and the decomposition of some small molecular organic matter by ultraviolet energy only changed the structure of organic matter and could not mineralize organic matter into CO2 and completely remove it from the water body. However, Wang C. et al. [36] found in the study that, when UV and sodium hypochlorite were applied at the same time, due to the strong free radical activity produced by the advanced oxidation process, the macromolecular organic matter with a complex structure gradually decomposed into small molecular acids and finally transformed into CO2 and discharged into the water body.

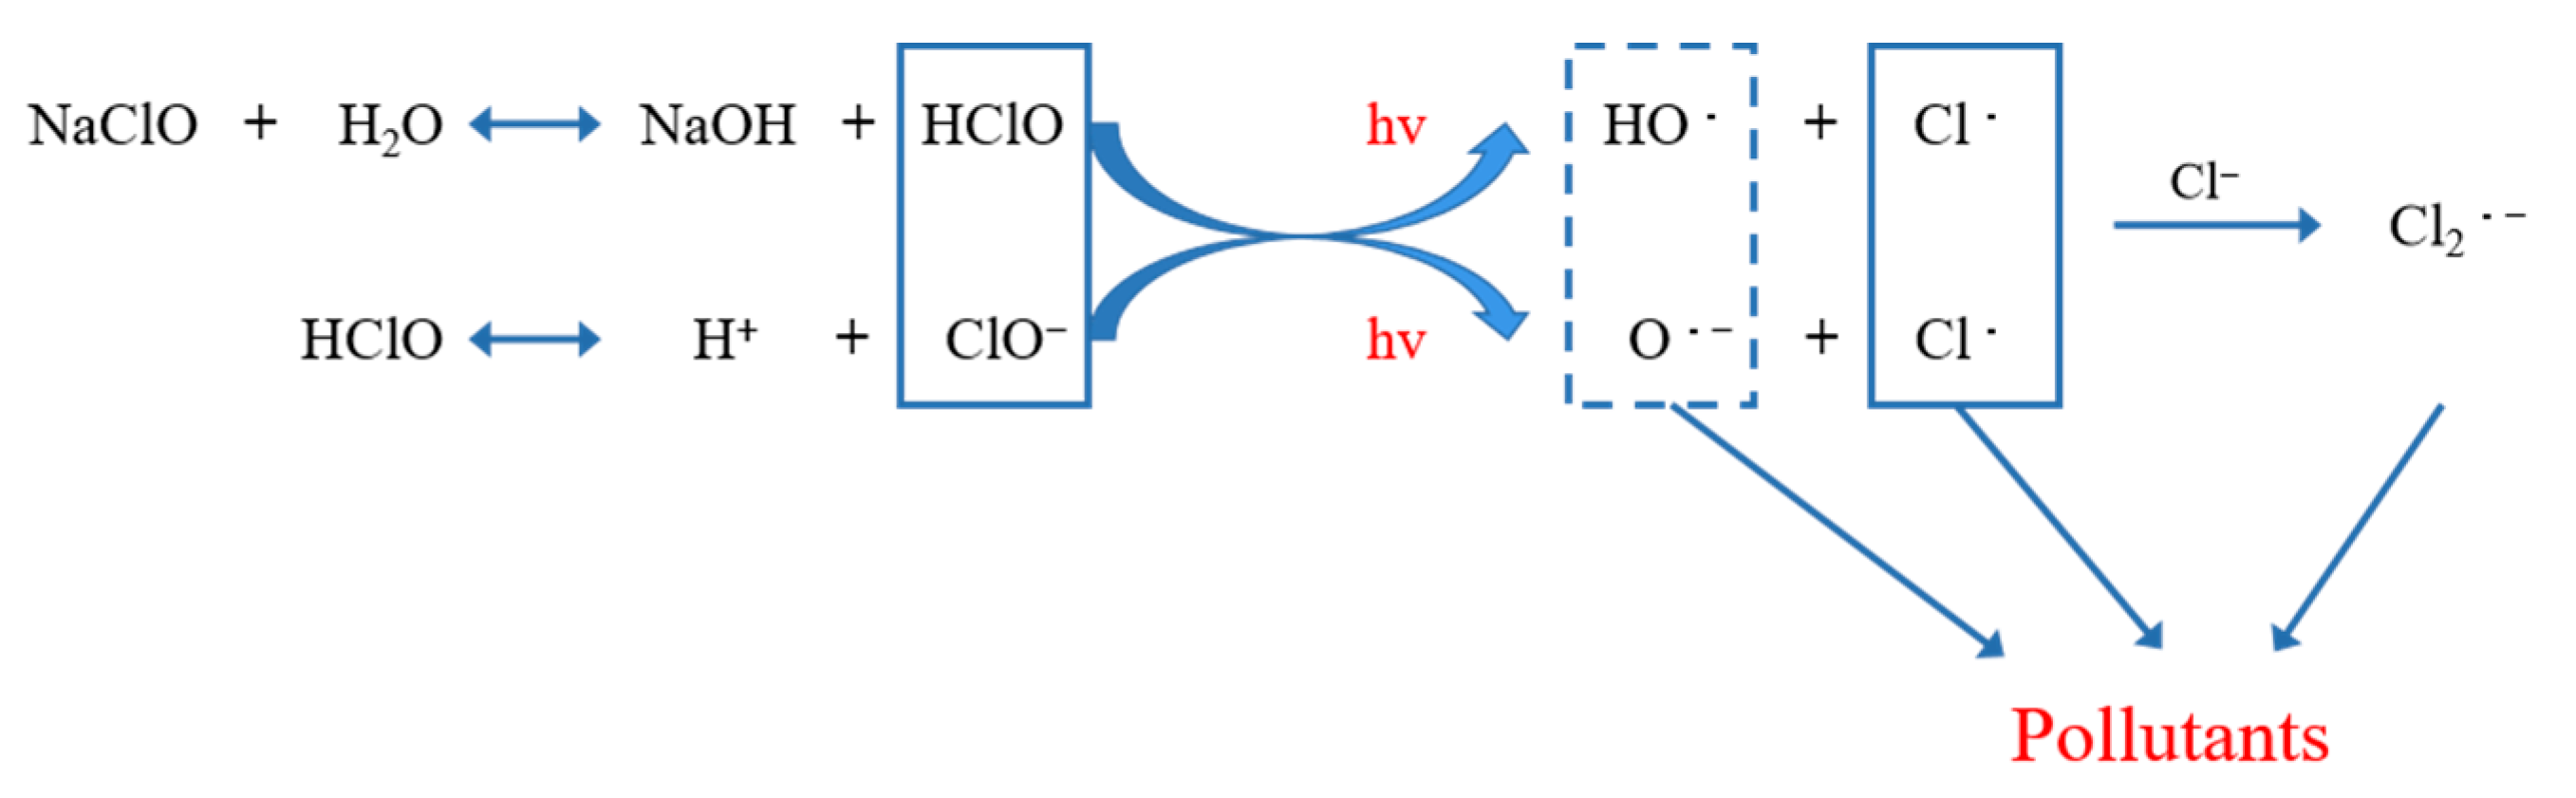
3.3. Influencing Factors of Disinfection Effect of Different Disinfection Methods

3.3.1. Effect of Temperature

The influence of temperature on the sterilization effect of “Method A” and “Method B” is shown in Figure 10 and Figure 11, respectively. It can be seen from Figure 10 and Figure 11 that under the same UV dose, sodium hypochlorite dosage, and contact reaction time conditions, the inactivation effect of “Method A” on fecal coliform was basically not affected by the temperature change. As the water temperature increased from 7 °C to 35 °C, the measured number of fecal coliform in effluent decreased from 3.5 × 10³ CFU/L to 3.1 × 10³ CFU/L, and the logarithmic inactivation rate remained stable above 1.8-lg. On the contrary, when using “Method B”, in rising water temperature, the number of fecal coliforms decreased from 4.2 × 10³ CFU/L to 3.2 × 10³ CFU/L, and the changing trend of the logarithmic inactivation rate was not as stable as that of “Method A”. In general, under the same temperature trend, the inactivation effect of “Method A” was always better than that of “Method B”, and the inactivation effect was the best when the temperature was in the range of 14–28 °C.

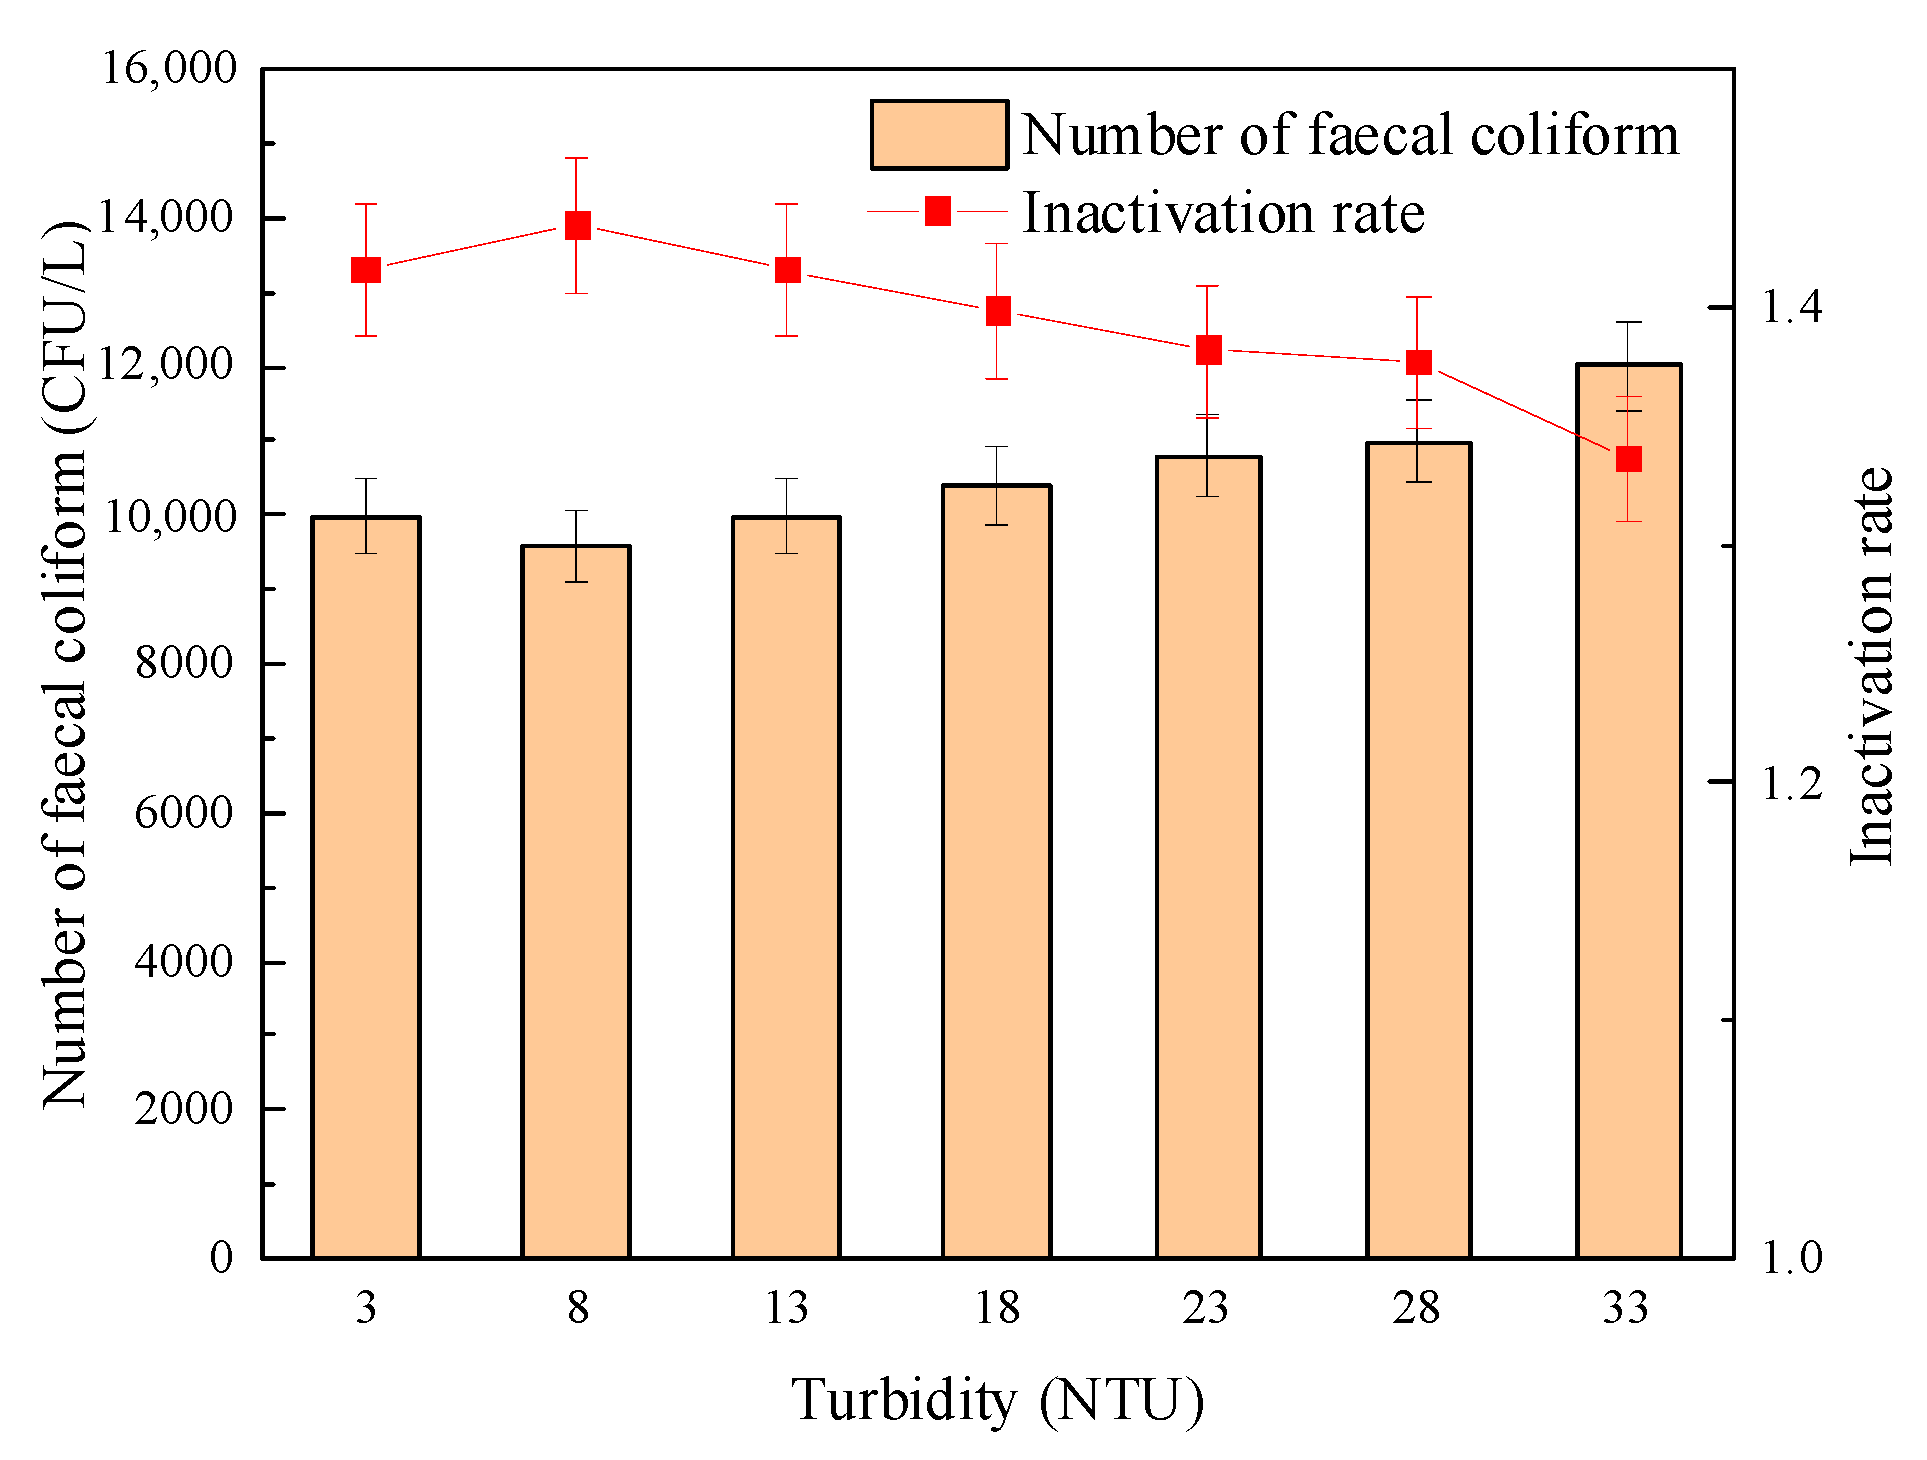
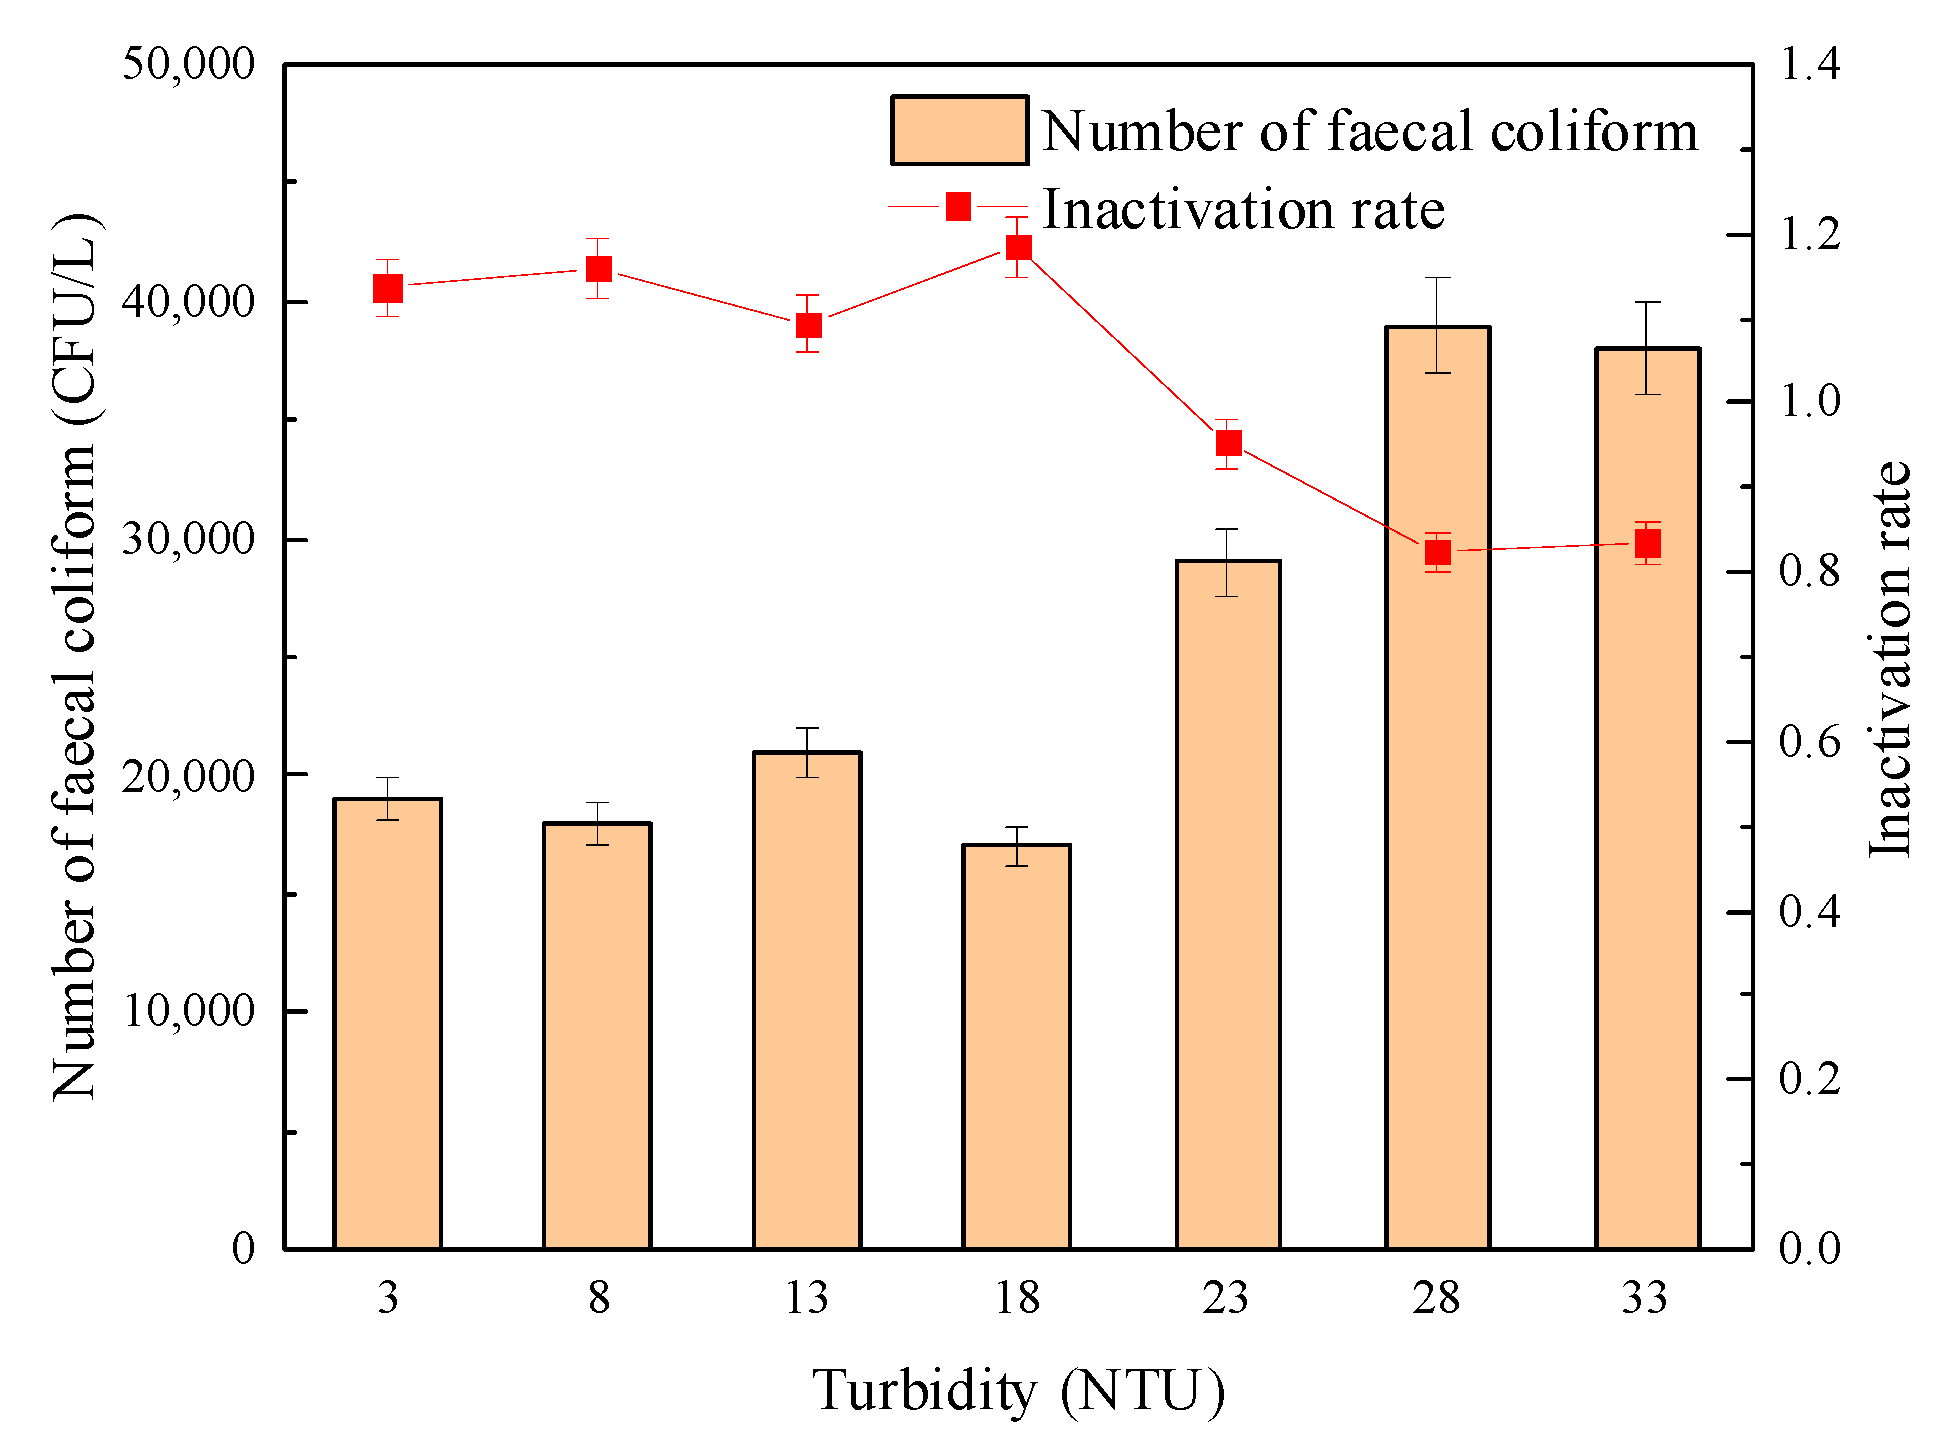
3.3.2. The Effect of Turbidity

Figure 12 and Figure 13 show the effect of turbidity on the sterilization effect of “Method A” and “Method B”, respectively. The experimental results showed that in the process of increasing turbidity, when “Method A” was adopted, the number of fecal coliforms in effluent increased slowly, and the logarithmic inactivation rate decreased but remained at about 1.4-lg. When using “Method B”, the logarithmic inactivation rate of fecal coliform did not change significantly when the turbidity was ≤ 18 NTU and remained at about 1.18-lg. When the turbidity was greater than 18 NTU, the number of fecal coliform bacteria increased significantly, and the logarithmic inactivation rate decreased to 0.84-lg when the turbidity increased to 33 NTU. However, the influence of turbidity on its germicidal effect was significantly weaker than that of single group UV disinfection. The results showed that the combined disinfection method weakened the influence of turbidity on the inactivation effect of fecal coliform bacteria and improved the safety of effluent microbial indicators.
This is similar to the research conclusion of Yang, J.C. [37], who found that with the increase in turbidity, the number of fecal coliform bacteria increased from several hundred per liter to several thousand per liter during ultraviolet disinfection alone. However, the fecal coliform population in the combined disinfection effluent remained relatively stable, and turbidity did not significantly affect the sterilization effect. Meanwhile, Zhao J.C. et al. [38] believe that the combined disinfection synergistic effect with ultraviolet and sodium hypochlorite and the sterilization effect was more significant than single disinfection.

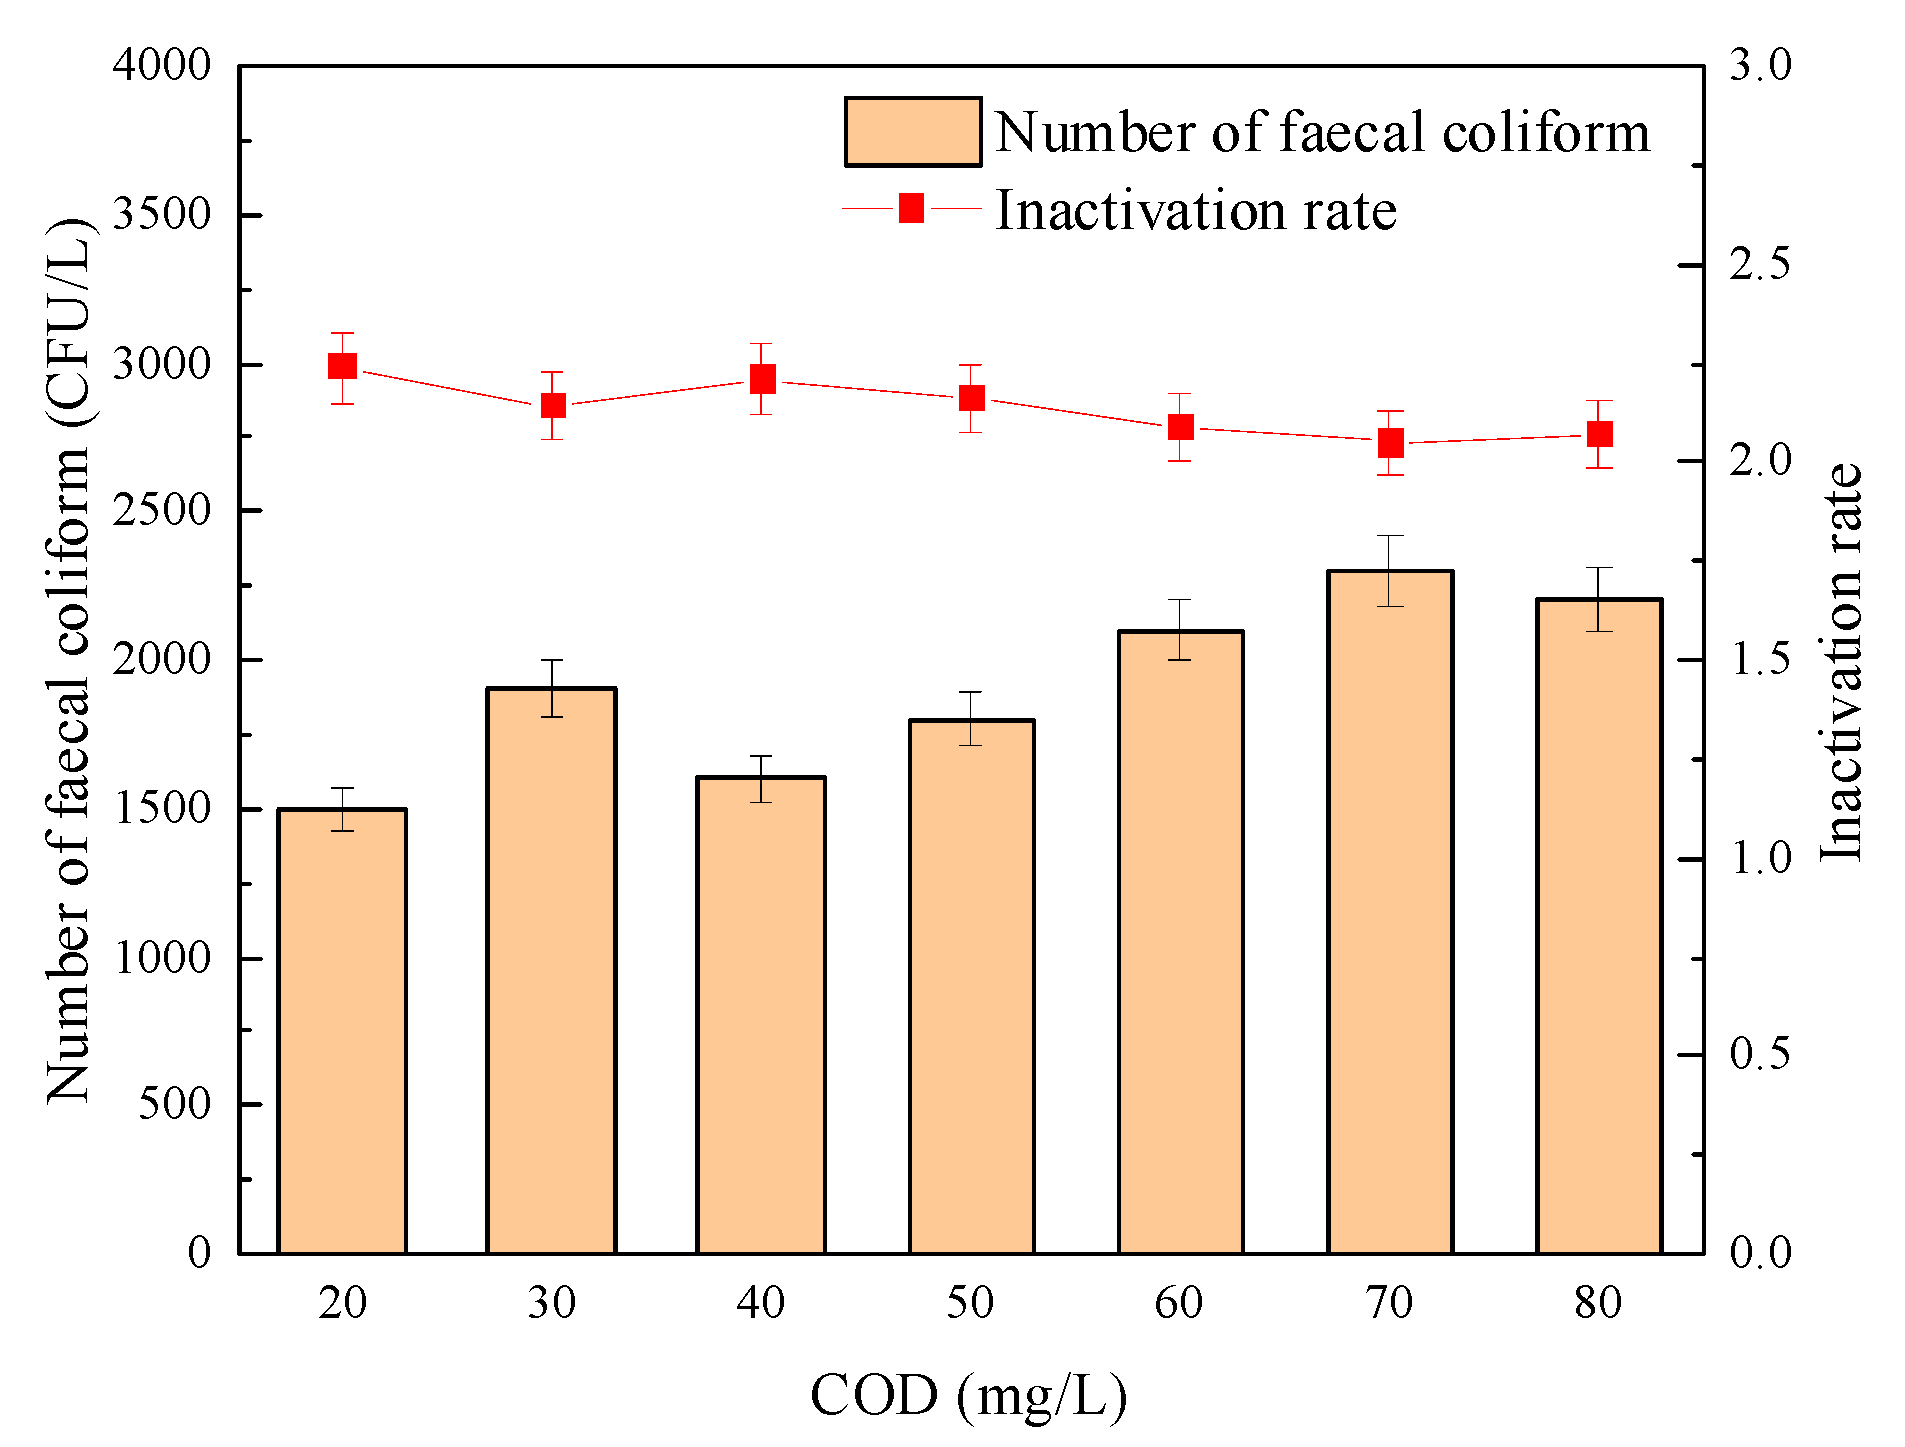
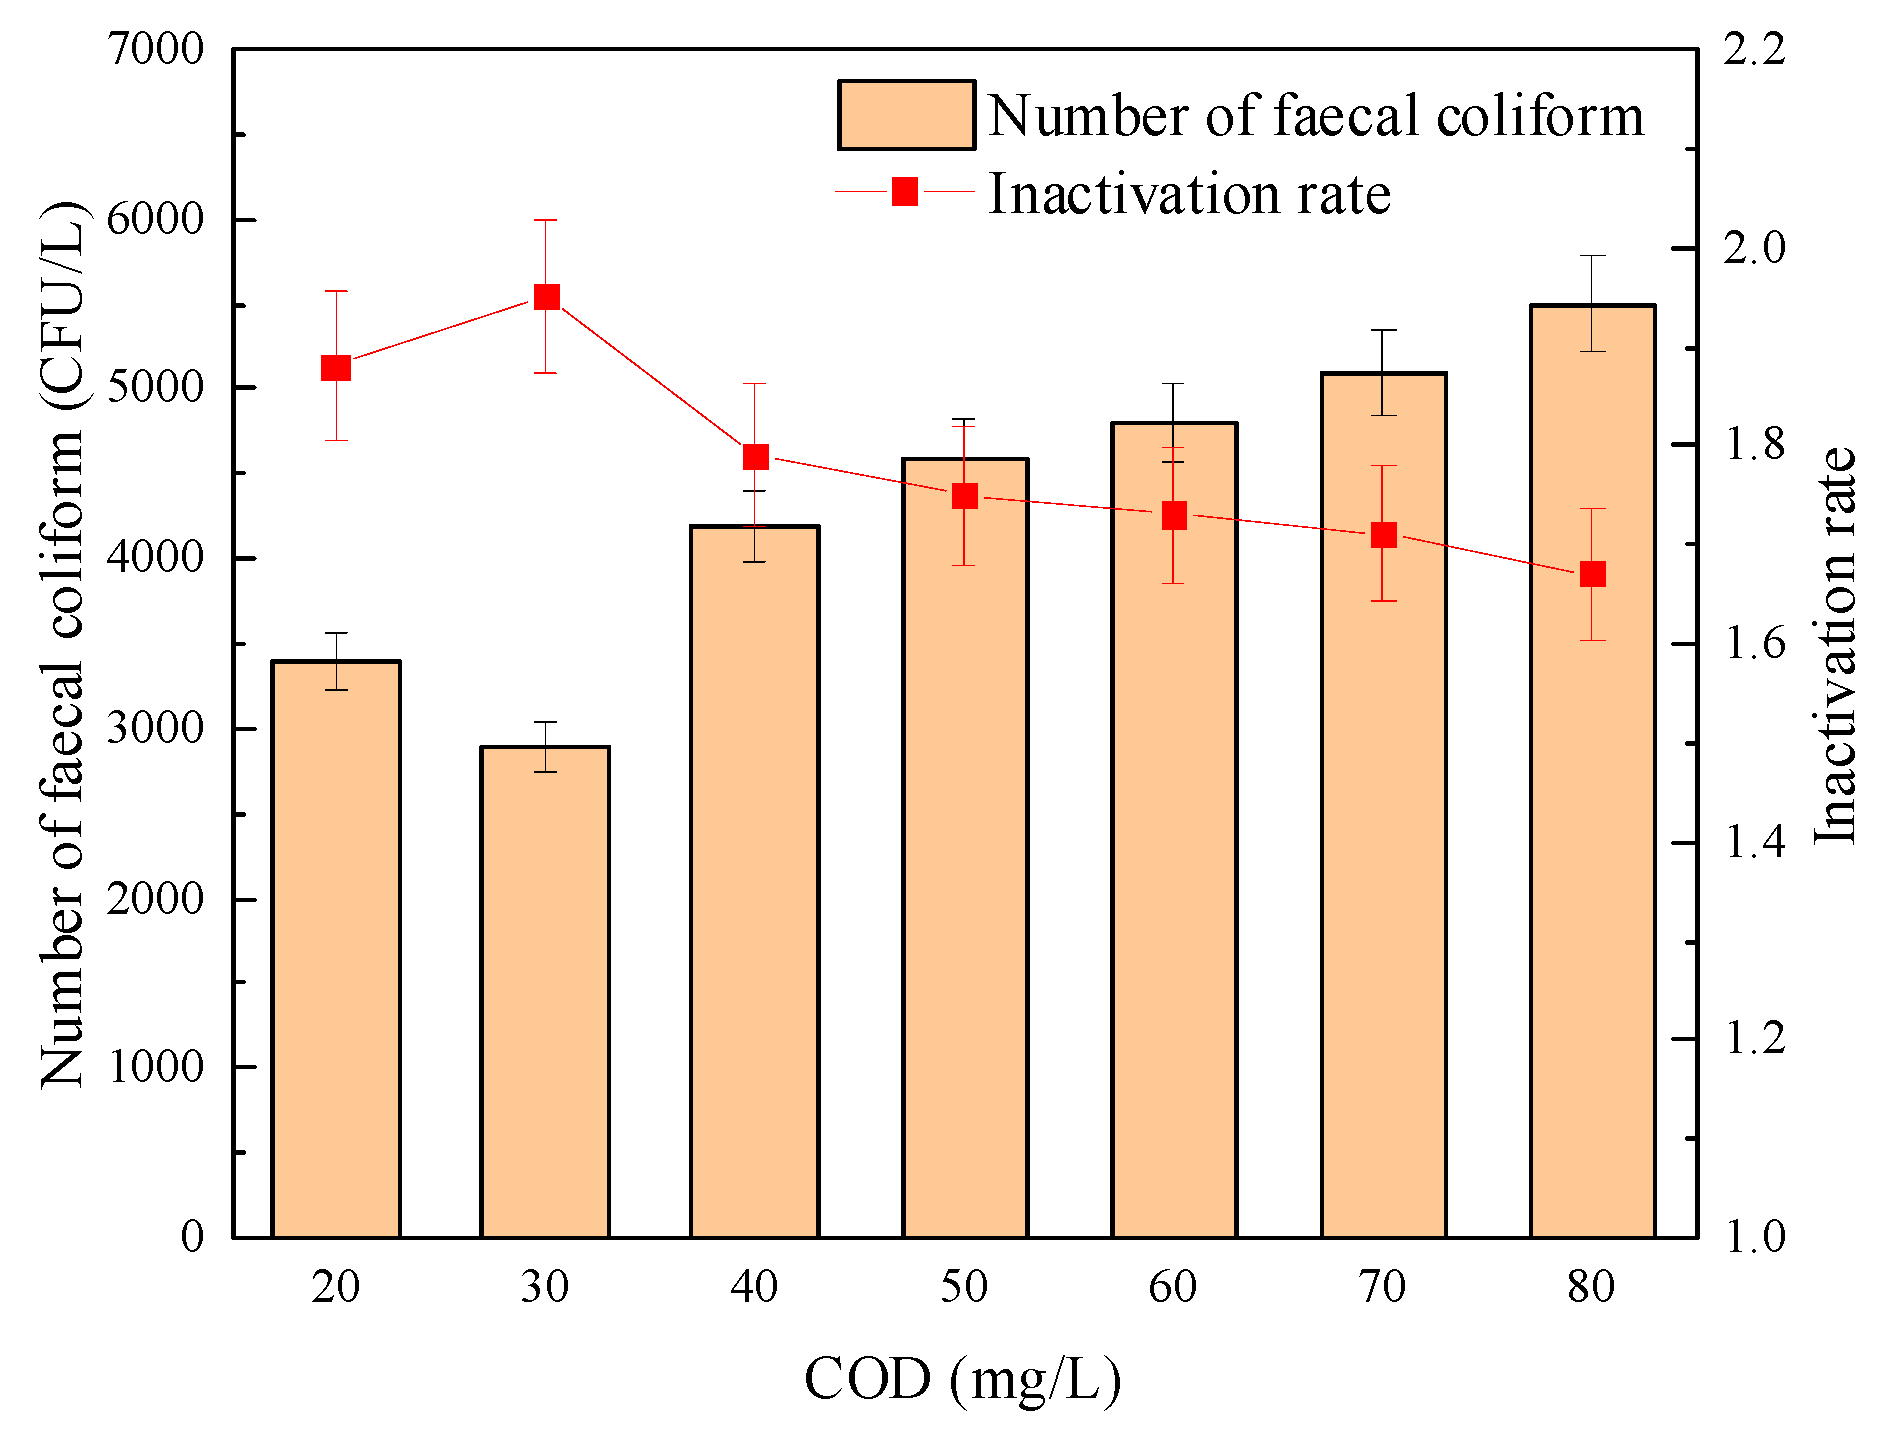
3.3.3. Influence of COD Load

The influence of COD load on the sterilization effect of “Method A” and “Method B” is shown in Figure 14 and Figure 15, respectively. It can be seen from Figure 14 and Figure 15 that the inactivation effect of combined disinfection on the fecal coliform group showed an inevitable downward trend with the continuous increase of COD load. Among them, the logarithmic inactivation rate of fecal coliform reached more than 2.0-lg when the disinfection method of “Method A” was adopted. However, when “Method B” was adopted, the changing trend of the logarithmic inactivation rate of fecal coliform was less stable than that of “Method A”. For example, when the COD load increased from 20 mg/L to 80 mg/L, the logarithmic inactivation rate decreased from 1.79-lg to 1.67-lg.
Furthermore, Meng, X.X. [39] found during the experiment that with the increase of COD load, after UV disinfection alone, the number of coliform bacteria in the effluent fecal could no longer meet the requirements of the first-class B standard, that is, 104 CFU/L. However, the sterilization effect of the combined disinfection method was not significantly affected by the COD load, and the logarithmic inactivation rate could be maintained above 5.5-lg. Therefore, even if the COD load increases due to the water quality fluctuation, the number of fecal coliforms in the effluent can be kept relatively stable when using “Method A”, effectively overcoming the defect that the sterilization effect of “Method B” is easily affected by the COD load in the effluent.

4. Conclusions

In this study, the combined process of ultraviolet light and sodium hypochlorite was used to disinfect the secondary effluent of the sewage treatment plant. It was concluded that under the condition that the fecal coliform index met the requirements of the first-class A emission standard and when the UV dose was constant, “Method A” needed less sodium hypochlorite to be added than “Method B”, the required reaction time was shorter, and the economic benefits were higher. The recovery rate of effluent fecal coliform after disinfection in “Method A” was significantly lower than that in “Method B”. “Method A” was more stable than “Method B” when the inlet water temperature, turbidity, and COD load changed. At the same time, after treatment by two disinfection methods, the concentration of pollutants in the effluent met the requirements of the first-level A emission standard. The removal effect of “Method B” on NH4+-N, COD load, and UV254 was further improved than that of “Method A” disinfection, but it will cause a slight increase in effluent turbidity. It can be seen that “Method A” disinfection had more advantages than “Method B” in microbial inactivation, inhibition of photoreactivation of fecal coliform bacteria, and resistance to water quality impact.
The research on the disinfection effect of secondary effluent of sewage treatment plants based on the combined disinfection process of ultraviolet and sodium hypochlorite involves many theories, methods, and technologies. There are still many other challenges to be solved, which should be continuously accumulated and improved in practical application. Further research and development are needed in the following two aspects: one is to further study the formation of disinfection by-products after combined disinfection; the other is to build a disinfection reaction kinetic model and use this model to explain the synergistic disinfection effect of ultraviolet and sodium hypochlorite.

Author Contributions

Conceptualisation, H.L.; methodology, X.L.; software, X.W.; validation, X.L.; formal analysis, X.L.; investigation, X.L. and X.W.; resources, H.L.; data curation, X.W.; writing—original draft preparation, H.L.; writing—review and editing, X.L.; visualization, H.L.; supervision, H.L.; project administration, H.L. and X.Z.; funding acquisition, H.L. and X.Z. All authors have read and agreed to the published version of the manuscript.

Funding

This work was supported by the National Natural Science Foundation of China (No. 52070087), the Special Fund Project for Industrial Innovation of Jilin Province, China (No. 2018c004-4), the Education Department of Jilin Province (No. JJKH20220278KJ), and the Key R&D Program of Department of Science and Technology of Jilin Province (No. 20200403007SF).

Institutional Review Board Statement

Not applicable.

Informed Consent Statement

Not applicable.

Data Availability Statement

Not applicable.

Conflicts of Interest

The authors declare no conflict of interest.

References

  1. Zhang, C.M.; Xu, L.M.; Xu, P.C.; Wang, X.C. Elimination of viruses from domestic wastewater: Requirements and technologies. World J. Microb. Biot. 2016, 32, 69. [Google Scholar] [CrossRef] [PubMed]
  2. Schellenberg, T.; Subramanian, V.; Ganeshan, G.; Tompkins, D.; Pradeep, R. Wastewater discharge standards in the evolving context of urban sustainability—The case of India. Front. Environ. Sci. 2020, 8, 30. [Google Scholar] [CrossRef]
  3. Shekhawat, S.S.; Kulshreshtha, N.M.; Vivekanand, V.; Gupta, A.B. Impact of combined chlorine and UV technology on the bacterial diversity, antibiotic resistance genes and disinfection by-products in treated sewage. Bioresour. Technol. 2021, 339, 125615. [Google Scholar] [CrossRef] [PubMed]
  4. Li, X.; Cai, M.; Wang, L.; Niu, F.; Yang, D.; Zhang, G. Evaluation survey of microbial disinfection methods in UV-LED water treatment systems. Sci. Total Environ. 2019, 659, 1415–1427. [Google Scholar] [CrossRef] [PubMed]
  5. Wang, J.; Shen, J.; Ye, D.; Yan, X.; Zhang, Y.; Yang, W.; Li, X.; Wang, J.; Zhang, L.; Pan, L. Disinfection technology of hospital wastes and wastewater: Suggestions for disinfection strategy during coronavirus Disease 2019 (COVID-19) pandemic in China. Environ. Pollut. 2020, 262, 114665. [Google Scholar] [CrossRef] [PubMed]
  6. Wei, F.Q.; Lu, Y.; Shi, Q.; Chen, Z.; Li, K.X.; Zhang, T.; Shi, Y.L.; Xu, Q.; Hu, H.Y. A dose optimisation method of disinfection units and synergistic effects of combined disinfection in pilot tests. Water Res. 2022, 211, 118037. [Google Scholar] [CrossRef]
  7. Chai, Q.; Hu, A.; Qian, Y.; Ao, X.; Liu, W.; Yang, H.; Xie, Y.F. A comparison of genotoxicity change in reclaimed wastewater from different disinfection processes. Chemosphere 2018, 191, 335–341. [Google Scholar] [CrossRef]
  8. Zhong, Y.; Gan, W.; Du, Y.; Huang, H.; Wu, Q.; Xiang, Y.; Shang, C.; Yang, X. Disinfection by-products and their toxicity in wastewater effluents treated by the mixing oxidant of ClO2/Cl2. Water Res. 2019, 162, 471–481. [Google Scholar] [CrossRef]
  9. Albolafio, S.; Marín, A.; Allende, A.; García, F.; Simón-Andreu, P.J.; Soler, M.A.; Gil, M.I. Strategies for mitigating chlorinated disinfection by-products in wastewater treatment plants. Chemosphere 2022, 288, 132583. [Google Scholar] [CrossRef]
  10. Sun, X.; Chen, M.; Wei, D.; Du, Y. Research progress of disinfection and disinfection by-products in China. J. Environ. Sci. 2019, 81, 52–67. [Google Scholar] [CrossRef]
  11. Du, Y.; Lv, X.T.; Wu, Q.Y.; Zhang, D.Y.; Zhou, Y.T.; Peng, L.; Hu, H.Y. Formation and control of disinfection by-products and toxicity during reclaimed water chlorination: A review. J. Environ. Sci. 2017, 58, 51–63. [Google Scholar] [CrossRef] [PubMed]
  12. Zhou, X.; Zhao, J.; Li, Z.; Song, J.; Li, X.; Yang, X.; Wang, D. Enhancement effects of ultrasound on secondary wastewater effluent disinfection by sodium hypochlorite and disinfection by-products analysis. Ultrason. Sonochem. 2016, 29, 60–66. [Google Scholar] [CrossRef]
  13. Fitzhenry, K.; Clifford, E.; Rowan, N.; Del Rio, A.V. Bacterial inactivation, photoreactivation and dark repair post flow-through pulsed UV disinfection. J. Water Process Eng. 2021, 41, 102070. [Google Scholar] [CrossRef]
  14. Li, G.Q.; Wang, W.L.; Huo, Z.Y.; Lu, Y.; Hu, H.Y. Comparison of UV-LED and low pressure UV for water disinfection: Photoreactivation and dark repair of Escherichia Coli. Water Res. 2017, 126, 134–143. [Google Scholar] [CrossRef] [PubMed]
  15. Song, K.; Mohseni, M.; Taghipour, F. Mechanisms investigation on bacterial inactivation through combinations of UV wavelengths. Water Res. 2019, 163, 114875. [Google Scholar] [CrossRef]
  16. Shi, Q.; Chen, Z.; Liu, H.; Lu, Y.; Li, K.X.; Shi, Y.L.; Mao, Y.; Hu, H.Y. Efficient synergistic disinfection by ozone, ultraviolet irradiation and chlorine in secondary effluents. Sci. Total Environ. 2021, 758, 143641. [Google Scholar] [CrossRef]
  17. Li, G.Q.; Huo, Z.Y.; Wu, Q.Y.; Lu, Y.; Hu, H.Y. Synergistic effect of combined UV-LED and chlorine treatment on Bacillus subtilis spore inactivation. Sci. Total Environ. 2018, 639, 1233–1240. [Google Scholar] [CrossRef]
  18. Ha, J.H.; Ha, S.D. Synergistic effects of sodium hypochlorite and ultraviolet radiation in reducing the levels of selected foodborne pathogenic bacteria. Foodborne Pathog. Dis. 2011, 8, 587–591. [Google Scholar] [CrossRef]
  19. Chaúque, B.J.; Rott, M.B. Photolysis of sodium chloride and sodium hypochlorite by ultraviolet light inactivates the trophozoites and cysts of Acanthamoeba castellanii in the water matrix. J. Water Health 2021, 19, 190–202. [Google Scholar] [CrossRef]
  20. Bolton, J.R.; Linden, K.G. Standardization of methods for fluence (UV dose) determination in bench-scale UV experiments. J. Environ. Eng. 2003, 129, 209–215. [Google Scholar] [CrossRef]
  21. Liu, S.L.; Tang, Y.L. Solutions of Common Problems and Development Trends of Ultraviolet Disinfection in Wastewater Treatment Plant. China Water Wastewater 2017, 33, 24–28. (In Chinese) [Google Scholar]
  22. Dong, H.; Qiang, Z.; Hu, J.; Qu, J. Degradation of chloramphenicol by UV/chlorine treatment: Kinetics, mechanism and enhanced formation of halonitromethanes. Water Res. 2017, 121, 178–185. [Google Scholar] [CrossRef] [PubMed]
  23. Pan, Y.; Cheng, S.; Yang, X.; Ren, J.; Fang, J.; Shang, C.; Song, W.; Lian, L.; Zhang, X. UV/chlorine treatment of carbamazepine: Transformation products and their formation kinetics. Water Res. 2017, 116, 254–265. [Google Scholar] [CrossRef] [PubMed]
  24. Xiang, Y.; Fang, J.; Shang, C. Kinetics and pathways of ibuprofen degradation by the UV/chlorine advanced oxidation process. Water Res. 2016, 90, 301–308. [Google Scholar] [CrossRef]
  25. Fang, J.; Fu, Y.; Shang, C. The roles of reactive species in micropollutant degradation in the UV/free chlorine system. Environ. Sci. Technol. 2014, 48, 1859–1868. [Google Scholar] [CrossRef]
  26. Liang, Y.Q.; Liu, H.L.; Cui, K.P.; Chen, Y.H.; Guo, Z.; Chen, X. Tracing and regression of dissolved organic matter in wastewater from industrial park based on 3D-fluorescence spectrum-parallel factor analysis. Chin. J. Environ. Eng. 2022, 16, 1238–1247. (In Chinese) [Google Scholar]
  27. Jiang, H.; Zhang, T.X.; Yang, F.; Ma, Y.F. Characteristics of fluorescence and ultraviolet spectra during domestic wastewater treatment process. Environ. Sci. Technol. 2019, 42, 151–156. (In Chinese) [Google Scholar]
  28. Zhang, T.Y.; Wei, H.J.; Yao, J.; Chen, G.; Xu, B. Comparison of Disinfection Efficiency of Different UV /Chlorination Combined Processes in Wastewater Treatment Plant. China Water Wastewater 2021, 37, 19–24. (In Chinese) [Google Scholar]
  29. Guo, M.T.; Hu, H.Y.; Liu, W.J. Effect of photoreactivating light intensity on photoreactivation of Escherichia coli and Fecal Coliform in the tertiary effluent disinfected by UV. Environ. Sci. 2008, 29, 2576–2579. (In Chinese) [Google Scholar]
  30. Gao, Z.C.; Zhang, T.Y.; Huang, P.Y.; Xu, B. UV/chlorine process for the removal of ammonia nitrogen in micro-polluted water. Acta Sci. Circumstantiae 2019, 39, 3427–3433. (In Chinese) [Google Scholar]
  31. Zhang, X.; Li, W.; Blatchley, E.R., III; Wang, X.; Ren, P. UV/chlorine process for ammonia removal and disinfection by-product reduction: Comparison with chlorination. Water Res. 2015, 68, 804–811. [Google Scholar] [CrossRef]
  32. Zhang, X.; He, J.; Xiao, S.; Yang, X. Elimination kinetics and detoxification mechanisms of microcystin-LR during UV/Chlorine process. Chemosphere 2019, 214, 702–709. [Google Scholar] [CrossRef] [PubMed]
  33. Zhang, X.; Ren, P.; Zhou, J.; Li, J.; Li, Z.; Wang, D. Formation of disinfection by-products in an ammonia-polluted source water with UV/chlorine treatment followed by post-chlorination: A pilot-scale study. Environ. Technol. Innov. 2022, 26, 102266. [Google Scholar] [CrossRef]
  34. Zhao, J.; Li, Z.; Zhou, Z.; Zhou, X.; Yang, X.; Wang, D. Investigation on disinfection efficiency of anultrasound/ultraviolet all-in-one reactor at a pilot scale. Chin. J. Environ. Eng. 2016, 10, 6185–6189. [Google Scholar]
  35. Buchanan, W.; Roddick, F.; Porter, N.; Drikas, M. Fractionation of UV and VUV pretreated natural organic matter from drinking water. Environ. Sci. Technol. 2005, 39, 4647–4654. [Google Scholar] [CrossRef] [PubMed]
  36. Wang, C.; Moore, N.; Bircher, K.; Andrews, S.; Hofmann, R. Full-scale comparison of UV/H2O2 and UV/Cl2 advanced oxidation: The degradation of micropollutant surrogates and the formation of disinfection by-products. Water Res. 2019, 161, 448–458. [Google Scholar] [CrossRef] [PubMed]
  37. Yang, J.C. Influencing Factors of Ultraviolet Disinfection and Strategies for the Improvement in Shenzhen Wastewater Treatment Plant. Master’s Thesis, Harbin Institute of Technology, Harbin, Chian, 2013; pp. 48–49. (In Chinese). [Google Scholar]
  38. Zhao, J.C.; Huang, Y.L.; Wen, G.; Ren, W.; Zhu, H. Sequential inactivation of fungi in drinking groundwater by UV and chlorine. Chin. J. Environ. Eng. 2016, 10, 6867–6872. (In Chinese) [Google Scholar]
  39. Meng, X.X. Research on Ultraviolet Sterilisation Technology Reform of A Sewage Treatment Plant in Hulan District of Harbin. Master’s Thesis, Harbin Institute of Technology, Harbin, Chian, 2019; pp. 48–49. (In Chinese). [Google Scholar]
Figure 1. Quasi-parallel beam instrument. 1. Low-pressure UV lamp; 2. Parallel beam cylinder; 3. Quasi-parallel UV light; 4. Adjustable bracket; 5. Magnetic stirrer; 6. Aluminum plate; 7. Petri dish.
Processes 10 01622 g001
Figure 2. The sterilization effect of “Method A”. (a) Contact reaction time (1 min); (b) Contact reaction time (3 min); (c) Contact reaction time (5 min); (d) Comparison of sterilization efficacy of different contact reaction time.
Processes 10 01622 g002aProcesses 10 01622 g002b
Figure 3. The sterilization effect of “Method B”.
Processes 10 01622 g003
Figure 4. Process diagram of UV photolysis of sodium hypochlorite.
Processes 10 01622 g004
Figure 5. Three-dimensional fluorescence analysis of organic matter after combined disinfection treatment. (a) Raw water; (b) “Method A”; (c) “Method B”.
Processes 10 01622 g005aProcesses 10 01622 g005b
Figure 6. Effect of different light intensity on photoreactivation of fecal coliforms. (a) “Method A”; (b) “Method B”.
Processes 10 01622 g006
Figure 7. Removal effect of combined disinfection on NH4+-N and TP. (a) “Method A”; (b) “Method B”.
Processes 10 01622 g007
Figure 8. Turbidity removal effect of combined disinfection method. (a) “Method A”; (b) “Method B”.
Processes 10 01622 g008
Figure 9. Removal effect of combined disinfection method on COD and UV254. (a) “Method A”; (b) “Method B”.
Processes 10 01622 g009
Figure 10. The effect of temperature on the sterilization effect of “Method A”.
Processes 10 01622 g010
Figure 11. The effect of temperature on the sterilization effect of “Method B”.
Processes 10 01622 g011
Figure 12. The effect of turbidity on the sterilization effect of “Method A”.
Processes 10 01622 g012
Figure 13. Effect of turbidity on the sterilization effect of “Method B”.
Processes 10 01622 g013
Figure 14. Effect of COD load on the sterilization effect of “Method A”.
Processes 10 01622 g014
Figure 15. The effect of COD load on the sterilization effect of “Method B”.
Processes 10 01622 g015
Table 1. Main water quality parameters of experimental water.
Water Quality IndexUnitNumerical Value
COD(mg/L)10~22
BOD5(mg/L)2.6~5.7
NH4+-N(mg/L)0.11~0.67
TN(mg/L)4.11~13
TP(mg/L)0.08~0.24
pH-6.7~7.16
SS(mg/L)2~5
Table 2. Experimental reagents.
ReagentMolecular FormulaPurityManufacturer
Sodium hypochlorite solutionNaClOARAladdin
Sodium thiosulfateNa2S2O3ARAladdin
Ascorbic acidC6H8O6ARXilong Chemical
Ammonium molybdate(NH4)6Mo7O24·4H2OARXilong Chemical
Potassium sodium tartrateC4H4O6KNa·4H2OARSinopharm
Potassium dihydrogen phosphateKH2PO4GRSinopharm
Ammonium chlorideNH4ClGRSinopharm
Zinc sulfateZnSO4ARSinopharm
Sodium hydroxideNaOHGRMcLean
Potassium persulfateK2S2O8-Beijing Lianhua Technology
Nessler’s reagent--Opson
Special consumables for COD water quality detection--Beijing Land Bridge
MFC medium--Beijing Land Bridge
Table 3. Methods for the detection of conventional water quality indicators.
IndexDetection Methodology
NH4+-NNessler reagent spectrophotometry
Residual chlorineResidual chlorine analyzer
TemperaturePortable water quality detector
CODRapid digestion method
UV254Ultraviolet spectrophotometry
TurbidityPortable turbidimeter
Table 4. Experimental instruments.
Instrument NameInstrument ModelManufacturer
Vertical pressure steam sterilizerBXM-30RShanghai Boxun
Constant temperature incubatorHPX-9052MBEShanghai Boxun
Colony counterLC-JLQ-1Shanghai Boxun
Visible spectrophotometer721Shanghai Meixiang
254 nm UV irradiatorLS126CTianjin Taisite
Portable turbidimeterWGZ-20BShanghai INESA
COD fast digestion instrumentCOD-571-1Shanghai INESA Scientific Instruments
Ultraviolet-visible spectrophotometerSPECORD-200/PlusKunshan Ultrasound Instrument Co., Ltd.
Publisher’s Note: MDPI stays neutral with regard to jurisdictional claims in published maps and institutional affiliations.

