Article

Photodegradation and Mineralization of Phenol Using TiO2Coated γ-Al2O3: Effect of Thermic Treatment

by
Claudia Martinez-Gómez
1,*,
Israel Rangel-Vazquez
2,
Ramon Zarraga
1,
Gloria del Ángel
2,
Beatriz Ruíz-Camacho
3,
Francisco Tzompantzi
2,
Esmeralda Vidal-Robles
4 and
Alejandro Perez-Larios
5,*
1
Department of Chemistry, Division of Natural and Exact Sciences, Campus Guanajuato, University of Guanajuato, Noria Alta S/N, Col. Noria Alta, Guanajuato 36050, Guanajuato, Mexico
2
Laboratory of Catalysis, Department of Chemistry, Division of Basic Sciences and Engineering, Universidad Autónoma Metropolitana-Iztapalapa, Av. San Rafael Atlixco No. 186, Mexico City 09340, Mexico
3
Department of Chemical Engineering, Division of Natural and Exact Sciences, Campus Guanajuato, University of Guanajuato Noria Alta S/N, Col. Noria Alta, Guanajuato 36050, Guanajuato, Mexico
4
Faculty of Chemical Engineering, Benemérita Universidad Autónoma de Puebla, Ciudad Universitaria Av. Sn. Claudio y, Blvd. 18 Sur Col, Jardines de San Manuel, Puebla 72570, Puebla, Mexico
5
Nanomaterials, Water and Energy Research Laboratory, Department of Engineering, Centro Universitario de los Altos, Universidad de Guadalajara, Av. Rafael Casillas Aceves 1200, Tepatitlán de Morelos 47600, Jalisco, Mexico
*
Authors to whom correspondence should be addressed.
Processes 2022, 10(6), 1186; https://doi.org/10.3390/pr10061186
Submission received: 19 April 2022 / Revised: 30 May 2022 / Accepted: 3 June 2022 / Published: 14 June 2022
(This article belongs to the Special Issue Wastewater Treatment by Advanced Oxidation Processes)

Abstract

:
It is well-known that γ-Al2O3 possesses large, specific areas and high thermal, chemical, and mechanical resistance. Due to this, it is the most-used support for catalysts, in this case TiO2, as it enables it to achieve better dispersion and improves the activity in catalytic photodegradation reactions. In a previous work, it was observed that the optimal content of TiO2 in γ-Al2O3 was around 15% since the degradation of phenol results were maximized and a synergistic effect was generated by the interaction of both oxides. In addition, an increase in acidity crystal size and the generation of localized, oxygen-vacant, electronic states in the forbidden band of γ-Al2O3, were observed. This study focuses on the effect of the calcination temperature on a γ-Al2O3-TiO2 catalyst (15% w/w of TiO2) and its impact on photocatalytic activity. The catalysts prepared here were characterized by X-ray diffraction, N2 adsorption–desorption, FTIR-pyridine adsorption, MAS-NMR, HRTEM-FFT, UV-vis, and fluorescence spectroscopy.

1. Introduction

The extensive use of water reservoirs has provoked serious shortages in many parts of the world [1]. Nowadays, there are several industries that generate large volumes of effluents that are refractory in nature, such as phenols, phenol derivatives, and other toxic compounds [2,3]. Phenolic compounds are classified as persistent organic pollutants (POPs) and are widely found in effluents from industries such as textiles, paper, oil refining, pharmaceuticals, polymers, pesticides, petrochemicals, etc. [4]. The US EPA has listed phenolic compounds as priority pollutants while in most countries, the maximum allowable concentration of phenols in effluent streams is under 1 ppm [5]. The most common treatment applied worldwide to remove aqueous phenols is biological treatment, but high concentrations of phenols can inhibit performance or can even be toxic to the microorganisms employed to remove such contaminants [6]. When using adsorption processes instead, the cost of production increases significantly due to the low adsorption capacity exhibited for these kinds of pollutants (in addition to being limited by the range of the pH of industrial effluents) [7,8,9] and low reusability, as the cost of the treatment of used sludge represents from 25 to 65% of the total cost [10].
In the last decades, advanced oxidation processes (AOPs) have become relevant due to the multiple advantages they offer. Among these are the following: with the appropriate catalyst, a series of free radicals including hydroxyl radicals (•OH), ozone (O3), and superoxide radicals (O2−•) [7,10,11] can be generated, which are able to mineralize a wide range of toxic and recalcitrant organic compounds towards CO2 and H2O, avoiding the generation of toxic by-products and reducing the photodegradation time [10]. In addition, low operating costs (since the main source of energy required comes from the sun) and the use of environmentally friendly catalysts make it an advantageous alternative [8,10]. Furthermore, AOPs have proven to be efficient in degrading and mineralizing up to 100% of such molecules [12]. In recent years, some researchers have studied a variety of practical strategies to develop photocatalysts by attempting to mineralize these compounds into water and CO2 [13]. The efficiency of a photocatalyst (defined as the ratio of the percentage of removal of the concentration after time to the initial concentration of the organic contaminant in a solution) depends mainly on its chemical nature. Some of the important parameters are the band gap (between the valence band and the conduction band) and the amount of surface exposed to incident light [14], which in turn depend not only on the macroscopic architecture but also on the specific surface area, structure, and selectivity (key factors for the adsorption process) [15,16,17,18,19]. Nowadays, adsorbent nanomaterials are available to be used as photocatalysts [20,21]. Nanoscale γ-Al2O3 can be used in this fashion, but its large band gap energy of about 9 eV [19] makes it difficult for it to behave as a good photocatalyst, so it is necessary to combine it with an adequate solid and use them as mixed oxides [21]. γ-Al2O3 offers many advantages, such as a high surface area, great thermal resistance, a good cost-effectiveness ratio, and easy processing for various morphologies. For the purpose of this work, the most significant property is the following: γ-Al2O3 possesses many hydroxyl groups distributed all over its surface, making AlO(OH) prone to interact with a wide range of foreign molecules. In this manner, various functional composite materials can be prepared [22,23]. Among the many different materials used as photocatalysts, titanium dioxide (TiO2) is one of the most promising photocatalysts for several applications, such as organic pollutant degradation [23]. Contrary to γ-Al2O3, TiO2 has low specific area, does not have good thermal resistance, and exhibits a short time lap for the formation of the electron–hole pair. These disadvantages cause lower photocatalytic activity [6,12,13,14,15,16,17,18,19,20]. Photocatalysis is one of the most advanced oxidation processes (AOPs), where highly reactive hydroxyl radicals (•OH) are formed and contacted to contaminants in order to degrade them into species such as CO2, H2O, or harmless inorganic anions [19]. Photocatalysis has gained more attention for the decomposition of recalcitrant organic pollutants in the environment [24,25,26,27]. A good photocatalyst can be activated by any light higher in energy than its band gap energy. When photocatalysts are irradiated with ultraviolet (UV) light in the presence of H2O and O2, different reactive oxygen species are generated through reactions of electron (e)–hole (h+) pairs. γ-Al2O3-TiO2 mixed oxides have proved to be excellent photocatalysts [24]. It has been reported that γ-Al2O3-TiO2 has effectively increased photocatalytic activity [19,20,21,22,23,24,25,28,29,30,31,32]. In this work, a γ-Al2O3-TiO2 mixed oxide was synthesized with the peptization of a boehmite method in an effort to improve the photocatalytic performance for the degradation and mineralization of phenols. It is important to highlight that the treatment temperature for a catalyst plays a key role in its activity since it defines its physicochemical properties. The present work focuses on the effect of the calcination temperature of the AT15 catalyst in a range from 400 to 800 °C, which is part of a series of catalysts studied in a previous work [17]. The aim is to find an optimal treatment temperature, as well as to understand the physicochemical properties that it provides to the catalyst.

2. Materials and Methods

The γ-Al2O3-TiO2 mixed oxide was prepared through hydrolysis using the boehmite method with titanium alkoxide (modified sol-gel method) [17,26]. The necessary amount of boehmite was placed in a flask, and nitric acid was added until an ideal pH was obtained. Subsequently, isopropanol was added, and it was brought to a temperature of 60 °C, maintaining constant stirring for 24 h. Then, the system was brought to room temperature and the amount of titanium IV isopropoxide necessary to obtain material at 15% the weight of TiO2 was added to the peptized boehmite. The materials were dried and placed in an oven at 120 °C for 12 h. Finally, the materials were calcined under airflow (60 mL min−1) at different temperatures (400, 500, 600, 700, and 800 °C) for 6 h [26].

2.1. Nitrogen Adsorption

A Quantachrome NOVA 4200e instrument was used to determine the specific surface area from N2 adsorption–desorption isotherms at 77 K. BET and BJH methods were employed to calculate the specific surface area and mean pore diameter, respectively.

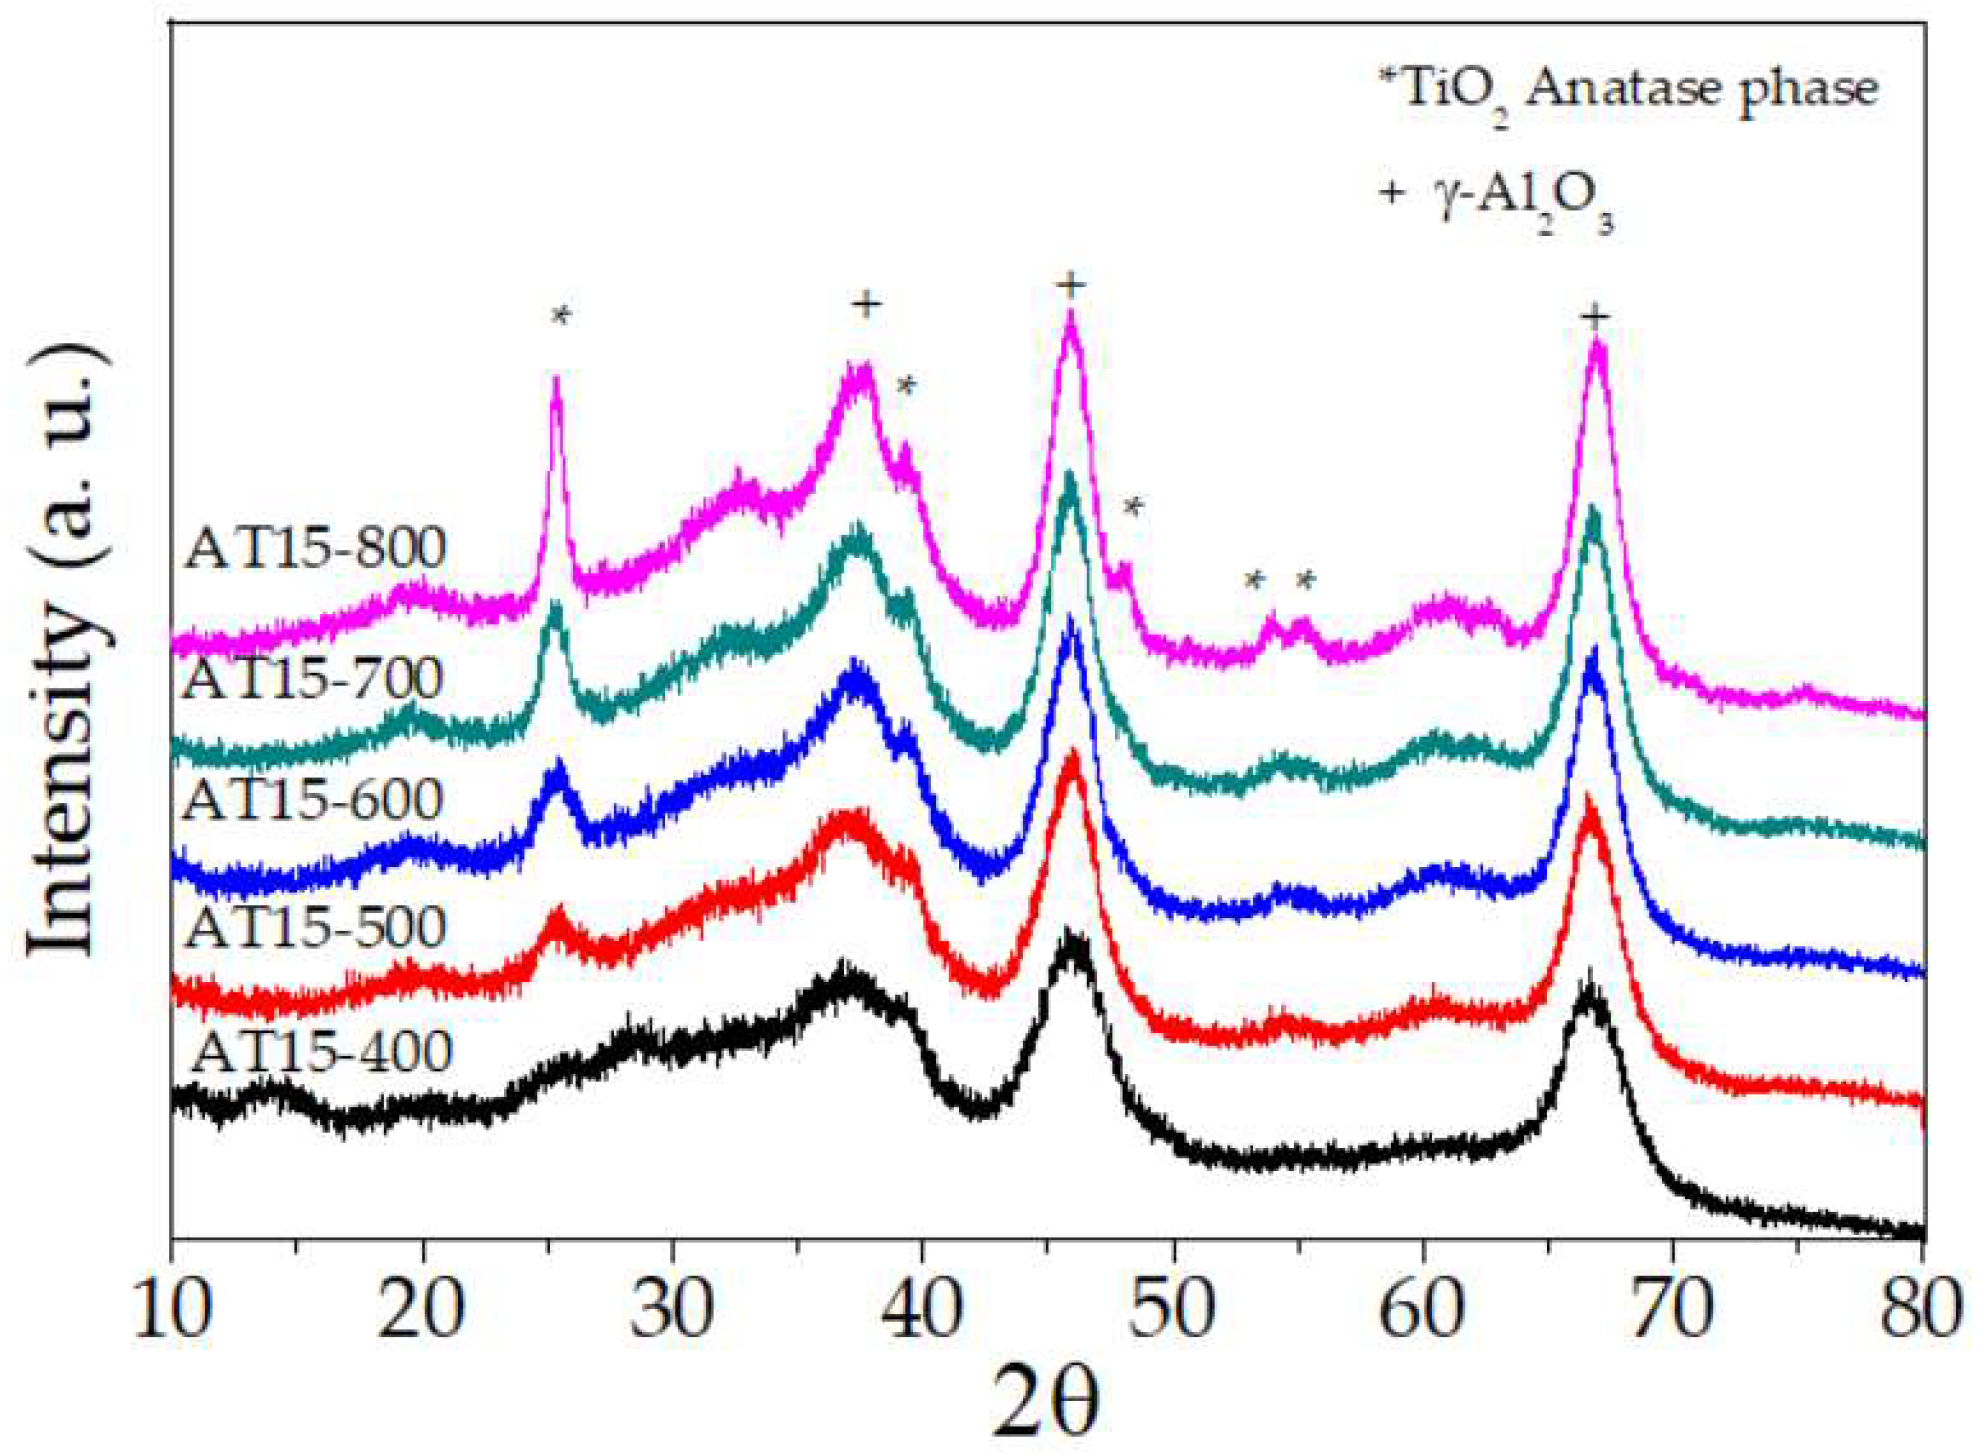
2.2. X-ray Powder Diffraction

A Bruker D-8 Advance DRX (CuKα radiation, graphite secondary-beam monochromator, scintillation detector) was utilized to obtain X-ray diffraction patterns between 10 and 80° with a 2θ step of 0.02° (counting time of 9 s). The identification of crystalline phases was performed using the JCPDS database.
The Scherrer equation (L = Kλ/(B(θ)cosθ)) was used to calculate the average crystallite sizes. Interplanar spacing d(hkl) was calculated using Bragg’s law: nλ = 2d(hkl)sinθ. Due to both anatase and rutile crystallizing in a tetragonal lattice cell, the cell parameters were calculated using 1 d ( hkl ) 2 = h 2 a 2 + h 2 a 2 + l 2 c 2 and by choosing reflections at ~37.79 and 48.04° (2θ) for the anatase phase and 27.43 and 62.75° (2θ) for the rutile phase. Since γ-Al2O3 crystallizes in cubic lattices, the cell parameter a was obtained from a = 4d(400) using the reflection found at 45.90° (2 θ).

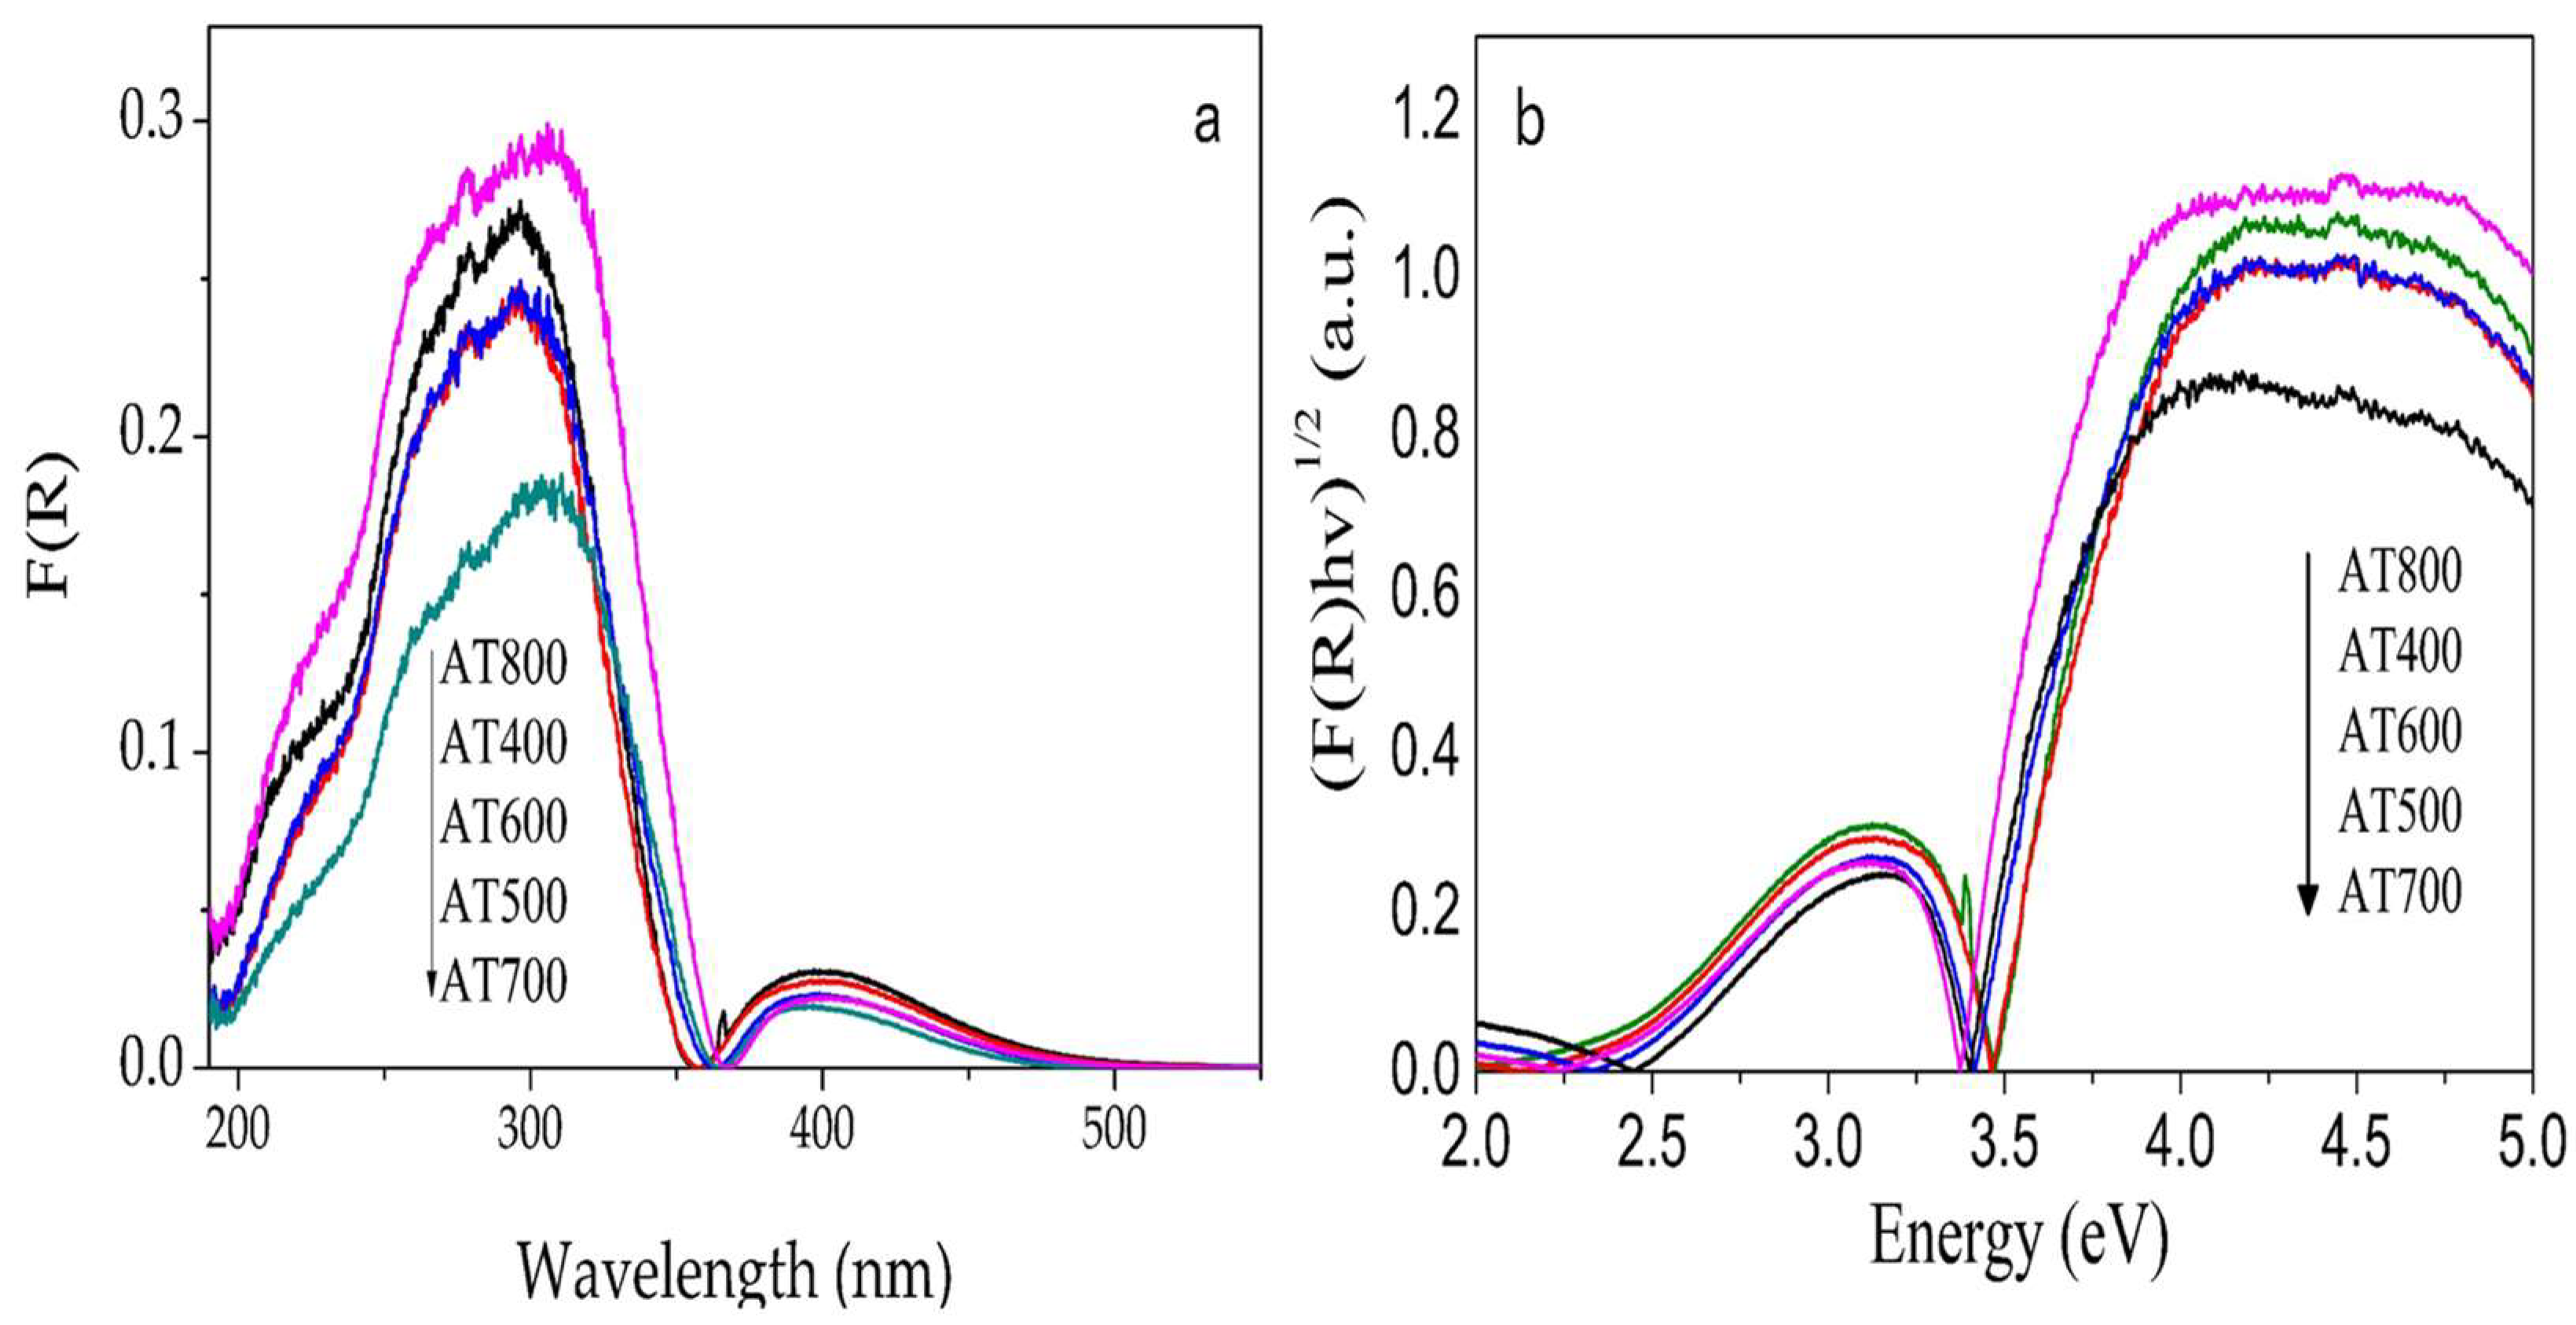
2.3. Band Gap Determination

Band gap energies for the series AT-X were calculated using a UV-vis Agilent Cary 100 spectrophotometer equipped with a diffuse reflectance integrated sphere.

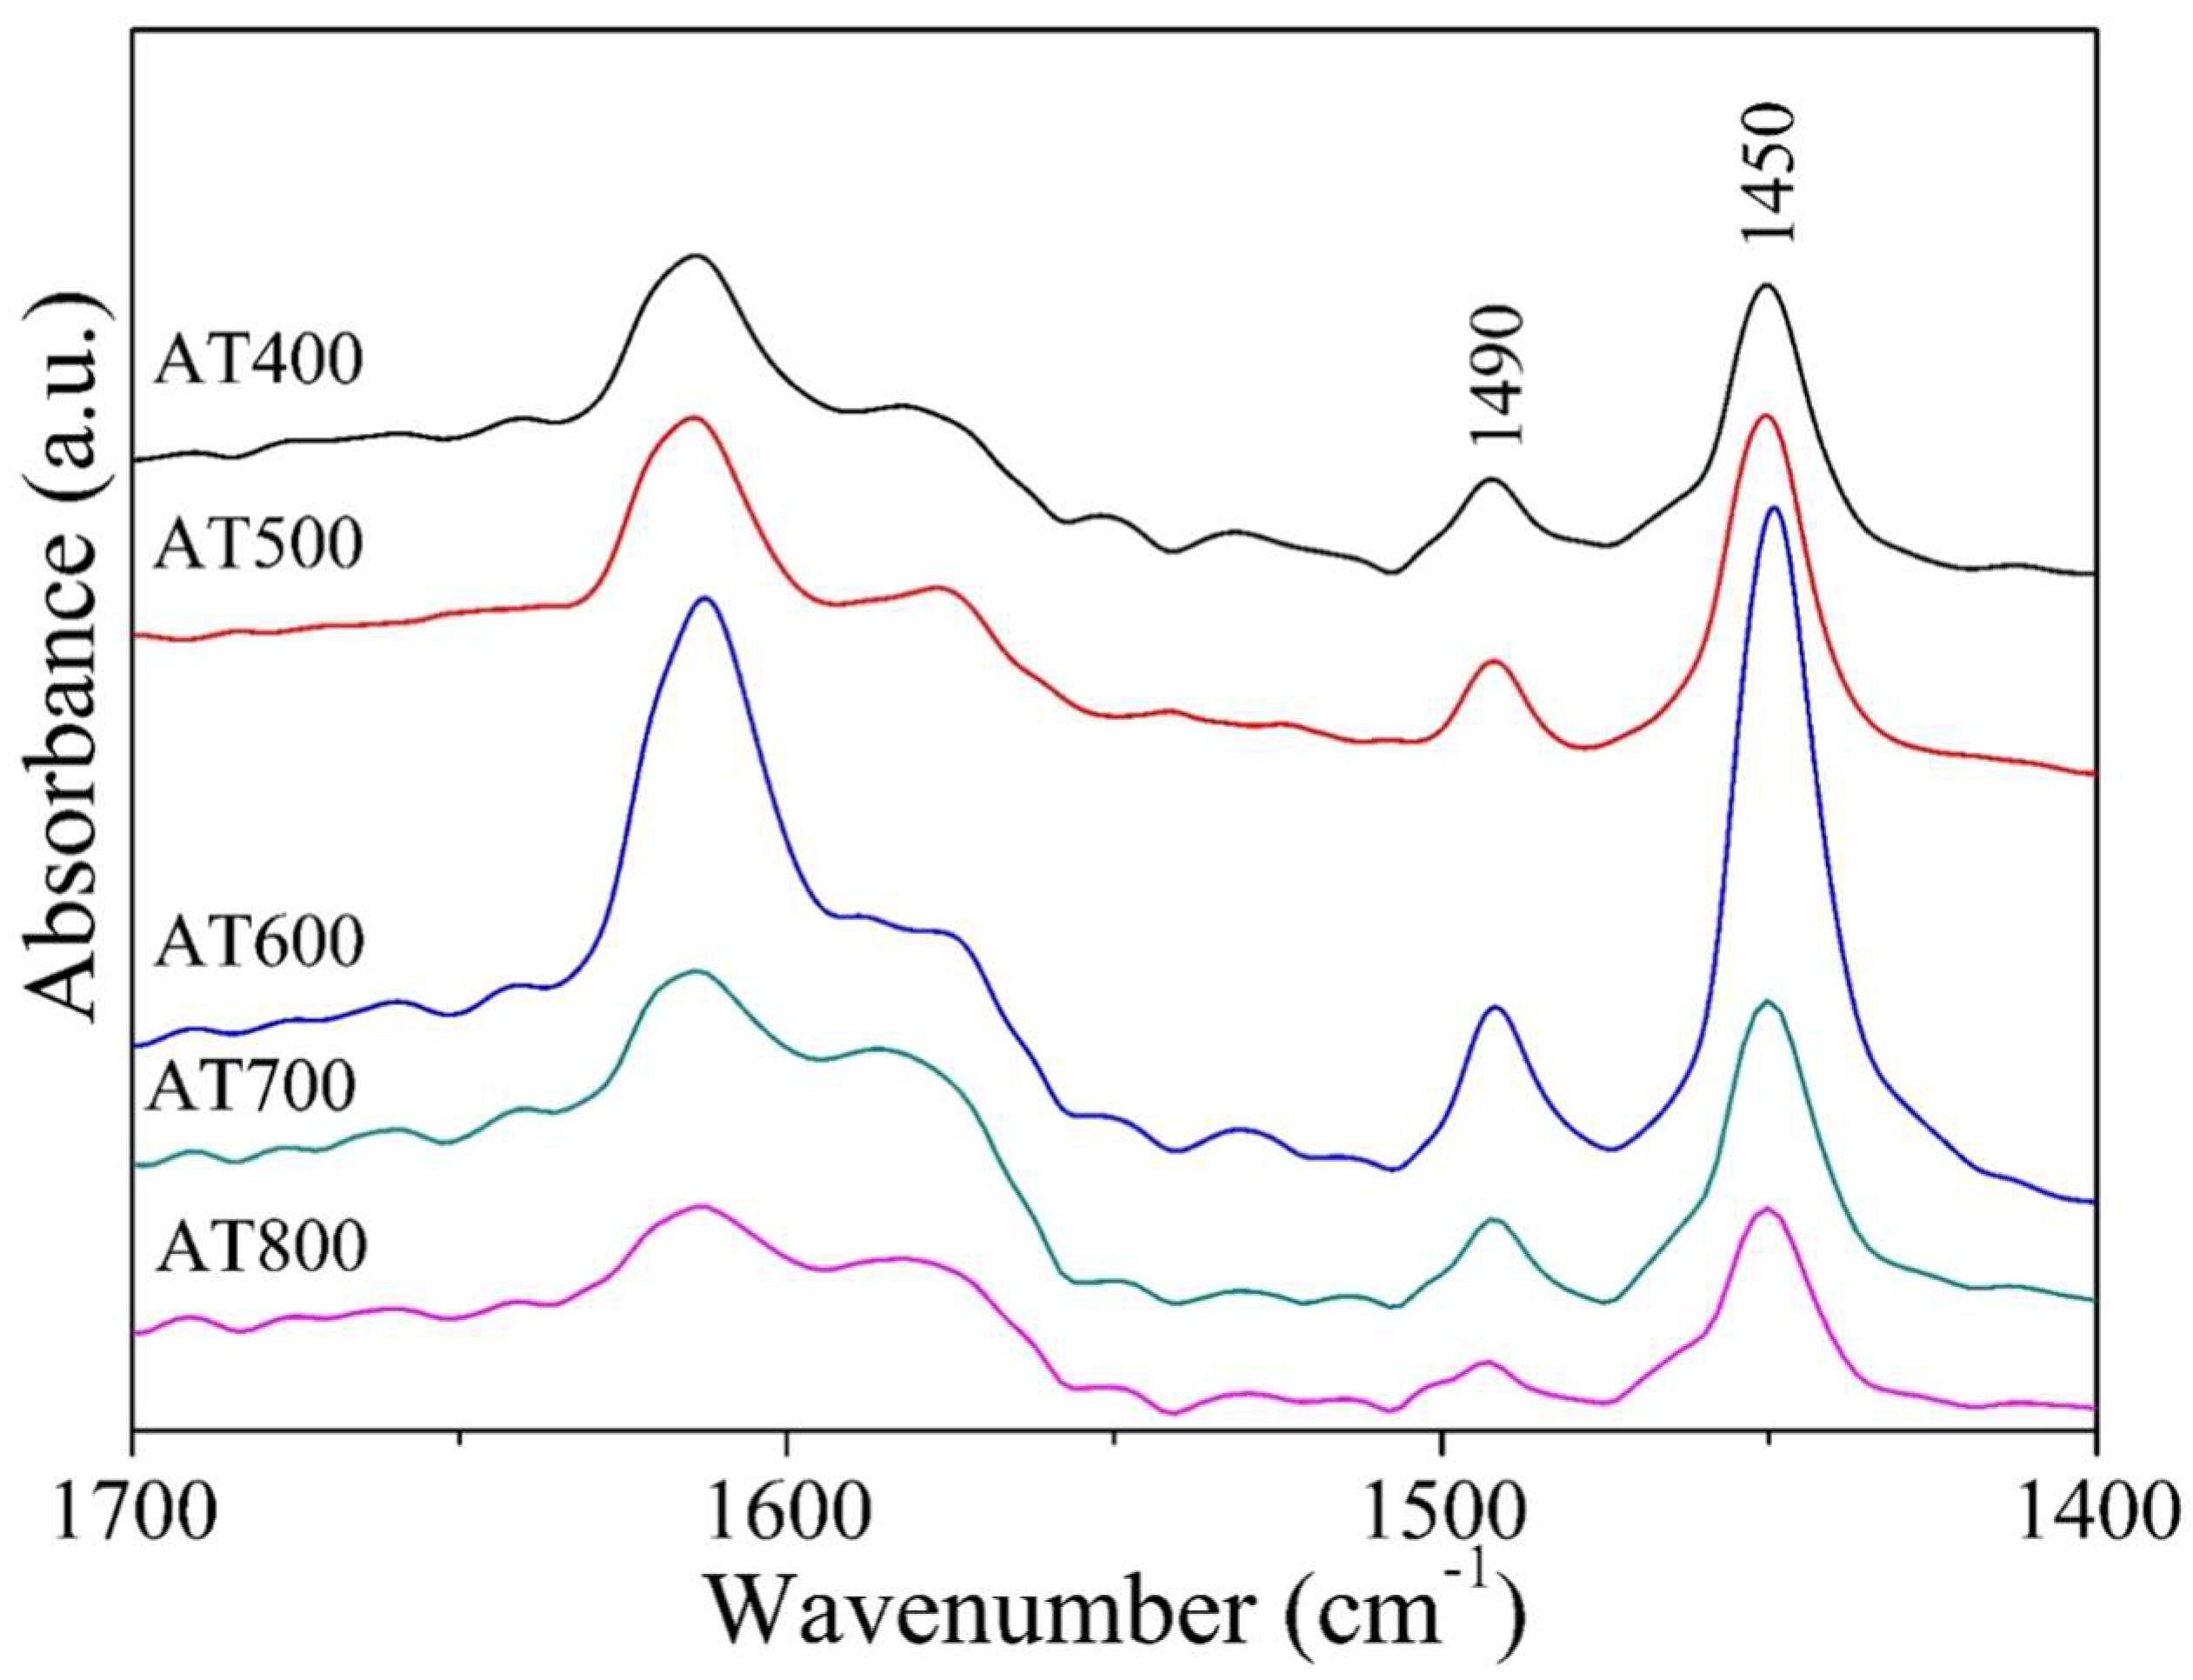
2.4. FTIR Spectroscopy for the Adsorption of Pyridine

The pyridine adsorption analysis was performed with a Nicolet 170-SX FTIR spectrophotometer. Thin wafers were prepared from the powdered samples and placed in a vacuum-lined Pyrex glass cell provided with CaF2 windows. The samples were evacuated (10−3 Torr) at 673 K for 30 min. Then, pyridine was introduced into the system when it reached room temperature. After 30 min, excess pyridine was vacuum-extracted so that the FTIR spectra could be obtained at various temperatures. The acid sites were measured from the integrated absorbance bands using an extinction coefficient, as previously reported in [26].

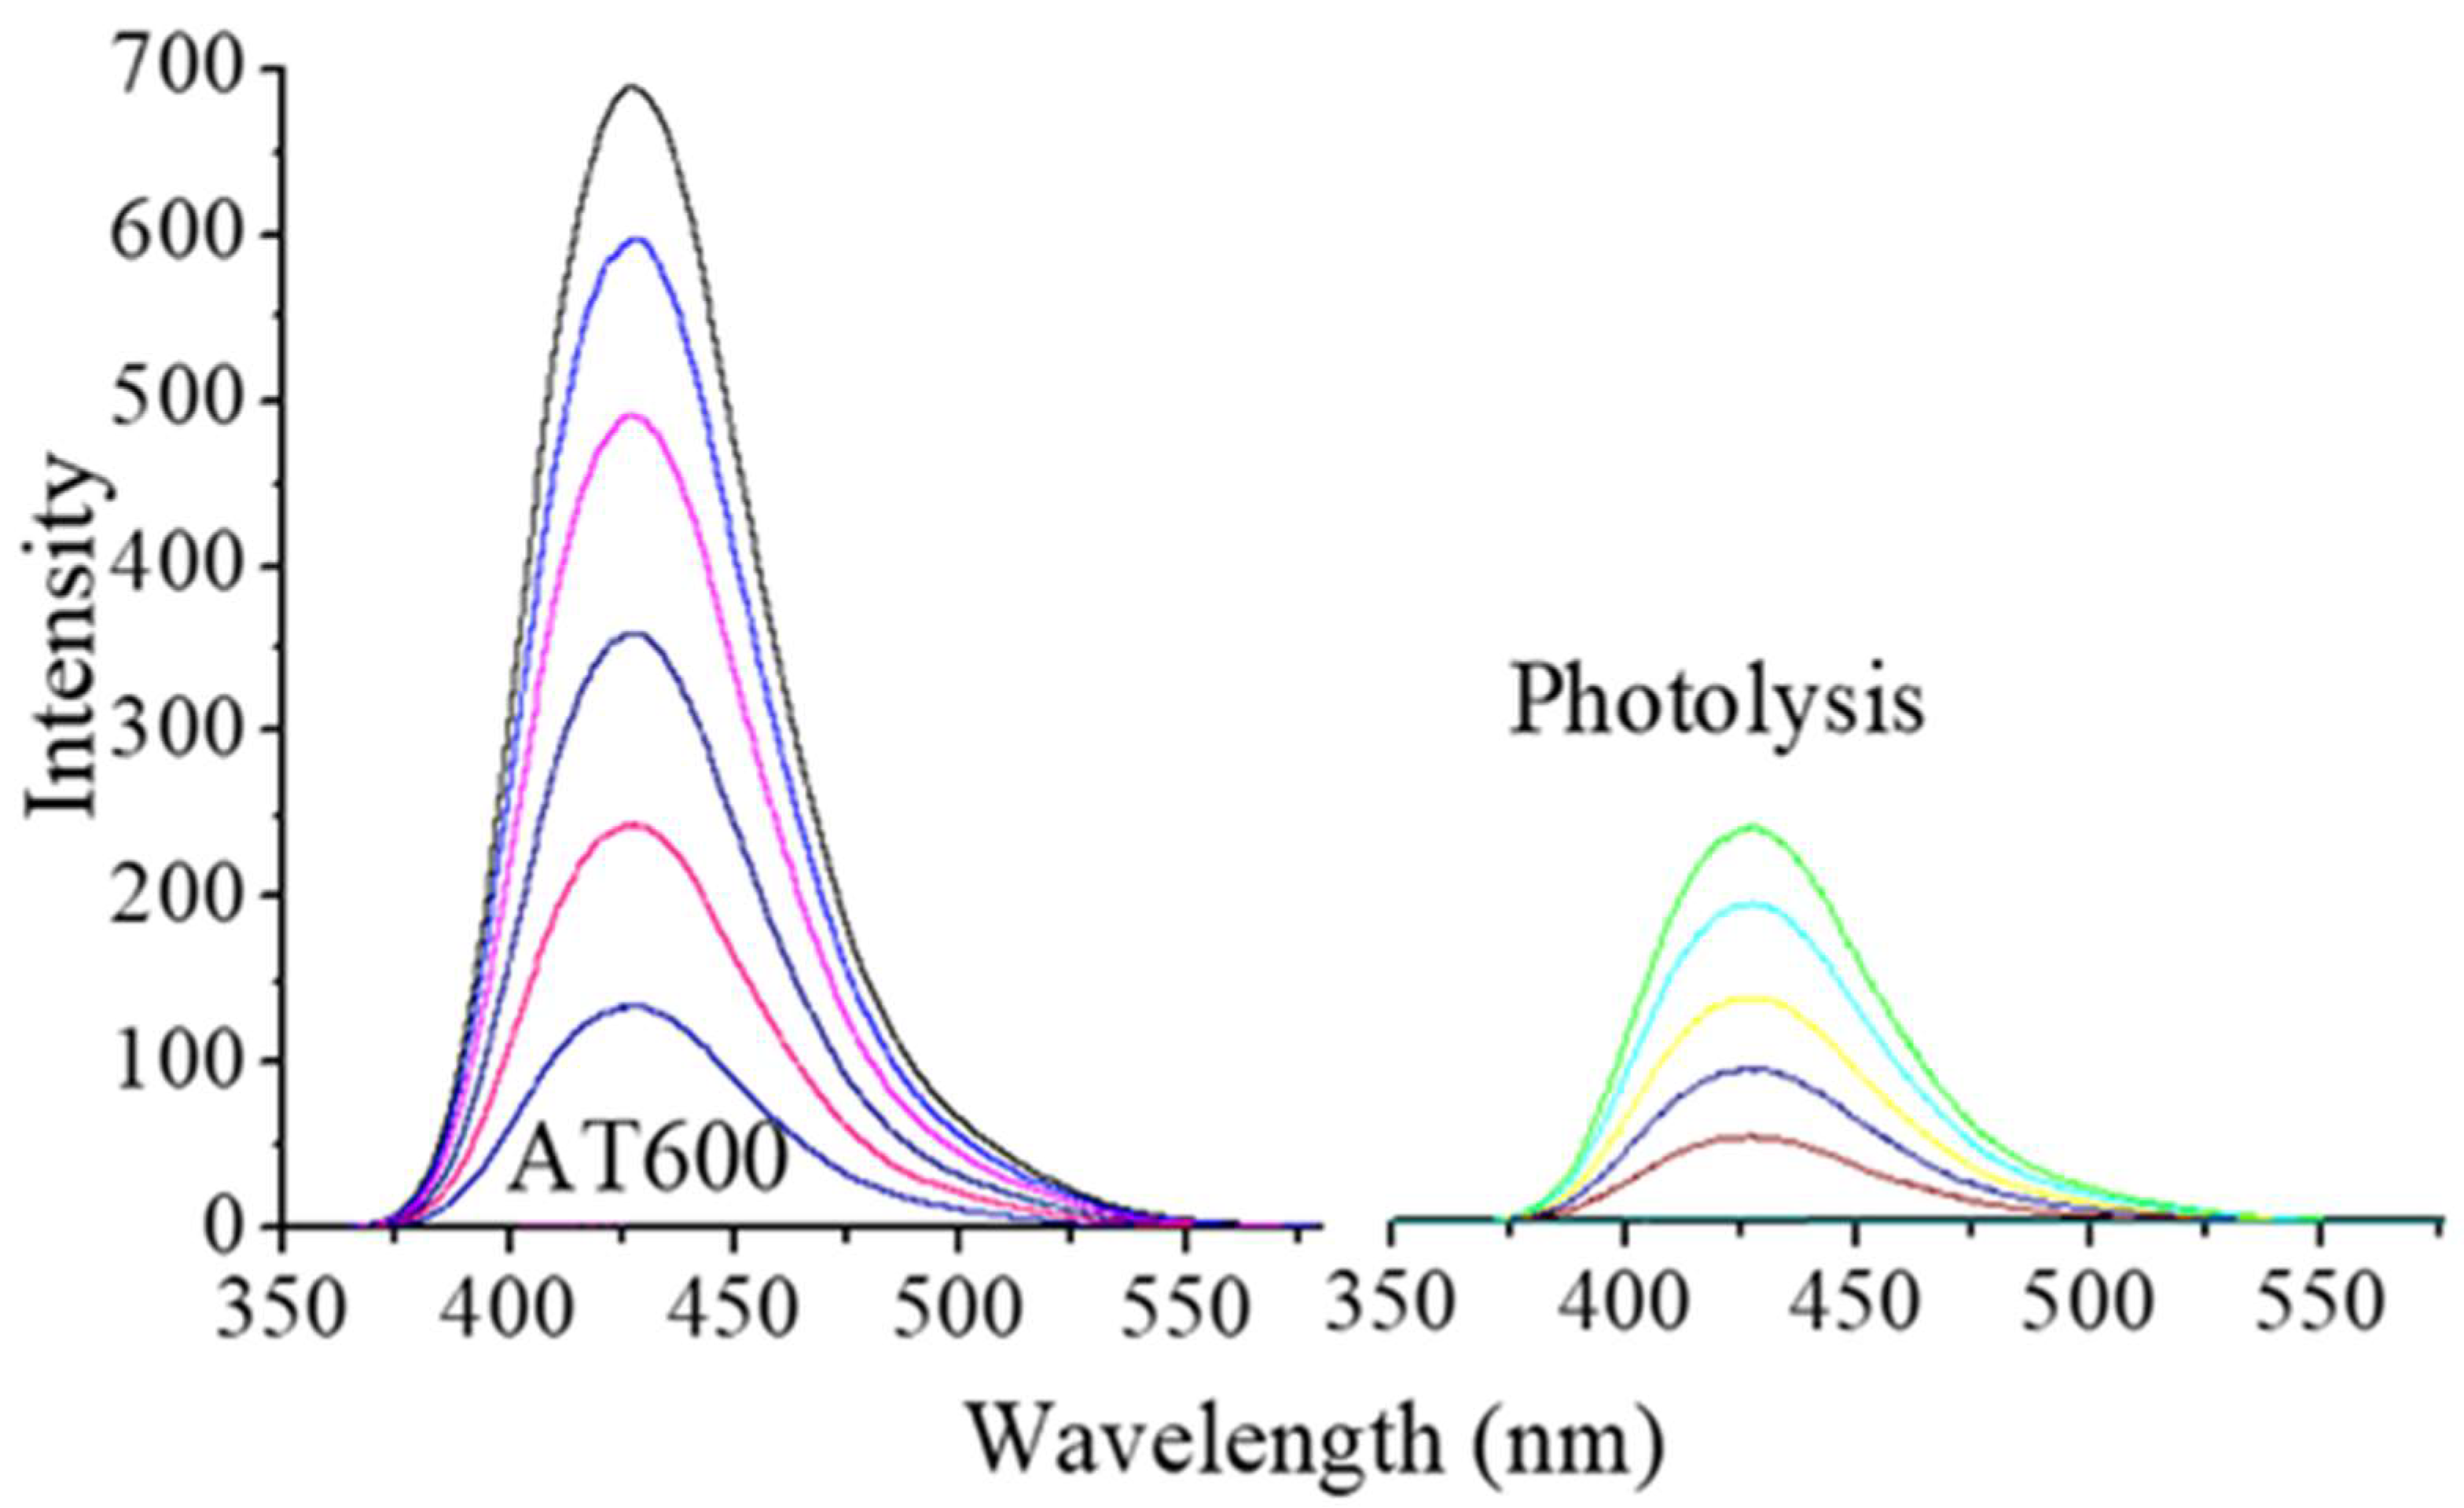
2.5. Fluorescence Technique

The fluorescence detection of •OH radicals was performed using a 0.5 mM terephthalic acid solution, which was added to 2 mM NaOH and 0.20 g of each catalyst. After stirring for 1 h in the absence of UV light to reach adsorption–desorption equilibrium between the photocatalysts and the terephthalic acid, UV irradiation started (UV mercury lamp Pen-Ray, 254 nm, 4400 mW/cm2). Aliquots of 3 mL were taken every 15 min during 1 h using membrane filters of 0.45 mm. The samples were then analyzed with a Perkin-Elmer LS-50B Luminescence Spectrometer. 2-hydroxyterephthalic acid was formed as the product of the hydroxylation reaction, showing a characteristic fluorescence spectrum (lambda e lambda = 315 nm, lambda em = 425 nm).

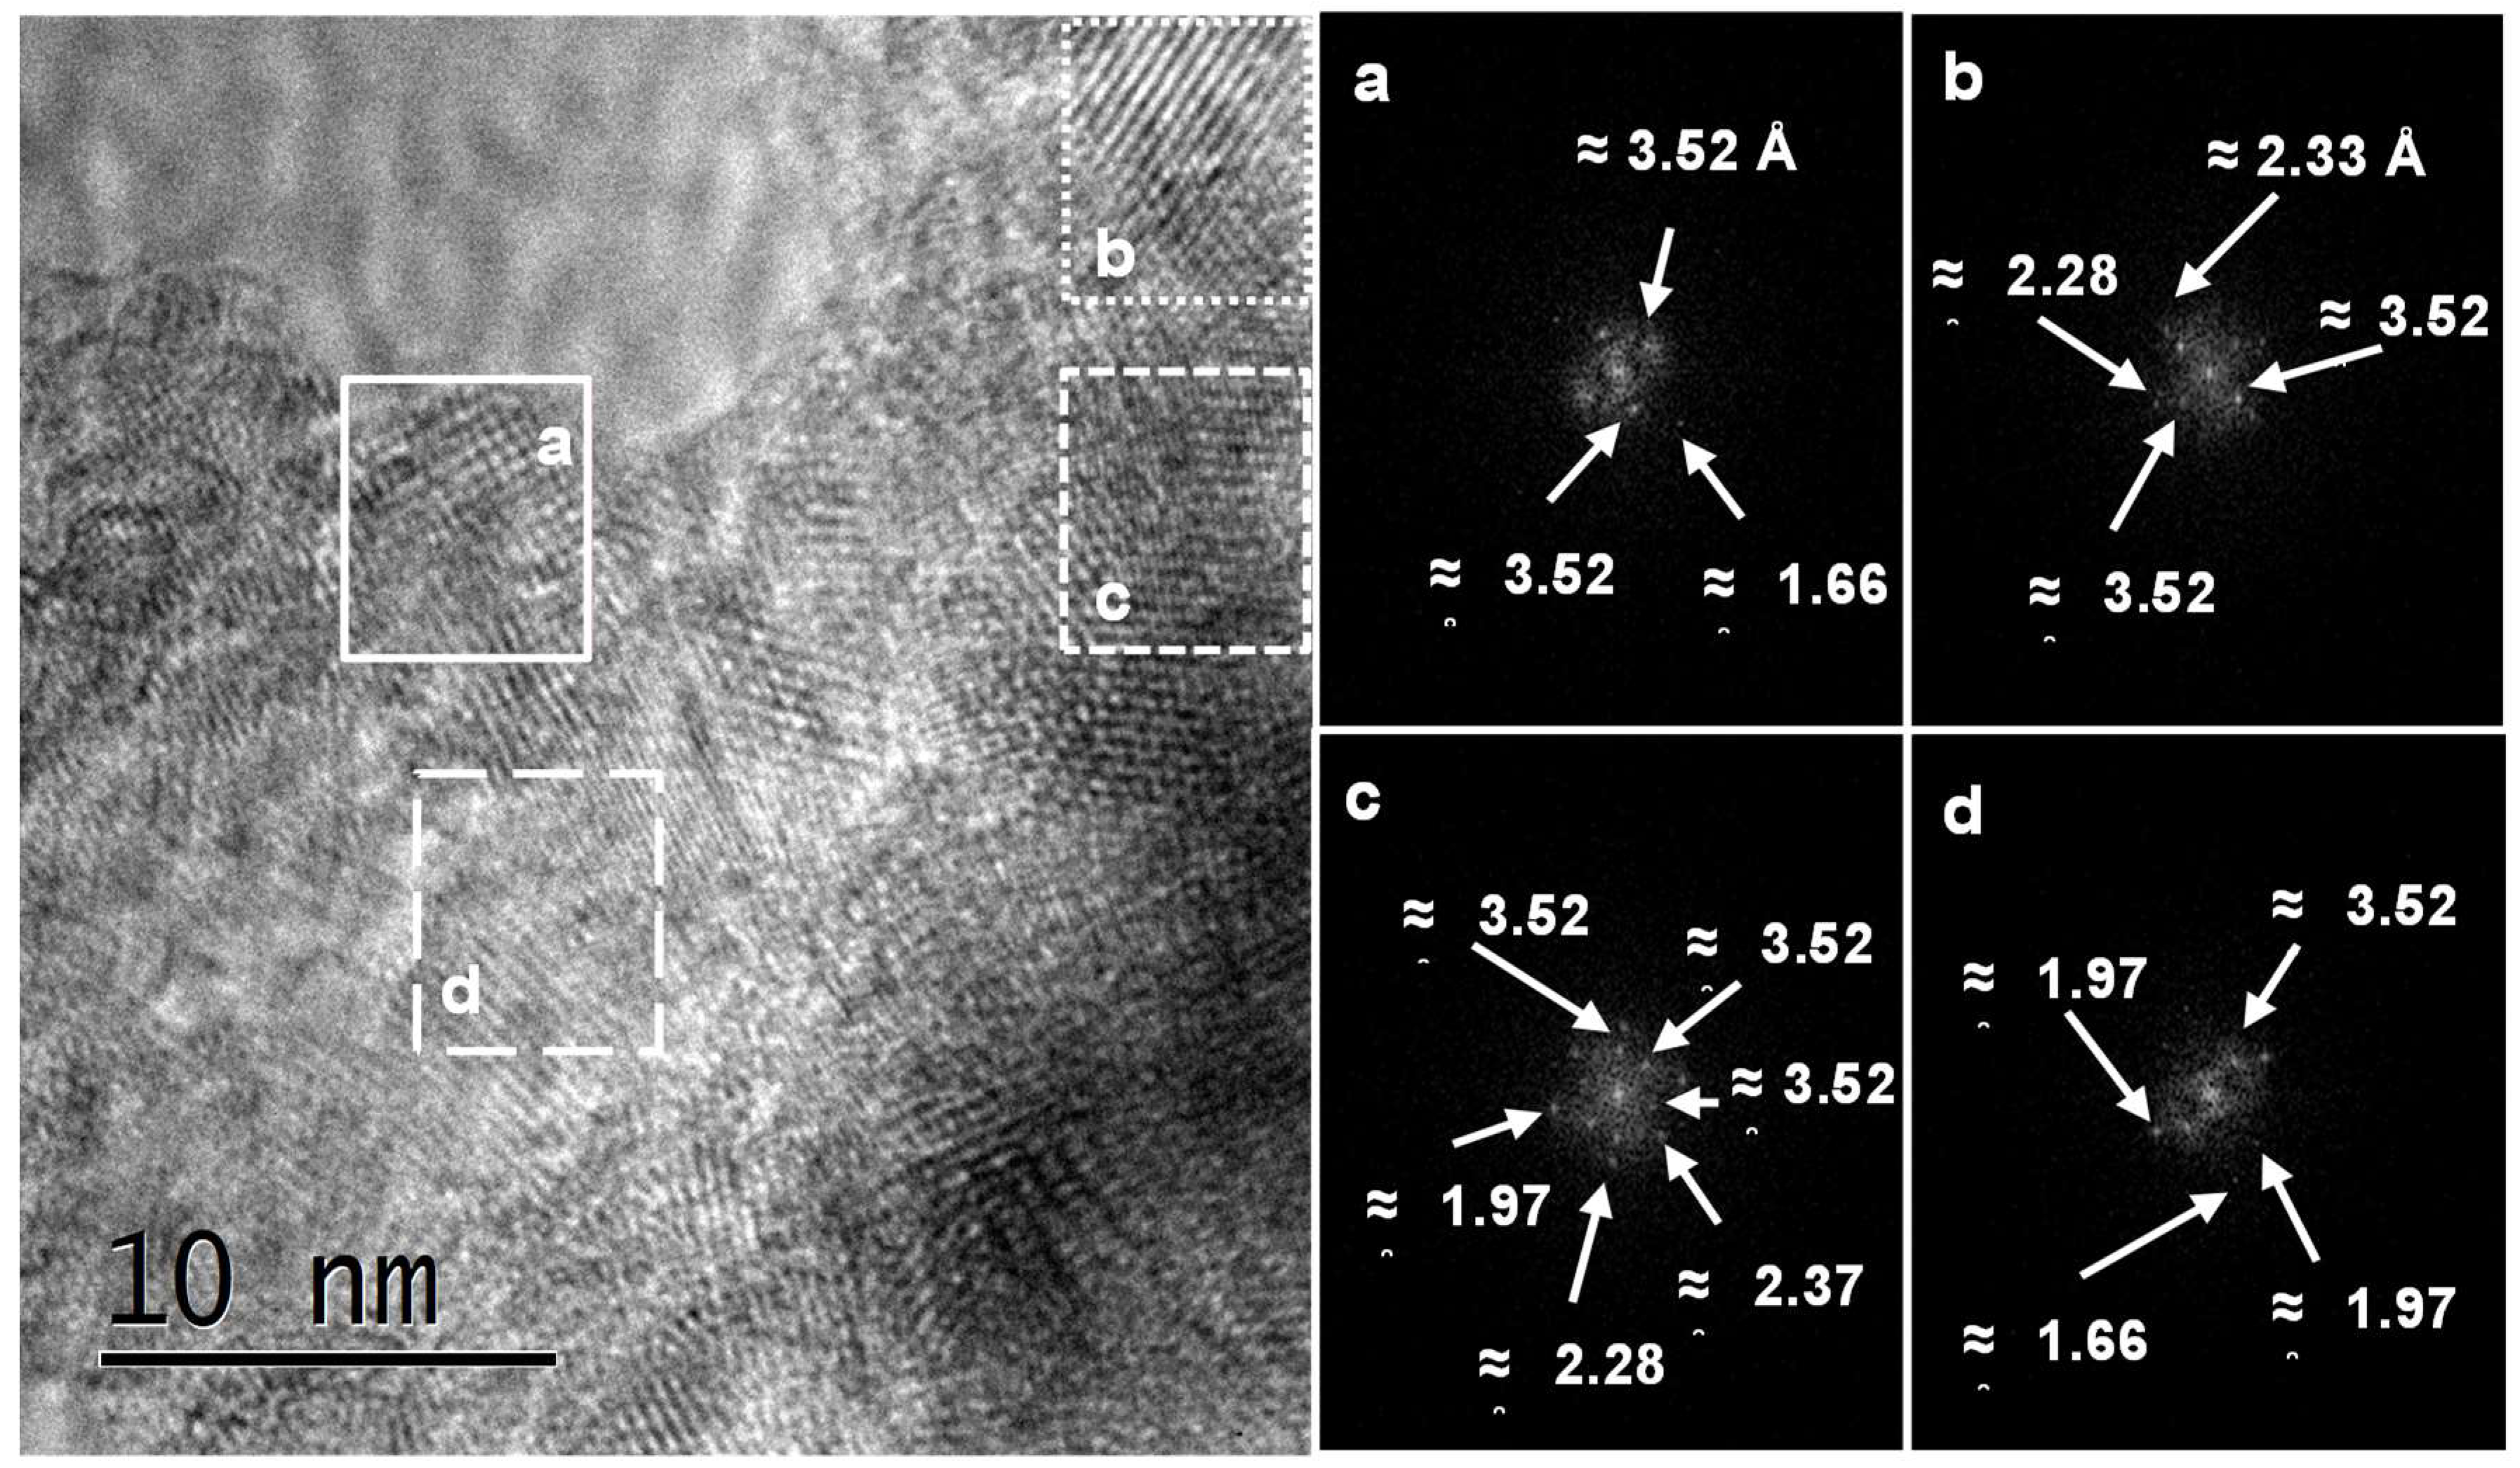
2.6. High-Resolution Transmission Electron Microscopy

Micrographs were obtained using a JEOL HRTEM 2010F with a field emission source and an acceleration voltage of 200 kV. The powdered samples were dispersed ultrasonically in butanol and then placed on a copper grid and coated with a thin layer of amorphous carbon. In order to measure the crystallographic planes, a digital micrograph program from Gatan Software Team was used.

2.7. Photocatalytic Evaluation

The photocatalytic evaluation of the calcined materials was carried out in a glass reactor with a cooling jacket using 200 mL of a solution of phenols with a concentration of 40 ppm and 100 mg of catalyst. A UV Pen-Ray lamp (254 nm and 4400 µW/cm2) protected with a quartz tube was immersed in the solution as the source of irradiation. The degradation of phenol was measured by taking aliquots of the solution using a syringe with a nylon membrane in order to remove the suspended solid particles. The evolution of the photodegradation was followed using the phenol adsorption band at 269 nm with a Cary 100 UV-vis spectrophotometer. The mineralization of phenol was measured with TOC determination using Shimadzu LSN equipment.

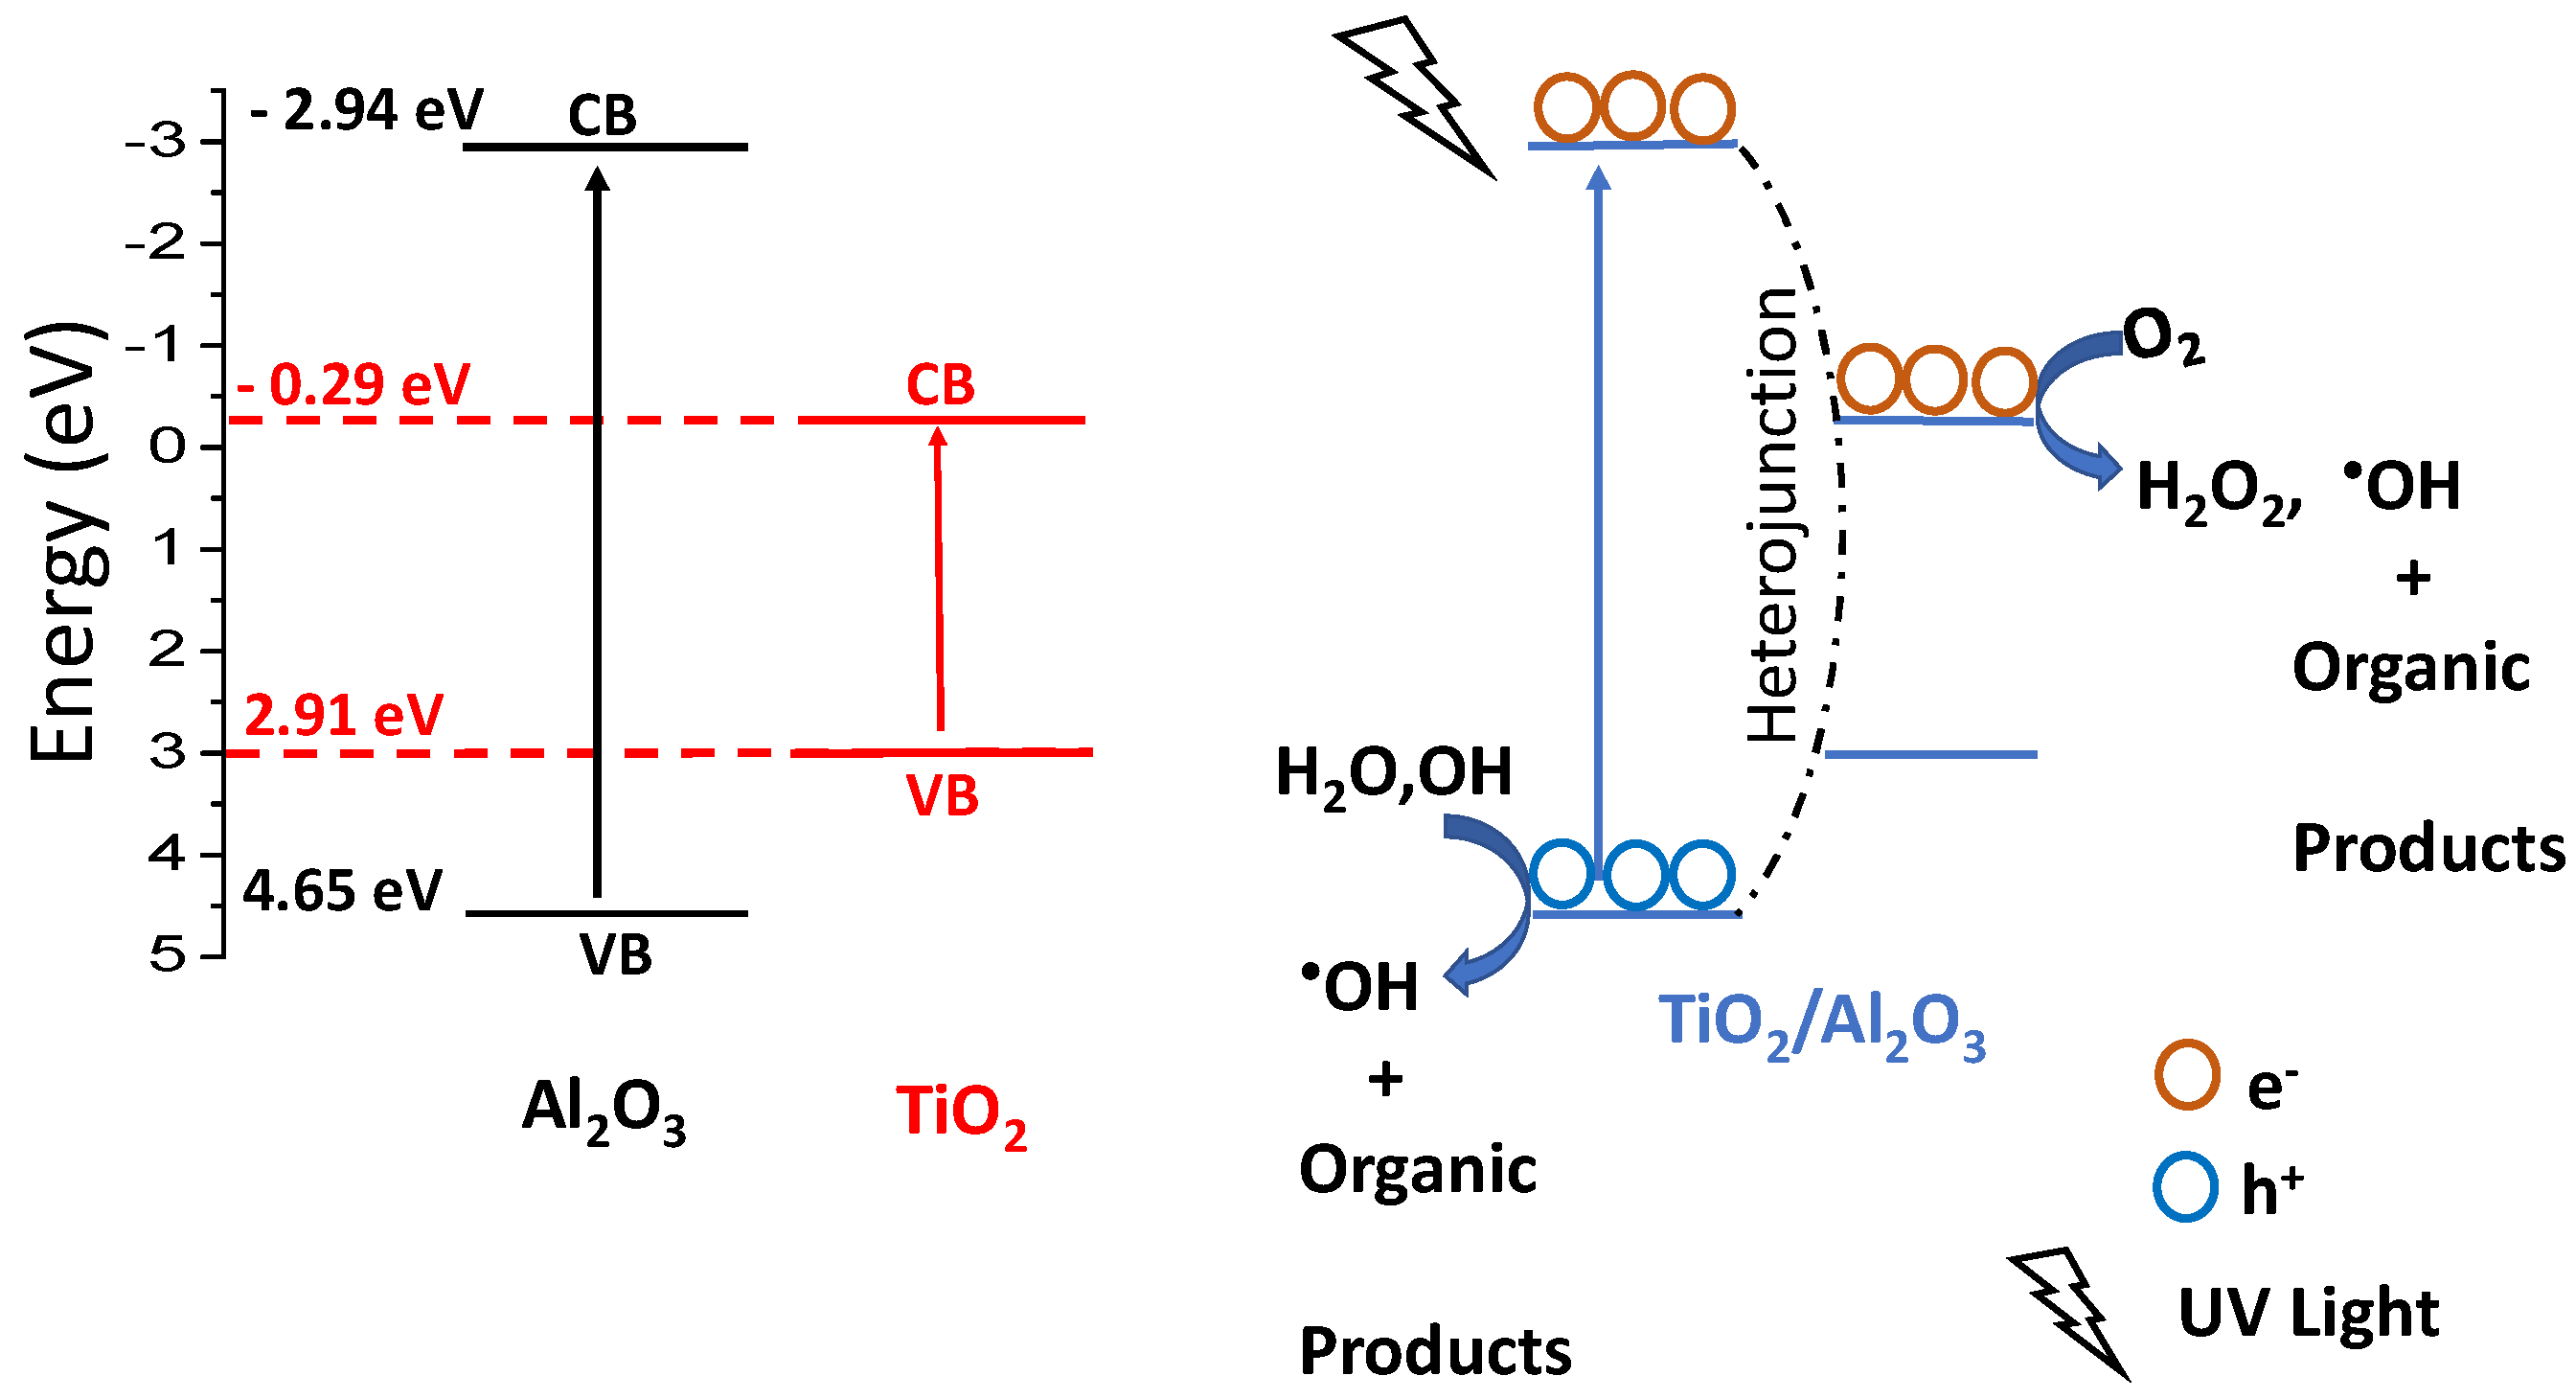
3. Results and Discussion

Figure 1 shows the XRD powder patterns of the catalyst thermally treated at temperatures from 400–800 °C using a methodology called boehmite peptization. It was noted that the diffraction peaks at 2θ = 37.6, 45.8, and 67 were assigned to the (311), (400), and (440) planes corresponding to the γ-Al2O3 phase, which were seen in all the samples in accordance with JCPDS No. 50-0741. Moreover, it was observed that the materials treated in the range from 500 to 800 °C exhibited diffraction peaks at 2θ = 25.3, 37, 48.6, and 53.5°, which were assigned to the (101), (004), and (200) planes corresponding to the anatase phase (JCPDS No. 21-1272). Here, it was observed that the calcination temperature played an important role since, as it increased, the nucleation of TiO2 also increased, giving way to the formation of a more defined structure, as reported by Ismail et al. [27,33,34,35]. For this reason, the crystal size was also affected by the treatment since the crystal size of γ-Al2O3 in the 311 plane presented a crystallite size that ranged from 4.88 to 4.79 nm for materials treated from 400 to 700 °C, showing a decrement as the temperature increased. In another case, when the material was treated at 800 °C, the crystallite size increased from 4.79 to 4.83 nm. It should be noted that all the materials exhibited the anatase phase except AT800, which already presented a rutile phase peak. This suggests that both alumina and anatase presented an interaction that allowed them to stabilize the crystalline phase. The crystallite size was observed in a previous work [26]. However, this interaction was no longer possible at 800 °C because the rutile phase of TiO2 appeared, as can be seen in the diffractograms in Figure 1. On the other hand, the crystallite size of the anatase phase in the 101 plane was also affected because the size of the crystal decreased with the effect of the treatment temperature, presenting a crystallite size for plane 101 that varied from 3.93 to 3.96 nm. These values are presented in Table 1.
Figure 2a shows the isotherms for materials synthesized and calcined at temperatures of 400, 500, 600, 700, and 800 °C. Type V isotherms were observed in all the cases. This type of isotherm corresponded to type III due to the weak interactions between adsorbate–adsorbent and the materials present conformed by micro and mesopores. This type of hysteresis was of the H2b type that is associated with materials with blocked pores and with wide pore diameter distributions [36]. The materials calcined from 400 to 600 °C showed the highest values of specific surface area, while materials calcined above 600 °C had a considerable decrease in specific area: 232 m2/g for the sample calcined at 700 °C and 179 m2/g for the sample calcined at 800 °C (Table 1). We observed that the specific area decreased as the calcination temperature increased. This is because the materials had a certain thermal resistance. However, once it was exceeded, the walls that made up the structure tended to collapse. On the other hand, as shown in Figure 2b, we observed a change in pore diameter as the calcination temperature increased. This could be due to aluminum being partially covered and substituted by titanium ions, inducing a lattice expansion due to the smaller Al3+ ionic radii [27,29,31,32]. However, it is important to note that the samples calcined at 600 and 700 °C showed smaller pore diameters, especially AT600, unlike the other samples since it was clearly observed that these samples had diameters in the range of 30 to 60 Å, and the other samples had pore diameters in the range of 40 to 120 Å, as can be seen in Figure 2b. The values are reported in Table 1. The effect of this behavior could be due to the displacement of Ti atoms by Al due to the synthesis method, and since the atomic radius of Al is smaller than that of Ti, they were obtained at these temperatures. However, the material calcined at 600 °C presented a greater decrease in pore diameter because aluminum interacted more with Ti. This behavior was assessed in the NMR analysis, and perhaps there was a greater number of displacements of Al atoms by Ti atoms [17]. Regarding pore volume, we observed that, as the treatment temperature increased, this decreased, perhaps because γ-Al2O3 pores were obstructed by Ti, and the treatment temperature allowed a greater dispersion on the surface of the alumina.
Figure 3a shows the UV-vis spectra for the AT series at different temperatures, while a Kubelka–Munk (KM) absorption plot of the same materials is shown in Figure 3b. The KM absorption was obtained from the corresponding reflectance spectra of AT600 with the following relation:
R = ( 1 R ) 2 R 2
where R is the reflectance. Two main signals of absorption at around 320 nm (3.4 eV) and around 400 nm (2.4 eV) were observed. The first one was the result of the charge transfer from O2− to Ti4+ corresponding to the excitation of the electrons from the valence band (O 2p) to the conduction band (Ti 3d), which is characteristic for TiO2 in the anatase phase. This band may also be associated with the morphology of the particles of titanium oxide formed on the surface of the alumina. It has been reported that the shift of the absorption band towards the visible range may be due to the introduction of structural defects into the system, resulting in the formation of intermediate energy states in the band gap of TiO2. Other studies have also reported that this absorption can be associated with the presence of Ti3+ ions that, in turn, respond to oxygen vacancies or oxygen-related defects in the range of 2–2.75 eV. Thus, the second band at 400 nm could be assigned to oxygen-related defects caused by a reduction in TiO2 after heat treatment [37,38,39,40]. The values are reported in Table 2.
The 27Al MAS-NMR spectra for the samples treated at different temperatures are shown in Figure 4a. It can be seen that the coordination of the aluminum atom in the AT series was affected by the calcination temperature. It was observed that, for the peak relative to tetracoordinate aluminum (around 70 ppm), it shifted to low field values, especially for the material calcined at 600 °C (Figure 4b). The changes in the relative abundance of Al(IV) and Al(VI) were also relevant since it has been noticed in previous works that Al(IV) is able to create electronic deficiencies in alumina (as well as increasing acidity), which suggests a synergistic effect between TiO2 and Al2O3. This behavior is significant since it has been claimed to be responsible for the delay in the recombination of hollow-electron pairs [37,39,40,41].
An FTIR spectroscopy analysis of the adsorbed pyridine was performed to determine the acidity of the materials calcined at the given temperatures. Figure 5 shows the spectra that were obtained. Here, two peaks were easily distinguished at 1450 and 1490 cm−1. The first, at 1450 cm−1, was characteristic of Lewis acidity, and the second, at 1490 cm−1, corresponded to the total acidity (no Brønsted acidity, which is located around 1550 cm−1). Interestingly, AT600 resulted in a material with an enhanced amount of Lewis acidity (314 µm/g) unlike the others, which exhibited acidities from 140 to 270 µm/g. These values are listed in Table 1. According to the reviewed literature, acidity sites in TiO2 depend on the migration of “bulk” -OHs to the surface since the determination of the Lewis acidity of TiO2 is made by measuring only the hydroxyl groups on the surface. Ti4+ ions are potential electron-charge acceptors, i.e., acids, which favor the activity of a material with a greater number of acid sites [33,37,42,43,44,45,46,47,48]. For its part, tetracoordinated Al provides strong acid sites, depending on the treatment temperature, since it has been observed that stronger acid sites are obtained as it increases [48,49]. This suggests efficient activity in catalytic photodegradation reactions since the catalytic properties are directly related to the number of acidic (and basic) surface sites.
In Figure 6, HRTEM microscopy is presented for the AT600 catalyst with its respective fast Fourier transform (FFT) patterns for the scanned areas. The assignment of different spacing diffraction patterns for TiO2 in the anatase phase (JCPDS 21-1272 PDF Quality: Star (*)) and γ-Al2O3 (JCPDS 56-0457 Quality PDF) was used. The spacings found in the FFT for the corresponding phase and crystallographic planes with distances of 3.52, 1.66, 2.37, and 2.33 Å, respectively corresponding to the planes (1,0,1) (2,1,1), (0, 0.4), and (1,1,2) for crystalline TiO2 in the anatase phase, can be seen in the FFT (a–d). The distances of 2.28 Å (b,c) and 1.97 Å (c,d) in the FFT corresponded to the crystallographic planes (2,2,2) and (4,0,0) of the γ-Al2O3, crystalline phase [49,50,51].
The absorption of an adequate photon by an electron (e) of the valence band in a photocatalyst excitates it to the conduction band, creating an electron vacancy or hole (h+), generating electron–hole pairs [15,19,20]. The results presented here indicate that the introduction of alumina acted as a charge transfer catalyst [15,36], so excited electrons from TiO2 could be transferred to alumina, delaying the electron–hole pair recombination. Thus, the electrons generated were rapidly adsorbed on the structural defects of the alumina. Then, the photoinduced holes could oxidize OH ions or H2O adsorbed on the surface, producing highly oxidizing •OH species. The rate of this process is a competition between the oxidation of surface water by the holes and the limiting electron–hole recombination time [52]. The •OH radicals are assumed as the main species responsible for the photocatalytic oxidation of chemicals [37,52,53]. In order to detect •OH radicals formed on the AT600 material, it was irradiated under UV light with a fluorescence technique using terephthalic acid. In Figure 7, it can be seen that the emission spectra of the terephthalic acid solution were obtained every 15 min. The spectra obtained showed a gradual increase in fluorescence at around 425 nm for both the AT600 material and the reaction system without the catalyst. The intensity of the peak was related to the amount of •OH radicals formed [46]. The same procedure was also carried out without the catalyst to corroborate the generation of •OH radicals in the reaction by the AT600 catalyst.

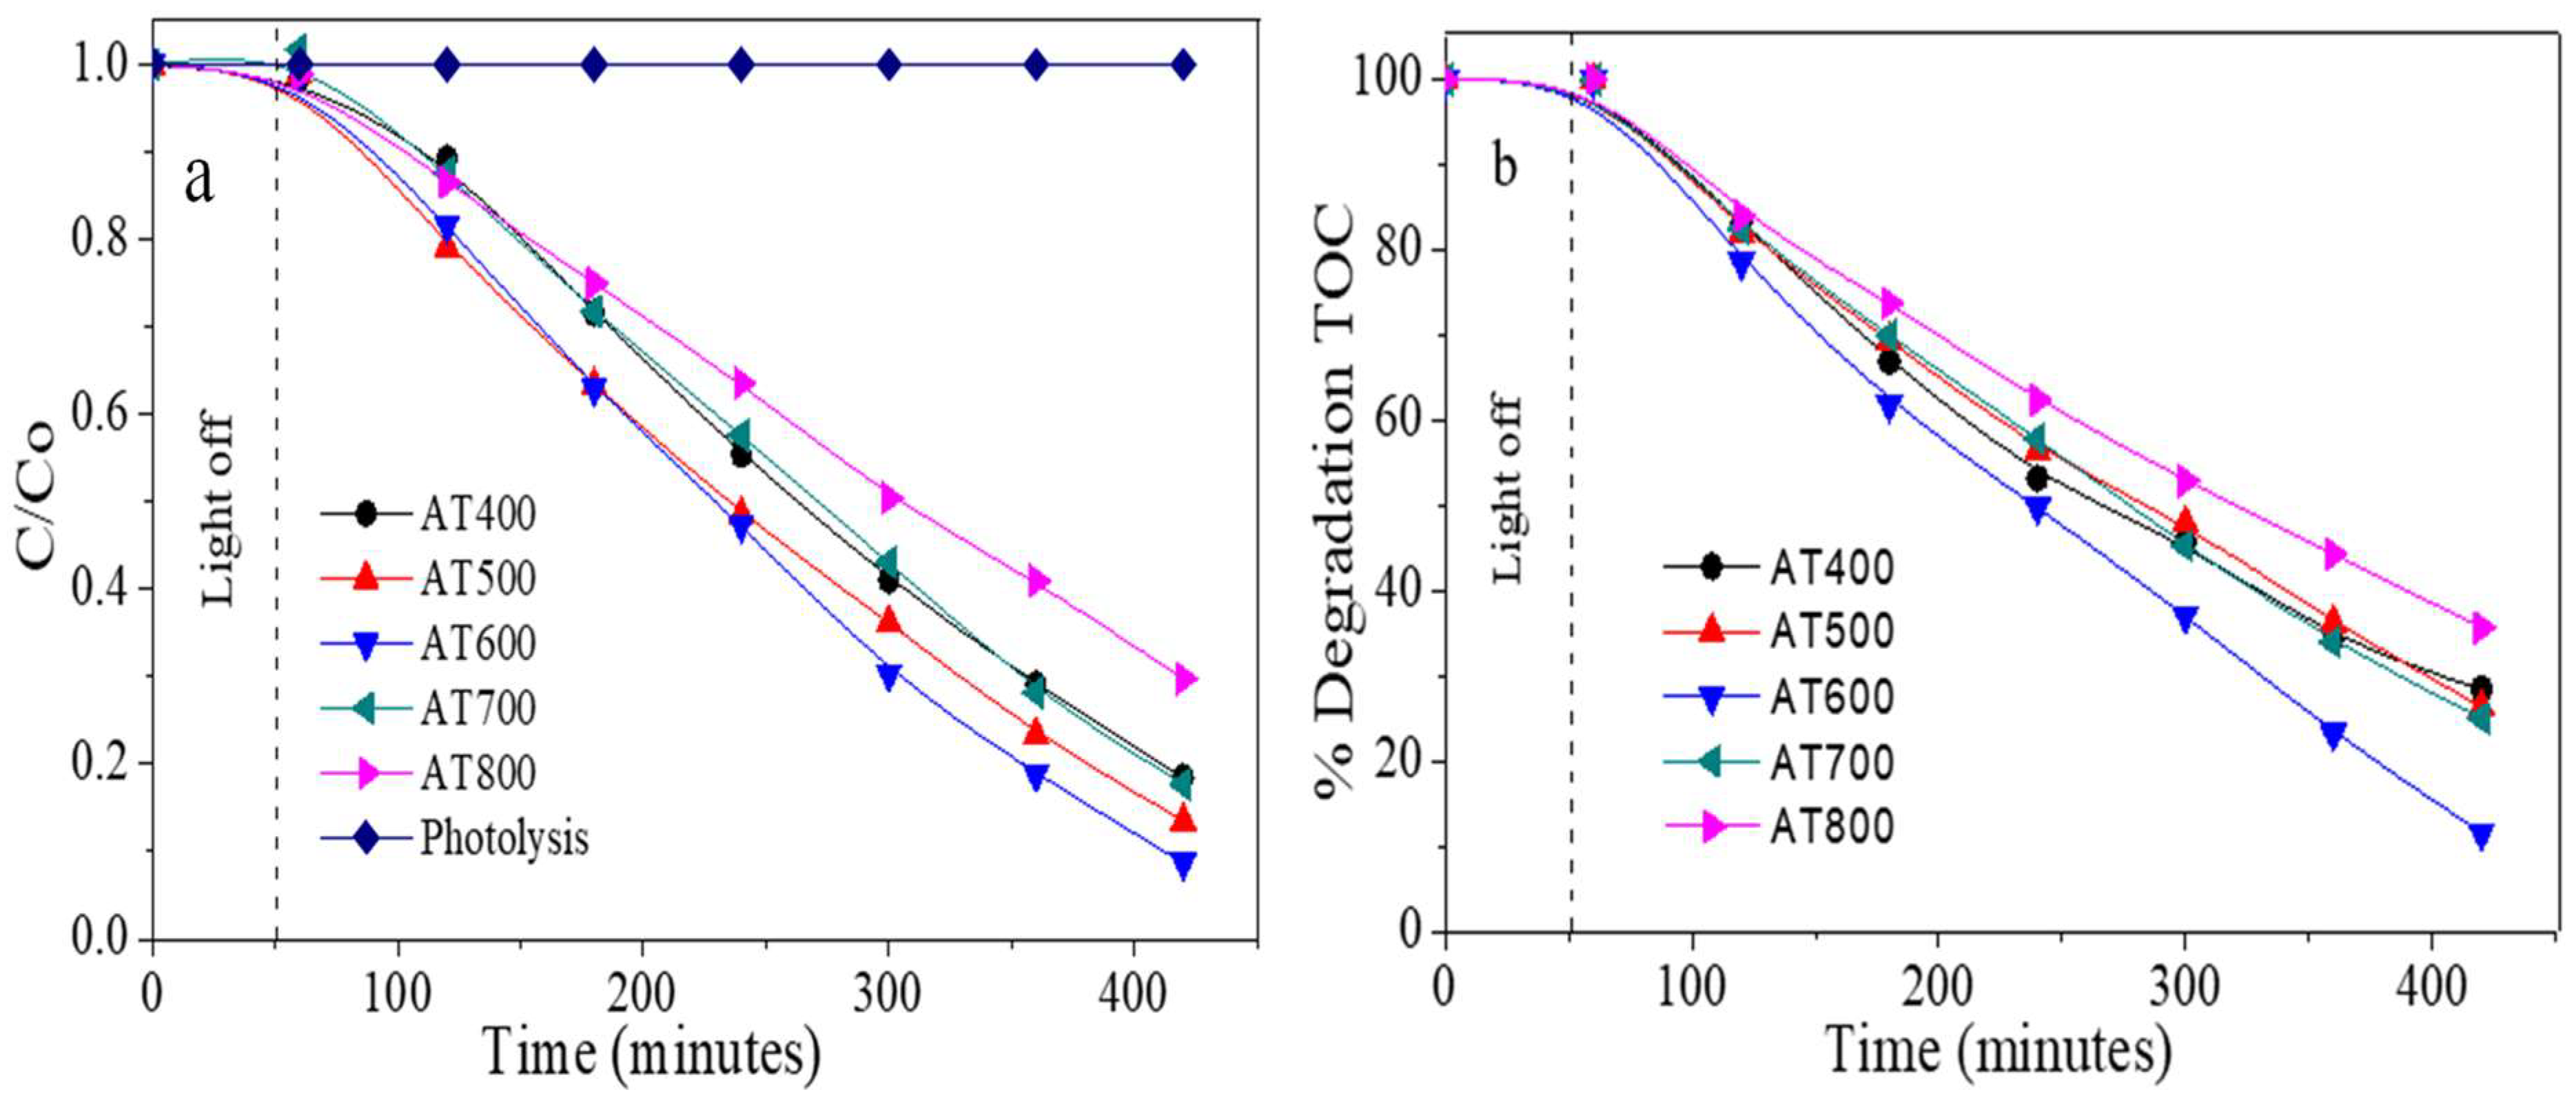
4. Photocatalytic Evaluation

The photocatalytic activity of AT series was evaluated under the mineralization of 40 ppm phenol. Figure 8a shows the results after one hour in darkness to allow an adsorption–desorption equilibrium of phenol molecules on the catalyst surface. Photolysis of the phenol molecules was carried out during 360 min in the same way that the catalytic photodegradation reactions transpired with the catalysts. During this reaction, it was possible to observe that there was no mineralization of phenol due to the effect of the UV lamp. Furthermore, the molecules were not adsorbed during the first 60 min of the reaction. In addition to this reaction, the photodegradation reactions were observed with the AT catalysts calcined at different temperatures (400 to 800 °C). We observed that the catalyst thermally treated at 600 °C showed the highest activity (Figure 8a), and this behavior was corroborated with the TOC analysis. It was clearly observed that AT600 catalyst showed the greatest activity since it presented the highest degradation of the molecule, as seen in Figure 8b.
When following the photodegradation of phenol with a UV-vis spectrophotometer, the following behavior was observed: the most active photocatalyst was the one that was treated at 600 °C, followed by the catalysts treated at 500 > 700 > 400 > 800 °C. This was corroborated by the TOC analysis, where the activity of AT600 resulted as the most active. However, the activity levels of the other materials varied in the following order: AT600 > AT700 > AT500 > AT400 > AT800. This demonstrated that the treatment temperature during the oxidation of material is crucial for the performance of the photocatalyst since it defines its physicochemical properties. Furthermore, the apparent kinetics (Kapp) for the photodegradation of phenol were obtained by the Langmuir–Hinshelwood formalism, which applies for pseudo-first-order in the photodegradation of phenol. As shown in the graph of ln C/Co versus time (Figure 9) [54,55], the kapp values and half-life time for the reactions were also obtained, as reported in Table 2.
In order to better understand this mechanism of catalytic degradation, a band diagram for the γ-Al2O3TiO2 catalysts is presented in Figure 10. As can be seen in Figure 7, the mechanism of this catalysts was *OH radicals, which were formed as soon as the catalyst entered into contact with the reaction system and the energy of the lamp [17]. This was possible since the synthesis methodology allowed the formation of a staggered-gap-type heterojunction between TiO2 and γ-Al2O3, facilitating electronic transfers from TiO2 to alumina and delaying h+–e recombination time [56,57]. This does not rule out another type of reaction, but this can be verified in future work.
In Figure 11a a study of catalyst reuse is shown. It was observed that, after three cycles of 360 min each, the catalyst only lost 13% of its photoactivity, which confirmed that, when γ-Al2O3 interacted with TiO2, a synergistic effect was generated that allowed the catalyst to stabilize, obtaining a material with superior physicochemical stability. This was corroborated by the TOC analysis Figure 11b.

5. Operating Cost

Along with the investigation of the mass and energy balances, a study was carried out on the cost benefit of the phase contemplated. Qualified pretreatment is crucial before applying it in a pilot plant. Discrete costs, such as the cost of the removal of sludge biosolids, operating costs (including the costs of chemicals and energy), and the cost of the removal of reduced sludge biosolids after treatment, were considered for the evaluation of the feasibility of the adopted pretreatment method. In view of this, the energy cost (biomethane) and the cost of the depletion of biosolids were conceived as cost-effective (gain), while the chemical cost and the cost of surplus biosolids after treatment were recognized as a loss of benefits.
The cost distribution of different AOPs in different mineralization targets in Europe and the USA range from 0.031 to 0.040 USD/m3. Following an analysis of the entire process, the main expense was chemicals, followed by electricity for fluid recirculation, regardless of the mineralization performance. Overall, for a target of 99% mineralization, chemicals accounted for 90% of the overall cost, while the contribution of electricity accounted for 10%.
Despite this, it is important to point out that the generated sludge volume would represent around 10% of the wastewater treated in photocatalytic processes, generating non-negligible management costs. However, it could be said that the main advantage of heterogeneous processes is the impact of a reduction in chemical costs by avoiding adjusting the pH to 3.
Further pilot plant and industrial-scale studies on real wastewater matrices are required to validate the suitability of the photocatalytic criterion and to compare them with traditional plants.

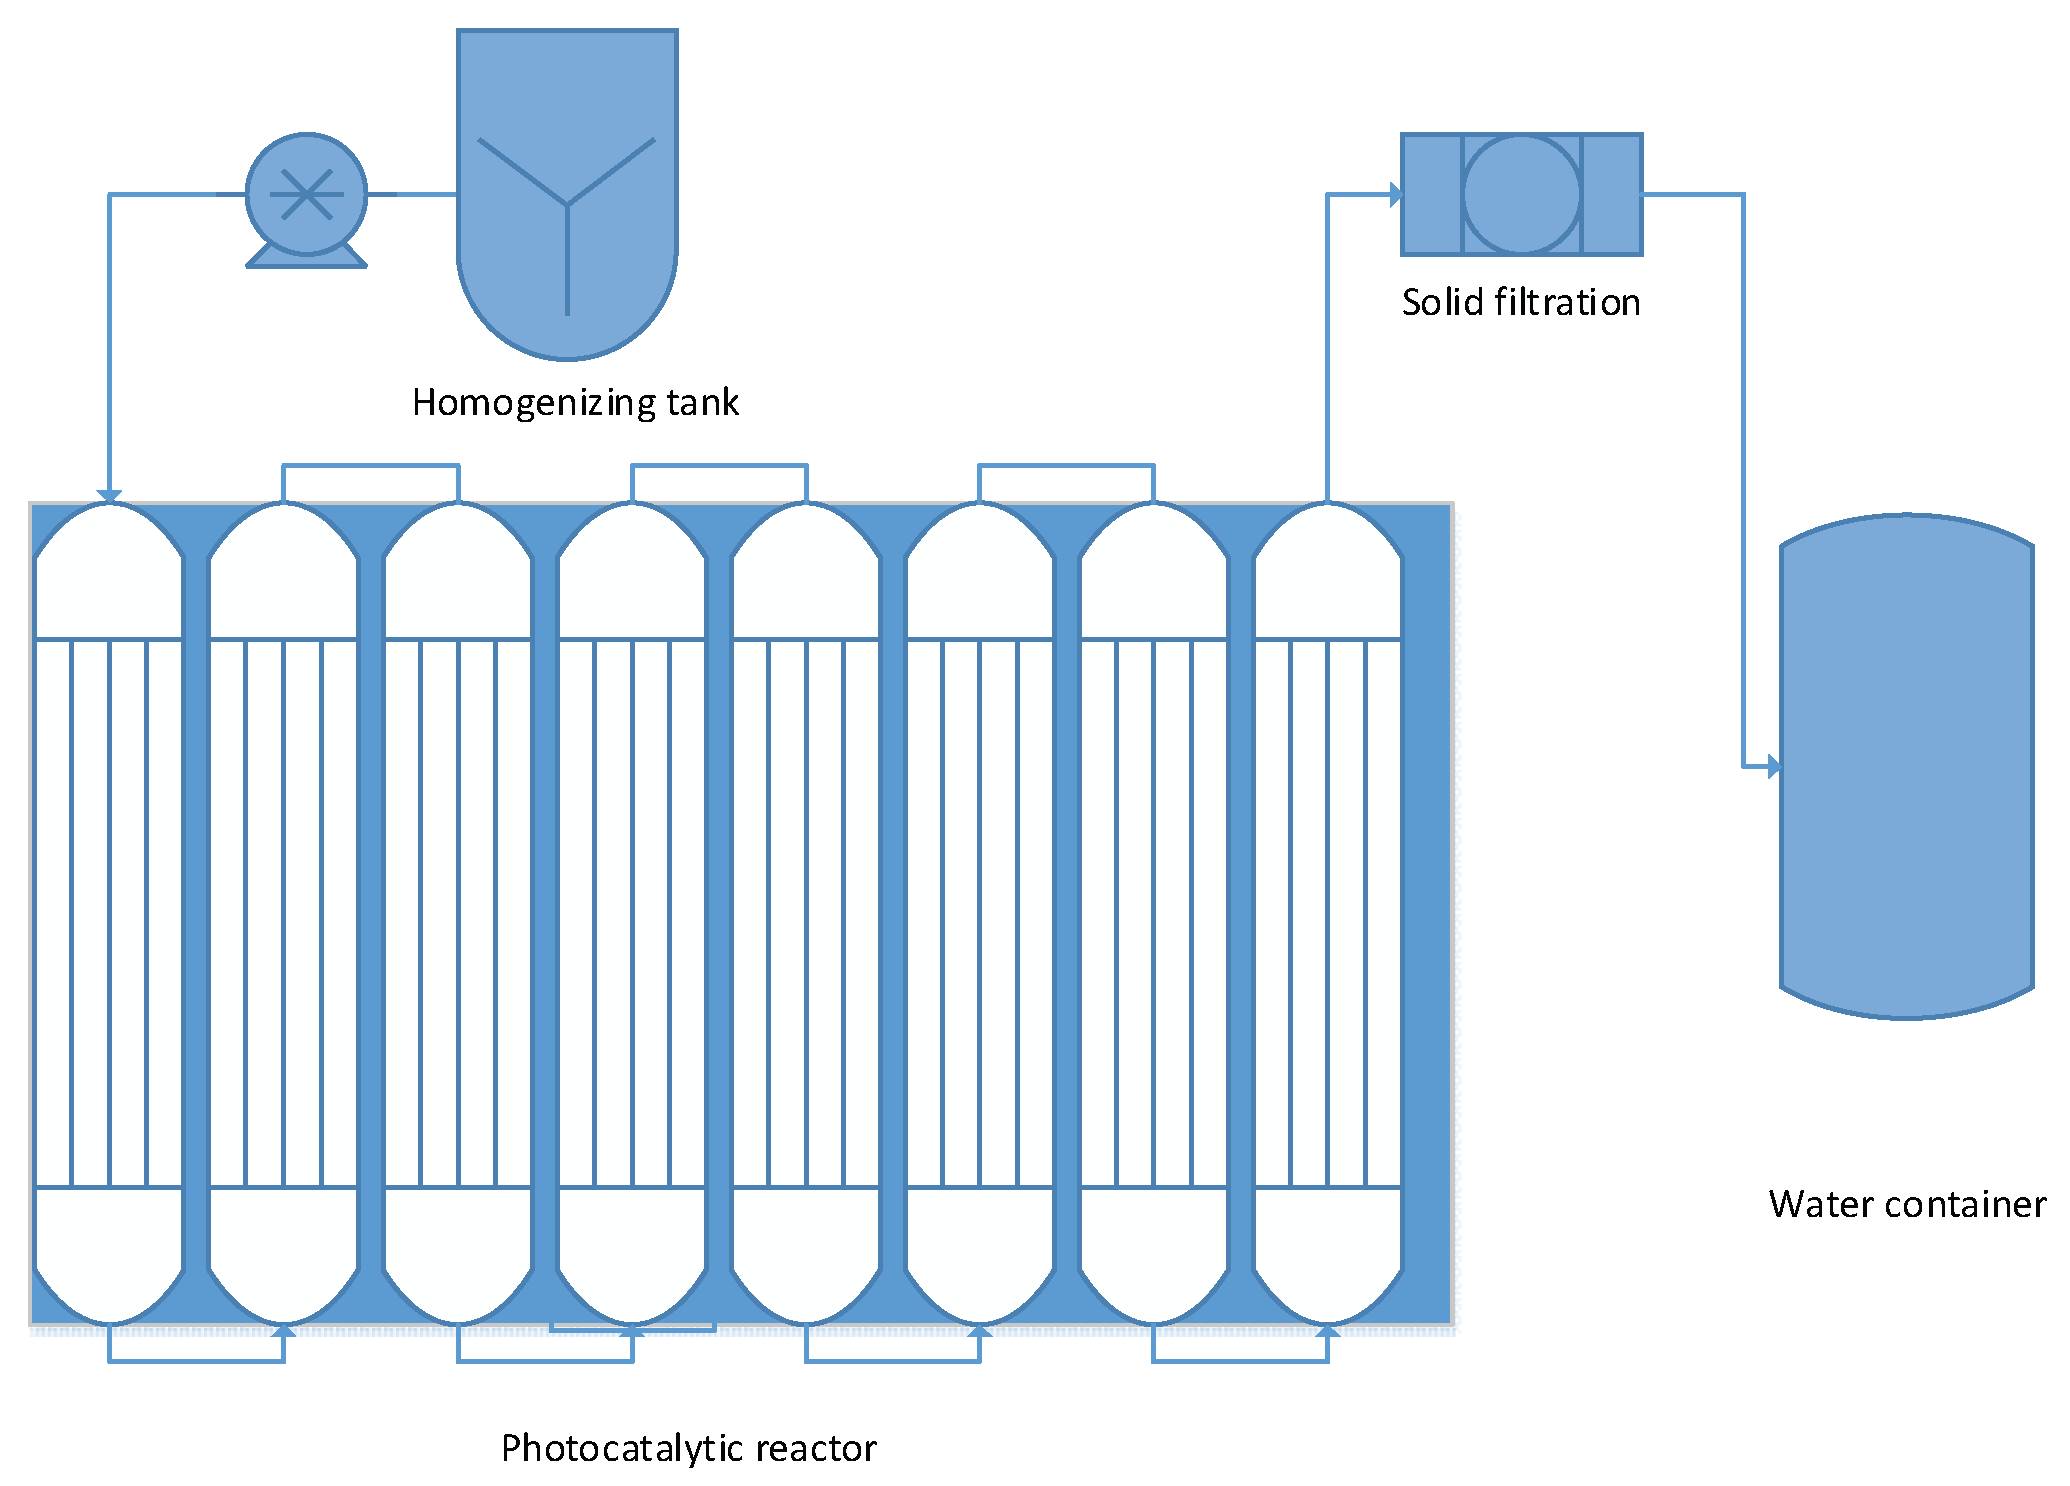
6. Technical Feasibility and Applicability

Most γ-Al2O3-based catalysts exhibit excellent reuse, stability, and biocompatibility for the degradation of organic pollutants. Despite the progress made so far, there are still many challenges for alumina-based catalysts in the degradation of organic pollutants in water. Some points are listed below:
  • Photocatalytic rates and the stability of γ-Al2O3-based catalysts can be further improved. In spite of the high degradation rates achieved so far, the percentage of mineralization can be increased. Furthermore, the stability levels of some catalysts based on γ-Al2O3 are still unsatisfactory due to the loss of active sites and the leaching of metal dopants. Therefore, it is important to optimize catalyst synthesis methods and to develop new types of catalysts based on γ-Al2O3 that are more active and stable.
  • The mechanism involved in the degradation of organic pollutants and the toxicity of the reaction intermediates should be thoroughly investigated. A theoretical study based on DFT could reveal the most preferential sites to be attacked (and the possible reaction intermediates) for target contaminants. In addition, it is necessary to evaluate the ecotoxicity and human toxicity of such intermediates since they can result in even more toxicity than the original moieties.
  • The performances of photocatalysts must be evaluated using actual wastewater. There are important differences between simulated and actual wastewater that make results obtained for simulated wastewater less accurate.
  • Experiments should be conducted on a major scale. Until now, most research on γ-Al2O3-based catalysts for the degradation of organic pollutants has been performed at lab-scale reactors. More attention should be paid to the reactor design, as well as to scaling Figure 12.

7. Conclusions

The methodology of synthesis presented here allowed the formation of staggered-gap heterojunctions, making it easy to transfer electrons from TiO2 to alumina and delaying h+–e recombination time. This synthesis method was fast, efficient, and simple, and due to this, we could call it a green synthesis.
The increase in specific area obtained using γ-Al2O3 favored the activity of the TiO2 photocatalyst since the adsorption of the contaminant molecules on the surface was enhanced, leading to superior photodegradation.
The catalysts treated below 700 °C showed only the characteristic peaks for the gamma phase of alumina and the anatase phase for TiO2. However, the material treated at 800 °C also presented a low-intensity peak of the rutile phase in its 110 plane, which indicated that the γ-Al2O3 stabilized the anatase phase of TiO2 below 800 °C. On the other hand, a decrease in the specific area values was also observed when the temperature increased, as well as changes in pore diameter distribution, showing pore diameters of 30–60 Å for the catalyst treated at 600 °C and pore diameters ranging from 30 to 120 Å for the rest of the materials. In the account of band gap values, two signals were observed: the first was the typical signal of the interaction of Ti with oxygen, and the second indicated that Ti3+ ions were present that were related to oxygen deficiencies. On the other hand, NMR data showed a low field shift for tetracoordinate aluminum, especially for the AT600 catalyst. Al(IV) is related to a deficiency of electrons in the alumina, so it acted as an electron trap in the reaction, agreeing with the results obtained when determining acidity with pyridine sorption since the AT600 material had the largest number of acid sites (314 mmol py/gcat), followed by the AT700 catalyst (270 mmol py/gcat). This parameter was important since acidity is related to oxygen vacancies. Regarding the photocatalytic activity, the AT600 catalyst showed the highest activity since it degraded about 95% of the phenol in 217 min compared to the other catalysts that degraded only about 70% in a range from 255 to 325 min. The same tendency was corroborated with the total organic carbon analysis. It was concluded that treatment temperature largely defined the physicochemical characteristics of the material and, therefore, its activity. Thus, even though all the catalysts started from the same material, differences were observed in the characterizations carried out, as seen in the catalyst treated at 600 °C, which presented the greatest differences in terms of its physicochemical properties and activity.

Author Contributions

C.M.-G., I.R.-V., R.Z., G.d.Á., F.T., B.R.-C., E.V.-R. and A.P.-L. contributed to the writing, review, and editing, and all agreed to the published version of the manuscript. All authors have read and agreed to the published version of the manuscript.

Funding

The authors would like to thank the DAIP of the Universidad de Guanajuato for the support received through the CIIC 236/2021 project derived from the Convocatoria Institucional de Investigación Científica 2021.

Institutional Review Board Statement

Not applicable.

Informed Consent Statement

Not applicable.

Data Availability Statement

Not applicable.

Acknowledgments

The authors would like to thank to CONACYT for the support.

Conflicts of Interest

The authors declare no conflict of interest.

References

  1. Hu, Y.; Li, D.; Sun, F.; Weng, Y.; You, S.; Shou, Y. Temperature-induced phase changes in bismuth oxides and efficient photodegradation of phenol and p-chlorophenol. J. Hazard. Mater. 2016, 301, 362–370. [Google Scholar] [CrossRef] [PubMed]
  2. Eriksson, E.; Baun, A.; Mikkelsen, P.; Ledin, A. Risk assessment of xenobiotics in stormwater discharged to Harrestrup Å, Denmark. Desalination 2007, 2151, 187–197. [Google Scholar] [CrossRef]
  3. Ahmed, S.; Rasul, M.G.; Martens, W.N.; Brown, R.; Hashib, M.A. Advances in heterogeneous photocatalytic degradation of phenols and dyes in wastewater: A review. Water Air Soil Pollut. 2011, 215, 3–29. [Google Scholar] [CrossRef] [Green Version]
  4. Mantilla, A.; Tzompantzi, F.; Fernández, J.L.; Góngora, J.D.; Gómez, R. Photodegradation of phenol in aqueous medium by using Zn/Al+Fe mixed oxides obtained from layered double hydroxides materials. Catal. Today 2010, 150, 353–357. [Google Scholar] [CrossRef]
  5. Mahamuni, N.; Pandit, A.B. Effect of additives on ultrasonic degradation of phenol. Ultrason. Sonochem. 2006, 13, 165–174. [Google Scholar] [CrossRef]
  6. Karunakaran, C.; Dhanalakshmi, R. Semiconductor-catalyzed degradation of phenols with sunlight. Sol. Energy Mater. Sol. Cells 2008, 92, 1315–1321. [Google Scholar] [CrossRef]
  7. Wang, J.; Zhuan, R. Degradation of antibiotics by advanced oxidation processes: An overview. Sci. Total Environ. 2020, 701, 651–669. [Google Scholar] [CrossRef]
  8. Dewil, R.; Mantzavinos, D.; Poulios, I.; Rodrigo, M.A. New perspectives for Advanced Oxidation Processes. J. Environ. Manag. 2017, 195, 93–99. [Google Scholar] [CrossRef] [Green Version]
  9. Ike, I.A.; Linden, K.G.; Orbell, J.D.; Duke, M. Critical review of the science and sustainability of persulphate advanced oxidation processes. Chem. Eng. J. 2018, 338, 651–669. [Google Scholar] [CrossRef]
  10. Ahmed, L.M. Bulk and nanocatalysts applications in Advanced Oxidation Processes. In Oxidoreductase; BoD–Books on Demand: Norderstedt, Germany, 2021; Volume 7, pp. 107–111. [Google Scholar] [CrossRef]
  11. Miklos, D.B.; Remy, C.; Jekel, M.; Linden, K.G.; Drewes, J.E.; Hübner, U. Evaluation of advanced oxidation processes for water and wastewater treatment e A critical review. Water Res. 2018, 139, 118–131. [Google Scholar] [CrossRef] [PubMed]
  12. Vazquez, I.R.; del Angel, G.; Bertin, V. Synthesis and characterization of Sn doped TiO2 photocatalysts: Effect of Sn concentration on the textural properties and on the photocatalytic degradation of 2,4-dichlorophenoxyacetic acid. J. Alloys Compd. 2015, 643, S144–S149. [Google Scholar] [CrossRef]
  13. Thompson, T.L., Jr.; Yates, J.T. Surface Science Studies of the Photoactivation of TiO2, New Photochemical Processes. Chem. Rev. 2006, 106, 4428–4453. [Google Scholar] [CrossRef] [PubMed]
  14. Xi-yao, Y.; Kai, Z.; Luo, X.; He, J. Inlfuence of TiO2 on surface properties of Al2O3. React. Kinet. Catal. Lett. 1992, 46, 179–186. [Google Scholar] [CrossRef]
  15. González, V.; Zanella, R.; del Angel, G.; Gómez, R. MTBE visible-light photocatalytic decomposition over Au/TiO2 and Au/TiO2-Al2O3 sol-gel prepared catalysts. J. Mol. Catal. Chem. 2008, 281, 93–98. [Google Scholar] [CrossRef]
  16. Yang, C.; Wang, Y.; Shih, M.; Chang, Y.; Hon, C. Photocatalytic performance of alumina-incorporated titania composite nanoparticles: Surface area and crystallinity. Appl. Catal. A 2009, 364, 182–190. [Google Scholar] [CrossRef]
  17. Gomez, C.M.; del Angel, G.; Ramos-Ramirez, E.; Rangel-Vazquez, I.; Gonzalez, F.; Arrieta, A.; Vazquez-Zavala, A.; Bonilla-Sanchez, A.; Cantu, M.S. Alumina coating with TiO2 and its effect on catalytic photodegradation of phenol and p-cresol. J. Chem. Technol. Biotechnol. 2016, 91, 2211–2220. [Google Scholar] [CrossRef]
  18. Mechiakh, R.; Meriche, F.; Kremer, R. TiO2 thin films prepared by sol–gel method for waveguiding applications: Correlation between the structural and optical properties. Opt. Mater. 2007, 30, 645–651. [Google Scholar] [CrossRef]
  19. Svagelj, Z.; Mandic, V.; Curkovic, L.; Biosic, M.; Zmak, I.; Gaborardi, M. Titania-Coated Alumina Foam Photocatalyst for Memantine Degradation Derived by Replica Method and Sol-Gel Reaction. Materials 2020, 13, 227. [Google Scholar] [CrossRef] [Green Version]
  20. Cizmic, M.; Ljubas, D.; Rozman, M.; Asperger, D.; Curkovic, L.; Babic, S. Photocatalytic degradation of azithromycin by nanostructured TiO2 film: Kinetics, degradation products, and toxicity. Materials 2019, 12, 873. [Google Scholar] [CrossRef] [Green Version]
  21. Cano-Casanova, L.; Amorós-Pérez, A.; Lillo-Ródenas, M.A. Román-Martínez, Effect of the Preparation Method (Sol-Gel or Hydrothermal) and Conditions on the TiO2 Properties and Activity for Propene Oxidation. Materials 2018, 11, 2227. [Google Scholar] [CrossRef] [Green Version]
  22. Lee, S.Y.; Matsubara, T.; Numata, D.; Serizawa, A. Facile Synthesis of Potassium-Doped Titanium Oxide Nanostructure (KTiOxs)/AlO(OH) Composites for Enhanced Photocatalytic. Catalysts 2021, 11, 548. [Google Scholar] [CrossRef]
  23. Xu, X.; Zu, X.; Ao, D.; Yu, J.; Xiang, X.; Xie, W.; Tang, Y.; Li, S.; Fu, Y. NH3-Sensing Mechanism Using Surface Acoustic Wave Sensor with AlO(OH) Film. Nanomaterials 2019, 9, 1732. [Google Scholar] [CrossRef] [PubMed] [Green Version]
  24. Lee, J.-W.; Jang, Y.-I.; Park, W.-S.; Kim, S.-W.; Lee, B.-J. Photocatalytic and Pozzolanic Properties of Nano-SiO2/Al2O3-TiO2 Powder for Functional Mortar. Materials 2019, 12, 1037. [Google Scholar] [CrossRef] [Green Version]
  25. Roongraung, K.; Chuangchote, S.; Laosiripojana, N. Enhancement of Photocatalytic Oxidation of Glucose to Value-Added Chemicals on TiO2 Photocatalysts by A Zeolite (Type Y) Support and Metal Loading. Catalysts 2020, 10, 423. [Google Scholar] [CrossRef]
  26. Park, Y.; Kim, S.; Kim, J.; Khan, S.; Han, C. UV/TiO2 Photocatalysis as an Efficient Livestock Wastewater Quaternary Treatment for Antibiotics Removal. Water 2022, 14, 958. [Google Scholar] [CrossRef]
  27. Marizcal-Barba, A.; Sanchez-Burgos, J.A.; Zamora-Gasga, V.; Perez Larios, A. Study of the Response Surface in the Photocatalytic Degradation of Acetaminophen Using TiO2. Photochem 2022, 2, 225–236. [Google Scholar] [CrossRef]
  28. Ismail, A.A.; Abdelfattah, I.; Atitar, M.F.; Robben, L.; Bouzid, H.; Al-Sayari, S.A.; Bahnemann, D.W. Photocatalytic degradation of imazapyr using mesoporous Al2O3–TiO2 nanocomposites. Sep. Purif. Technol. 2015, 145, 147–153. [Google Scholar] [CrossRef]
  29. Zhang, C.; Chen, H.; Ma, M.; Yang, Z. Facile synthesis of magnetically recoverable Fe3O4/Al2O3/molecularly imprinted TiO2 nanocomposites and its molecular recognitive photocatalytic degradation of target contaminant. J. Mol. Catal. A Chem. 2015, 402, 10–16. [Google Scholar] [CrossRef]
  30. 30. Rodríguez-Barajas, N.; Becerra-Solano, L.; Gutiérrez-Mercado, Y.K.; Macías-Carballo, M.; Gómez, C.M.; Pérez-Larios, A. Study of the Interaction of Ti–Zn as a Mixed Oxide at Different pH Values Synthesized by the Sol–Gel Method and Its Antibacterial Properties. Nanomaterials 2022, 12, 1948. [Google Scholar] [CrossRef]
  31. Magnone, E.; Kim, M.K.; Lee, H.J.; Park, J.H. Testing and substantial improvement of TiO2/UV photocatalysts in the degradation of Methylene Blue. Ceram. Int. 2019, 45, 3359–3367. [Google Scholar] [CrossRef]
  32. Vargova, M.; Plesch, G.; Vogt, U.F.; Zahoran, M.; Gorbar, M.; Jesenak, K. TiO2 thick films supported on reticulated macroporous Al2O3 foams and their photoactivity in phenol mineralization. Appl. Surf. Sci. 2011, 257, 4678–4684. [Google Scholar] [CrossRef]
  33. Shtyka, O.; Ciesielski, R.; Kedziora, A.; Maniukiewicz, W.; Dubkov, S.; Gromov, D.; Maniecki, T. Photocatalytic reduction of CO2 Over Me (Pt, Pd, Ni, Cu)/TiO2 Catalysts. Top. Catal. 2020, 63, 113–120. [Google Scholar] [CrossRef] [Green Version]
  34. Wang, X.; Cui, J.; Zhang, N.; Song, J.; Fan, X.; Zhao, Z.; Kong, L.; Xiao, X.; Xie, Z. Propane Dehydrogenation over PtSn/Al2O3 Catalysts: Influence of Urea to Al(NO3)3_9H2O Ratio. Catalysts 2022, 12, 157. [Google Scholar] [CrossRef]
  35. Murillo-Acevedo, Y.; Giraldo, L.; Moreno-Pirajan, J.C. Nanoparticles size distribution and phenol photodegradation with TiO2/C support obtained by phosphoric acid activation of palm kernel shell. Microporous Mesoporous Mater. 2020, 304, 109325. [Google Scholar] [CrossRef]
  36. Thommes, M.; Kaneko, K.; Neimark, A.V.; Olivier, J.P.; Rodriguez-Reinoso, F.; Rouquerol, J.; Sing, K.S. Physisorption of gases, with special reference to the evaluation of surface area and pore size distribution (IUPAC Technical Report). J. Pure Appl. Chem. 2015, 87, 1051–1069. [Google Scholar] [CrossRef] [Green Version]
  37. Gómez, C.M.; del Angel, G.; Tzompantzi, F.; Gómez, R.; Torres-Martínez, L. Photocatalytic degradation of p-cresol on Pt/γAl2O3-TiO2 mixed oxides: Effect of oxidizing and reducing pre-treatments. J. Photochem. Photobiol. A Chem. 2012, 236, 21–25. [Google Scholar] [CrossRef]
  38. Wang, H.-L.; Qi, H.-P.; Wei, X.-N.; Liu, X.-Y.; Jiang, W.-F. Photocatalytic activity of TiO2 supported SiO2-Al2O3 aerogels prepared from industrial fly ash. Chin. J. Catal. 2016, 37, 2025–2033. [Google Scholar] [CrossRef]
  39. Escobar, J.; de los Reyes, J.A.; Viveros, T. Sol–gel Al2O3 structure modification by Ti and Zr addition. A NMR study. Stud. Surf. Sci. Catal. 2000, 143, 547–554. [Google Scholar]
  40. Kwak, J.H.; Hu, J.Z.; Kim, D.H.; Szanyi, J.; Peden, C.H.F. Penta-coordinated Al3+ ions as preferential nucleation sites for BaO on γ -Al2O3: An ultra-high-magnetic field 27Al MAS NMR study. J. Catal. 2007, 251, 189–194. [Google Scholar] [CrossRef]
  41. Li, L.D.; Xu, C.Z.; Zheng, M.Q.; Chen, X.H. Effect of B2O3 modified Ag/TiO2-Al2O3 adsorbents on the adsorption desulfurization of diesel. J. Fuel Chem. Technol. 2015, 43, 990–997. [Google Scholar] [CrossRef]
  42. Etacheri, V.; di Valentin, C.; Schneider, J.; Bahnemann, D.; Pillai, S.C. Visible-light activation of TiO2 photocatalysts: Advances in theory and experiments. J. Photochem. Photobiol. C Photochem. Rev. 2015, 25, 1–29. [Google Scholar] [CrossRef] [Green Version]
  43. Kuznetsov, V.N.; Serpone, N. Visible Light Absorption by Various Titanium Dioxide Specimen. J. Phys. Chem. B 2006, 110, 50. [Google Scholar] [CrossRef] [PubMed]
  44. Pham, H.H.; Wang, L.-W. Oxygen vacancy and hole conduction in amorphous TiO2. Phys. Chem. Chem. Phys. 2015, 17, 541–550. [Google Scholar] [CrossRef] [PubMed]
  45. Kuznetsov, V.N.; Serpone, N. On the Origin of the Spectral Bands in the Visible Absorption Spectra of Visible-Light-Active TiO2 Specimens Analysis and Assignments. J. Phys. Chem. C 2009, 113, 15110–15123. [Google Scholar] [CrossRef]
  46. Liu, X.; Truitt, R.E. DRFT-IR Studies of the Surface of γ-Alumina. J. Am. Chem. Soc. 1997, 119, 9856–9860. [Google Scholar] [CrossRef]
  47. Yang, X.; Song, Y.; Cao, T.; Wang, L.; Song, H.; Lin, W. The double tuning effect of TiO2 on Pt catalyzed dehydrogenation of methylcyclohexane. Mol. Catal. 2020, 492, 110971. [Google Scholar] [CrossRef]
  48. Liu, X. DRIFTS Study of Surface of α-Alumina and Its Dehydroxylation. J. Phys. Chem. C 2008, 112, 5066–5073. [Google Scholar] [CrossRef]
  49. Ismail, A.A.; Bahnemann, D.W.; Robben, L.; Yarovyi, V.; Wark, M. Palladium Doped Porous Titania Photocatalysts: Impact of Mesoporous Order and Crystallinity. Chem. Mater. 2010, 22, 108–116. [Google Scholar] [CrossRef]
  50. Nair, S.B.; John, K.A.; Joseph, J.A.; Babu, S.; Shinoj, V.K.; Remillard, S.K.; Shaji, S.; Philip, R.R. Influence of pn junction mechanism and alumina overlayer on the photocatalytic performance of TiO2 nanotubes. Nanotechnology 2020, 31, 275403. [Google Scholar] [CrossRef]
  51. Chowdhury, I.H.; Roy, M.; Kundu, S.; Naskar, M.K. TiO2 hollow microspheres impregnated with biogenic gold nanoparticles for the efficient visible light-induced photodegradation of phenol. J. Phys. Chem. Solids 2019, 129, 329–339. [Google Scholar] [CrossRef]
  52. Ishibashi, K.I.; Fujishima, A.; Watanabe, T.; Hashimoto, K. Quantum yields of active oxidative species formed on TiO2 photocatalyst. J. Photochem. Photobiol. A 2000, 134, 139–142. [Google Scholar] [CrossRef]
  53. Ishibashi, K.I.; Fujishima, A.; Watanabe, T.; Hashimoto, K. Detection of active oxidative species in TiO2 photocatalysis using the fluorescence technique. Electrochem. Commun. 2000, 2, 207–210. [Google Scholar] [CrossRef]
  54. Castro, L.V.; Ortiz-Islas, E.; Manríquez, M.E.; Albiter, E.; Cabrera-Sierra, R.; Alvarado-Zavala, B. Photocatalytic Degradation of Mixed Dyes in Aqueous Phase by MgAlTi and ZnAlTi Mixed Oxides. Top. Catal. 2020, 64, 97–111. [Google Scholar] [CrossRef]
  55. Tzompantzi, F.; Castillo-Rodríguez, J.C.; Tzompantzi-Flores, C.; Pérez-Hernández, R.; Gómez, R.; Santolalla-Vargas, C.E.; Che-Galicia, G.; Ramos-Ramírez, E. Addition of SnO2 over an oxygen deficient zirconium oxide (ZrxOy) and its catalytic evaluation for the photodegradation of phenol in water. Catal. Today 2022, 394–396, 376–389. [Google Scholar] [CrossRef]
  56. Samuel, O.; Othman, M.H.D.; Kamaludin, R.; Sinsamphanh, O.; Abdullah, H.; Puteh, M.H.; Kurniawan, T.A. WO3–based photocatalysts: A review on synthesis, performance enhancement and photocatalytic memory for environmental applications. Ceram. Int. 2022, 48, 5845–5875. [Google Scholar] [CrossRef]
  57. Mengting, Z.; Kurniawan, T.A.; Duan, L.; Song, Y.; Hermanowicz, S.W.; Othman, M.H.D. Advances in BIOX-based ternary photocatalysis for water technology and energy storage applications: Research trends, challenges, solutions and ways forward. Rev. Environ. Sci. Bio/Technol. 2022, 21, 331–370. [Google Scholar] [CrossRef]
Figure 1. Powder X-ray diffraction data of the γ-Al2O3-TiO2 catalyst thermally treated in the 400–800 °C range.
Processes 10 01186 g001
Figure 2. (a) Nitrogen adsorption−desorption isotherms and (b) pore diameter of materials of AT series calcined at different temperatures.
Processes 10 01186 g002
Figure 3. UV-vis diffuse reflectance spectra (a) and Tauc plot (b) for the AT series calcined at different temperatures.
Processes 10 01186 g003
Figure 4. (a). 27Al MAS-NMR spectra for the AT calcined at different temperatures, (b). attenuation of AlIV.
Processes 10 01186 g004
Figure 5. DR-FTIR spectra for adsorption of pyridine for the AT series in the spectral region of 1700–1400 cm−1.
Processes 10 01186 g005
Figure 6. High-resolution micrograph (HRTEM) and fast Fourier transform (FFT) of the respective scanned area (ad) for the AT600 catalyst calcined at 600 °C.
Processes 10 01186 g006
Figure 7. Fluorescence spectra of terephthalic acid during irradiation of the AT600 photocatalyst under UV light for 1.5 h and photolysis.
Processes 10 01186 g007
Figure 8. (a) C/Co vs. time plots for phenol photodegradation after irradiation with UV-vis light, and (b) percentage of degradation on TOC.
Processes 10 01186 g008
Figure 9. Pseudo-first-order kinetics for the photodegradation of phenol for the AT series.
Processes 10 01186 g009
Figure 10. Band diagram for γ-Al2O3 with TiO2 catalysts.
Processes 10 01186 g010
Figure 11. (a) Catalyst reuse study with UV-Vis spectroscopy. (b)TOC analysis.
Processes 10 01186 g011
Figure 12. Proposed design for a pilot plant.
Processes 10 01186 g012
Table 1. Superficial analysis of the samples.
CatalystsSurface Area
m2/g
Total Acidity
(µmol/gcat)
γ-Al2O3 *
Crystallite Size
nm
Anatase +
Crystallite Size
nm
Dp
(Å)
Vp
(cm3/g)
AT4003081404.883.9550–650.51
AT5002661724.843.93600.46
AT6002623144.823.95450.41
AT7002322704.793.96500.40
AT8001792604.833.97650.39
* calculated based of the 311 plane of γ-Al2O3. + calculated based of the 101 plane of anatase phase of TiO2. Dp: pore diameter; Vp: pore volume.
Table 2. Band gap energy (Eg), half time, and apparent first-order reaction constant for the AT series.
CatalystsBand Gap
Eg
(eV)
kapp
×10−3
t1/2
(min)
ab
AT4003.32.302.1270
AT5003.52.352.2255
AT6003.42.402.5217
AT7003.42.502.1270
AT8003.352.401.8325
Publisher’s Note: MDPI stays neutral with regard to jurisdictional claims in published maps and institutional affiliations.

