Article

Assessment of the Quality Losses of Cantaloupe Fruit during Transportation

by
Mostafa M. Azam
1,2,*,
AbdelGawad Saad
3 and
Baher M. A. Amer
1,4
1
Department of Agricultural Systems Engineering, College of Agricultural & Food Sciences, King Faisal University, P.O. Box 420, Al-Ahsa 31982, Saudi Arabia
2
Agricultural Engineering Department, Faculty of Agriculture, Menofia University, Shibin El-Kom 32511, Egypt
3
Agricultural Research Center (ARC), Agricultural Engineering Research Institute (AEnRI), Dokki, Giza 12311, Egypt
4
Agricultural Engineering Department, Faculty of Agriculture, Cairo University, Giza 12613, Egypt
*
Author to whom correspondence should be addressed.
Processes 2022, 10(6), 1187; https://doi.org/10.3390/pr10061187
Submission received: 26 May 2022 / Revised: 8 June 2022 / Accepted: 12 June 2022 / Published: 14 June 2022
(This article belongs to the Section Food Process Engineering)

Abstract

:
Fruit quality is a crucial factor in affecting shelf-life and purchase choice for customers. Protecting the quality of cantaloupe fruits in the chain from harvest to marketing is a very important process. The objective of this study was to investigate the dynamic characteristics of cantaloupe fruit during excitation, to investigate the effect of vibration strength on the mechanical characteristics of cantaloupe fruit, and to show the effects of this strength on the mechanical damage of cantaloupe. Experiments were performed to measure the dynamic behavior of cantaloupe fruit during transportation and to evaluate the dynamic behavior of the packaging and the damage to the cantaloupes due to transient vibration during transportation. The results show that using the paper pulp tray packing method reduces cantaloupe damage and improves their quality during harvest and post-harvest processes. The range of resonance frequencies is important for the transporting of cantaloupes; a higher starting resonance is an indication of a stiffer cantaloupe bottom, and the paper pulp tray shifts the resonance frequency when compared to volume packing methods. Another interesting observation in this study is that a fruit with a high internal damping capacity is not as injured by exciting vibrations as a fruit with a low damping capacity, even if its natural frequency falls within the range of excitation.

Graphical Abstract

1. Introduction

Fruits and vegetables are vital for humans and play a fundamental role in preserving life. The increasing awareness among consumers about the safety and quality of fruits and vegetables has pushed the government to play an effective role in ensuring product safety. At the same time, the food industry is operating in a complex and changing economic environment. If businesses want to survive, they must stay the forefront of food safety monitoring to keep perishable fruits and vegetables fresh. Consequently, the prediction of shelf life losses has become one of the main problems in food logistics [1].
The primary goal of producers and researchers is to reduce the loss of quality in fruits and vegetables during processing. The amount of discarded agricultural materials is estimated to be about 30–40% due to damage that occurs in the chain between the producer and the consumer [2]. Fruits and vegetables are exposed to various types of mechanical forces during harvesting, storage, and transportation. These include shocks, vibrations, abrasion, bruises, and cuts from sharp edges. Several research on the effects of various pressures on fresh fruit have been conducted [3,4]. Especially during transportation, fruits and vegetables move uncontrollably in their packages. The main critical loss points where the field, transportation, and market display, with total losses in the districts ranging from 17.2 to 33.3% [5].
The duration and intensity of shaking, in connection with the magnitude of force repeated and displacement determine the decay of fruits and vegetables. When the forces exceed certain limits, the fruits are damaged and then lose their quality. As far as transportation is concerned, much attention has been paid to delicate fruits such as apples. Depending on the type of truck, the packaging, and the position of the container in the column, up to 80% of apples can be damaged during simulated truck transit [6]. Damage due to transport vibration has also been studied in other fruits and vegetables, e.g., peaches [7,8,9], apricots [10], potatoes [11,12], tomatoes [5,13,14], grapes, strawberries [15], and apples [16,17,18,19,20].
The fact that these damages are noticed in the market means a great financial loss in incurred. In many cases, the physical damage leads to physiological changes in microorganisms that can increase the deterioration of sensitive products.
During transport, round fruits and vegetables are especially twisted by vibrations. The repeated shifting of fresh fruit and vegetables results in softening and bruising. Another reason for damage is the sharp corners of the crates. Abrasion or vibration causes pressure marks on the rough surface of fruits and vegetables, or contact with other produce. Mechanically damaged fruit loses moisture quickly. Damaged fruit is attacked by viruses and loses its quality. Damage to fruit by vertical vibration is related to the transport characteristics of vehicles, as well as the conditions of roads and crates [21,22,23]. The extent of bruising to fruit during transport depends on the frequency, amplitude, and duration of the vibration applied and the initial condition of the fruit [10]. The action of vibration damages fruits more than impaction [24]. Fruits were damaged on unpaved roads (laterite) while packages were being transported from farms and harvesting areas to regional truck terminals, while the damage incurred on paved roads was minimal [25].
Vibration injury can also cause discoloration of the fruit’s surface and fresh wounds that can promote pathogen penetration [26]. Most deformations occurred at frequencies of 10~25 Hz [27]. The extent of injury is also affected by acceleration [15]. As the transport speed increases, the vibration magnitude and damage to packed fruits increases [25]. Injuries may be caused by rough handling during loading, inadequate packing and excessive vibration during transportation, or the cargo shifting during transportation [28]. The quality losses of fresh fig fruits were lower when they were upside-down in the crates during transportation [29].
Transportation is very important for the distribution process. Therefore, transportation and its related problems affect the quality and efficient distribution of fresh produce. It is commonly claimed that for fruits and vegetables in the tropics, losses of 50 to 70% are common between rural production and urban consumption [30,31].
In particular, it has been reported that the basic mechanisms involved in fresh fruit damage are shocks and vibrations, to which individual fruits are subjected when vehicles pass abrupt changes in road profile [13,32,33,34,35]. Vibrations caused by transportation are influenced by road roughness, the distance travelled, travel speed, packaging, and some truck characteristics such as the suspension and number of axles [16].
Understanding the behavior of fruits and vegetables under static and dynamic loads provides useful information for reducing mechanical damage and improving the quality of fresh fruits and vegetables during transportation, because the damage to fresh fruits and vegetables due to mechanical forces is one of the most important causes of quality loss [32,36,37,38,39,40].
The bruises are mostly caused by impacts during the handling, packing, and transportation of fruits and vegetables. During the transportation and handling of fruits and vegetables, dynamic stresses cause by far the most damage incurred due to bruises, as these stresses are more frequent and stronger than static stresses [41,42].
Fruits and vegetables are damaged by vibrations and impacts during transportation, especially for those with a soft pericarp. Mechanical damage during truck transport, including abrasions and bruises, degrades quality to such an extent that truck transport can become problematic. In Japan, fresh fruit losses during transportation and distribution increased by 17% and vegetable losses by 10% in 2006 [43]. Fruit must therefore be adequately cushioned in packaging to protect it from vibration and impact. This is particularly true for perishable fruits and vegetables such as cantaloupes [4,44], loquats [45], and peaches [7,8,9]. Domestic fruit is mostly carried by truck, which uses a variety of containers, such as corrugated containers and cushioning materials.
Apple consumers are becoming more discerning. Mechanical damage, such as bruising, abrasions, cuts, and punctures, is permanent and accumulates during cargo handling. The inevitable result of mechanical damage is inferior and poor-quality fruit and thus lower revenues for growers and packers [46,47].
The objective of this study was to investigate the dynamic characteristics of cantaloupe fruit during excitation, in order to investigate the effect of impact and vibration strength on the mechanical characteristics of cantaloupe fruit (firmness) and to show the effects of this strength on the mechanical damage of cantaloupe fruit.

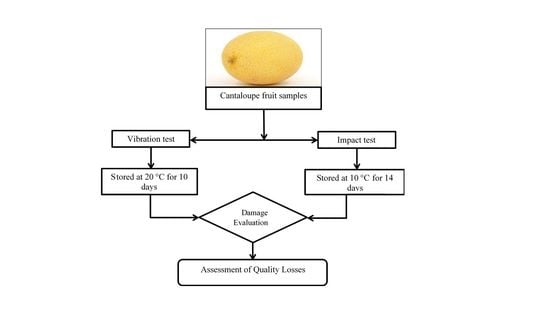
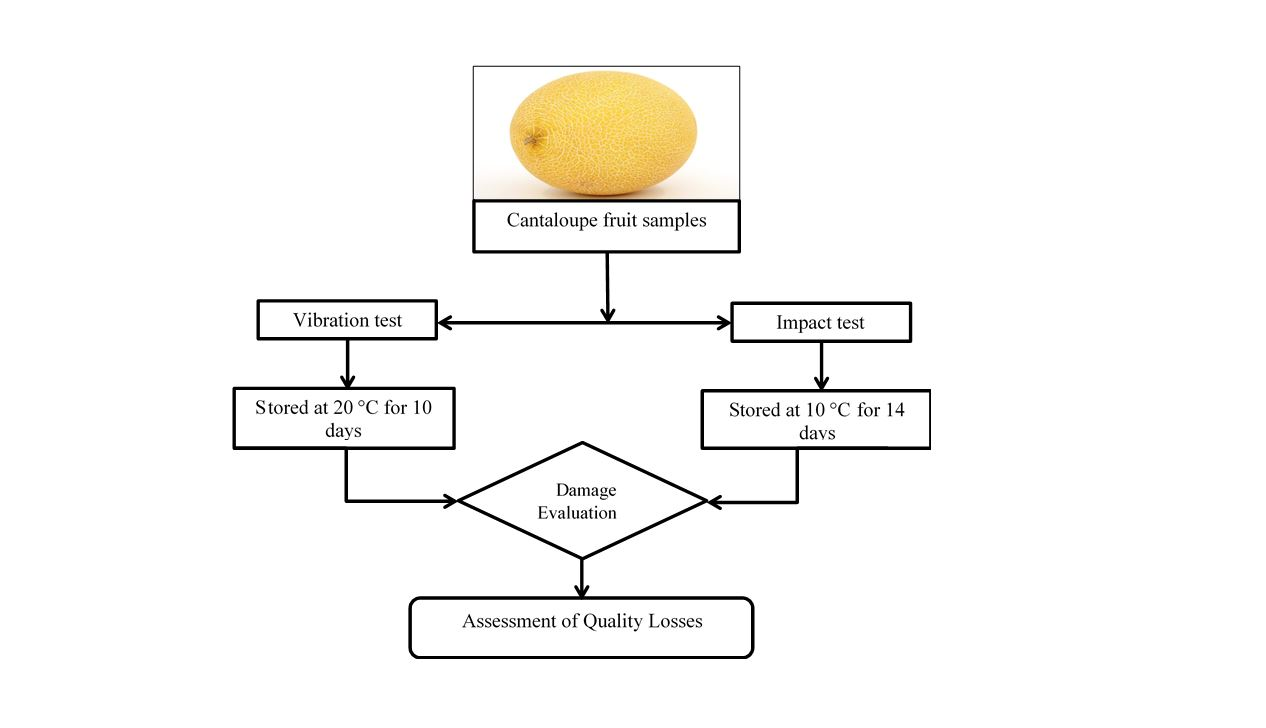
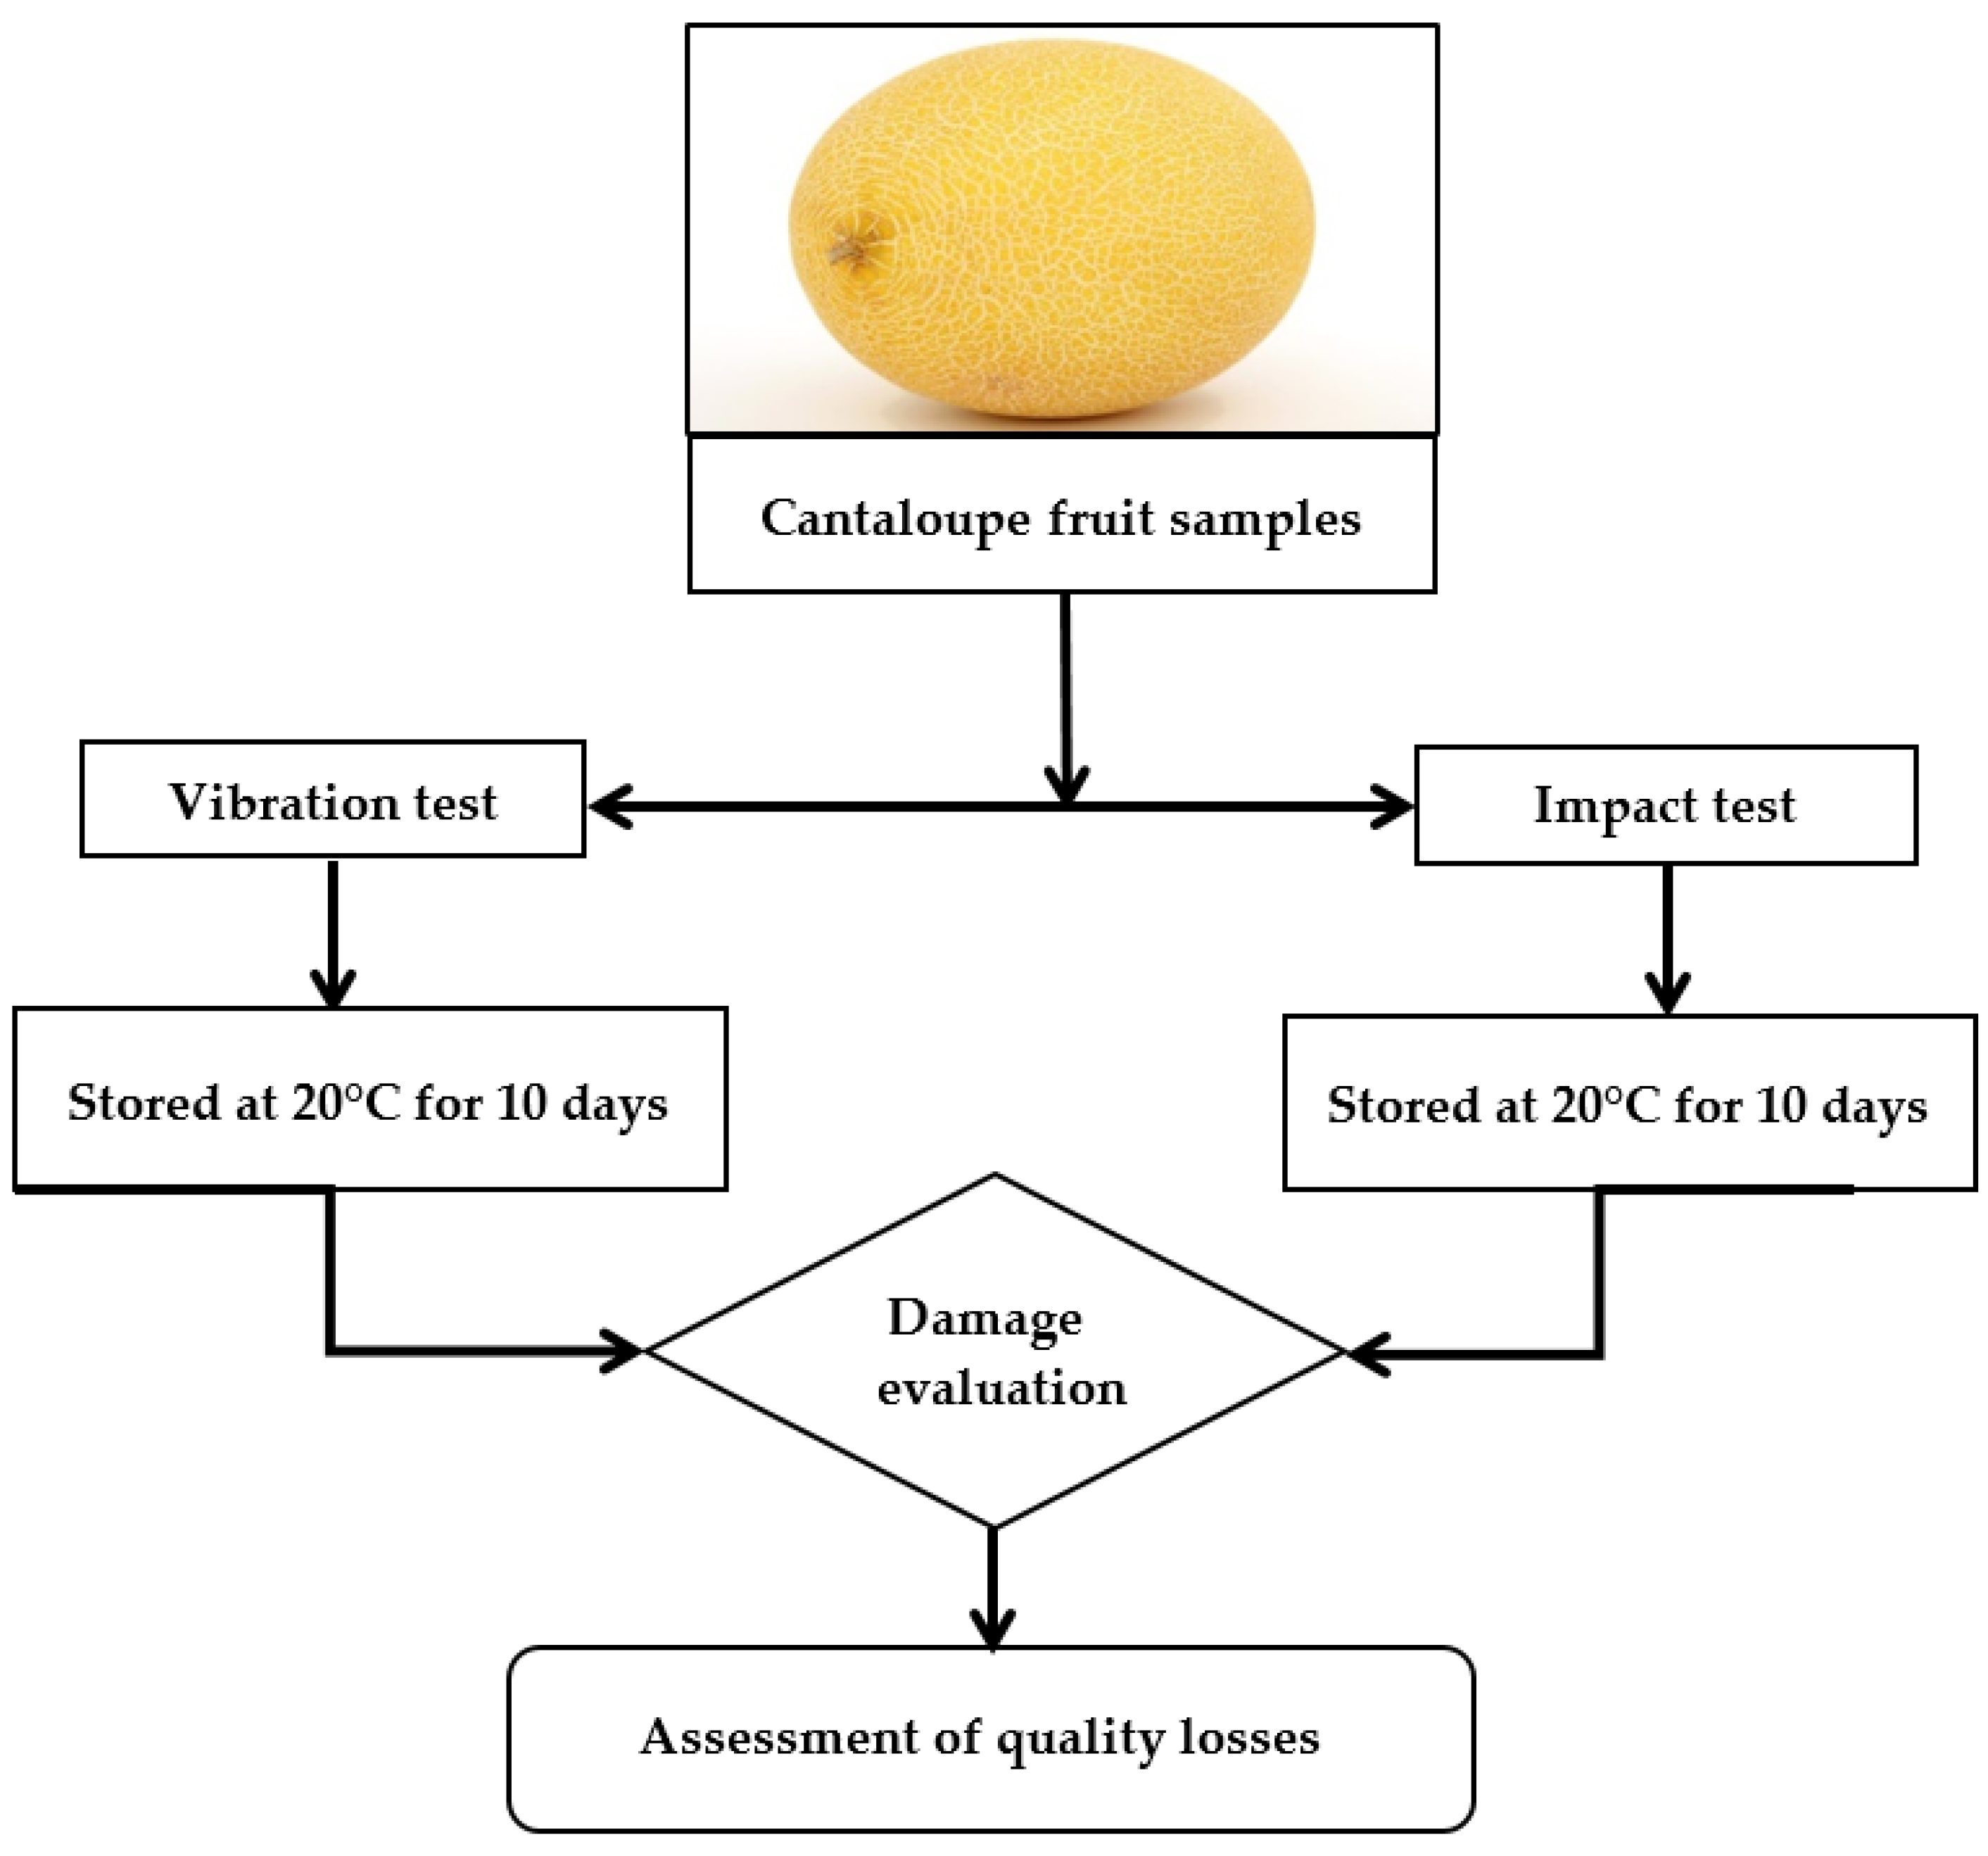
2. Materials and Methods
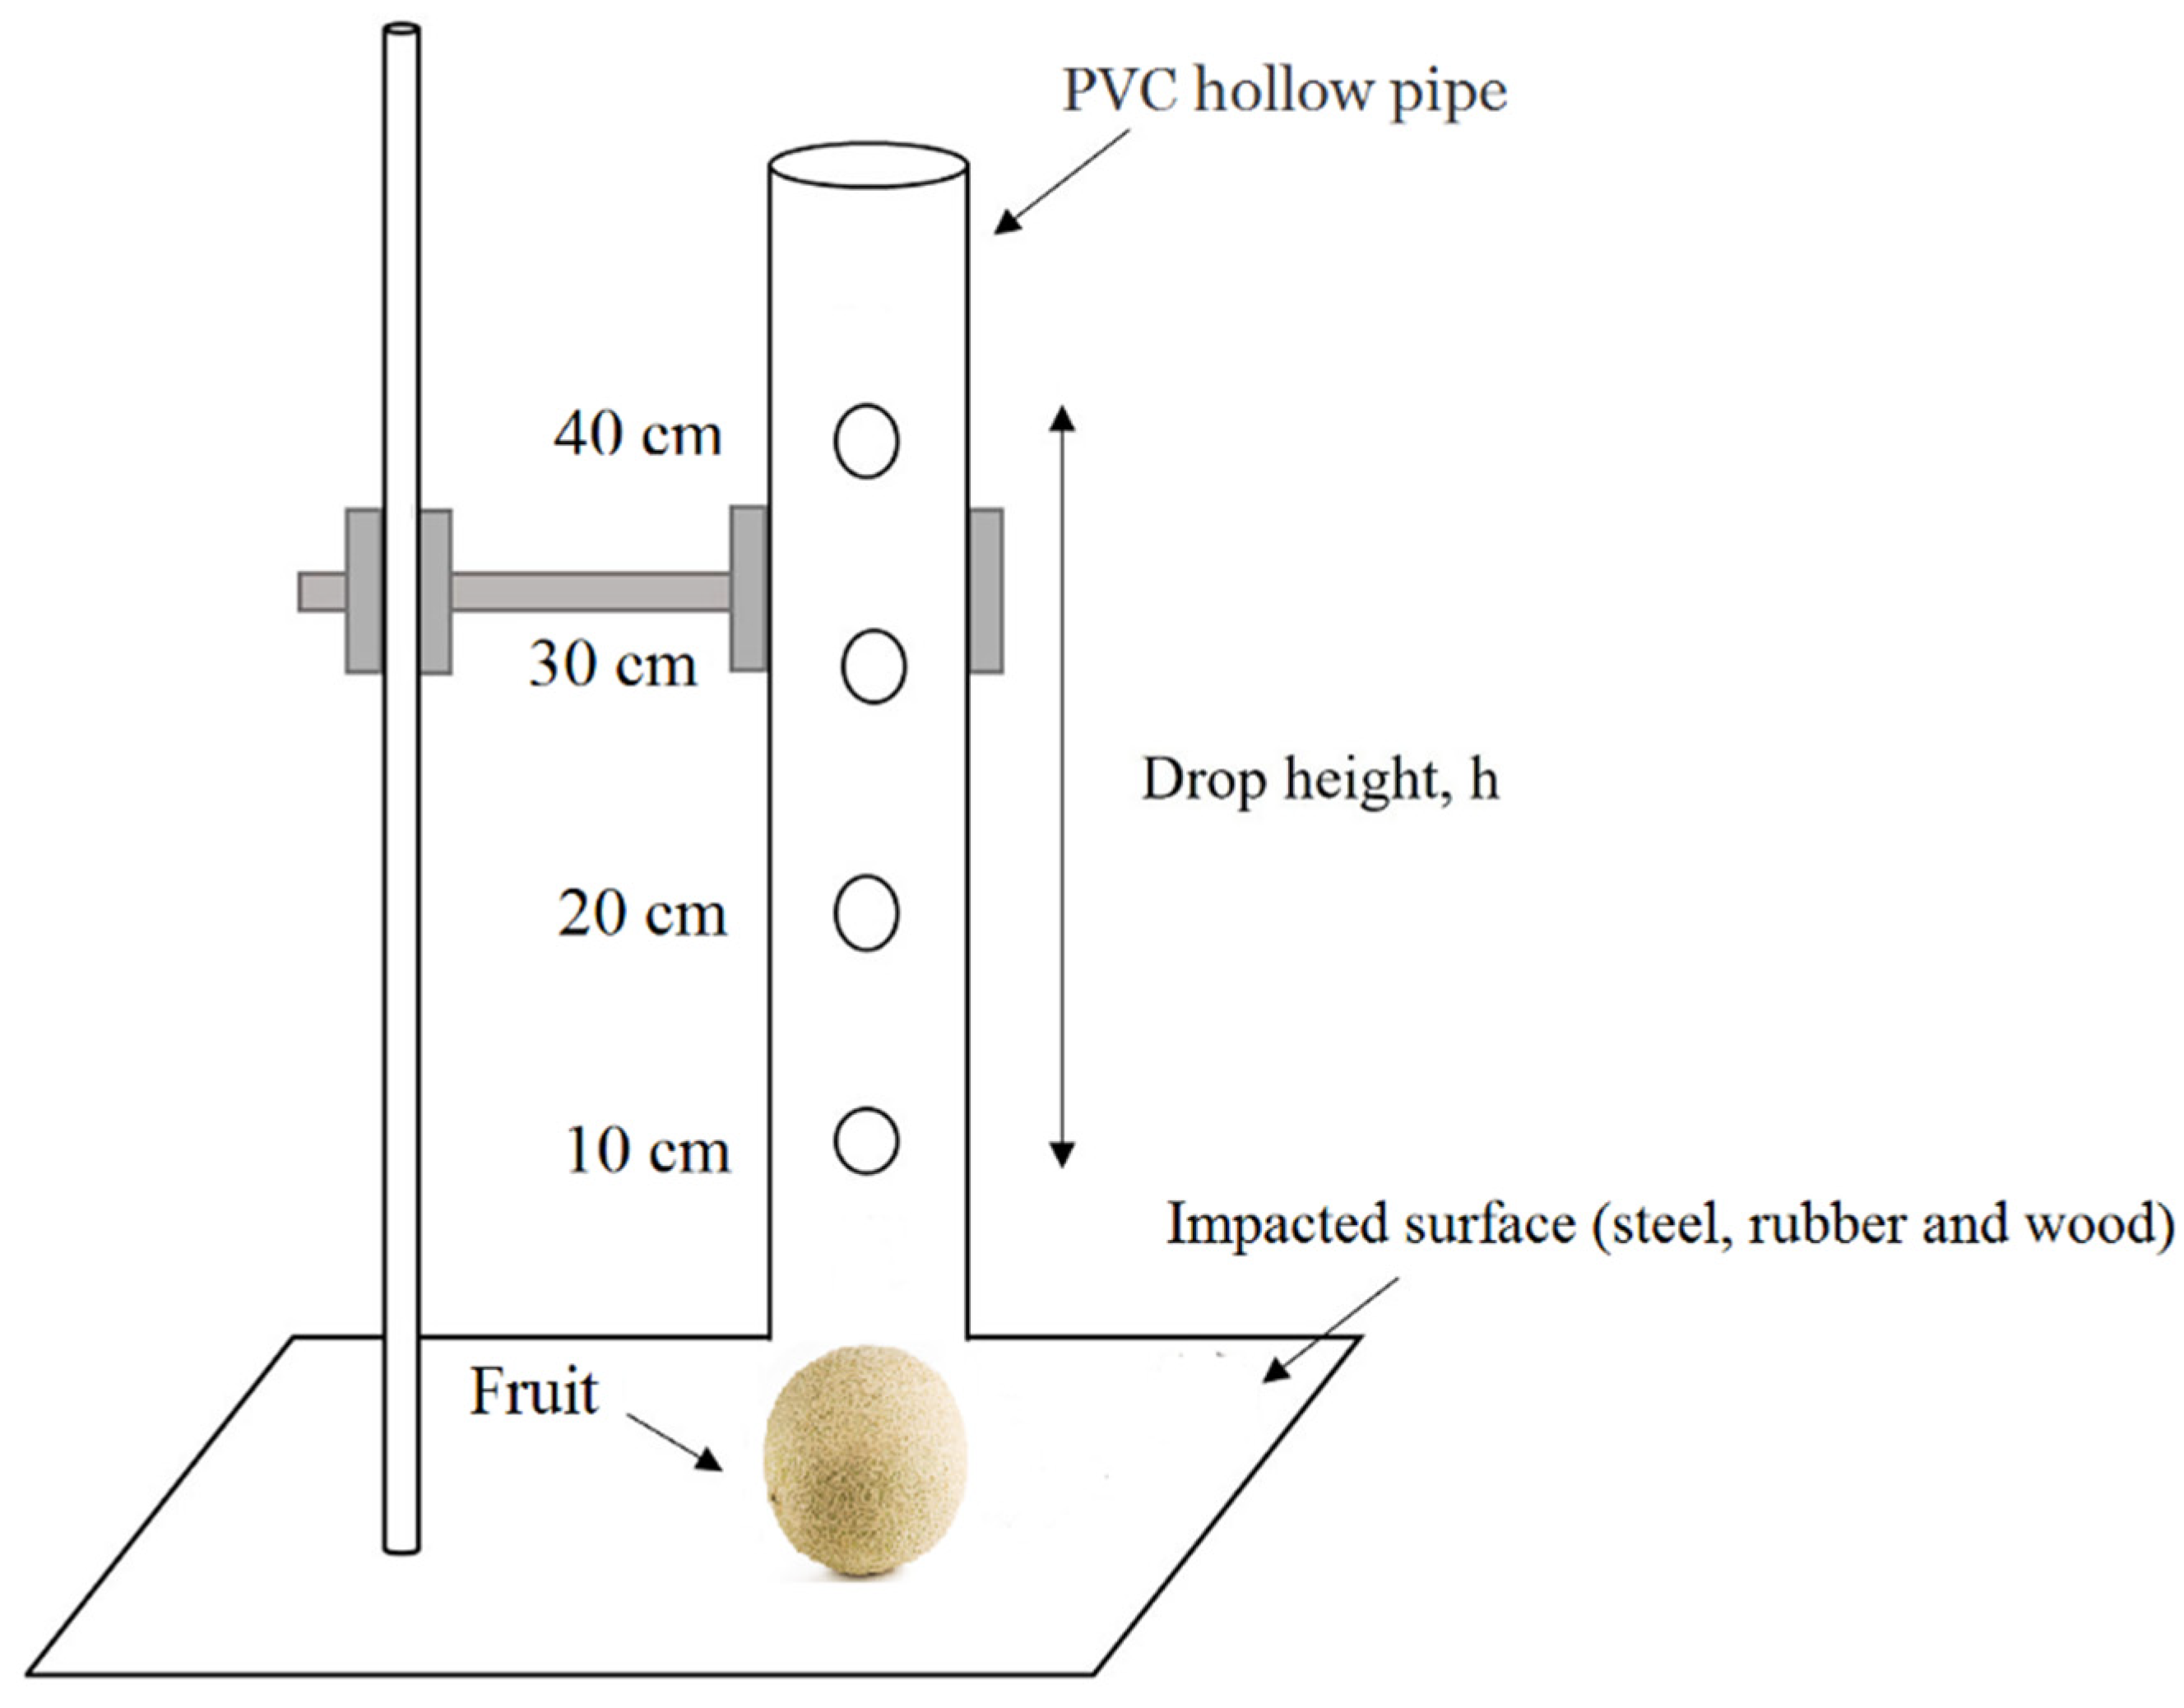
Cantaloupe (Galia variety) samples of commercial maturity were carefully selected from a private farm and orchard in Menofia, Egypt. Fruits without external surface defects were chosen after harvest and placed in corrugated cardboard containers with paper pulp trays in an orchard. This procedure was followed to minimize any bruising during transport of the samples to the laboratory. All initial measurements were taken on the same day after carefully transferring samples to the laboratory at the Agricultural Engineering Department, Faculty of Agriculture, Menofia University. Following that, cantaloupe fruits were tested using several experimental setups (impact and vibration) (Figure 1).

2.1. Impact Testing

The impact test was carried out using a drop test procedure, which included a free-fall of fruit via a PVC hollow tube for each of the impacted surfaces (steel, rubber, and wood) at a height of 10 cm (low) and 40 cm (high), as shown in Figure 2.
All the bruised locations on fruits were marked after the drop test to make bruise recognition easier during measurements. Using the equation presented by [48], the impact energy (Joule) resulting from drop impact was calculated:
Impact Energy = W × h
where W is the weight of fruit (N) and h is the drop height in (m). The impacted fruits were sliced from the middle of the bruised area to perform bruise measurements. The presence of visibly bruised tissue on the designated area of the fruit was used to identify bruising. The bruise diameter (D) and depth (t) were measured using a digital caliper. The bruise area (cm2) was used to represent the magnitude of the bruises [49].
B a r e a = π 4   D 2  
The volume of the bruise (cm3) was calculated using Equation (3) [50]:
B V o l u m e = π 6   D 2   t
To evaluate bruise formation and quality changes in the fruits, the samples were separated and kept at 10 °C (85 ± 5% relative humidity) at 2 day intervals for 10 days. The incidence of bruising and other qualitative changes in the fruit were observed visually.
For each test, the harm was defined as the observable damage to the human eye after 24 h (Figure 3). Abraded samples (those having surface abrasion damage to the skin) and flesh damage samples were separated from each test, and their percentages were calculated using the relevant weights in terms of the mechanical damage to the sample.

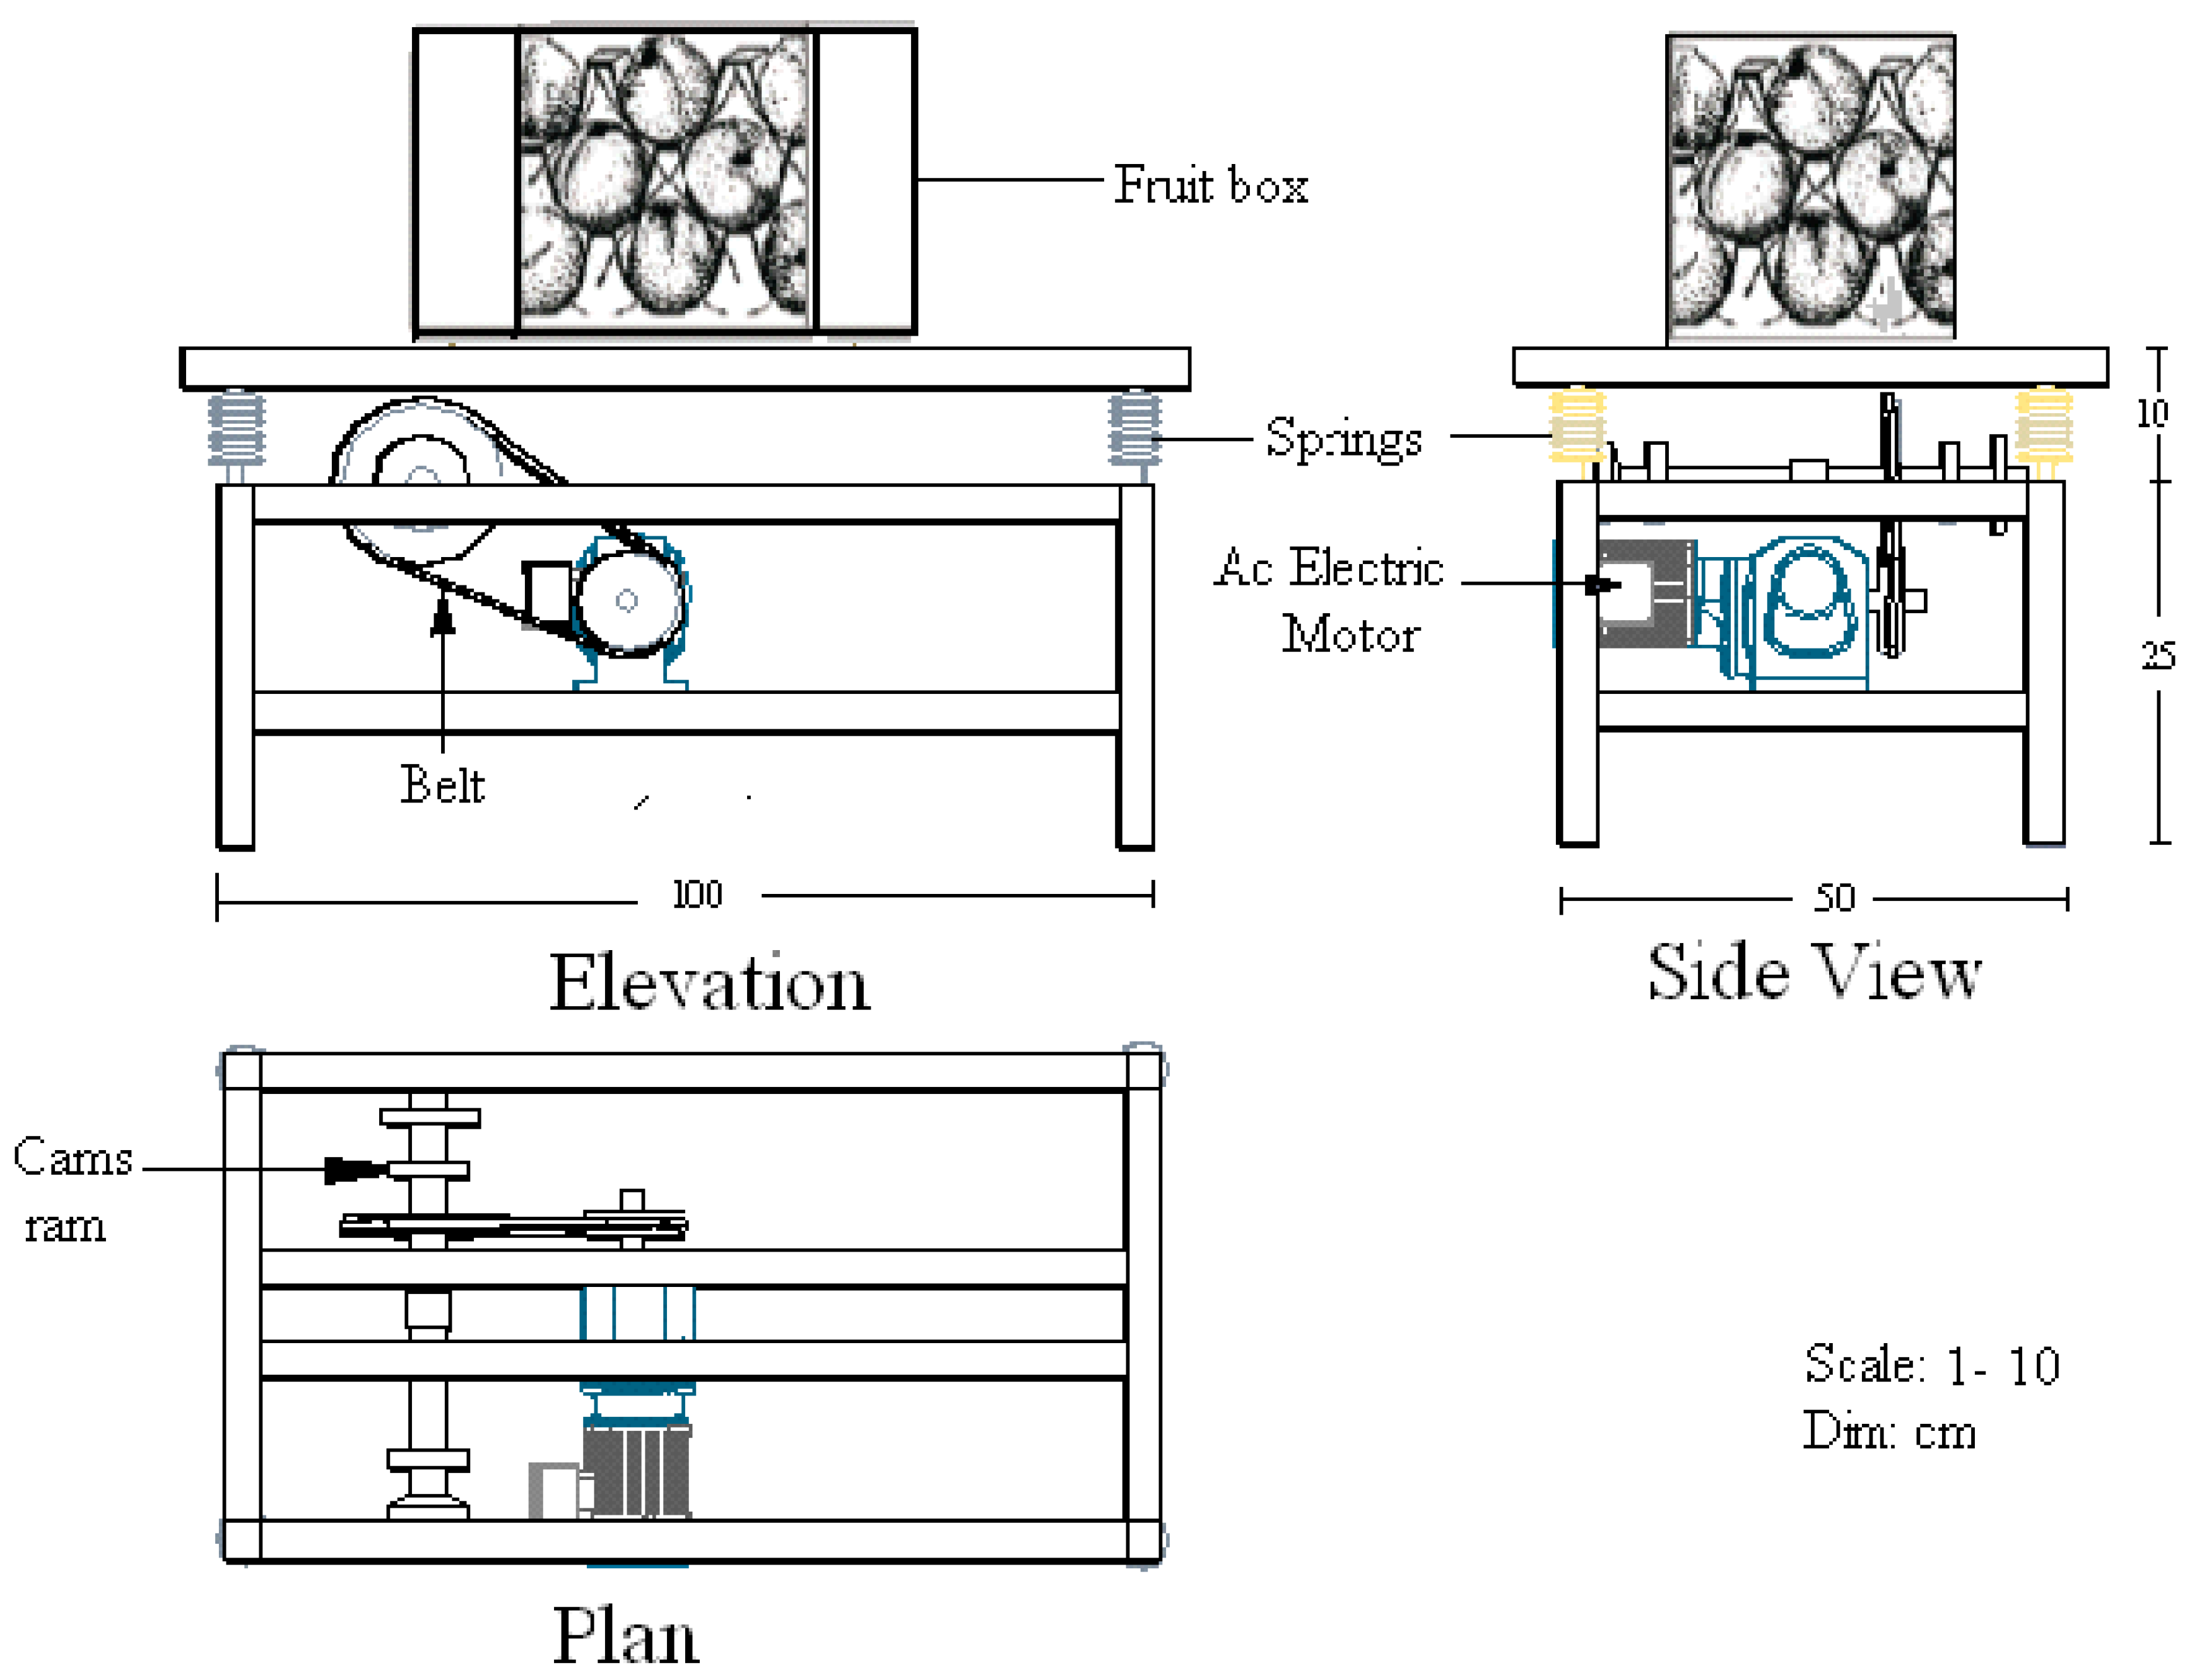
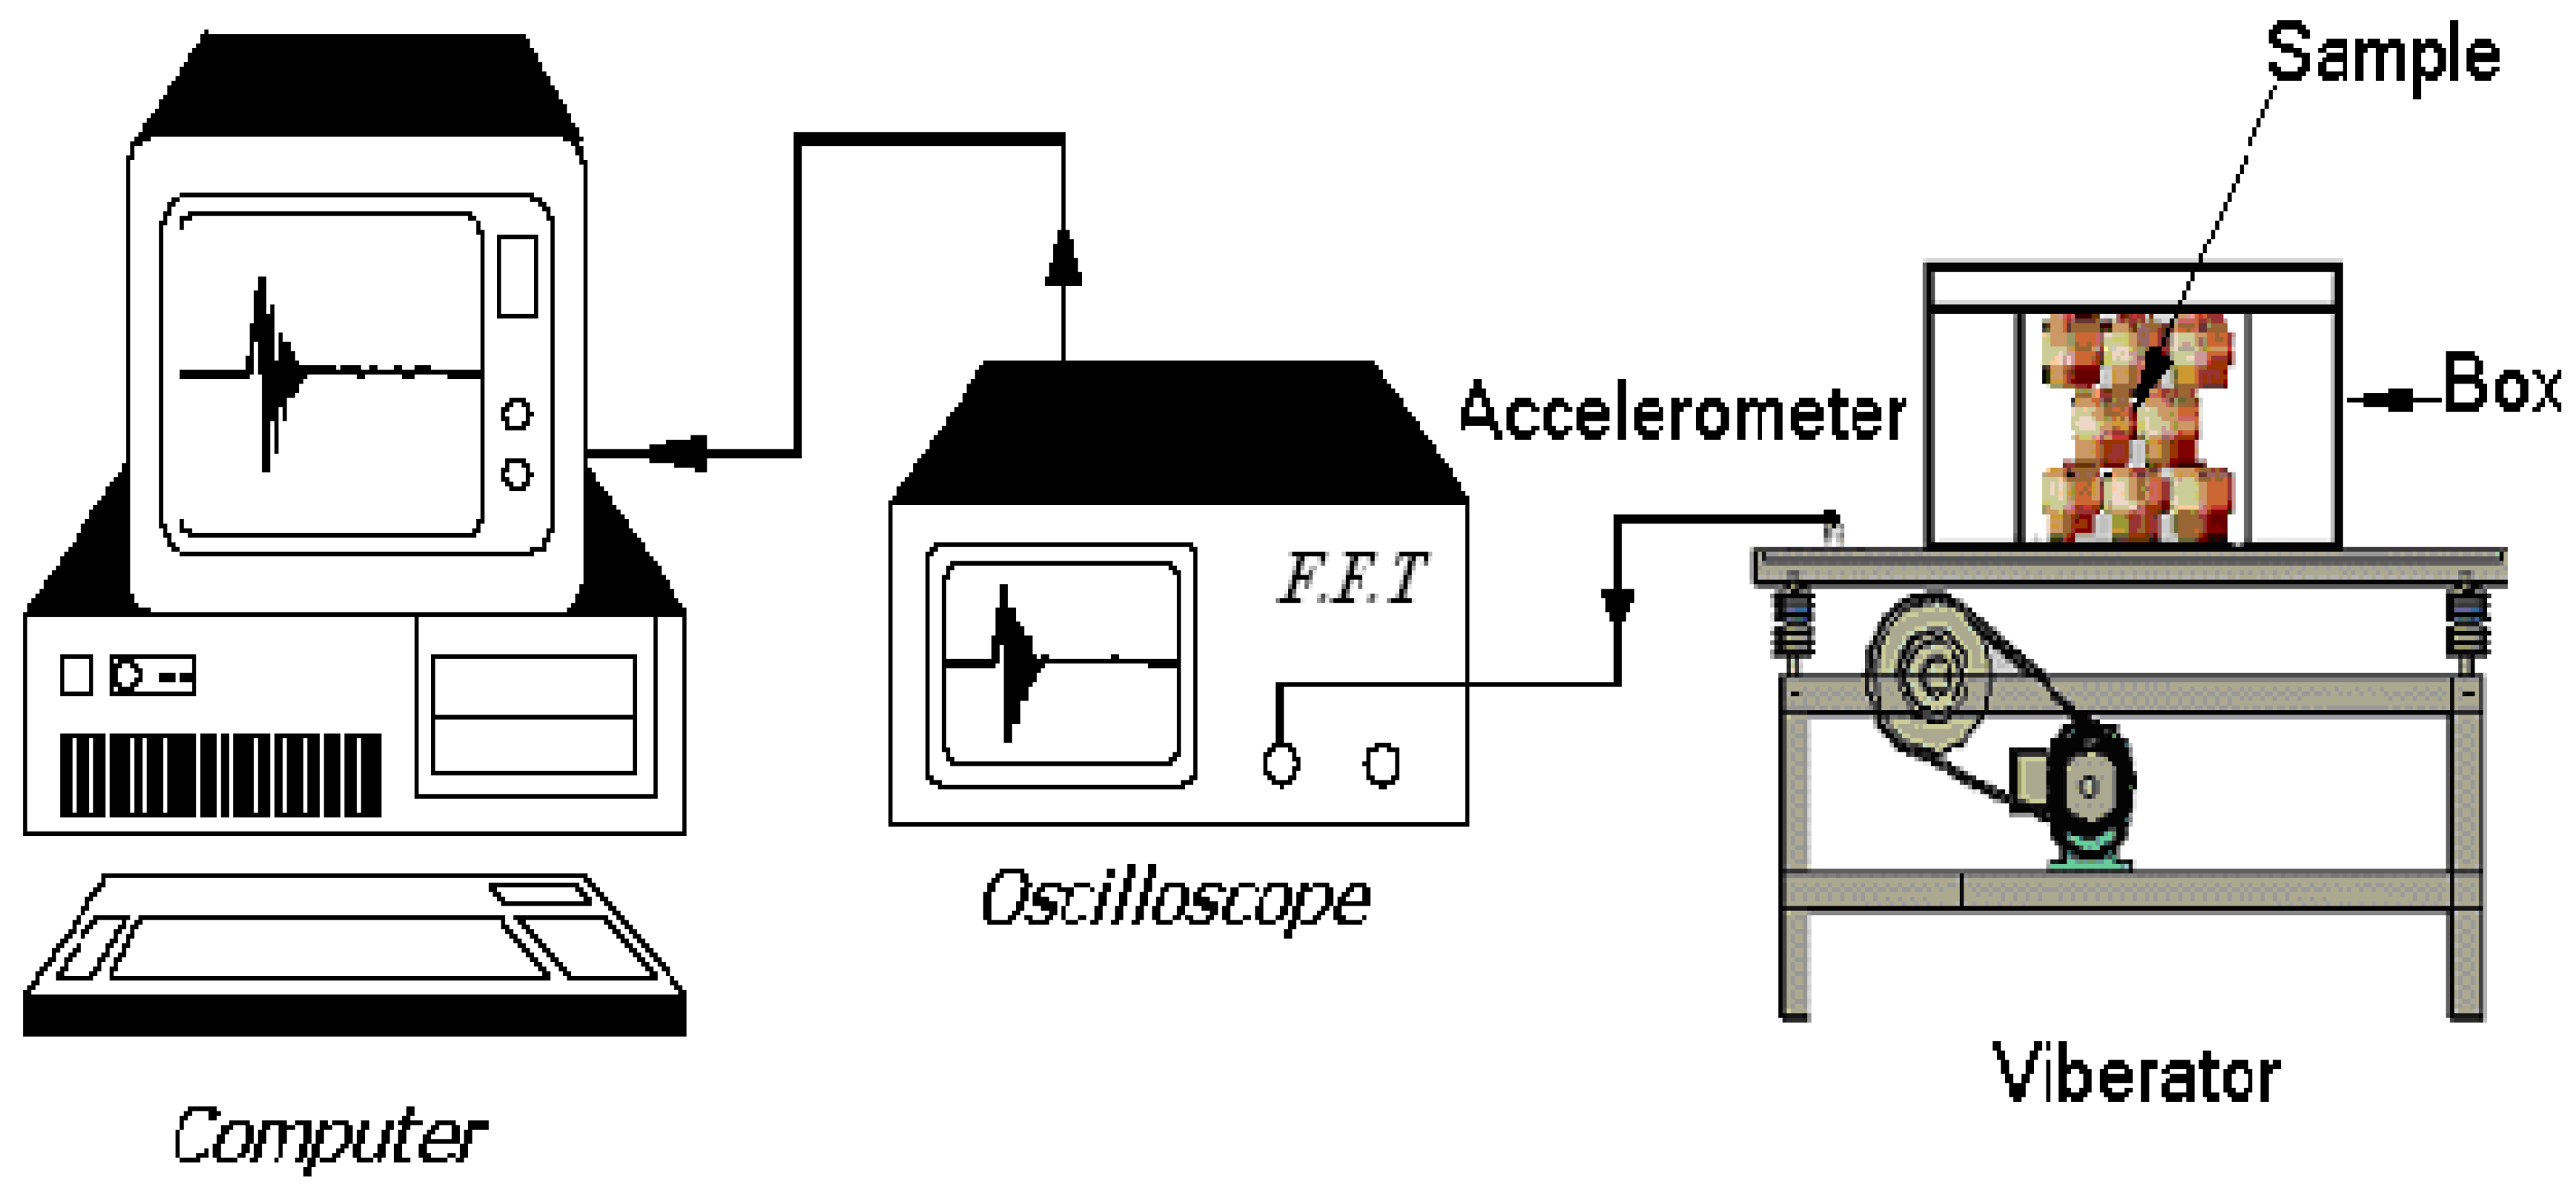
2.2. Vibration Testing

This study was conducted to evaluate the effects of vibration frequency, vibration acceleration, packing method, and vibration duration on mechanical damage during the transportation of cantaloupe. The study was conducted in two stages. First, the vibration frequency and vibration acceleration were measured using the laboratory vibrator, which simulates road transport under laboratory conditions. The analysis of the spectrum of vibration frequency and acceleration distribution was used to investigate the effects of some factors on mechanical damage during cantaloupe transport. Secondly, a wide range of vibration frequencies was measured for all the packaging methods used in this study, which are commonly used in transportation.
The samples were vibrated in the laboratory with a random force vibration simulator. Piezoelectric accelerometers and a pulse analyzer with software to measure the OMA, utilizing FDD and EFDD, were used to measure the dynamic responses. The impact of different packaging on damage reduction was studied. The dynamic test series’ experimental approach is as follows:
Cantaloupe samples were treated to three distinct vibration methods (50,100, and 200 Hz). The power spectral density and acceleration parameters that affected the properties of the samples were evaluated.
The mechanical properties of cantaloupe fruit were measured to show the effect of vibration levels on its properties.
All the samples of cantaloupe were exposed to the vibration frequency, the dynamic response analysis utilizing FDD and EFDD was performed using the paper pulp tray and pattern packing, and this was then compared to the case volume packing. The effect of the different packaging on the bruising of fruit and the damping ability of cantaloupe in terms of its effect on the bruising damage were investigated.
The vibration simulator used in this study was identical to that described by Khodaei et al. [10]. A laboratory vibration simulator consists of a steel body with a table attached to it and four springs connecting the table to the body, as shown in Figure 4. A laboratory vibration simulator driven by an electric motor (1 hp and 1450 min−1) converts the motion into groups of through belts and finds the four cams that give the horizontal motion, while the vertical motion is provided by the four springs attached to the table, resulting in only vertical vibrations. The motor was utilized to provide amplitudes and frequencies that covered a truck’s usual range, as well as higher frequencies up to 200 Hz. Undamped forced vibrations were produced by an actuation system with adjustable springs on the table, which produced only vertical vibrations. The response of the sample was measured by a lightweight piezoelectric accelerometer, which was attached to the opposite direction of the vibration tables. The accelerometers were wired into a charge amplifier (Brüel& Kjaer, Nexus, 2692, Teknikerbyen 28, DK-2830 Virum, Denmark) and the signals were recorded on a digital tape recorder (TEAC Corp., RD-135 T Dual Speed 8-Channel DAT Data Recorder, San Mateo, CA, USA). The recordings were made randomly with recordings of 300 s throughout the track. A fast Fourier transform (FFT) algorithm was used to compute the power spectral density of each sample of registered signals in the range of 0–200 Hz with a resolution of 1 Hz (PSD).
The signal was processed to determine the root mean square (RMS). Then, the main PSD peaks were considered to obtain simplified PSD profiles. A power amplifier (MA240, 240W Mixing Amplifier) drove an electrodynamic shaker (UNHOLTZ-DUCKIE CORP., S202), and readings from vibration tables and accelerometers were supplied to the FFT analyzer (Figure 5), where the PSD (dB2/Hz) was determined. Figure 6 depicts a typical curve demonstrating the relationship between frequency (Hz) and power spectral density (dB2/Hz). The acceleration, on the other hand, was calculated using the equation [51]:
PSD ( f ) = 1 N RMS ( f ) 2 N
where PSD (dB2/Hz) is the power spectral density, N is the number of sample periods, RMS is the root mean square acceleration value (g), and f (Hz) is the frequency.
The variance of RMS amplitude at a given frequency around a mean value of zero g is described as power spectral density [46].
The dynamic response measurements were made using a single (fixed) reference accelerometer and a moving accelerometer that responded at the points indicated in the package. The data acquisition system was a five-channel portable pulse analyzer with a laptop containing the Brüel & Kjaer software (Version: 2.34.10.0), Nexus, 2692, Teknikerbyen 28, DK-2830 Virum, Denmark. The reference accelerometer was placed at a well-chosen point on the cantaloupe, where all the modes contributed to the reference accelerometer using an initial idea of mode shape. The raw data recorded with the time capture analyzer were carried for each measurement group. The damping capability was measured using EFDD for the moving and fixed response.
In this study, three packing methods were used, namely the paper pulp tray packaging, pattern packing, and volume packing. In the simulations, the size of the box was 0.6 × 0.4 × 0.2 m, resulting in a stacking height of ±0.20 m. A paper pulp tray was placed in corrugated cardboard and filled with cantaloupes (about 13 kg capacity). For pattern packing (about 9 kg capacity), cantaloupes were also filled by hand into the corrugated cardboard in a triangular shape. For the volume packing, a wooden container was randomly filled with cantaloupes (about 12 kg capacity). The packages were placed and secured on the vibrator table, and the vibrator was then operated at various vibration frequencies and durations (50, 100, and 200 Hz) (5 and 10 min).
After the vibration tests, the samples were stored at a temperature of 20 °C for 10 days. Then, the external damage was assessed by observing the contact area between the samples and measuring the maximum width and length of the damage. Possible internal damage was examined by removing and cutting a portion of the pulp that contained the contact or the damaged area.
According to Nourain et al. [52] definition, cantaloupe damage can be classified into 5 categories: none, trace, slight, medium, and severe. In this study, cantaloupe cultivars were determined based on mechanical damage only. After the vibration treatments, all the cantaloupe fruits were classified according to their bruise diameter. A digital caliper was used to measure the bruise diameter on the cantaloupe’s surface, which had a minimum dimension of 0.01 mm. Bruises with a diameter of less than 12 mm with the same diameter of the total bruises were not counted.
Bruises with a depth of 3 mm or less are only visible from the outside by a trained eye. According to the United States Standards for Grades of cantaloupes, bruises with a depth of less than 3.2 mm are not considered to reduce quality of cantaloupes.
The firmness index (kg2/3 s−2) was constructed as follows [53] to indicate the firmness of cantaloupes:
Firmness index = F 2 m2/3
where F is the frequency (Hz) and m is the mass of fruit (kg).
The elasticity modulus (MPa) was computed as follows:
Elasticity modulus = F2 m2/3 ρ1/3
where: ρ the density (kg/m3).

3. Results and Discussion
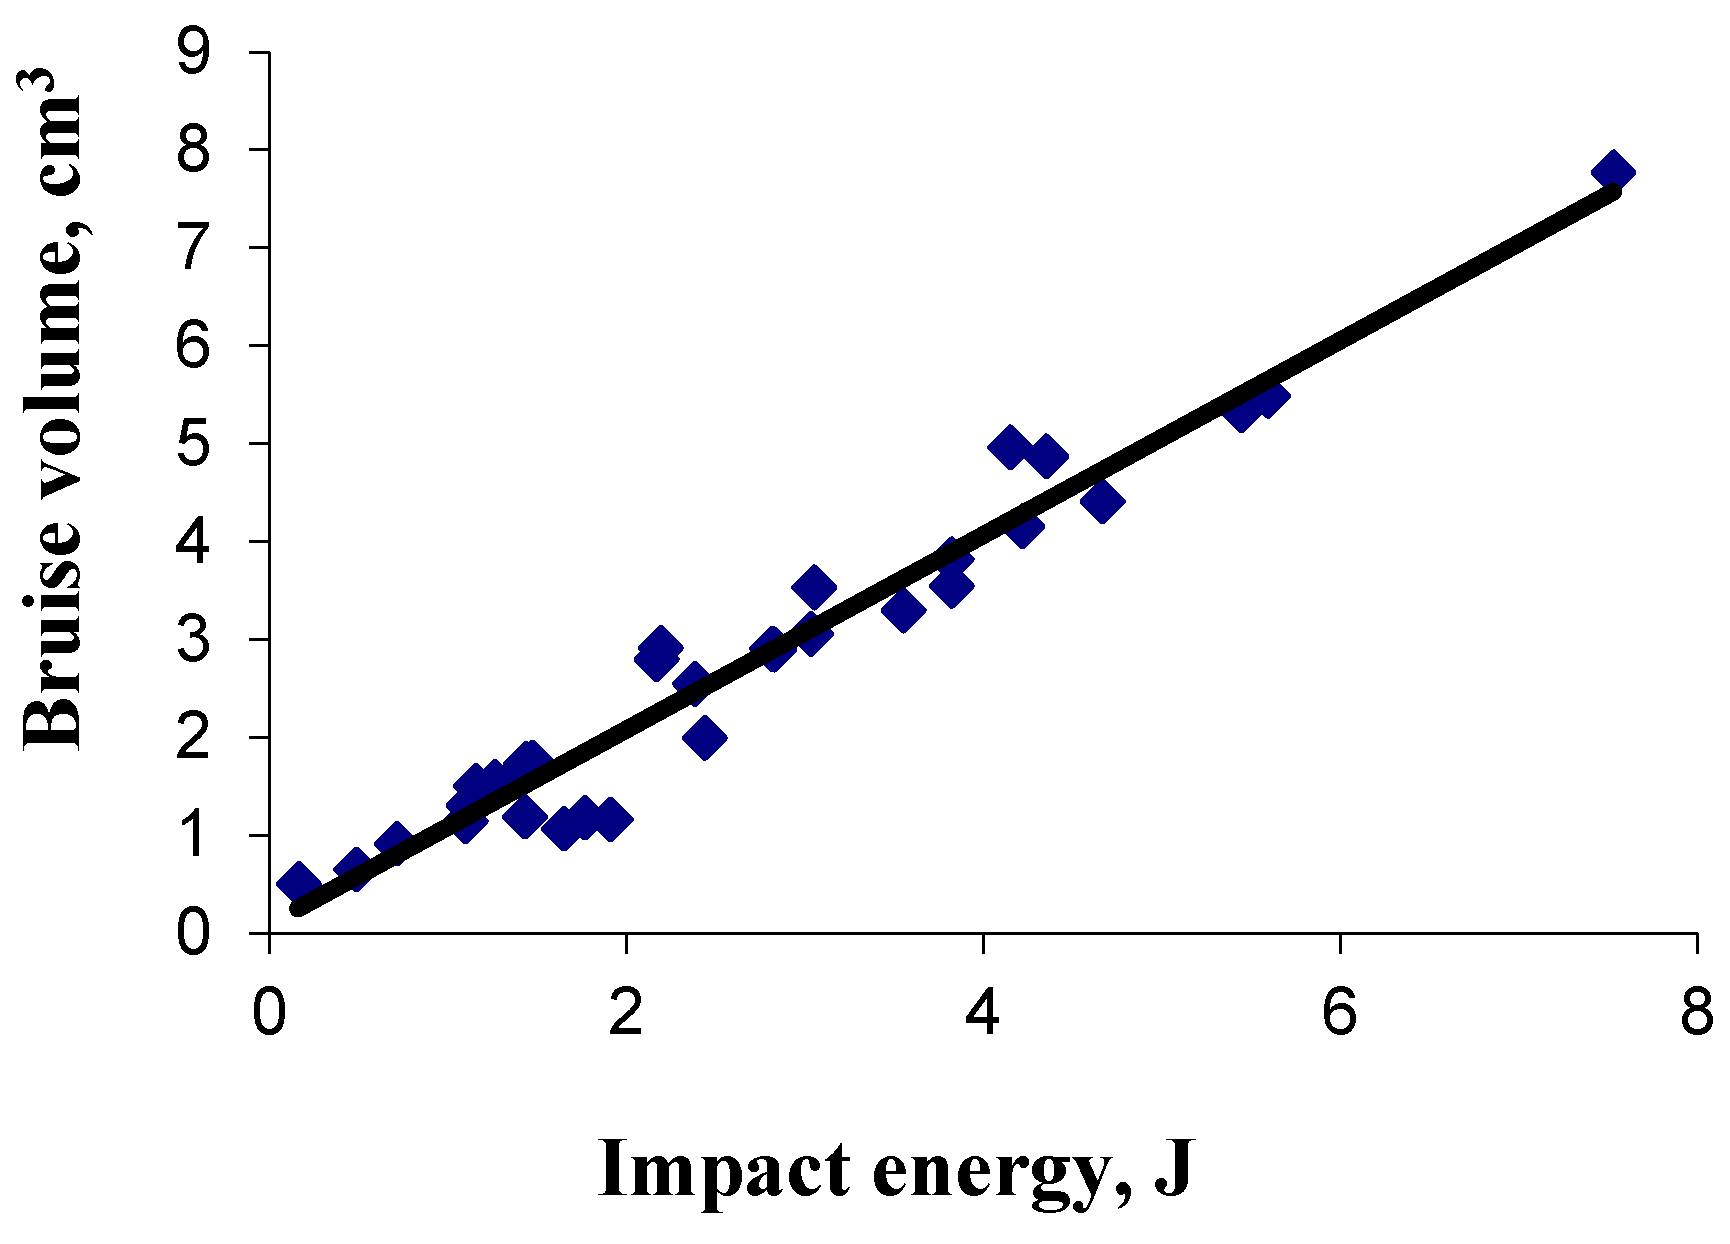
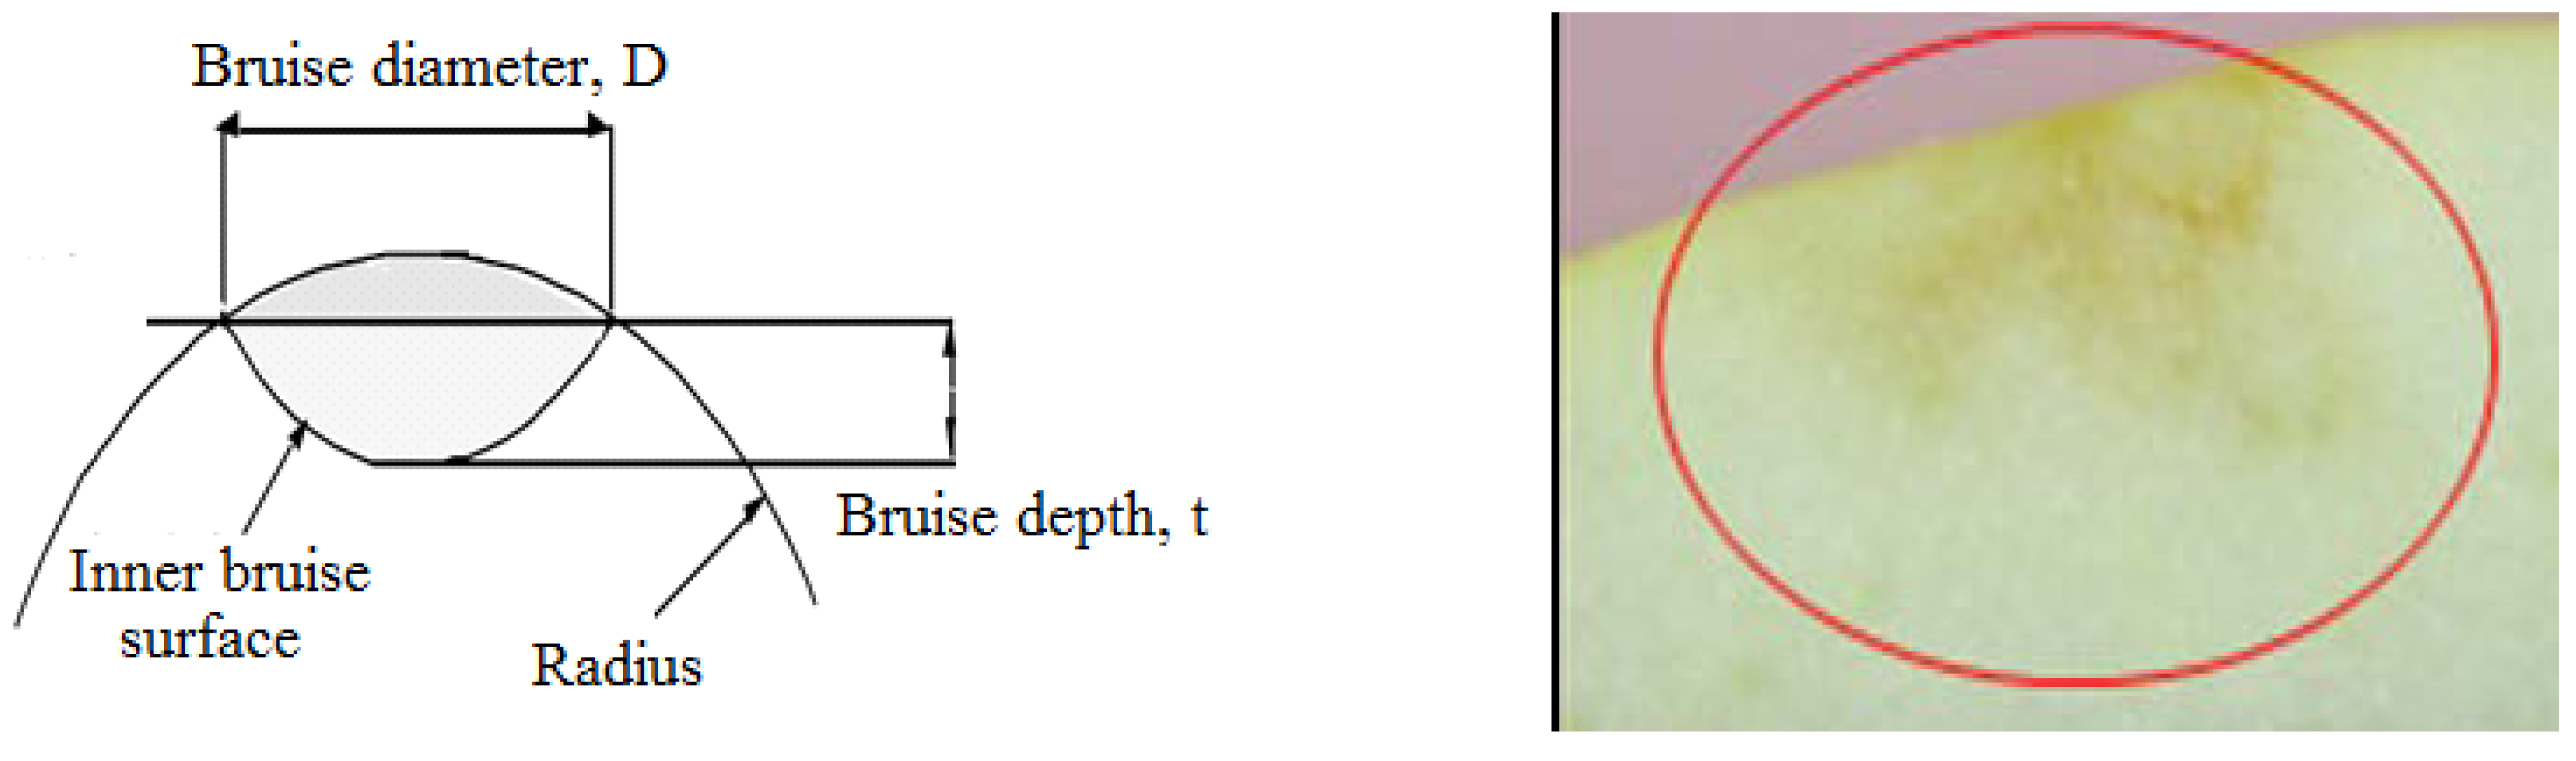
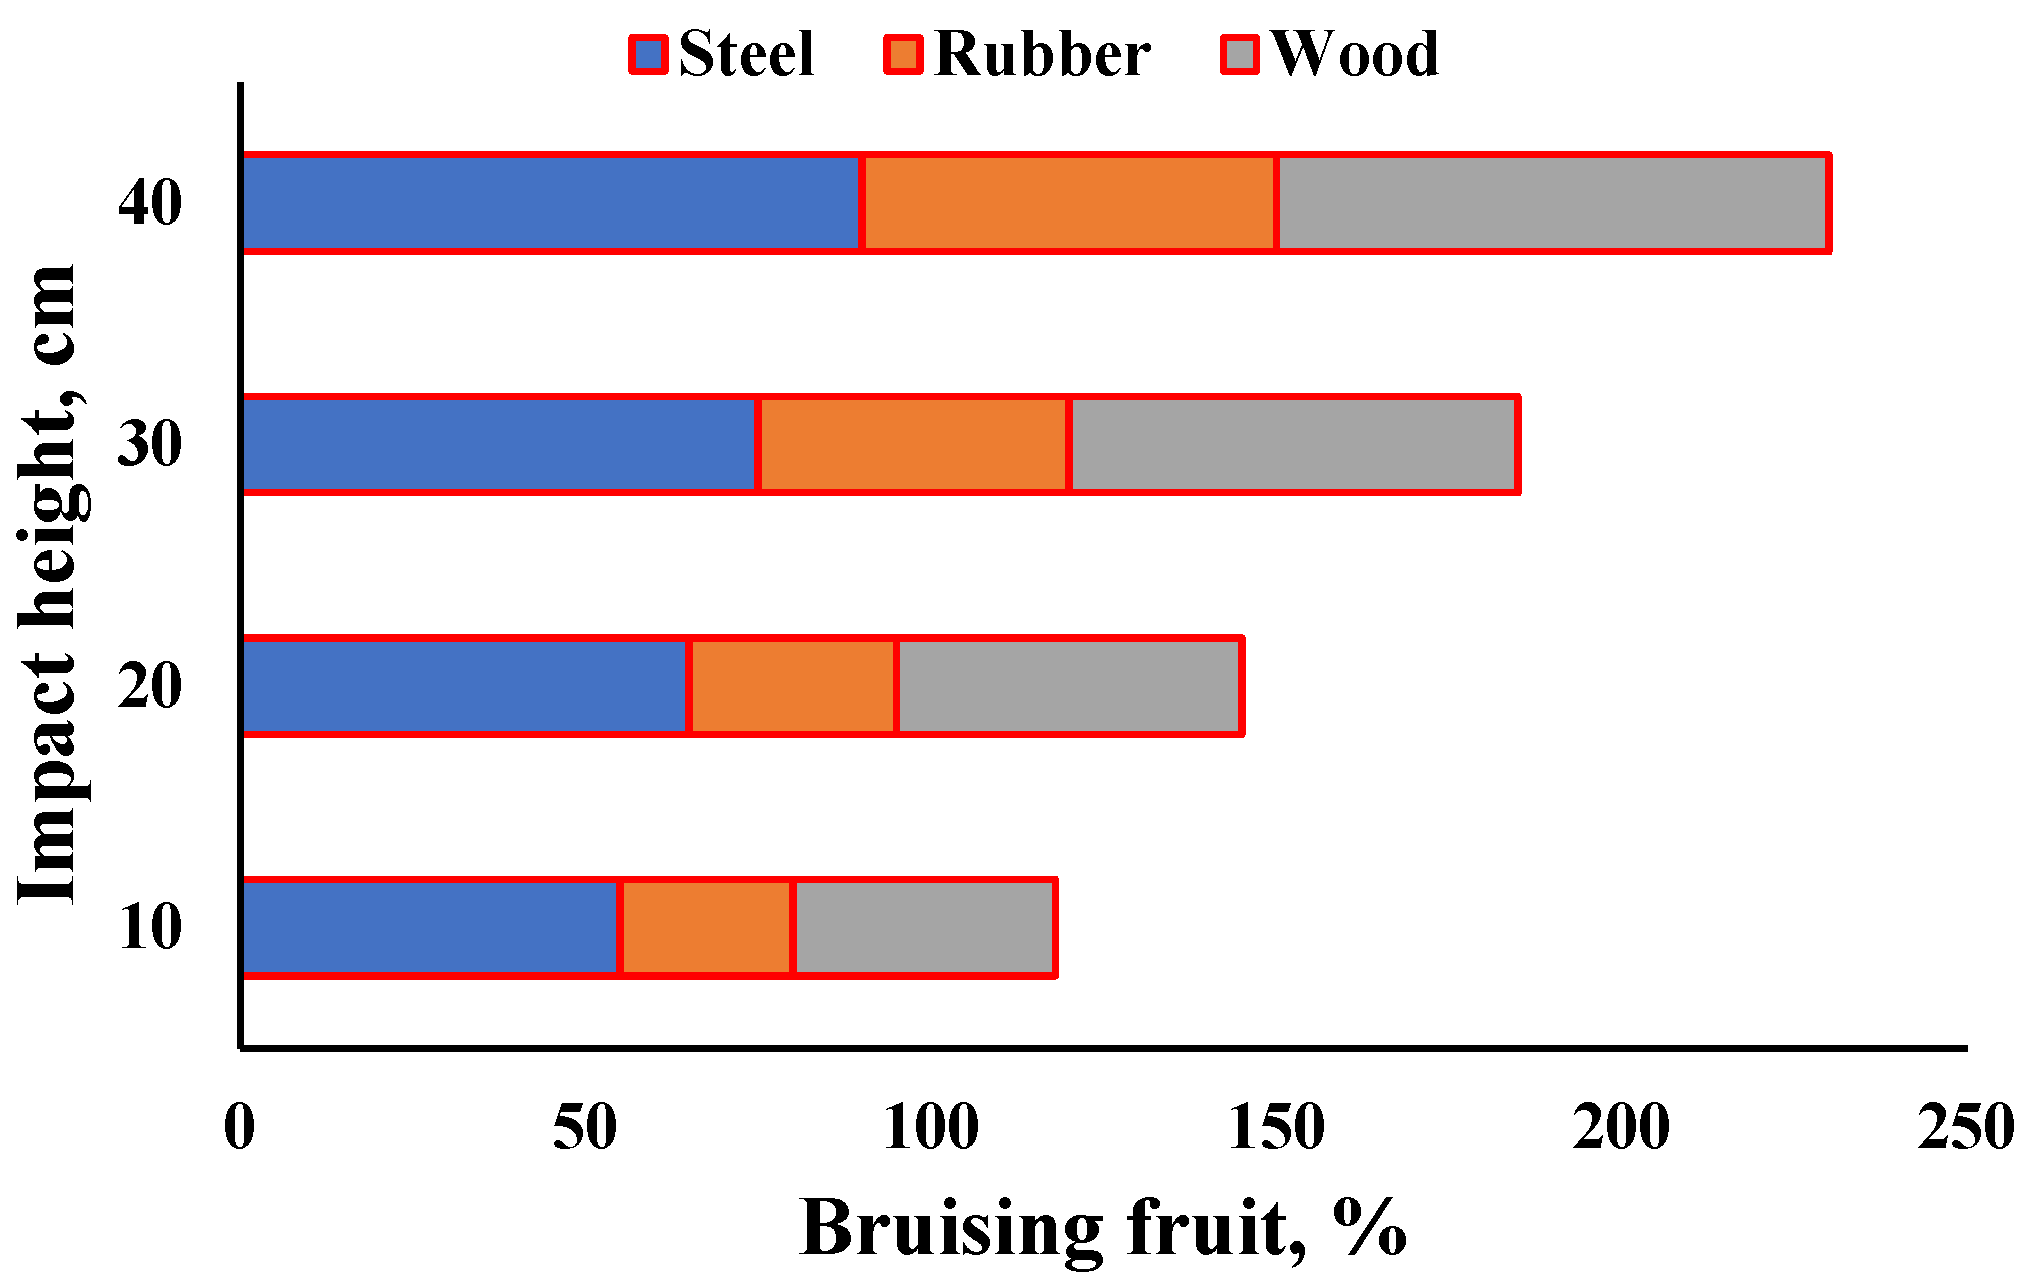
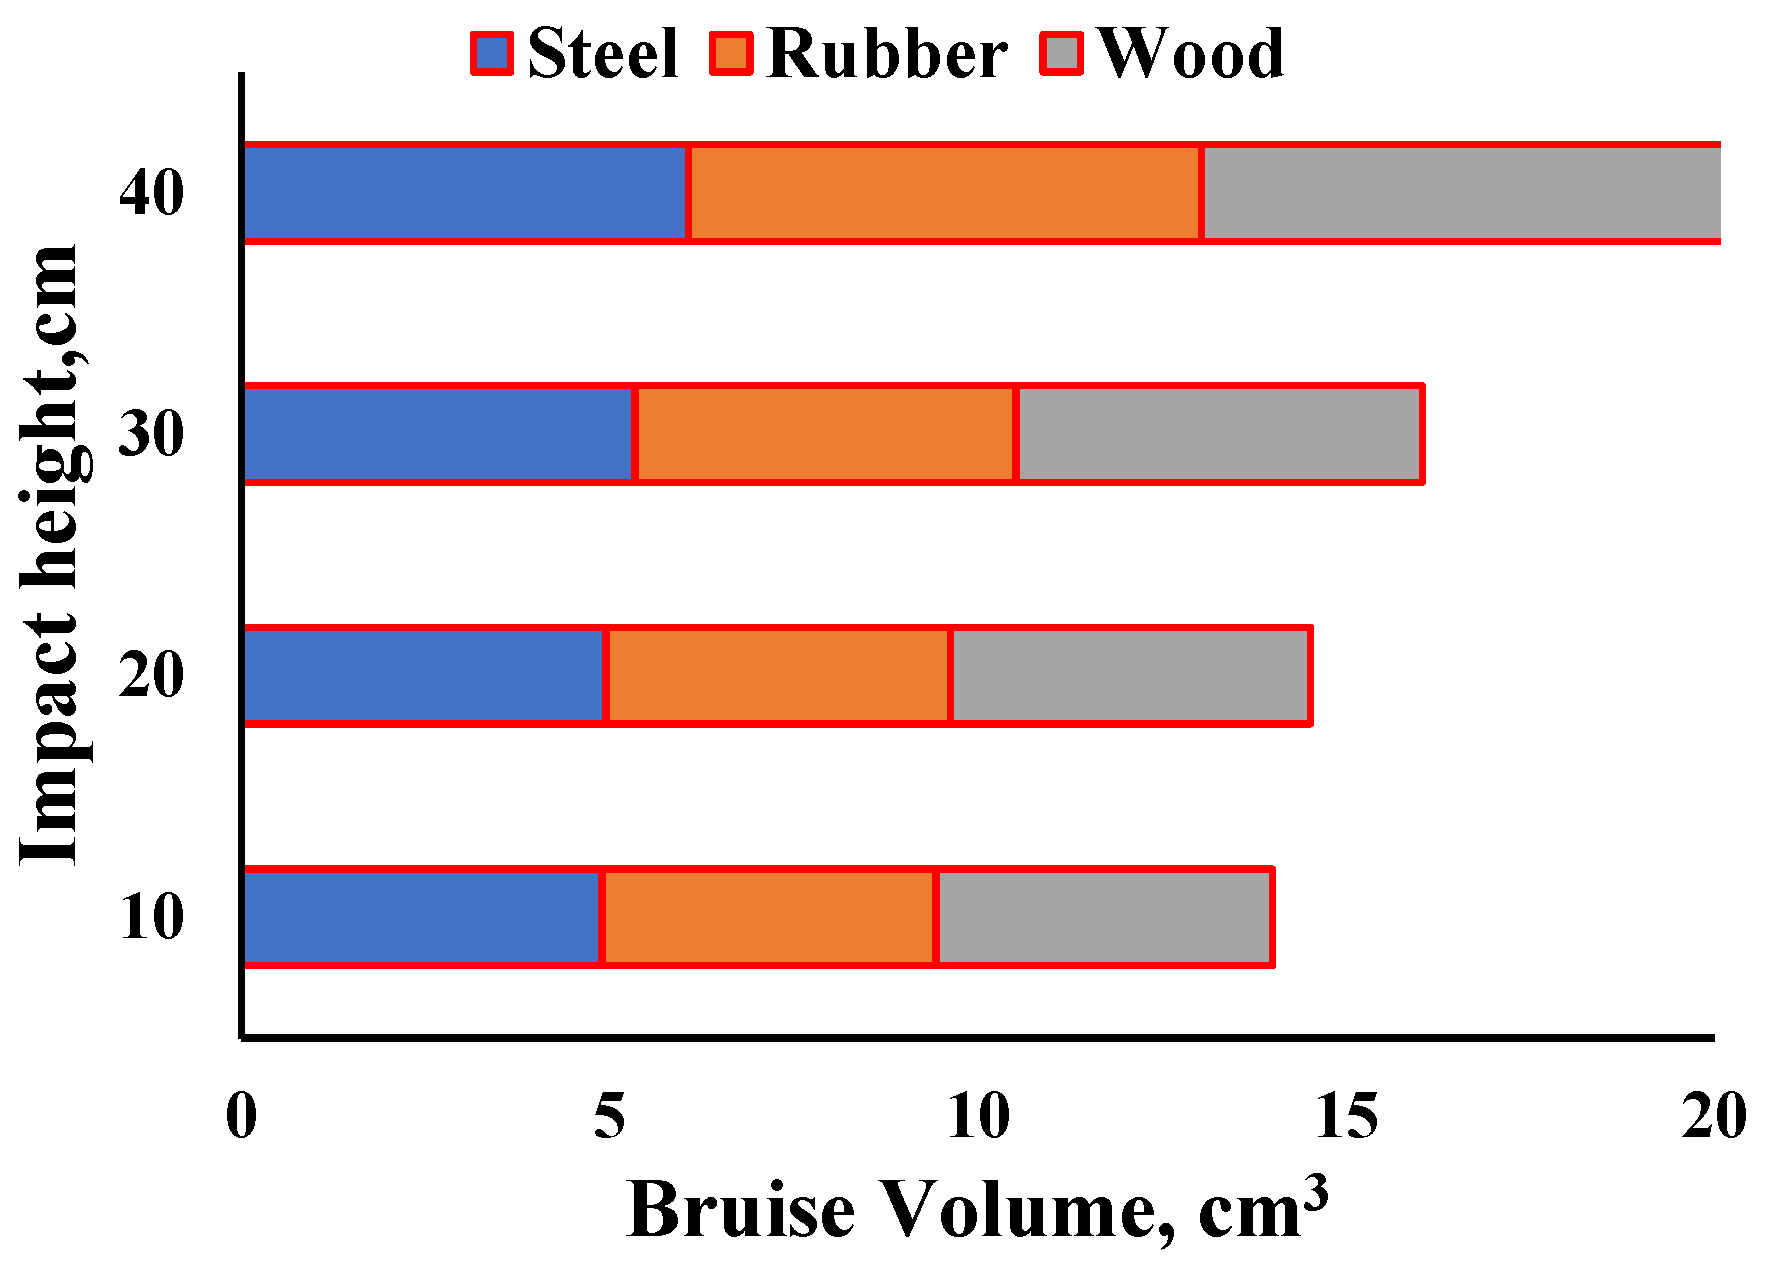
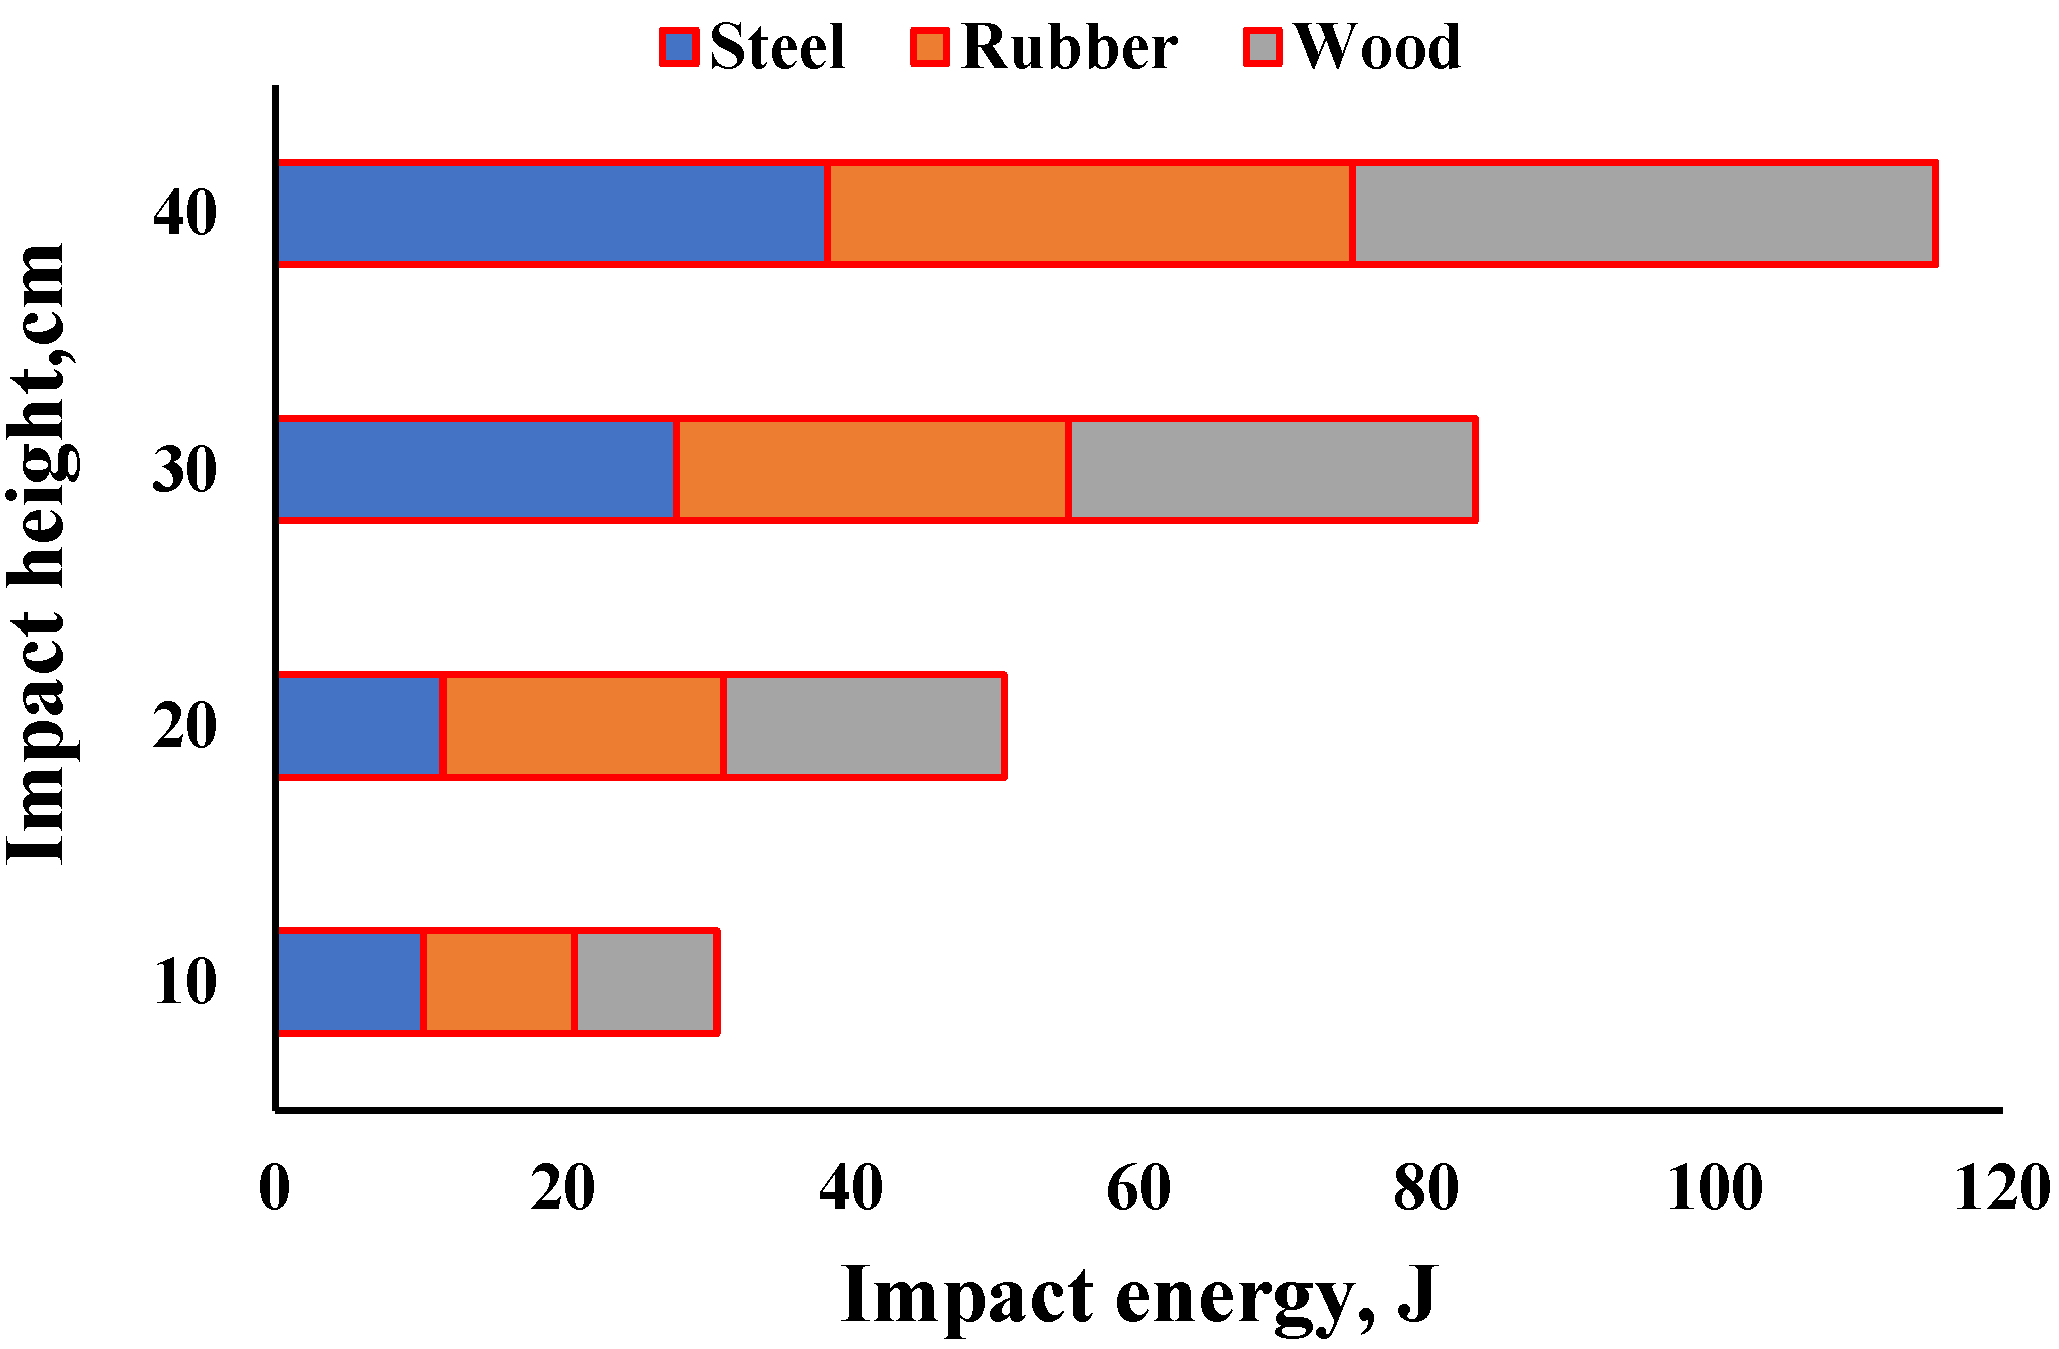
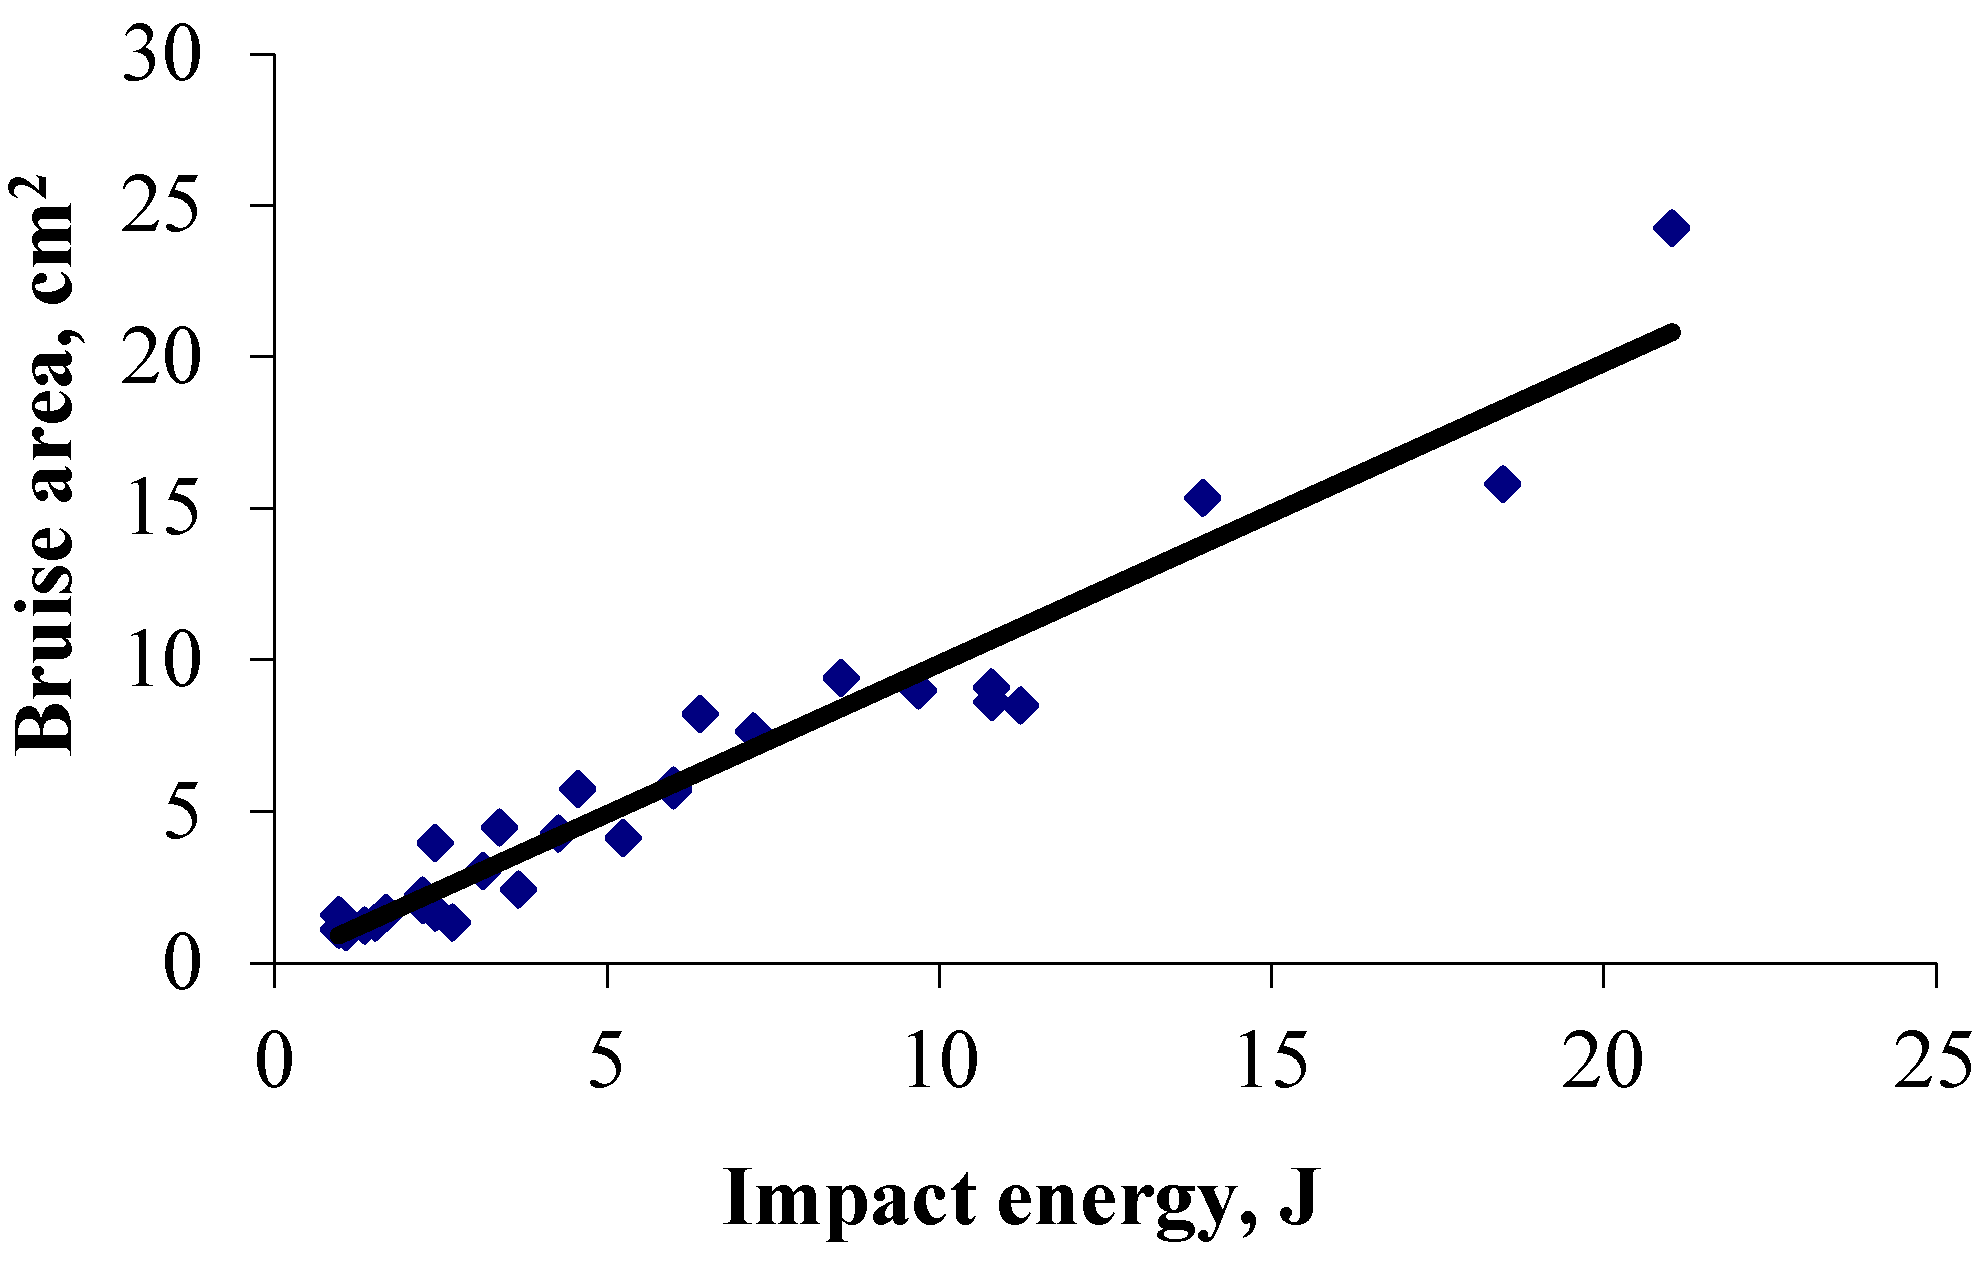
3.1. Impact Testing

Impact height testing is important to determine the height at which specimens are damaged during processing operations. The impact heights used to study the bruises at different surfaces and heights of 10, 20, 30, and 40 cm for the cantaloupe specimens are shown in Figure 7.
According to the results, the percentage of bruising (%) was high for the steel surface, but decreased for the wood and rubber surface. The consistent observation of all treatments was that the falling of fruit from a height of 10 cm led to the lowest percentage of bruising for all fruits, followed by 20 cm. Consequently, we can conclude that with an increase in the high impact, the number of bruises increases, which is due to some physical and chemical factors that occurred in the fruit, such as the conversion of carbohydrates into sugars and the shrinkage of fruit due to high water loss. This is especially relevant after the harvest and during the storage period, due to the increase in biological processes, such as a high respiration rate and high water loss due to the opening of cells.
The relationship between the bruise volume and the impact height is shown in Figure 8. The volume of bruises increased as the impact height increased, and it was highest at 10 and 20 cm for steel surfaces, but highest at 30 and 40 cm for wood surfaces. However, as shown in Figure 8, the bruise volume rose as the impact height increased. Figure 9 depicts the relationship between impact energy and impact height. The impact energy increased with increasing impact height and was highest at 30 and 40 cm of impact height. Figure 10 depicts the effect of storage time on the bruise volume of fruits. The bruise volume increased on the different surfaces (steel, rubber, and wood) as the storage time increased; the bruise volume reached its maximum values for the steel surface in the first week, increased on the wood surface after the first week, and decreased on the rubber surface.
The relationships between bruise area and bruise volume vs. impact energy are shown in (Figure 11 and Figure 12). The impact energy was shown to be linearly related to the total bruising area and volume. The shape of the relationship between bruising area and bruise volume vs. impact energy was predicted by the elastic model. The bruise area and volume play an important role in impact theory, and they are visible and easily measured parameters in practice. According to elasticity theory, the bruise area and volume following the impact are related to the impact energy and the elastic modulus. When the bruise area and volume were plotted against the impact energy in these studies (Figure 11 and Figure 12), the regression analysis revealed a highly significant linear association between these parameters [54].
Barea = 0.9926 IE + 0.0516       R2 = 0.94
Bvolume = 0.9939 IE − 0.0946      R2 = 0.95

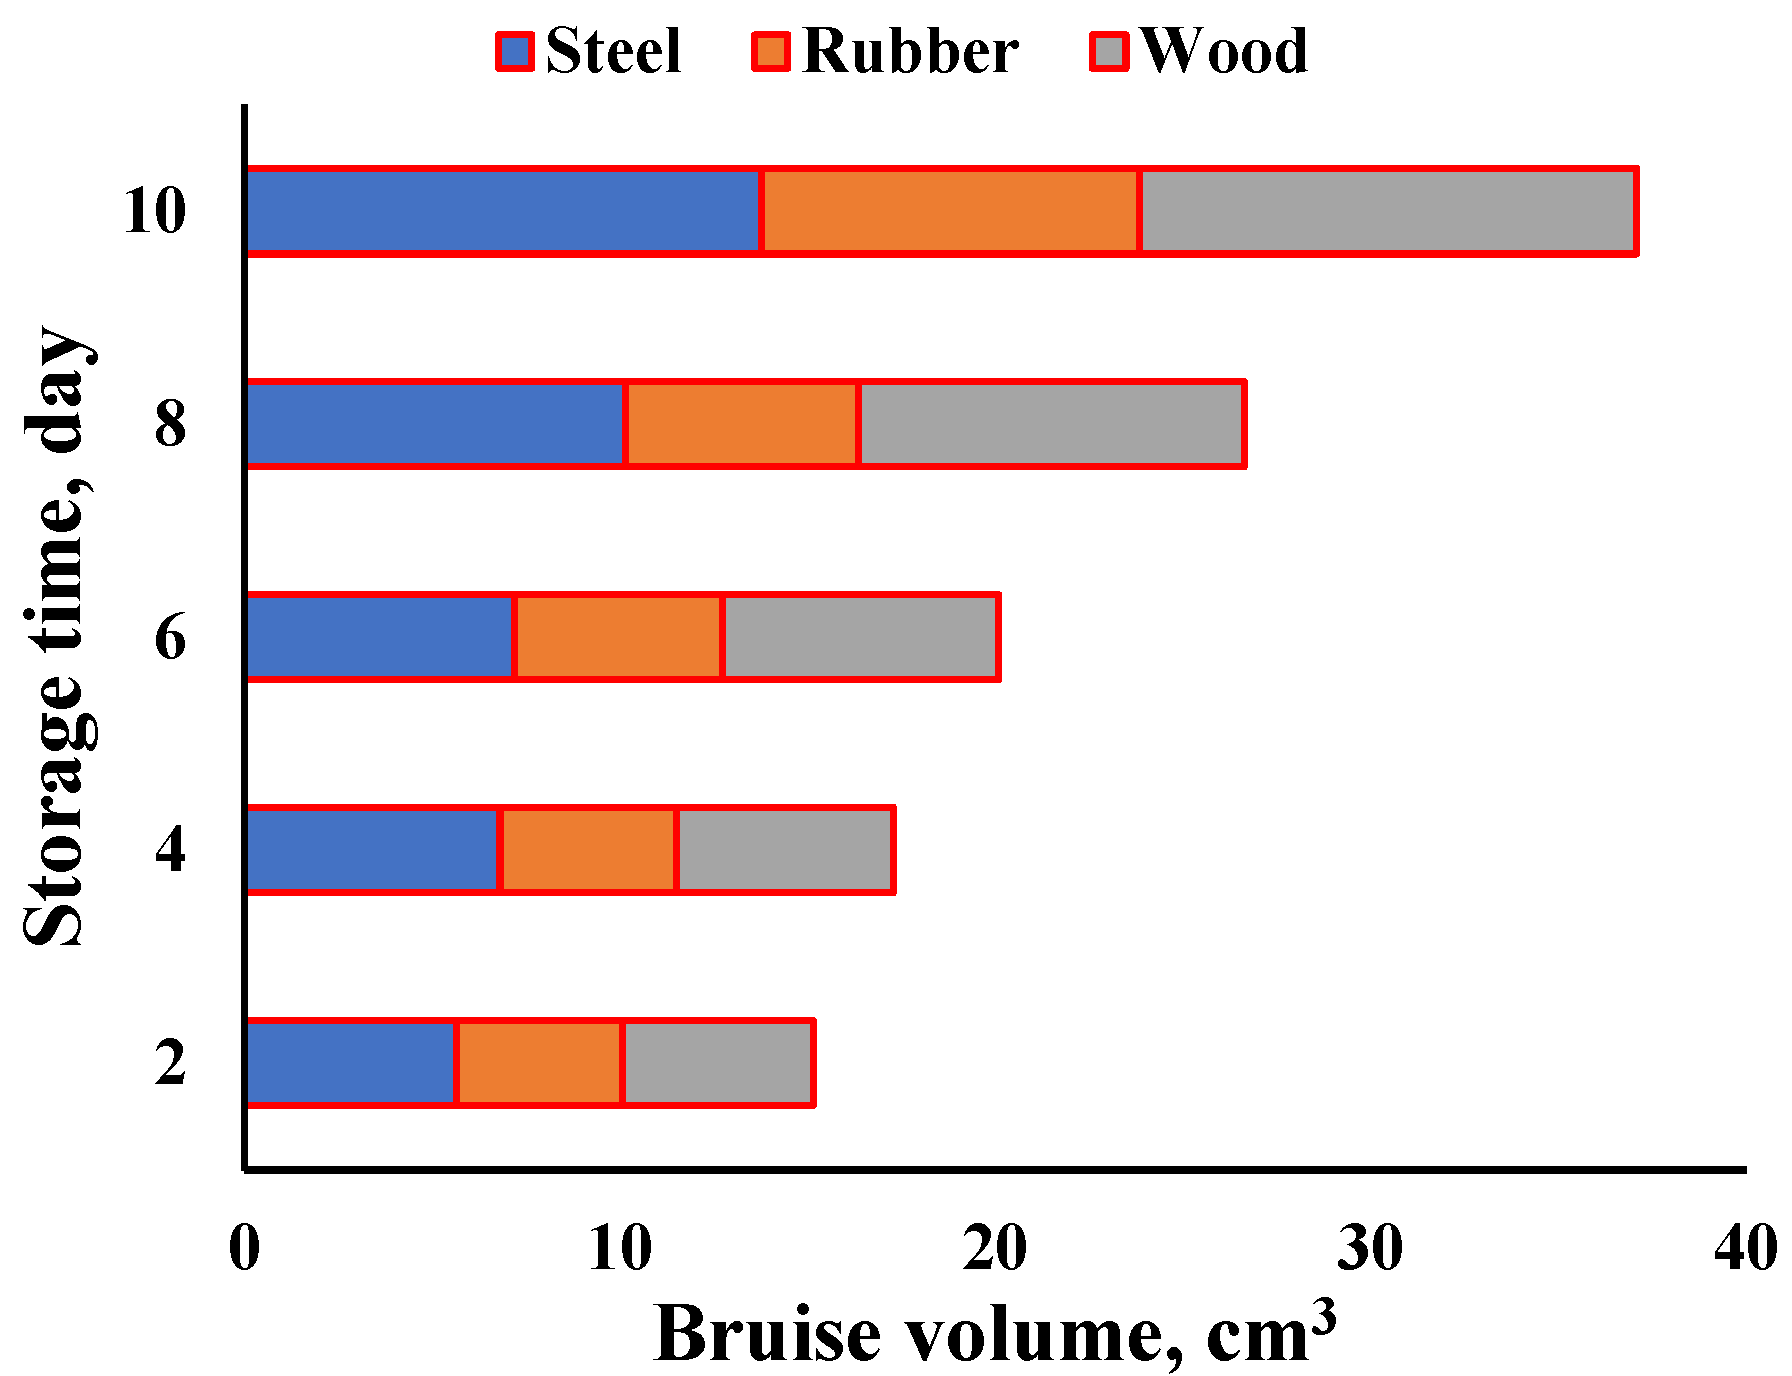
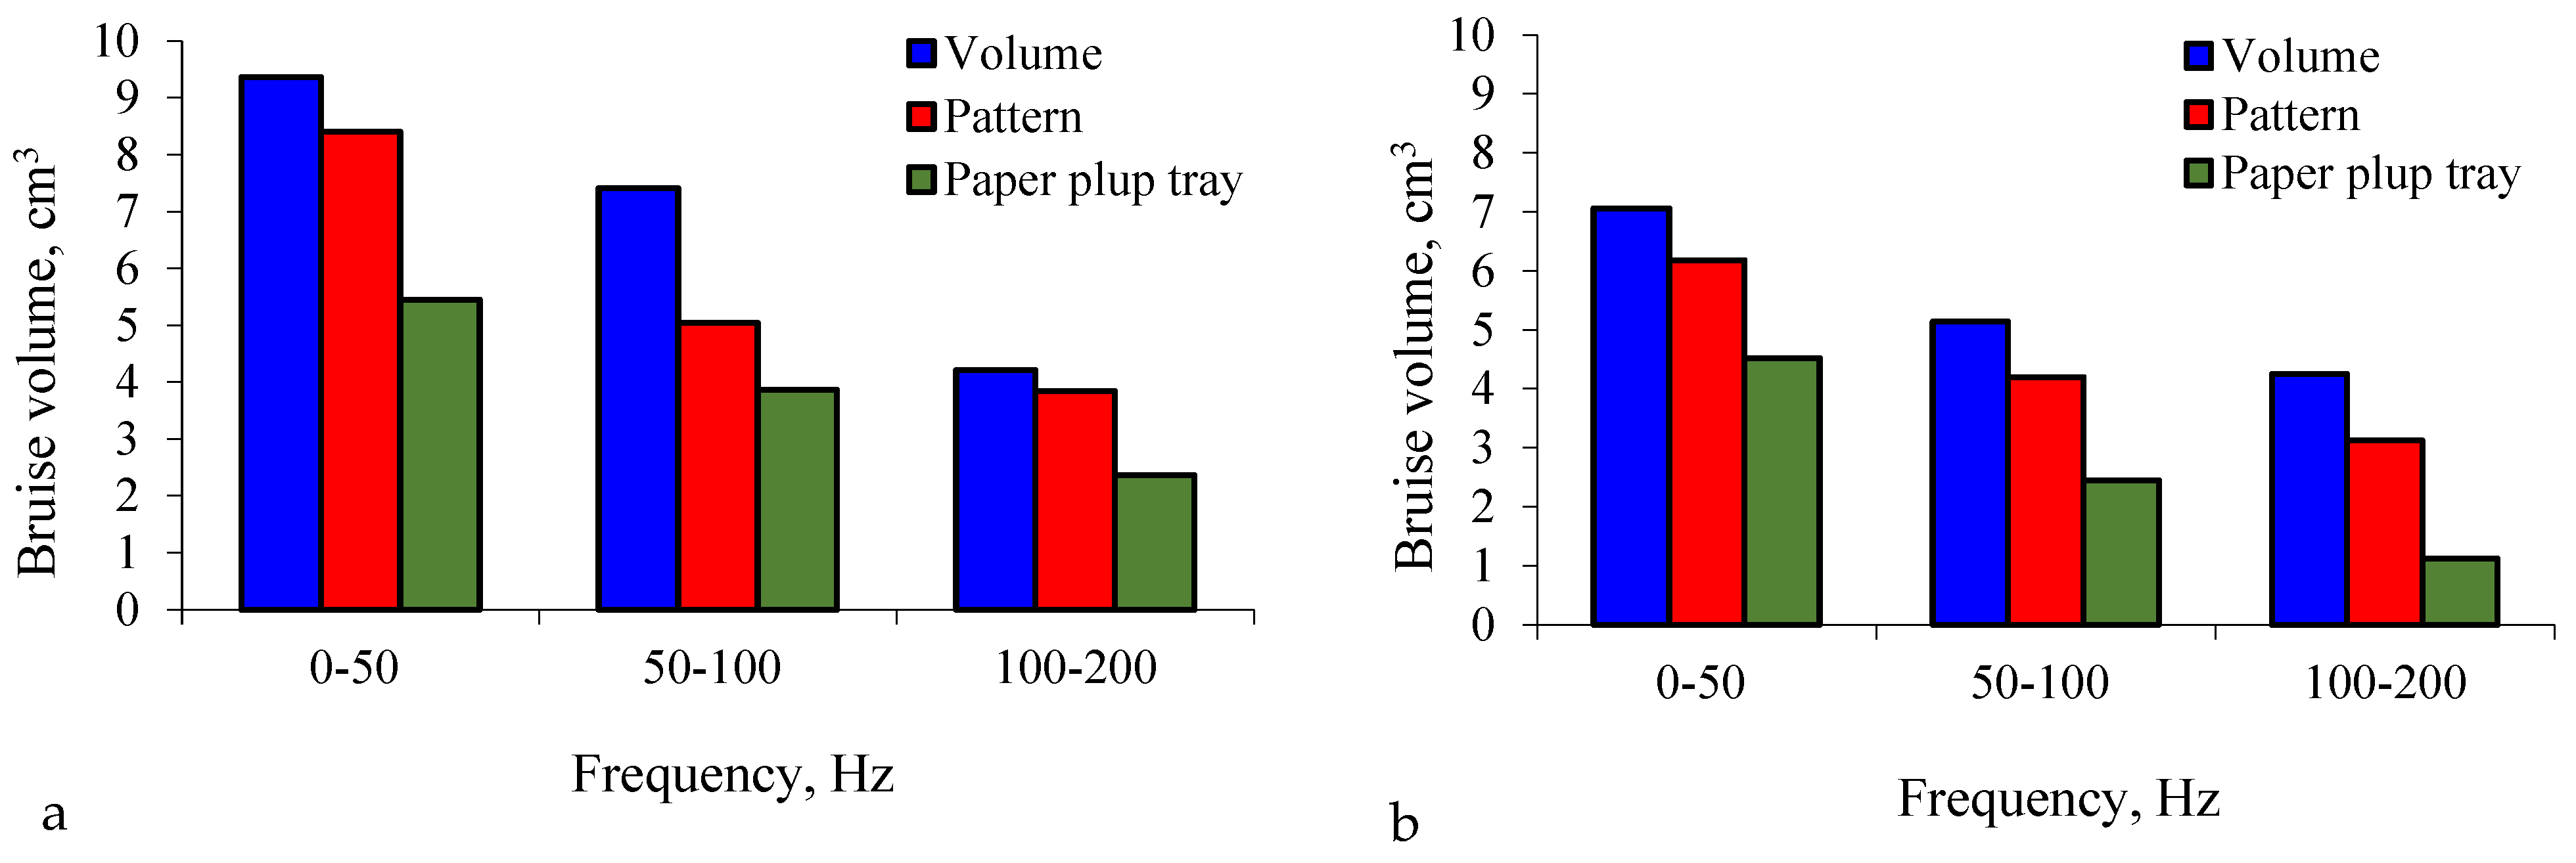
3.2. Effect of Mechanical Vibrations and Packing Method on the Damage of Cantaloupe Fruits

According to the results measured by a laboratory vibrator, the vibration frequencies were (0–50), (50–100), and (100–200) Hz. Table 1 presents descriptive statistics data of vibration analysis for cantaloupe fruits at different frequencies in volume packaging. The general average values and coefficient of variation (CV) for cantaloupe fruits were 30 dB2/Hz and 28.66%, respectively, at a frequency of 0–50 Hz and a duration of 5 min, as shown in Table 1. However, at a frequency of 0–50 Hz and a duration of 10 min, the mean and CV values were 31.49 dB2/Hz and 26.36%, respectively. Furthermore, the mean and CV at a 50–100 Hz frequency and a 5 min duration were 15.06 dB2/Hz and 29.52%, respectively, whereas at the same frequency and a 10 min duration, they were 18.06 dB2/Hz and 20.58%, respectively. At the frequency of 100–200 Hz and a 5 min duration, the mean and CV were 18.96 dB2/Hz and 18.71%, respectively, and they were 4.09 dB2/Hz and 12.67% at 100–200 Hz of frequency and 10 min of duration.
Table 2 presents descriptive statistics data of vibration analysis for cantaloupe fruits at different frequencies in the paper pulp tray packaging. The general average values and coefficient of variation (CV) for cantaloupe fruits were 13.24 dB2/Hz and 15.68%, respectively, at a frequency of 0–50 Hz and a duration of 5 min, as shown in Table 2. However, at a frequency of 0–50 Hz and a duration of 10 min, the mean and CV values were 23.76 dB2/Hz and 4.14%, respectively. Furthermore, the mean and CV at 50–100 Hz frequency and a 5 min duration were 5.49 dB2/Hz and 12.82%, respectively, whereas at the same frequency and a 10 min duration, they were 9.14 dB2/Hz and 32.36%, respectively. At the frequency of 100–200 Hz and 5 min of duration, the values of mean and CV were 5.13 dB2/Hz and 5.79%, respectively, and they were 15.13 dB2/Hz and 7.25% at 100–200 Hz of frequency and 10 min of duration.
Table 3 presents descriptive statistics data of vibration analysis for cantaloupe fruits at different frequencies in the pattern packaging. The general average values and coefficient of variation (CV) for cantaloupe fruits were 11.49 dB2/Hz and 38.08%, respectively, at a frequency of 0–50 Hz and a duration of 5 min, as shown in Table 3. However, at a frequency of 0–50 Hz and a duration of 10 min, the mean and CV values were 20.35 dB2/Hz and 17.56%, respectively. Furthermore, the mean and CV at 50–100 Hz of frequency and a 5 min duration were 12.14 dB2/Hz and 21.35%, respectively, whereas at the same frequency and a 10 min duration, they were 19.39 dB2/Hz and 6.82%, respectively. At the frequency of 100–200 Hz and 5 min of duration, the mean and CV were 12.72 dB2/Hz and 27.06%, respectively, and they were 8.56 dB2/Hz and 33.48% at 100–200 Hz of frequency and 10 min of duration.
Figure 13 shows the PSD values at different vibration frequencies and for different packing methods and a duration of 5 min. Some differences in PSD values can be seen in Figure 13. At (0–50 Hz), the PSD values for volume packing were shown to be higher than the values for pattern packing and for paper pulp tray packing, which can be attributed to the packing method of the samples and the paper between the samples that damped the vibration, so that the values decreased. However, at 50–100 Hz, the PSD values generally decreased, followed by the values at 0–50 Hz. The PSD values for volume packaging are higher than the values for pattern packaging and for paper pulp tray packaging. It was also observed that the PSD values decreased with the increase in vibration frequency. At 100–200 Hz, the PSD values were higher for volume packaging than for pattern packaging and for paper pulp tray packaging.
Figure 14 shows the PSD values at the different vibration frequencies and at different packaging methods and a duration of 10 min. Some differences in the PSD values can be seen in Figure 14. At 0–50 Hz, it showed that the PSD values for the volume packaging were higher than the values for pattern packaging and for paper pulp tray packaging, which was due to the packaging method of the samples and the paper between the samples that damped the vibration, so the values decreased. However, at 50–100 Hz, the PSD values generally decreased, followed by the values at 0–50 Hz.
The PSD values for the paper pulp tray packaging were higher than the values for pattern packaging and for the volume packaging. It was also observed that the PSD values decreased with the increase in vibration frequency. At 100–200 Hz, the PSD values for the pattern packaging were higher than the values for the paper pulp tray packaging and for the volume packaging.

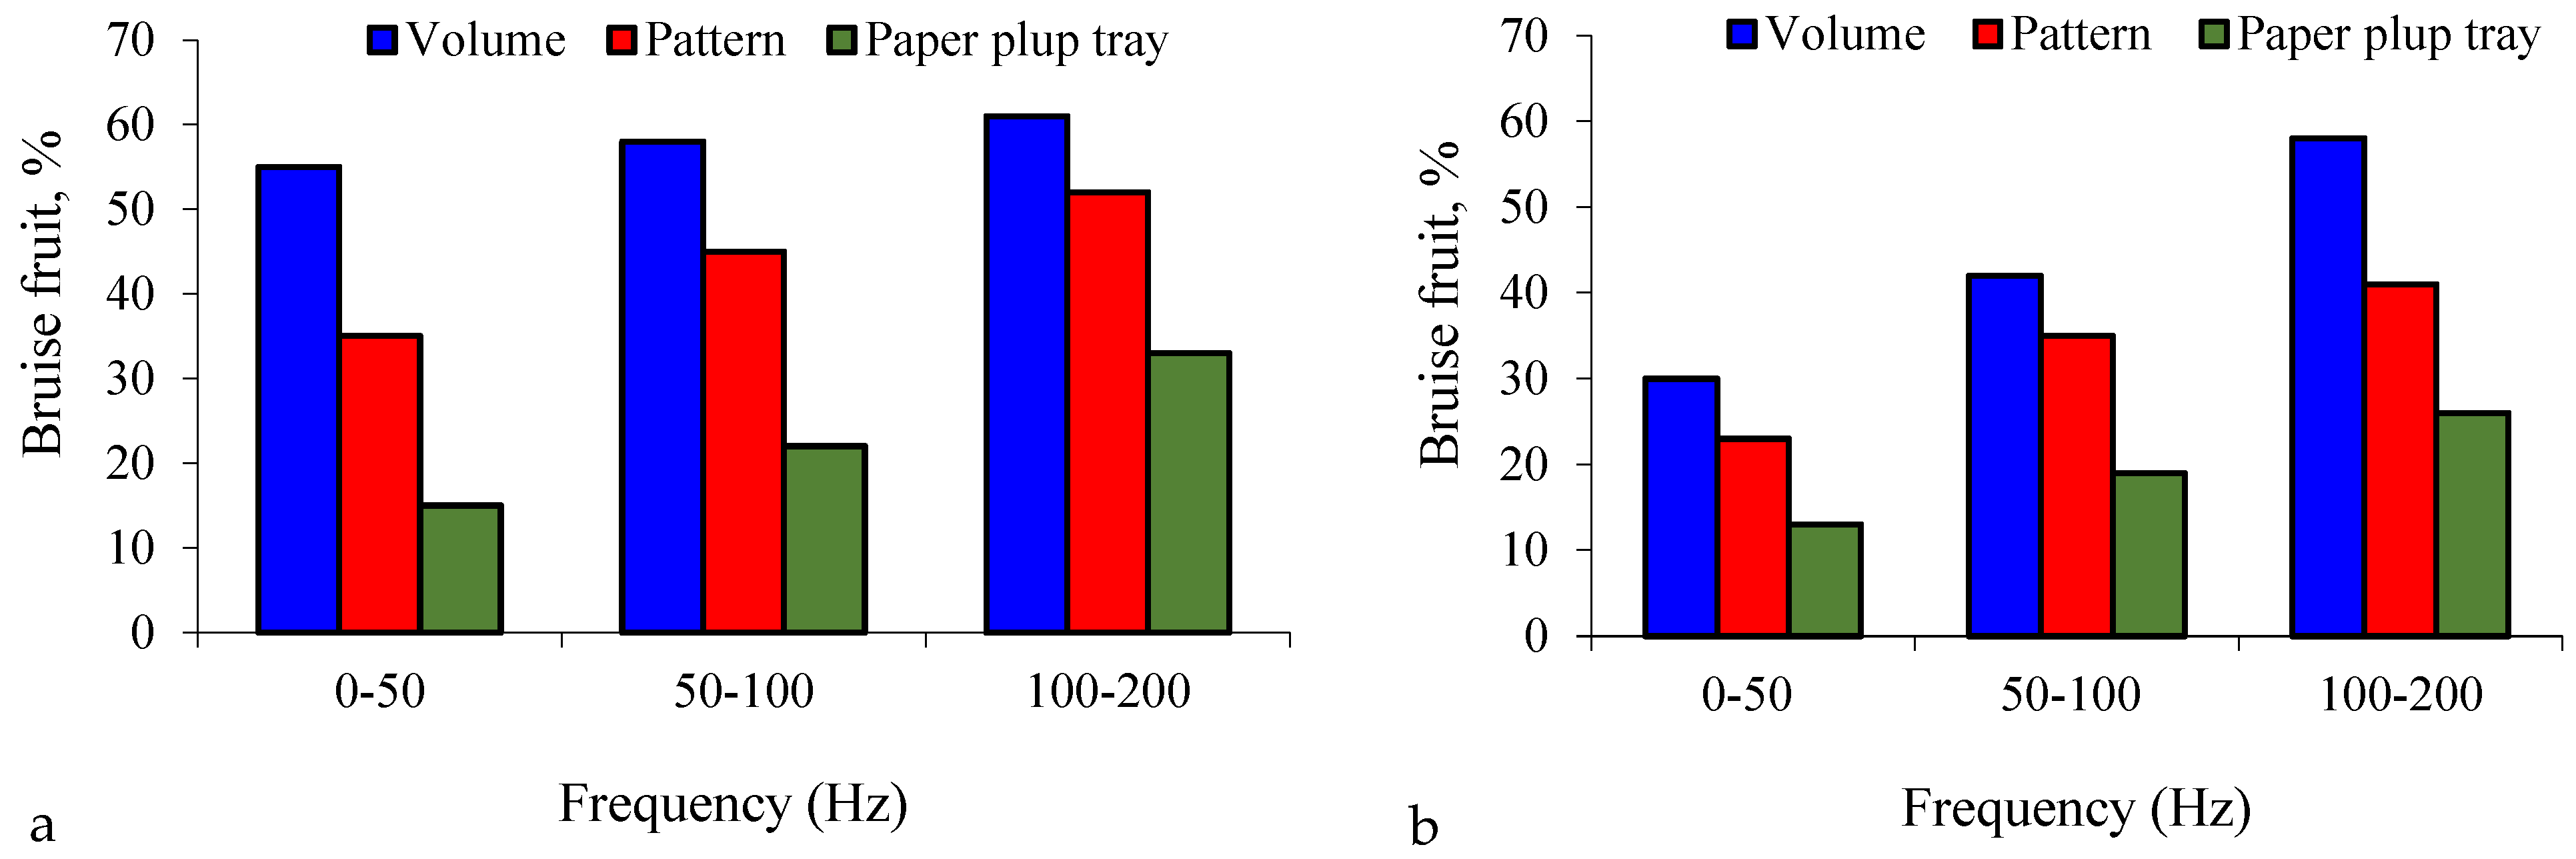
3.3. Effect of Packing Method on the Number of Bruise Cantaloupe at Different Vibration Frequencies

Simulations were conducted to quantify the effect of the packing method on the mechanical damage incurred during the transport of cantaloupe. The data are shown in Figure 15. It was found that the bruise volume decreased with an increasing vibration frequency from 0 to 200 Hz for the different packing methods. In the subsequent analysis of the distribution of the bruise volume, the damage was highest for the volume packaging, followed by the other packing methods. It can also be seen that the bruise damage increased with the increasing vibration frequency. When the fruit package’s resonance frequency coincided with the excitation frequency, the product’s acceleration can be considerably enhanced, resulting in severe fruit damage [55]. According to Shabazi et al. [55], raising the vibration frequency from 7.5 to 13 Hz had a substantial influence on the lowering of the elasticity modulus of a watermelon’s flesh under constant acceleration. It is worth noting that increasing the vibration frequency at a constant acceleration minimizes the displacements of each fruit during transportation, lowering the impact numbers between the fruits and therefore reducing damage. Pretorius and Steyn [56] compared the resonant vibration frequencies calculated for different types of fresh produce with the vibrations experienced on fresh fruit containers during transit. Furthermore, according to Jarimopas et al. [25], the frequency range between 5 and 20 Hz reflects the axle hop response, and these frequencies are typically passed to the fruit load inside the packing, particularly in the case of a defective truck suspension.
Furthermore, the natural frequencies of both apricot cultivars were found to be within this essential zone, according to the findings of this study. To minimize the damage, the system vibration must be moved out of the critical region, and resonance frequencies must be avoided. Other types of packaging, protective materials inside the packages, and a tight filling procedure to improve the package’s natural frequency are the best options for achieving these aims.
The results in Figure 15 show that for the main factors, the paper pulp tray packaging was the best method of internal packaging, followed by pattern and volume packaging. Volume packing caused the highest damage values. The vibration duration of 10 min caused higher damage values for all the packaging methods than the others at 5 min, implying that the size of the bruise in the cantaloupe containers was increased by increasing the vibration duration. Li et al. [41] and Schulte et al. [57] reported that an increase in the distance travelled increased the percentage of fruit bruised during transport.
As shown in Figure 16 the number of bruised cantaloupes increased with the increasing vibration frequency and increasing the vibration duration from 5 to 10 min, i.e., most of the vibration forces transmitted from the vibration table to the cantaloupes containers are absorbed by the cantaloupes in the containers and cause bruising on the cantaloupes. The reason for these bruises is that these forces are higher in the cantaloupes, causing the cantaloupes to be temporarily weightless. The weightlessness allowed the cantaloupes to rotate and bump into each other. This motion caused the discoloration of the surface and fatigue of the cell walls, resulting in bruising of the cantaloupes, according to Vursavuş and Özgüven [16].
The cantaloupes packed in paper pulp trays showed the least damage, followed by the pattern and volume packing methods. The volume packing method, with a high vertical frequency, had the highest potential for bruising due to the size differences of the cantaloupe within the counts. Therefore, the trays used should be sized to provide a slight margin within the carton, and similar sized fruit should be used in paper pulp tray packages to reduce bruise damage. In addition, the use of cushioning materials for all packaging methods can help reduce bruising; however, the cost and inconvenience of their use seems prohibitive.

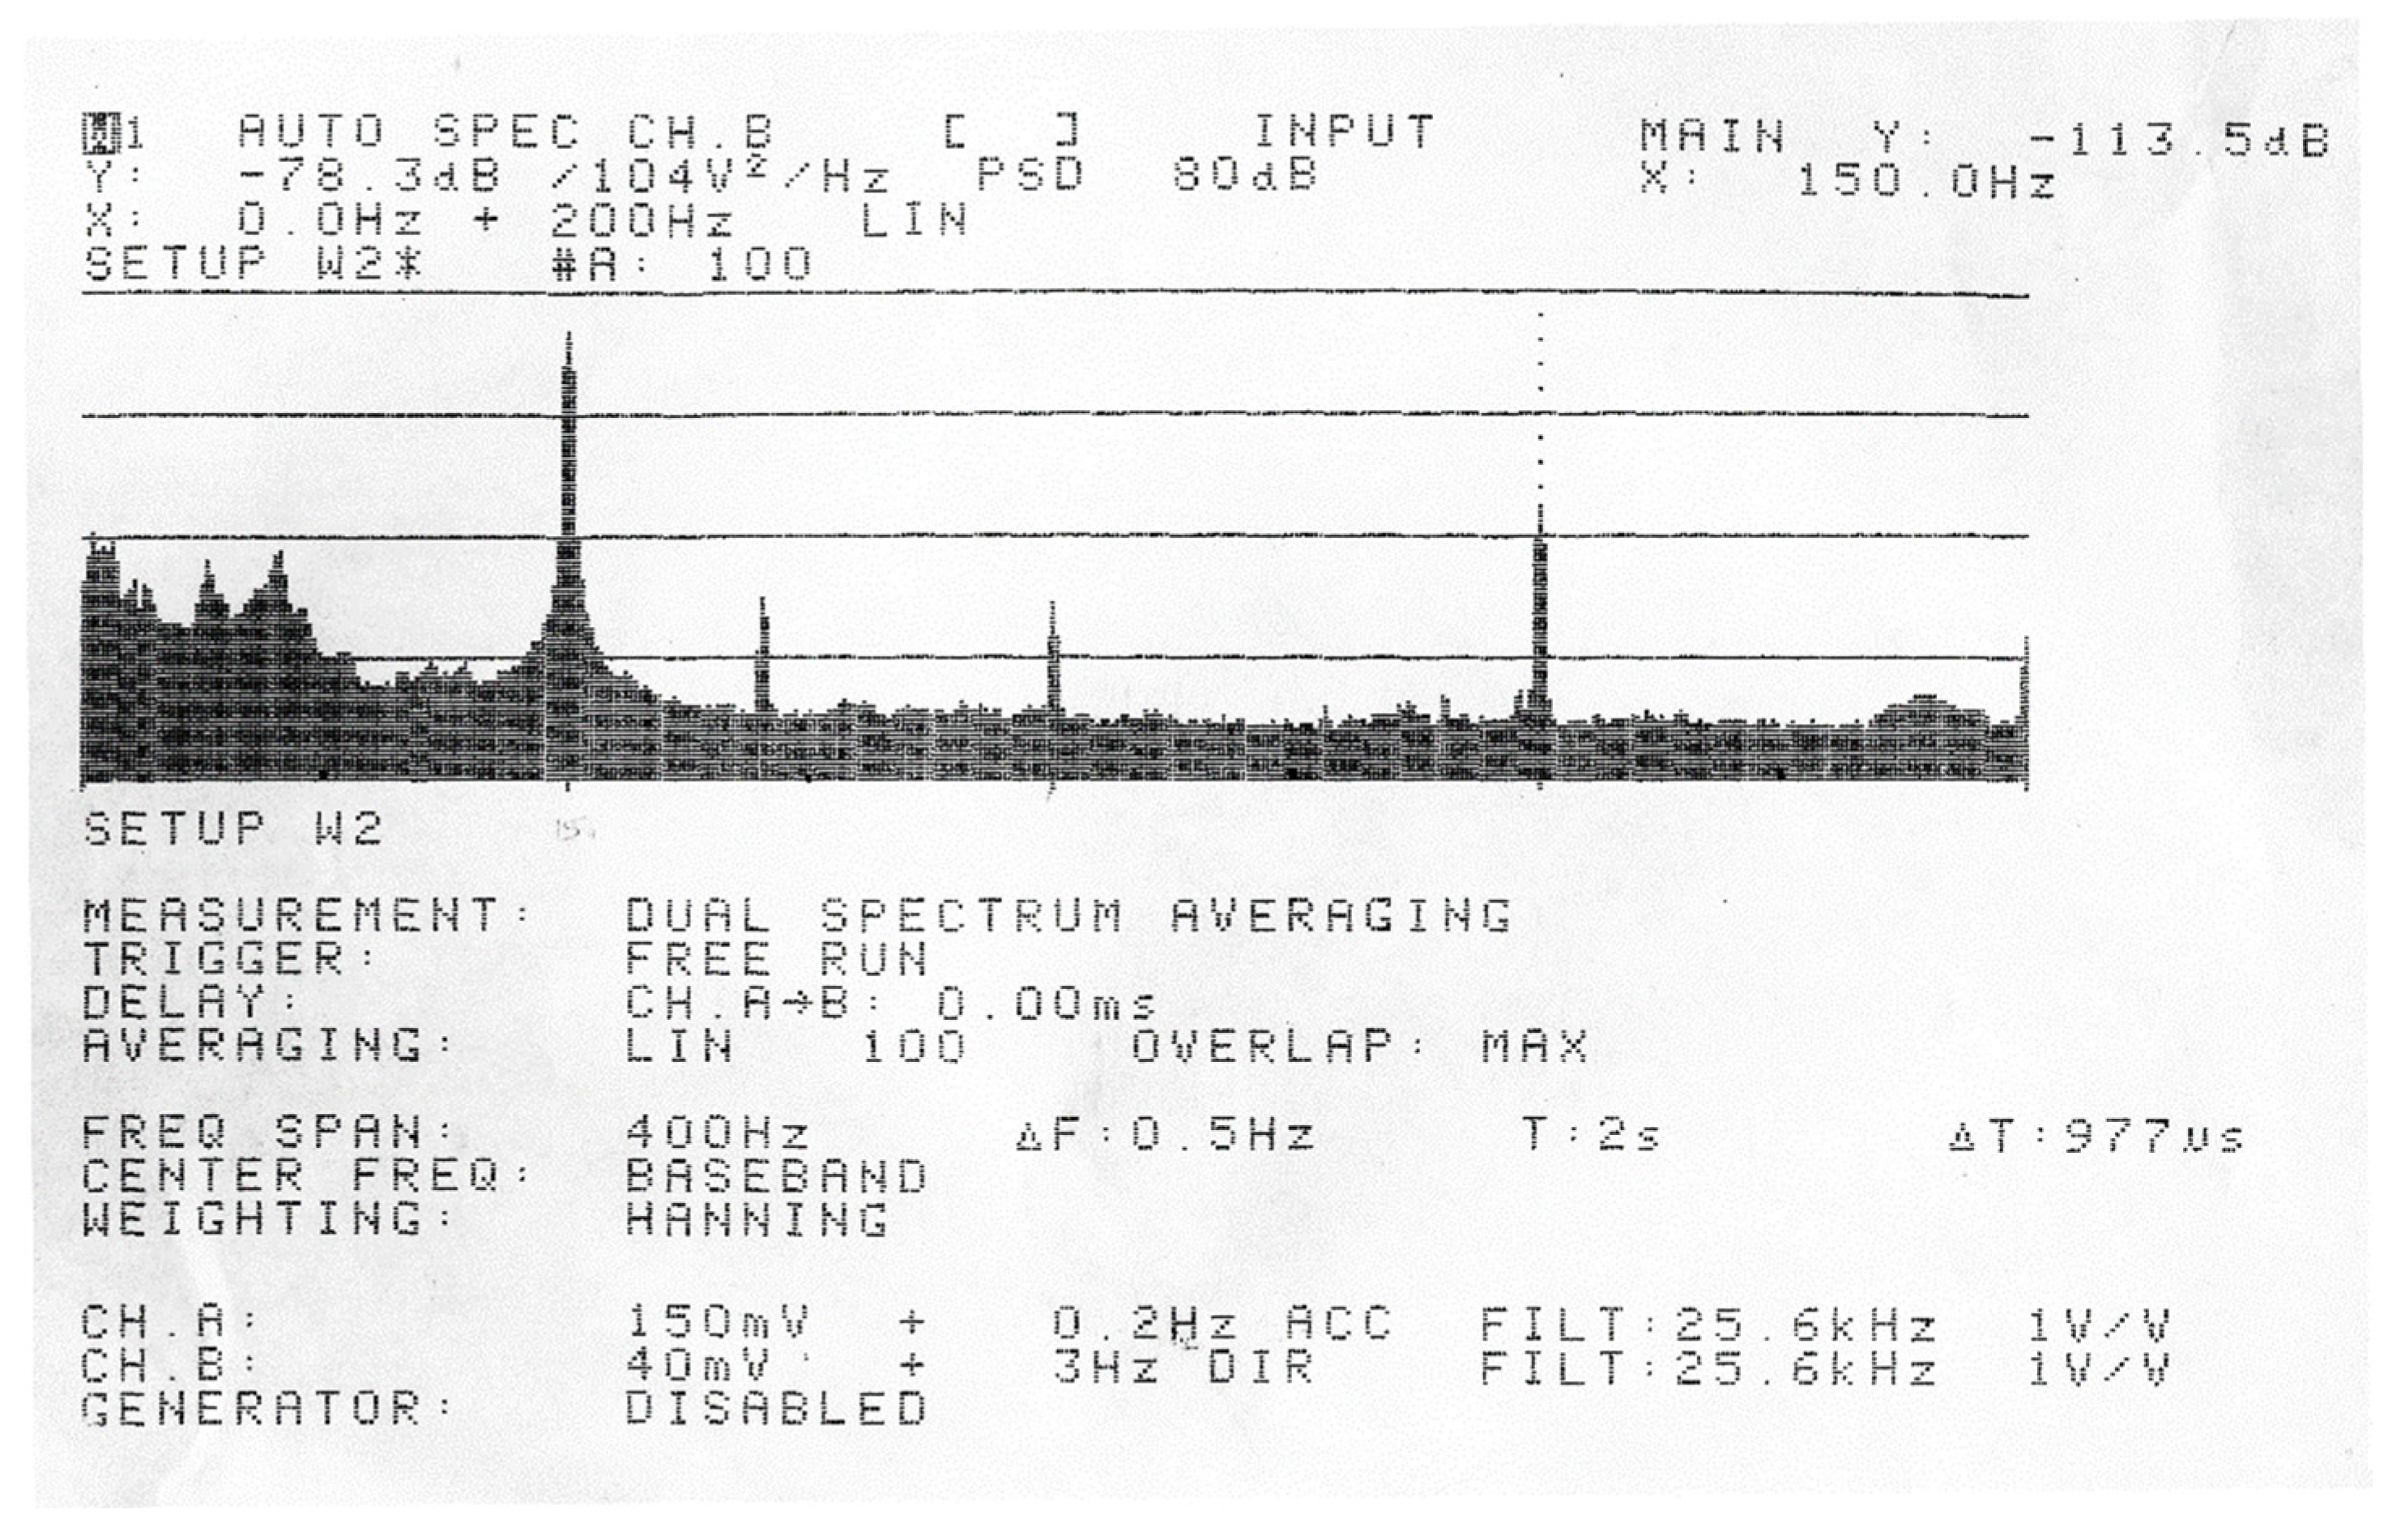
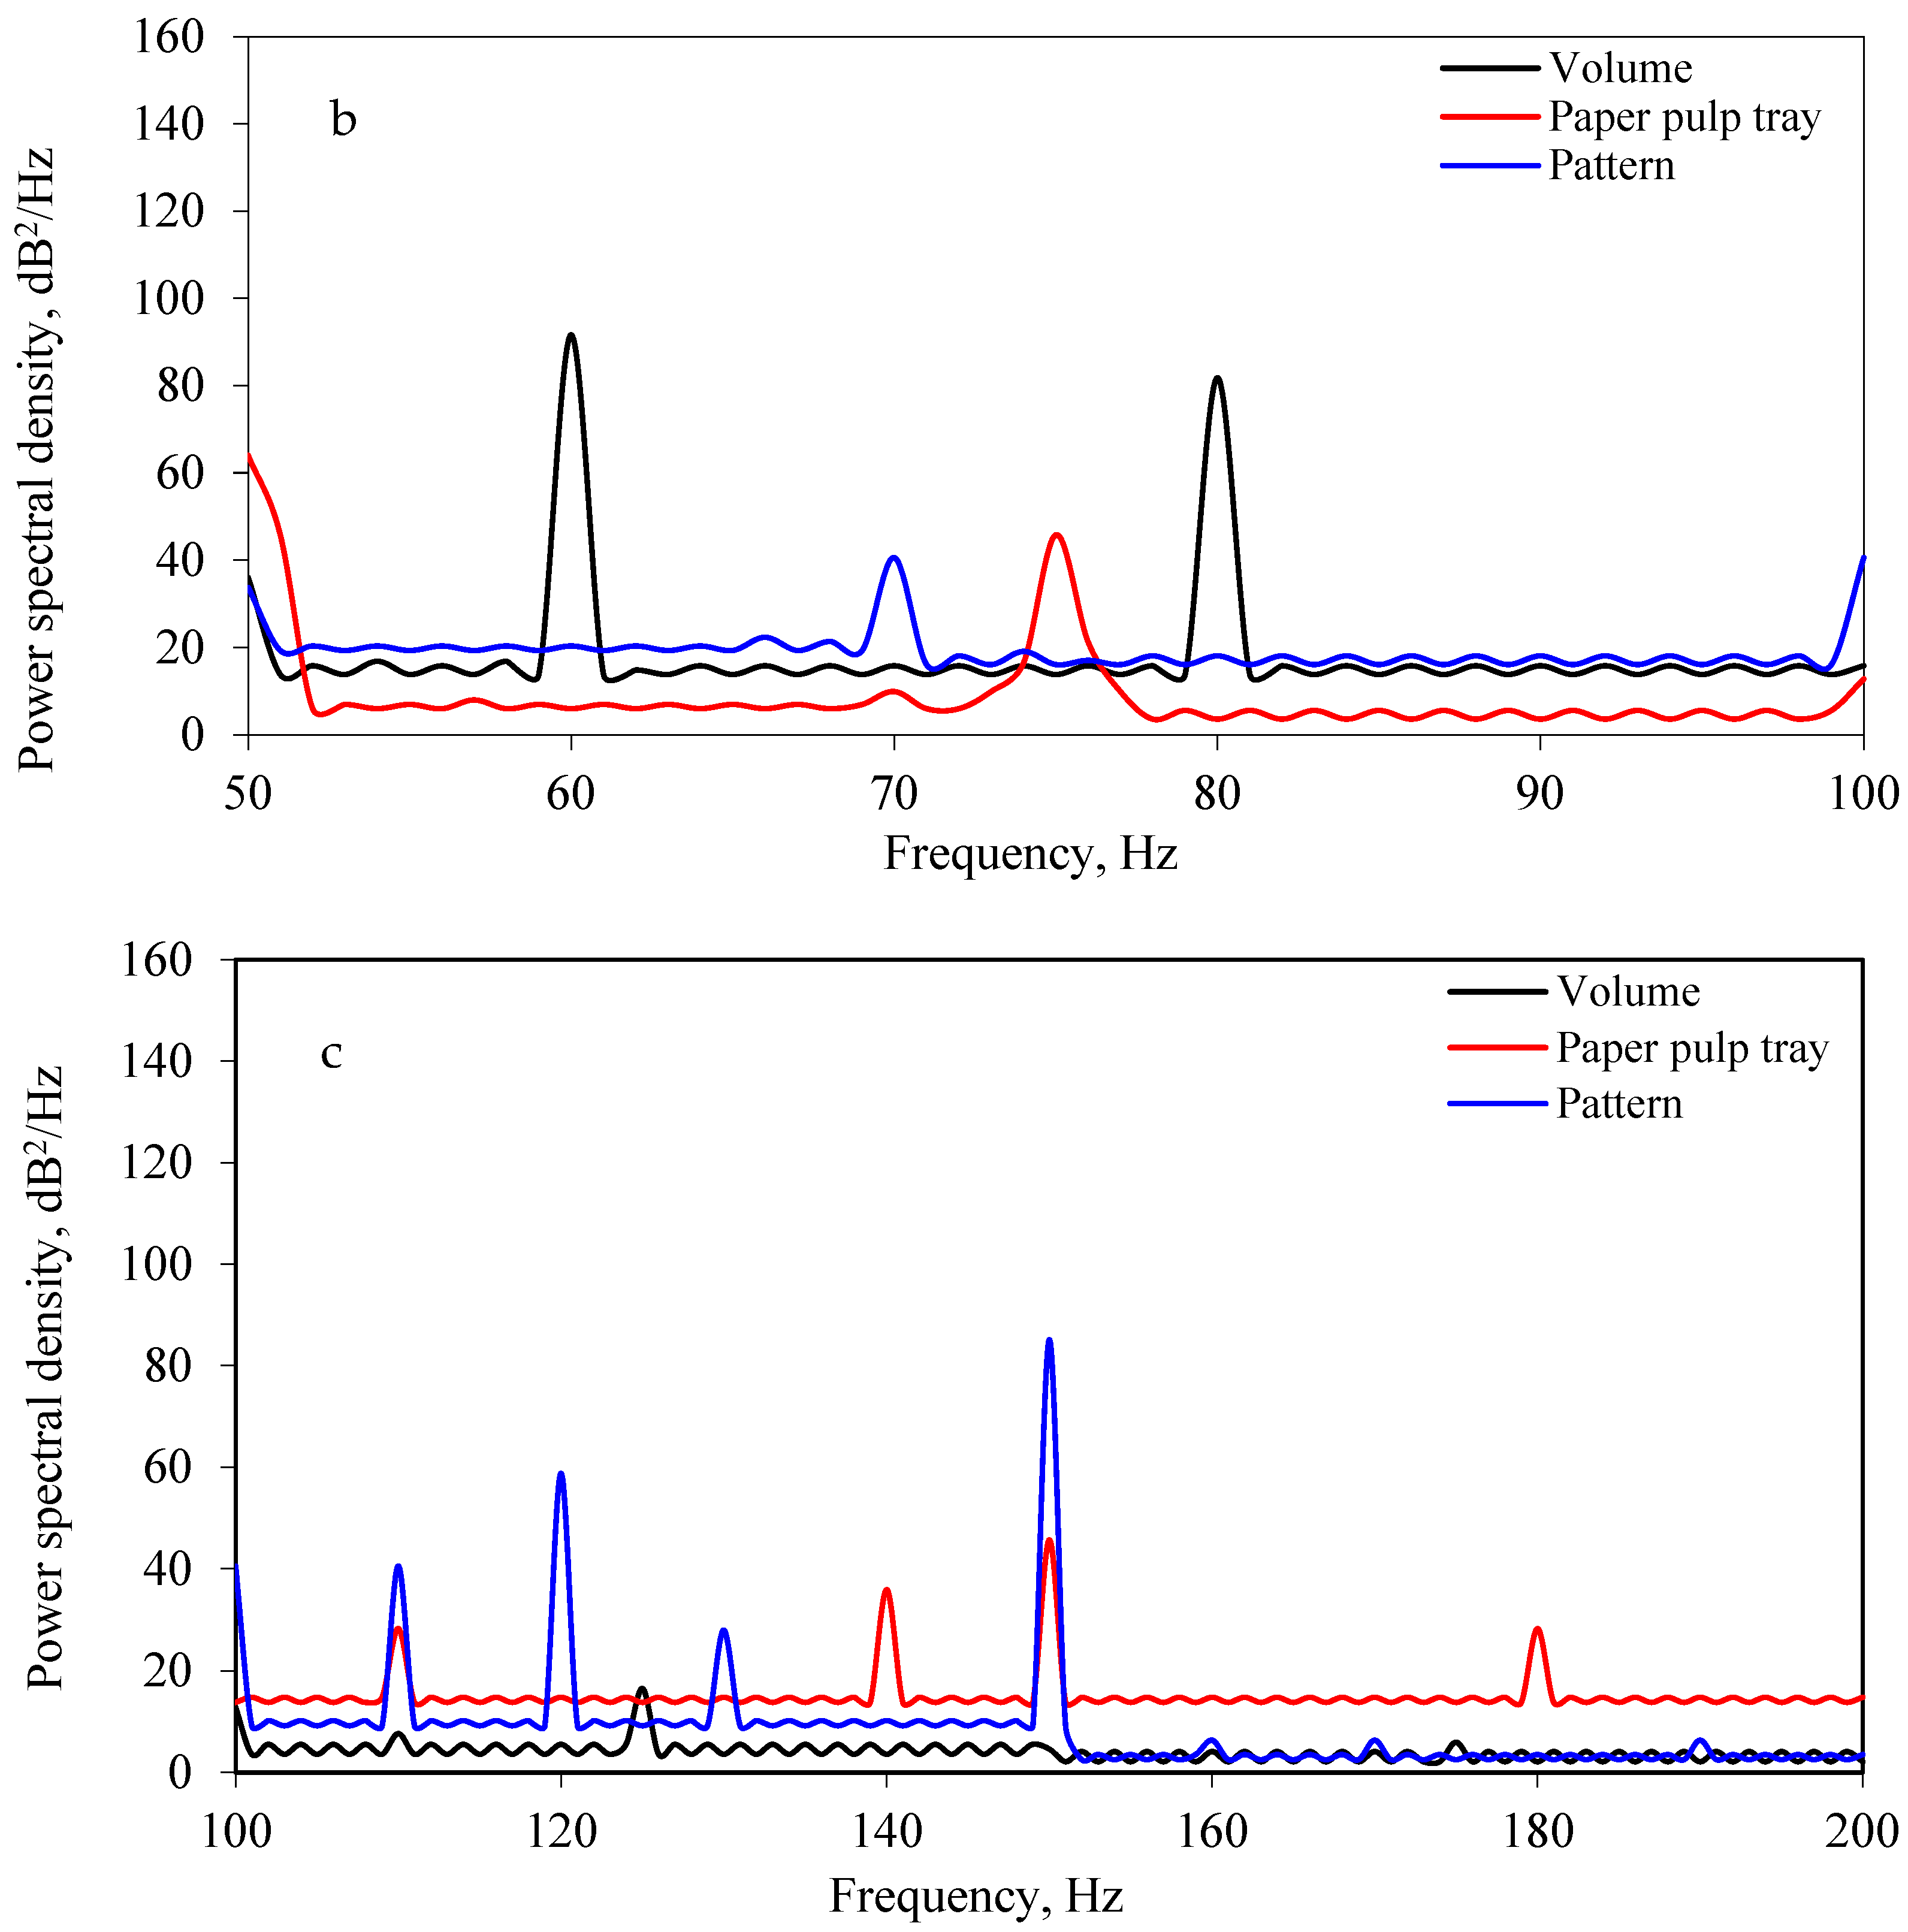
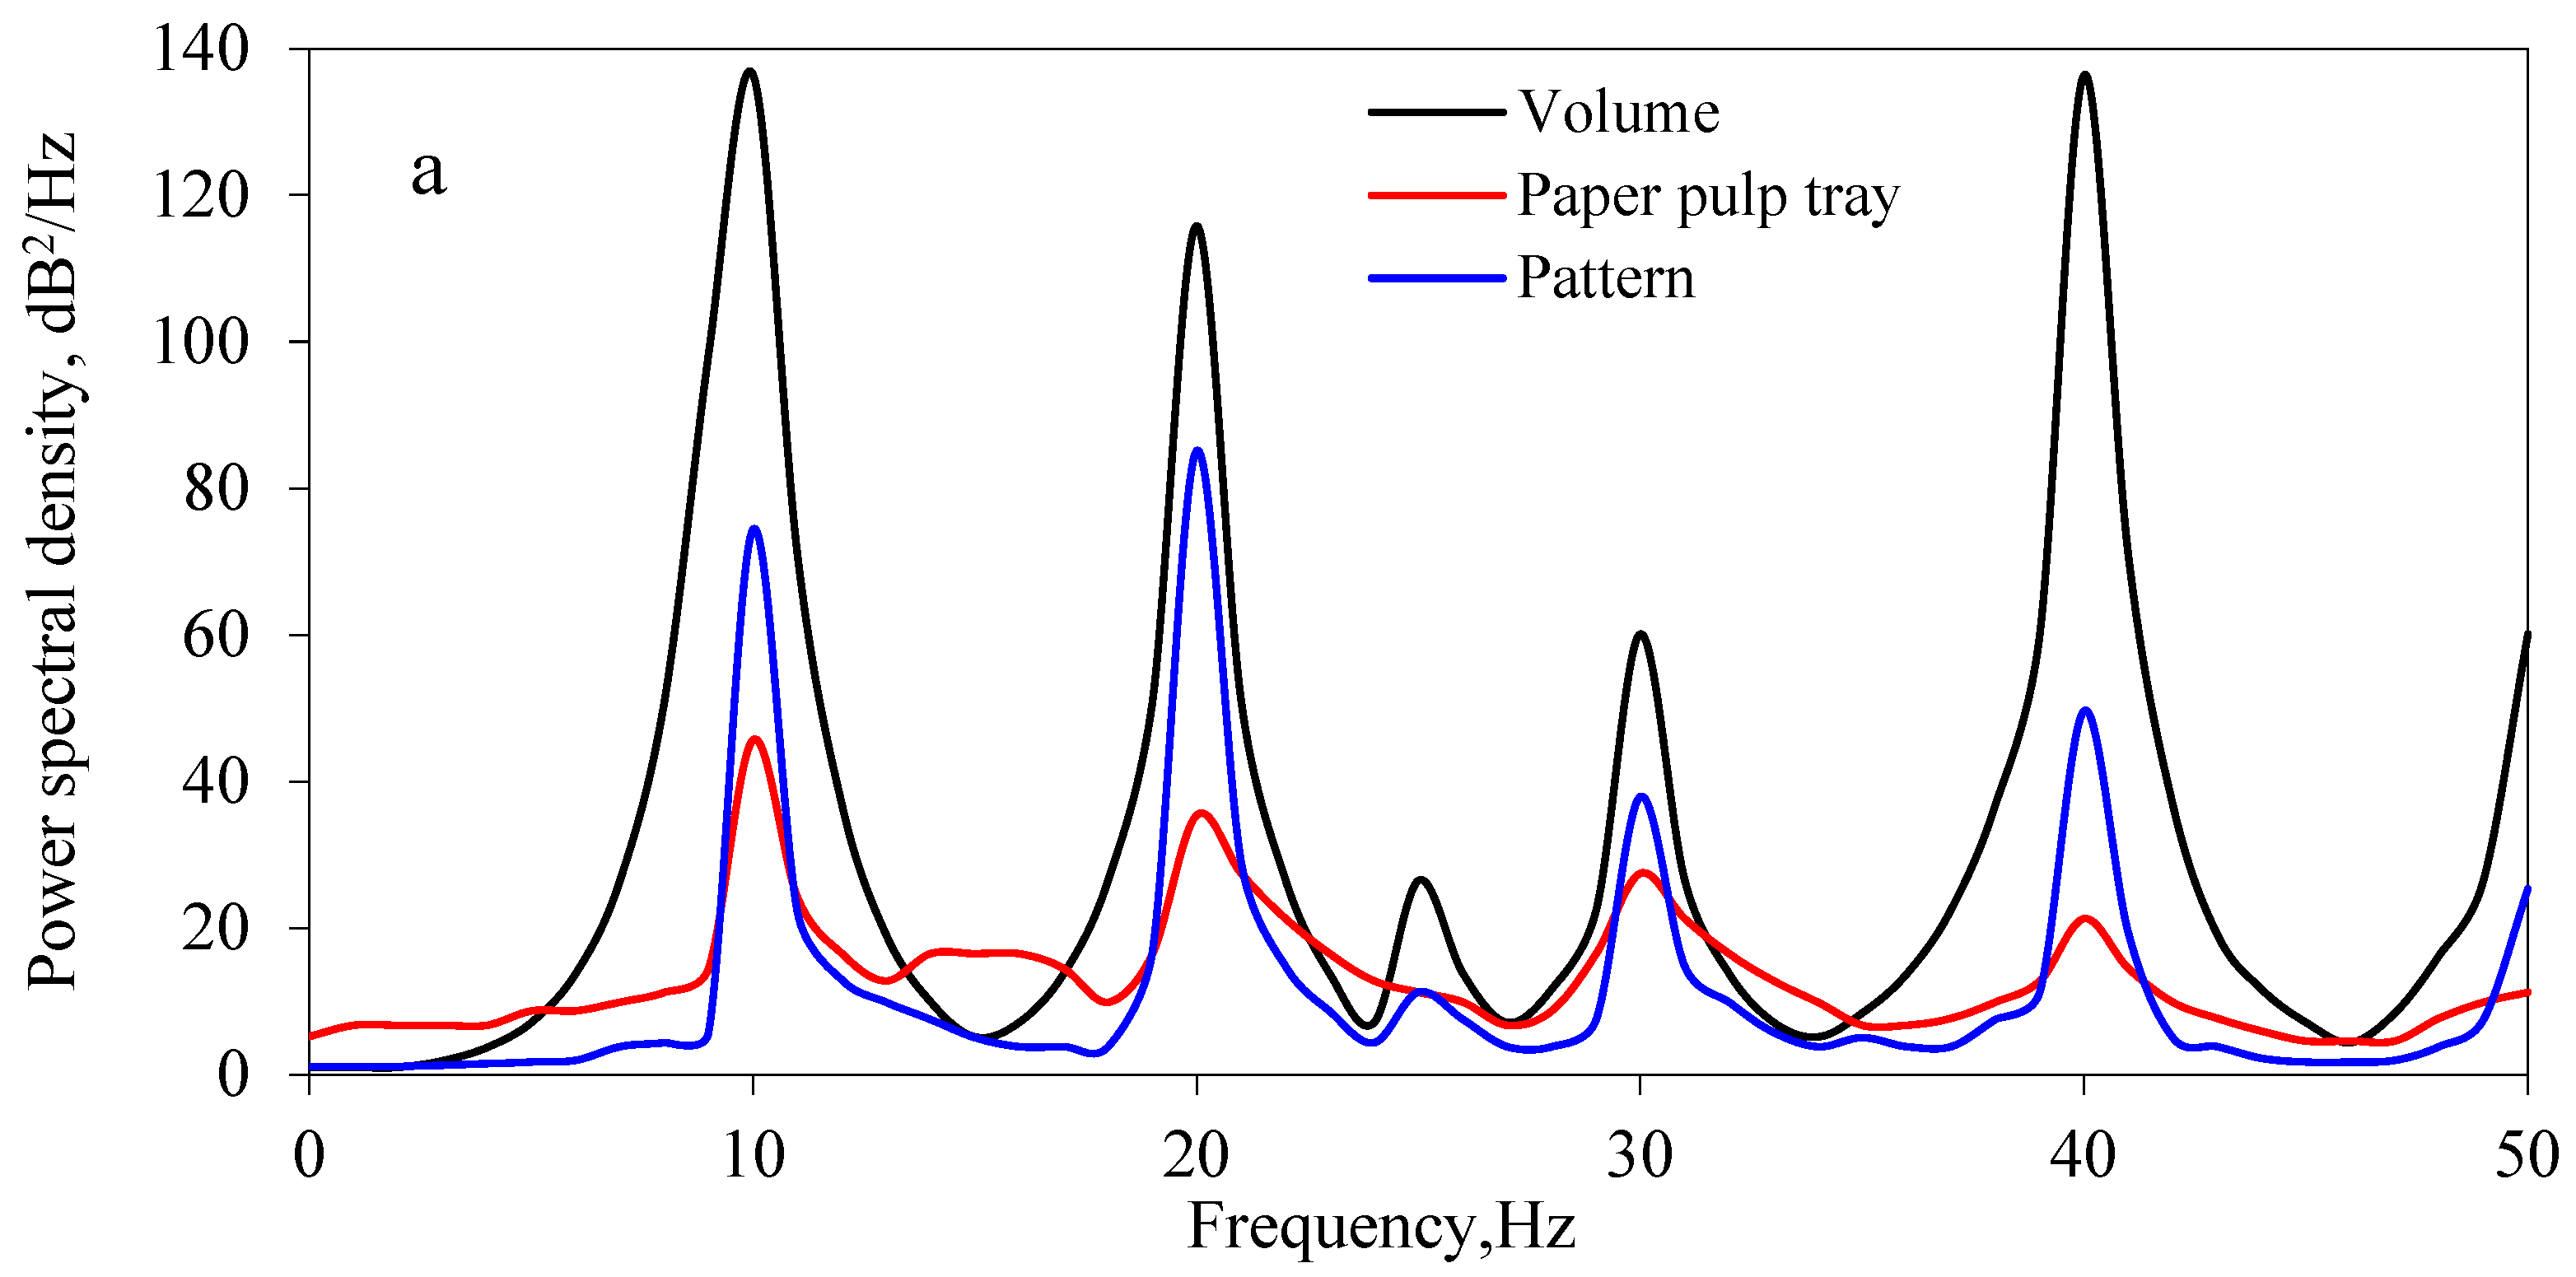
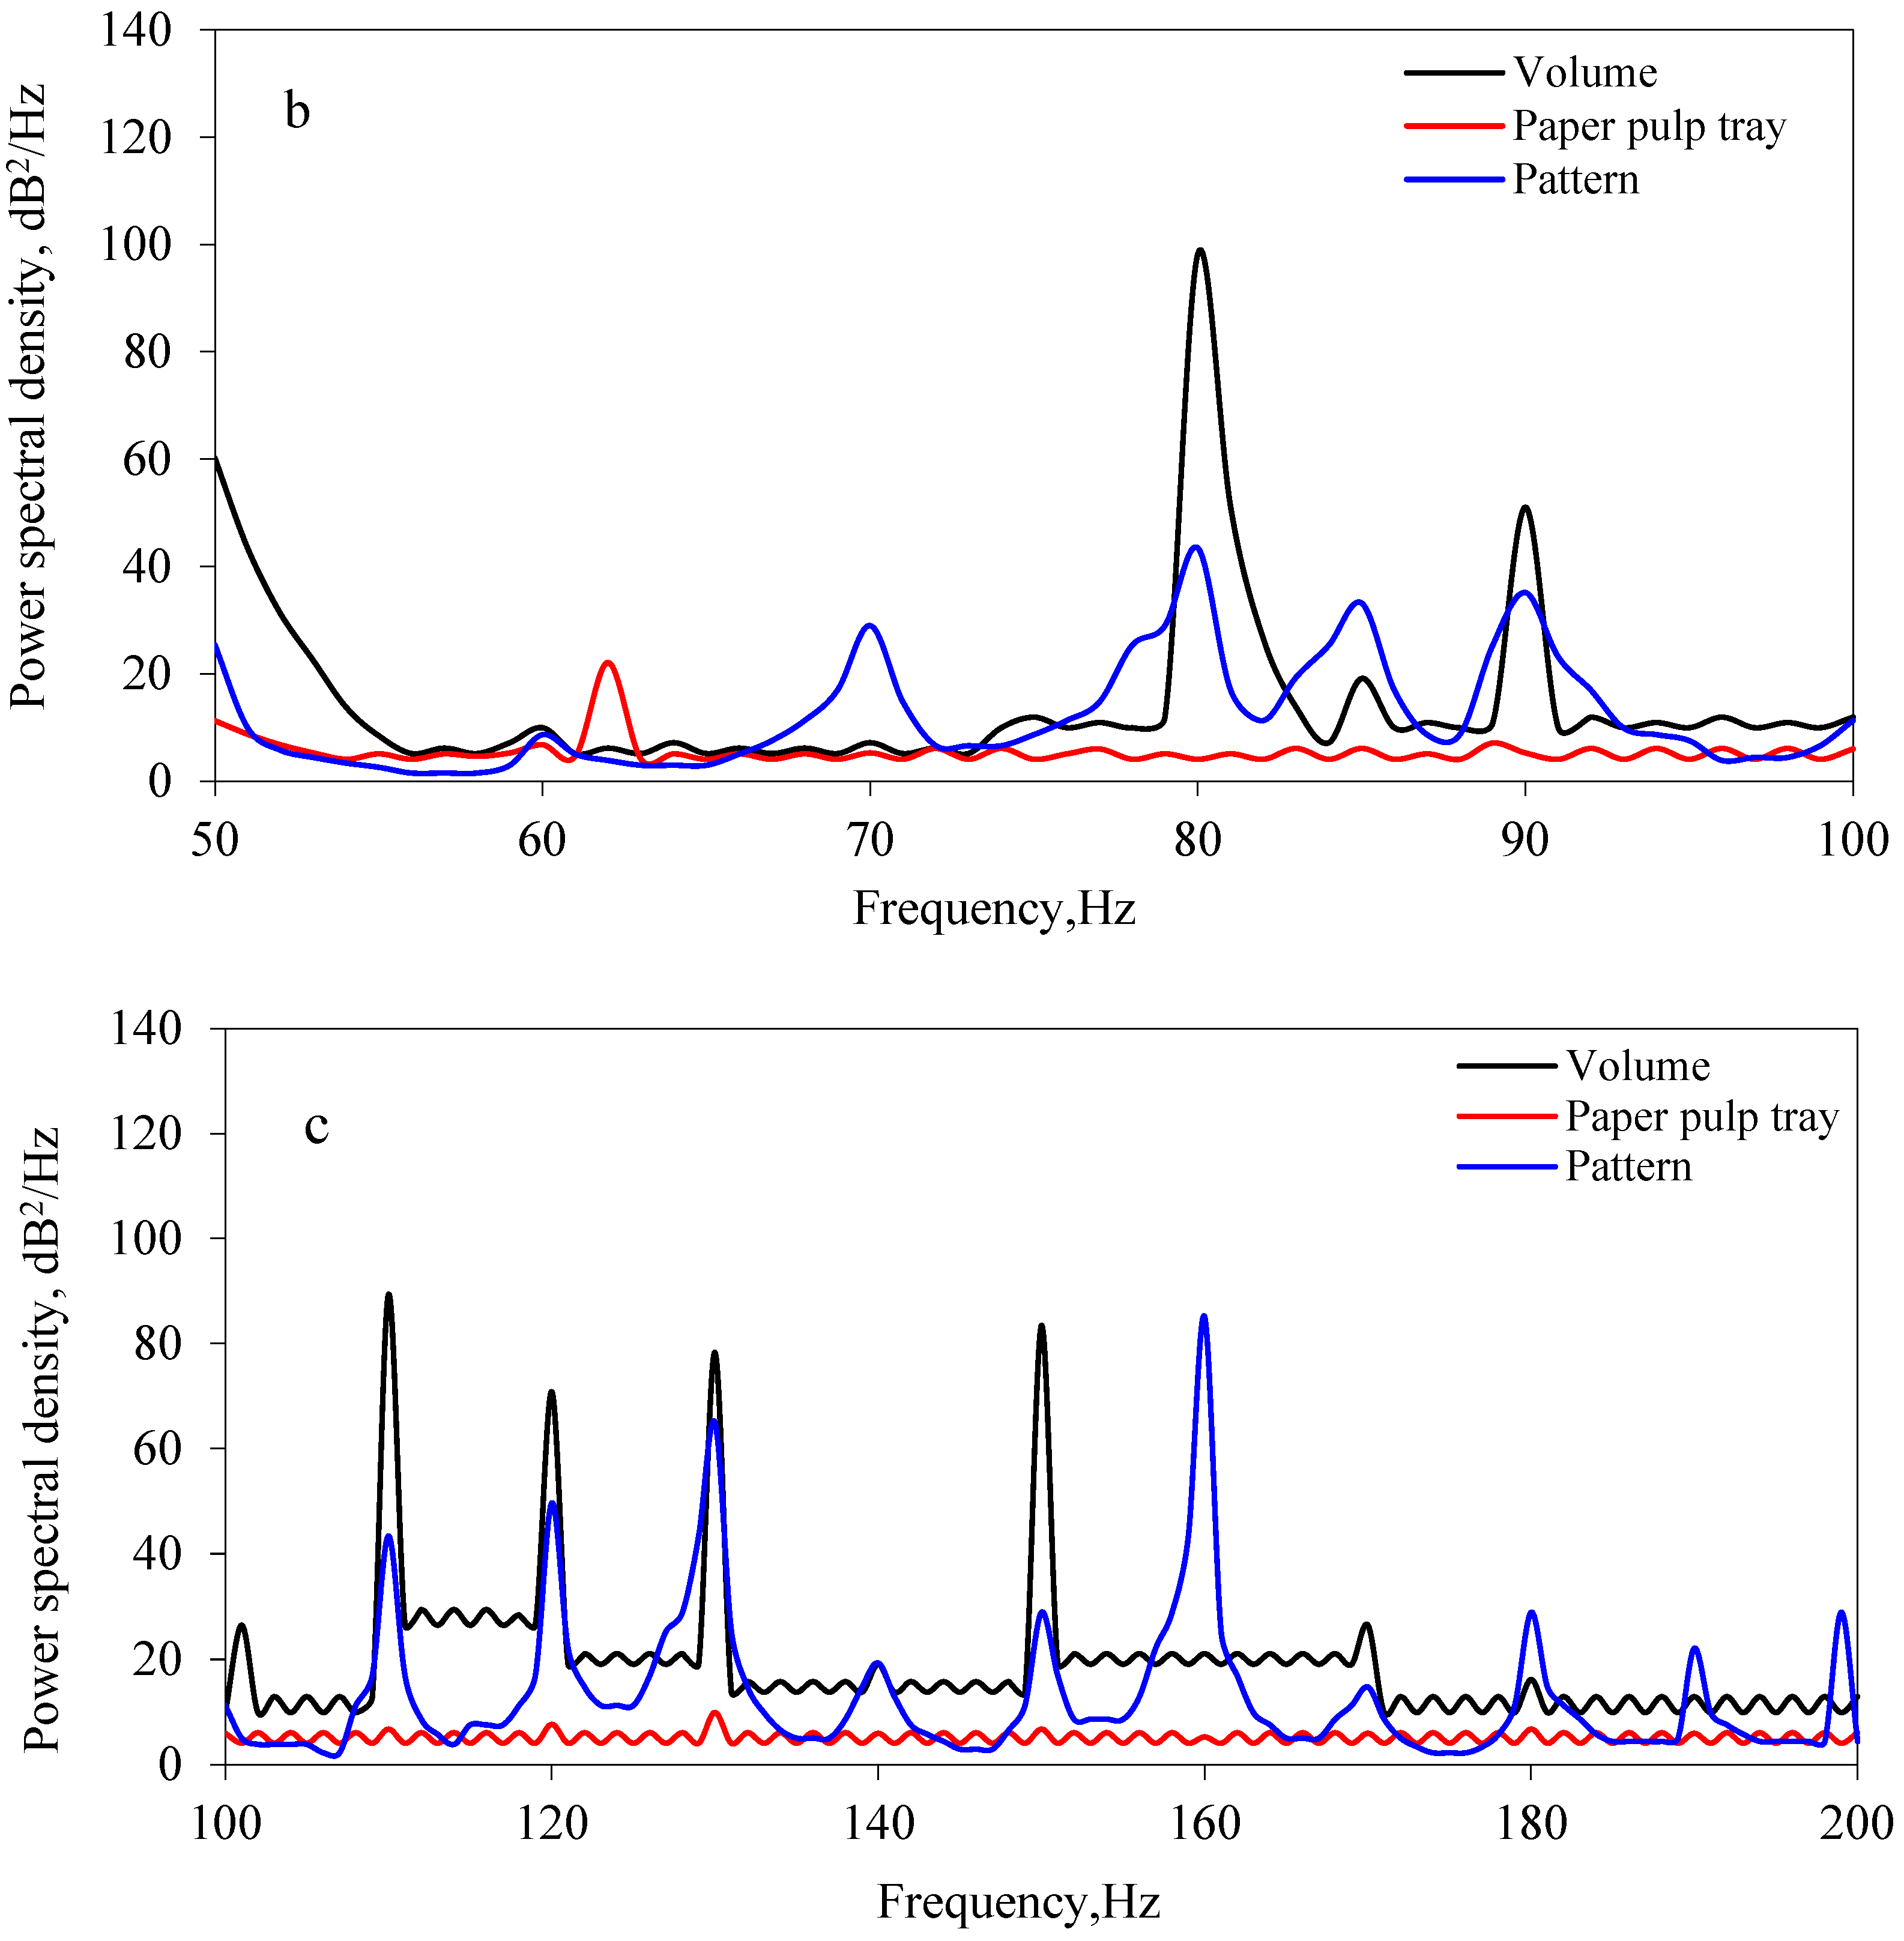
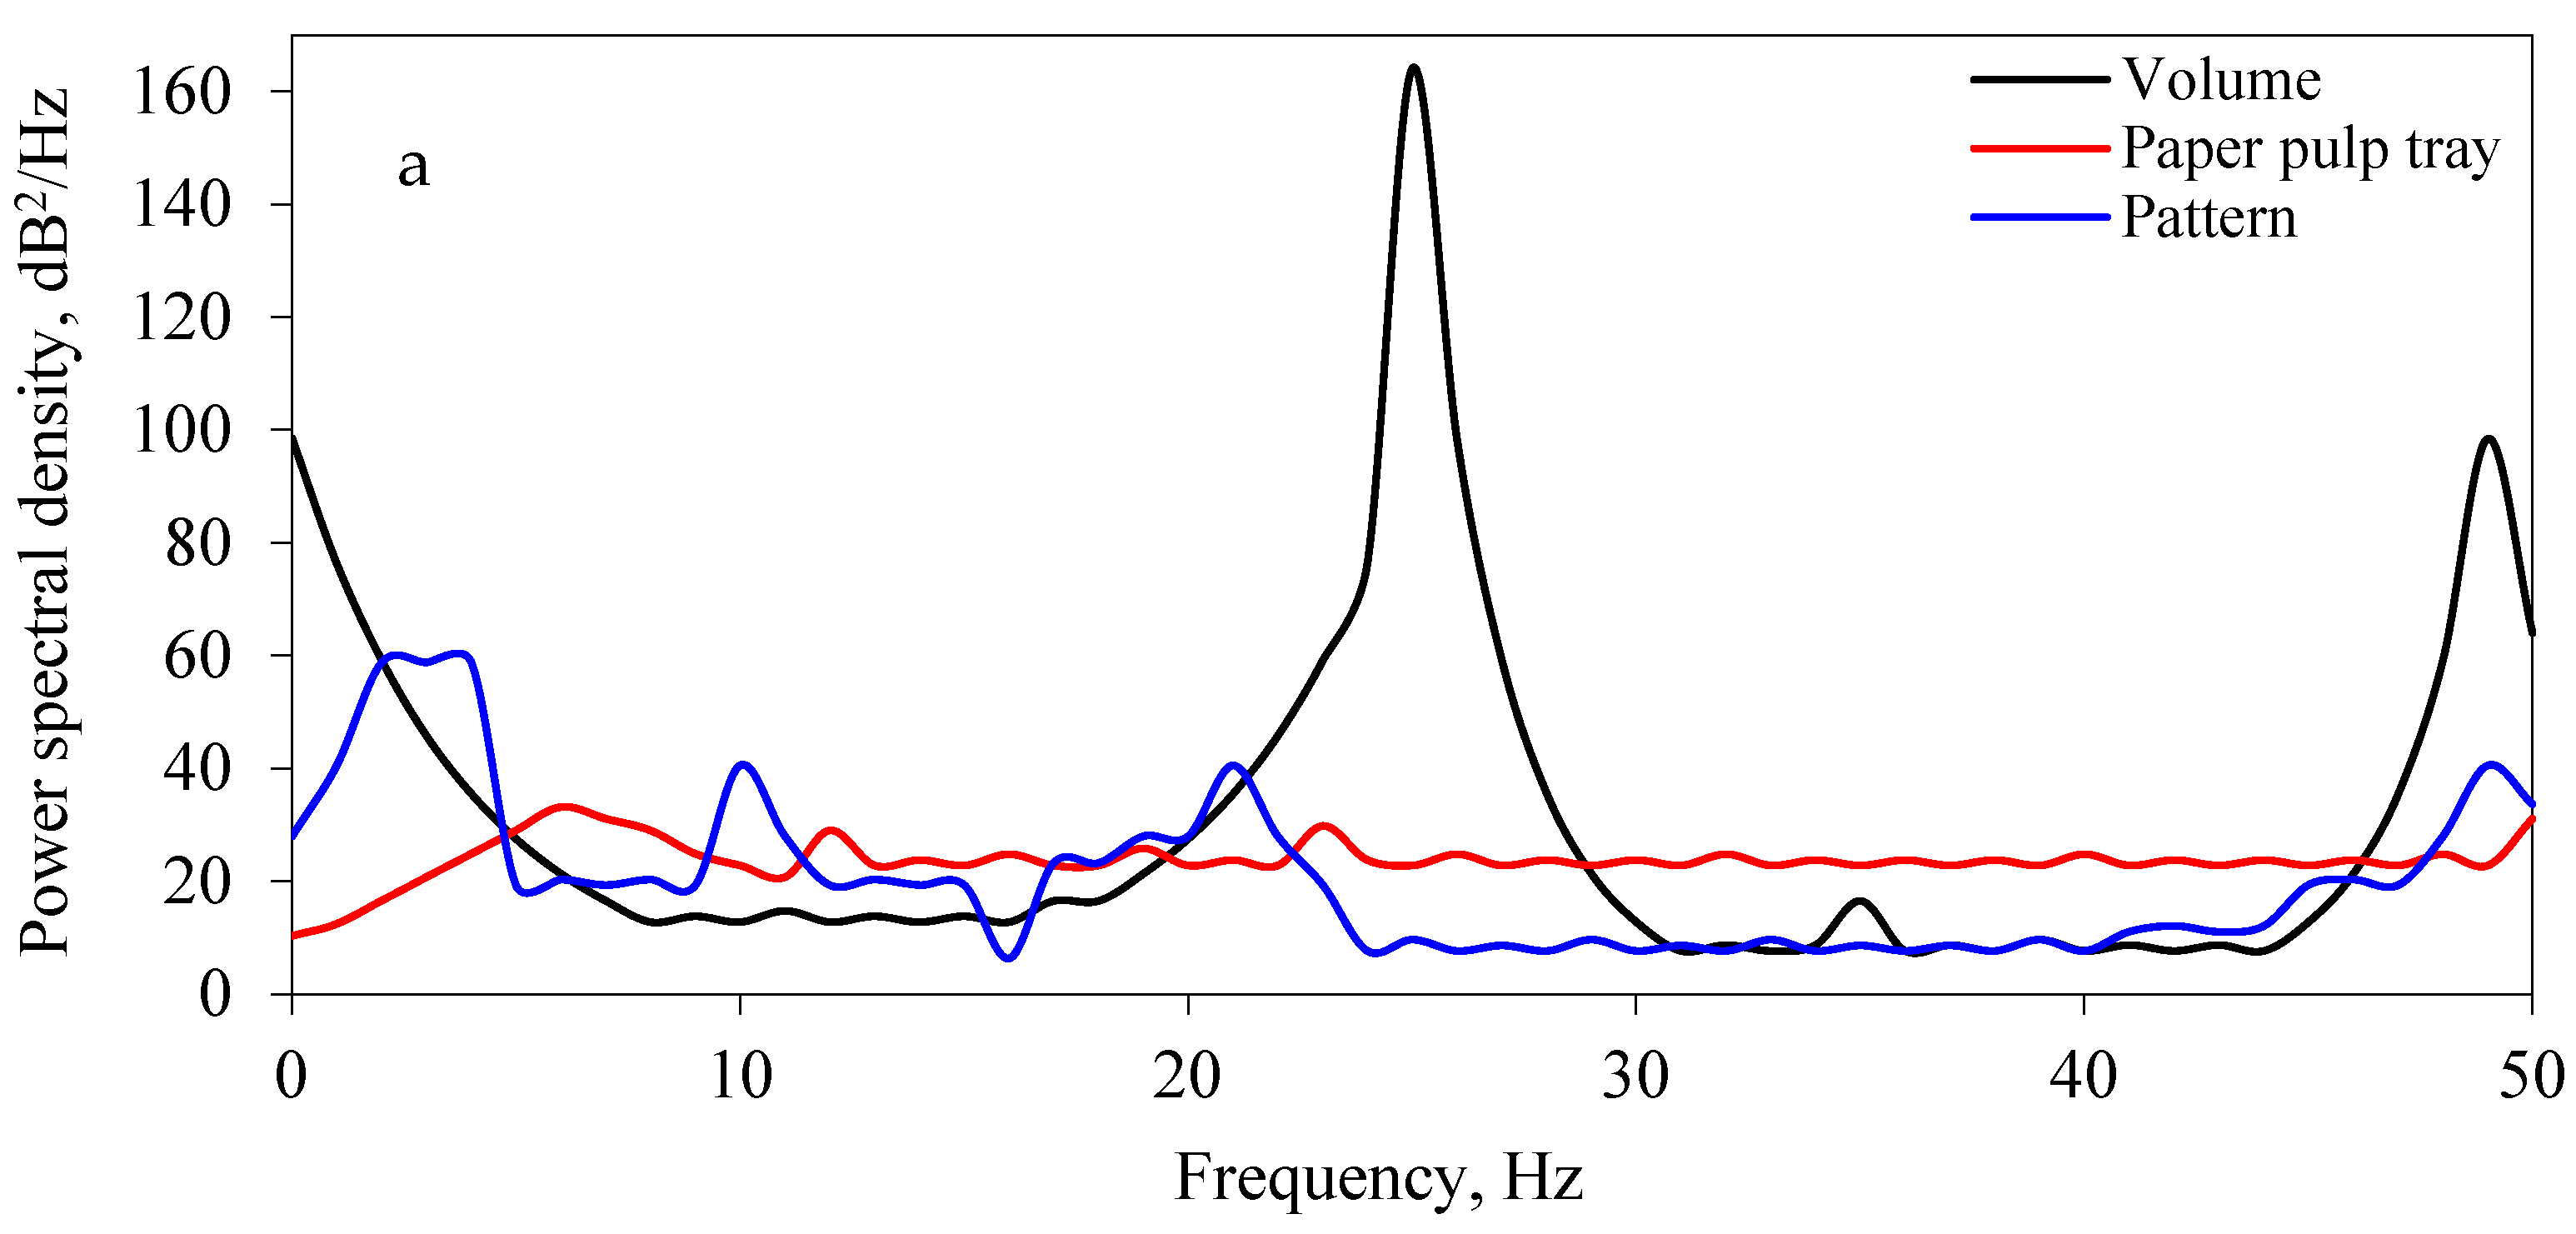
3.4. The Effect of Different Levels of Vibration Frequency on the Dynamic Properties of Cantaloupe during Excitation

The variation of the vibration characteristics of cantaloupe with the correlation of their behavior and material properties were studied using (OMA) for the three types of packaging method. Vertical bending and torsion modes in the frequency range of 0–200 Hz were used to determine the dynamic behavior of cantaloupe, and six modes were identified in this frequency range. Table 4, Table 5 and Table 6 show the obtained natural frequencies, damping loss factor, elasticity, and stiffness factor for all three types of packing methods, using the technique of estimating the model under excitation conditions. To understand the factors involved in cantaloupe damage during transportation, it is important to know that in vibrating systems, a much higher acceleration occurs when the natural frequency is reached. The first test was performed with paper pulp tray packing method, the second with the pattern packing method, and the third with the volume packing method for the cantaloupe fruit. The natural frequencies obtained in the three experimental tests changed only slightly.
According to our findings, the paper pulp tray approach is the most successful in reducing vibration levels during transit. This could be attributed to the paper pulp tray’s ability to increase the quality and safety of fruits after harvest and during the post-harvest process.
From Table 4, Table 5 and Table 6, note the increasing damping in the case of the paper pulp tray when compared to the pattern and volume methods, The addition of mass to these materials may cause the natural frequency of the fruit to be moved out of range of the conveying vehicle (exciting force), resulting in diminished resonance vibrations and vibration bruising.
When examining the values of natural frequency, damping ratio, stiffness factor, and the modulus of elasticity for cantaloupe for all three types of packing methods, when there is an increase in the natural frequency, stiffness factor, and modulus of elasticity, this decreases the damping ratio. The decreasing rate of the damping ratio for cantaloupe were 74, 75, and 96% for the different packing methods (paper pulp tray, pattern, volume), respectively. The damping ratio refers to the additional mass of the material, which can shift the natural frequency of the fruit from the range of that of the transport vehicle, and reduce the resonant oscillations and vibration bruising.

4. Conclusions

Damage to fruits can be reduced and their quality can be improved during the harvesting process and post-harvesting process if the packagers use the paper pulp tray packing method. The range of resonance frequencies is important for transporting cantaloupe; a higher resonance frequency starting value is an indication for stiffer cantaloupe bottoms, and the paper pulp tray shifts the resonance frequency when compared to the volume packing method. Another interesting observation in this study is that a fruit with a high internal damping capacity is not as damaged by exciting vibrations as a fruit with a low damping capacity, even if its natural frequency falls within the range of excitation.
Fruit packed in a paper pulp tray has a smaller resonant vibration and less bruising because the natural frequencies of the fruit are moved out of the range of the transport vehicle. The study of the dynamic responses of agricultural products allows for a quick understanding of their actual condition and helps manufacturers create transportation equipment, suspensions, and conveyors. We recommend avoiding exposure of the cantaloupe to high vibration frequencies, as this will raise the frequency below the damping ratio of the packaging, resulting in more damaged fruit. This could be due to the mechanical element’s harmonic frequency approaching the cantaloupe’s natural frequency, necessitating a careful design of the fruit trolley system to keep the fruit’s resonant frequencies away from the rotational system’s excitation frequency.

Author Contributions

M.M.A. Conceptualization, Methodology, Formal analysis, Investigation, Data curation, Supervision, Funding acquisition, Resource, Writing; A.S. Methodology, Data curation, Writing, Revising draft, Validation; B.M.A.A. Conceptualization, Methodology, Data curation, Writing, Revising draft, Validation. All authors have read and agreed to the published version of the manuscript.

Funding

This research was funded by the Deanship of Scientific Research, Vice Presidency for Graduate Studies and Scientific Research, King Faisal University, Saudi Arabia [Project No. AN000382].

Institutional Review Board Statement

Not applicable.

Informed Consent Statement

Not applicable.

Data Availability Statement

Not applicable.

Acknowledgments

This work was supported through the Annual Funding track by the Deanship of Scientific Research, Vice Presidency for Graduate Studies and Scientific Research, King Faisal University, Saudi Arabia [Project No. AN000382].

Conflicts of Interest

The authors declare no conflict of interest.

References

  1. Amer, B.M.A.; Azam, M.M. Using hot water as a pretreatment to extend the shelf life of cucumbers (Cucumis sativus L.) under cold storage system. J. Food Process Eng. 2019, 42, e12958. [Google Scholar] [CrossRef]
  2. Peleg, K.; Hinga, S. Simulation of vibration damage in produce transportation. Trans. ASAE 1986, 29, 633–641. [Google Scholar] [CrossRef]
  3. Ishikawa, Y.; Kitazawa, H.; Shiina, T. Vibration and Shock Analysis of Fruit and Vegetables Transport “Cherry Transport from Yamagata to Taipei”. JARQ 2009, 43, 129–135. [Google Scholar] [CrossRef] [Green Version]
  4. Zhou, R.; Wu, Q. Simulate the effects of different levels of road transportation vibration on the softening and pectin degradation of cantaloupe. Zhejiang J. Agric. Sci. 2018, 30, 1832–1838. [Google Scholar]
  5. Abera, G.; Ibrahim, A.M.; Forsido, S.F.; Kuyu, C.G. Assessment on post-harvest losses of tomato (Lycopersicon esculentem Mill.) in selected districts of East Shewa Zone of Ethiopia using a commodity system analysis methodology. Heliyon 2020, 6, e03749. [Google Scholar] [CrossRef]
  6. Imanpanah, H.; Kasraei, M.; Raoufat, M.H.; Nejadi, J. Development and evaluation of a portable apparatus for bioyield detection: A case study with apple and peach fruits. Int. J. Food Prop. 2015, 18, 1434–1445. [Google Scholar] [CrossRef]
  7. Kawai, T.; Matsumori, F.; Akimoto, H.; Sakurai, N.; Hirano, K.; Nakano, R.; Fukuda, F. Nondestructive detection of split-pit peach fruit on trees with an acoustic vibration method. Hortic. J. 2018, 87, 499–507. [Google Scholar] [CrossRef] [Green Version]
  8. Vergano, P.J.; Testin, R.F.; Newall, W.C., Jr. Peach bruising: Susceptibility to impact, vibration and compression abuse. Trans. ASAE 1991, 34, 2110–2116. [Google Scholar] [CrossRef]
  9. Ogut, H.; Peker, A.; Aydin, C. Simulated transit studies on peaches: Effects of containers cushion materials and vibration on elasticity modulus. Agric. Mech. Asia Afr. Lat. Am. 1999, 30, 59–62. [Google Scholar]
  10. Khodaei, M.; Seiiedlou, S.; Sadeghi, M. The evaluation of vibration damage in fresh apricots during simulated transport. Res. Agric. Eng. 2019, 65, 112–122. [Google Scholar] [CrossRef]
  11. Turczyn, M.T.; Grant, S.W.; Ashby, B.H.; Wheaton, F.W. Potato shatter bruising during laboratory handling and transport simulation. Trans. ASAE 1986, 29, 1171–1175. [Google Scholar] [CrossRef]
  12. Azam, M.M.; Amer Eissa, A.H. Comprehensive Evaluation of Dynamic Impact as a Measure of Potato Quality. Int. J. Food Eng. Technol. 2015, 1, 1–10. [Google Scholar]
  13. Pathare, P.B.; Al-Dairi, M. Effect of Simulated Vibration and Storage on Quality of Tomato. Horticulturae 2021, 7, 417. [Google Scholar] [CrossRef]
  14. Albaloushi, N.; Azam, M.M.; Amer Eissa, A.H. Mechanical Properties of Tomato Fruits under Storage Conditions. J. Appl. Sci. Res. 2012, 8, 3053–3064. [Google Scholar]
  15. La Scalia, G.; Aiello, G.; Miceli, A.; Nasca, A.; Alfonzo, A.; Settanni, L. Effect of Vibration on the Quality of Strawberry Fruits Caused by Simulated Transport. J. Food Process Eng. 2015, 39, 140–156. [Google Scholar] [CrossRef]
  16. Vursavuş, K.; Özgüven, F. Determining the effects of vibration and packaging method on mechanical damage in golden delicious apples. Turk. J. Agric. For. 2004, 28, 311–320. [Google Scholar]
  17. Acıcan, T.; Alibas, K.; Özelkök, I.S. Mechanical damage to apples during transport in wooden crates. Biosyst. Eng. 2007, 96, 239–248. [Google Scholar] [CrossRef]
  18. Gomaa, F.R.; Gamea, G.R.; Azam, M.M.; Amer Eissa, A.H. Health Monitoring of Packed Agricultural Products Using Dynamic Analysis. Eng. Res. J. 2011, 34, 377–394. [Google Scholar]
  19. Amer Eissa, A.H.; Gamaa, G.R.; Gomaa, F.R.; Azam, M.M. Comparison of Package Cushioning Materials to Protect Vibration Damage to Golden Delicious. Int. J. Latest Trends Agric. Food Sci. 2012, 2, 36–57. [Google Scholar]
  20. Amer Eissa, A.H.; Albaloushi, N.; Azam, M.M. Vibration Analysis Influence During Crisis Transport of the Quality of Fresh Fruit on Food Security. Agric. Eng. Int. CIGR J. 2013, 15, 181–190. [Google Scholar]
  21. Ding, C.; Feng, Z.; Wang, D.; Cui, D.; Li, W. Acoustic vibration technology: Toward a promising fruit quality detection method. Compr. Rev. Food Sci. Food Saf. 2021, 20, 1655–1680. [Google Scholar] [CrossRef] [PubMed]
  22. Chen, X.; Yuan, P.P.; Deng, X.Y. Watermelon ripeness detection by wavelet multiresolution decomposition of acoustic impulse response signals. Postharvest Biol. Technol. 2018, 142, 135–141. [Google Scholar] [CrossRef]
  23. Ding, C.; Wu, H.; Feng, Z.; Wang, D.; Li, W.; Cui, D. Online assessment of pear firmness by acoustic vibration analysis. Postharvest Biol. Technol. 2020, 160, 111042. [Google Scholar] [CrossRef]
  24. Hui, Z.; Jie, W.; Zhao, Z.; Wang, Z. Nondestructive firmness measurement of differently shaped pears with a dual-frequency index based on acoustic vibration. Postharvest Biol. Technol. 2018, 138, 11–18. [Google Scholar] [CrossRef]
  25. Jarimopas, B.; Singh, S.P.; Saengnil, W. Measurement and analysis of truck transport vibration levels and damage to packaged tangerines during transit. Packag. Technol. Sci. 2005, 18, 179–188. [Google Scholar] [CrossRef]
  26. Khalifa, S.; Komarizadeh, M.H.; Tousi, B. Usage of fruit response to both force and forced vibration applied to assess fruit firmness—A review. Aust. J. Crop Sci. 2011, 5, 516–522. [Google Scholar]
  27. Xuan, Y.; Xu, L.; Liu, G.; Zhou, J. The vibrational response of simulated Ginkgo biloba fruit based on their frequency spectrum characteristics. PLoS ONE 2020, 15, e0235494. [Google Scholar] [CrossRef]
  28. Xu, S.X.; Wu, H.Y.; Chen, H.J.; Han, Q. Effects of vibration stress on fruit quality and antioxidant enzyme activities of blueberry. For. Sci. 2017, 53, 26–34. [Google Scholar]
  29. Çakmak, B.; Can, H.Z.; Akdeniz, R.C.; Alayunt, F.N.; Aksoy, U. The Effect of Fruit Packaging Properties (Ficus carica L.) on Quality Loses of Fresh Fig Fruits During Transportation. Ege Üniversitesi Ziraat Fakültesi Derg. 2007, 44, 123–135. [Google Scholar]
  30. FAO. Prevention of Postharvest Food Losses: Fruits, Vegetables and Root Crops; A training Manual, FAO Training Series, No. 17/2; Food and Agriculture Organization of the United Nations: Italy, Rome, 1985. [Google Scholar]
  31. Osifo, E.O. Storage of perishable commodities. J. Trop. Post Harvest. 1995, 2, 43–50. [Google Scholar]
  32. Vigneault, C.; Thompson, J.; Wu, S. Designing container for handling fresh horticultural produce. Postharvest Technol. Hortic. Crops 2009, 2, 25–47. [Google Scholar]
  33. Abbaszadeh, R.; Moosavian, A.; Rajabipour, A.; Najafi, G. An intelligent procedure for watermelon ripeness detection based on vibration signals. J. Food Sci. Technol. 2015, 52, 1075–1081. [Google Scholar] [CrossRef] [PubMed] [Green Version]
  34. Abbaszadeh, R.; Rajabipour, A.; Delshad, M.; Mahjoob, M.; Ahmadi, H. Prediction of watermelon consumer acceptability based on vibration response spectrum. Int. J. Agric. Biosyst. Eng. 2011, 5, 365–368. [Google Scholar] [CrossRef]
  35. Fu, X.; Sun, J.; Lyu, C.; Meng, X.; Guo, H.; Yang, D. Evaluation on simulative transportation and storage quality of sweet cherry by different varieties based on principal component analysis. Food Sci. Technol. 2022, 42, 1–10. [Google Scholar] [CrossRef]
  36. Abbaszadeh, R.; Rajabipour, A.; Mahjoob, M.; Delshad, M.; Ahmadi, H. Evaluation of watermelons texture using their vibration responses. Biosyst. Eng. 2013, 115, 102–105. [Google Scholar] [CrossRef]
  37. Abdelsalam, A.M.; Sayed, M.S. Real-time defects detection system for orange citrus fruits using multi-spectral imaging. In Proceedings of the 2016 IEEE 59th International Midwest Symposium on Circuits and Systems (MWSCAS), Abu Dhabi, United Arab Emirates, 16–19 October 2016; pp. 65–68. [Google Scholar] [CrossRef]
  38. Aboonajmi, M.; Jahangiri, M.; Hassan-Beygi, S.R. A review on application of acoustic analysis in quality evaluation of agro-food products. J. Food Processing Preserv. 2015, 39, 3175–3188. [Google Scholar] [CrossRef]
  39. Chen, H.; Cao, S.; Fang, X.; Mu, H.; Yang, H.; Wang, X.; Xu, Q.; Gao, H. Changes in fruit firmness, cell wall composition and cellwall degrading enzymes in postharvest blueberries during storage. Sci. Hortic. 2015, 188, 44–48. [Google Scholar] [CrossRef]
  40. Landahl, S.; Terry, L.A. Non-destructive discrimination of avocado fruit ripeness using laser Doppler vibrometry. Biosyst. Eng. 2020, 194, 251–260. [Google Scholar] [CrossRef]
  41. Li, H.; Pidakala, P.; Billing, D.; Burdon, J. Kiwifruit firmness: Measurement by penetrometer and non-destructive devices. Postharvest Biol. Technol. 2016, 120, 127–137. [Google Scholar] [CrossRef]
  42. Kupferman, E. Minimizing Bruising in Apples; Postharvest Information Network; Washington State University, Tree Fruit Research and Extension Center: Washington, DC, USA, 2008. [Google Scholar]
  43. Ministry of Agriculture, Forestry and Fisheries. Food Balance Sheet. 2008. Available online: http://www.maff.go.jp/j/zyukyu/fbs/index.html (accessed on 1 April 2021). (In Japanese).
  44. Jahanbakhshi, A.; Abbaspour-Gilandeh, Y.; Ghamari, B.; Heidarbeigi, K. Assessment of physical, mechanical, and hydrodynamic properties in reducing postharvest losses of cantaloupe (Cucumis melo var. Cantaloupensis). J. Food Process Eng. 2019, 42, e13091. [Google Scholar] [CrossRef]
  45. Barchi, G.L.; Berardinelli, A.; Guarnieri, A.; Ragni, L.; Totaro Fila, C. Damage to loquats by vibration simulating intra-state transport. Biosyst. Eng. 2002, 82, 305–312. [Google Scholar] [CrossRef]
  46. Lu, Y.; Li, Z.; Pu, H.; Wang, D. Determination of storage time of watermelon based on acoustic impulse method. J. Zhejiang Agric. 2016, 28, 682–687. [Google Scholar] [CrossRef]
  47. Mayorga-Martinez, A.A.; Olvera-Trejo, D.; Elias-Zuniga, A.; Parra-Saldivar, R.; Chuck-Hernandez, C. Non-destructive assessment of guava (Psidium guajava L.) maturity and firmness based on mechanical vibration response. Food Bioprocess Technol. 2016, 9, 1471–1480. [Google Scholar] [CrossRef]
  48. Hussein, Z.; Fawole, O.A.; Opara, U.L. Investigating bruise susceptibility of pomegranate cultivars during postharvest handling. Afr. J. Rural. Dev. 2017, 2, 33–39. [Google Scholar] [CrossRef]
  49. Opara, U.L.; Pathare, P.B. Bruise damage measurement and analysis of fresh horticultural produce—A review. Postharvest Biol. Technol. 2014, 91, 9–24. [Google Scholar] [CrossRef]
  50. Peleg, K. Produce Handling Packaging and Distribution; AVI Publishing Company: Westport, CT, USA, 1985. [Google Scholar]
  51. Brandenberg, R.K.; Lee, J.J. Fundamentals of Packaging Dynamics; MTS Systems Corporation: Minneapolis, MN, USA, 1985. [Google Scholar]
  52. Nourain, J.; Ying, Y.; Wang, J.; Rao, X.; Yu, C. Firmness evaluation of melon using its vibration characteristic and finite element analysis. J. Zhejiang Univ. Sci. 2005, 6, 483–490. [Google Scholar] [CrossRef]
  53. Zarifneshat, S.; Ghassemzadeh, H.R.; Sadeghi, M.; Abbaspour-Fard, M.H.; Ahmadi, E.; Javadi, A.; Shervani-Tabar, M.T. Effect of Impact Level and Fruit Properties on Golden Delicious Apple Bruising. Am. J. Agric. Biol. Sci. 2010, 5, 114–121. [Google Scholar]
  54. Amer Essa, A.H.; Gamea, G.R. Physical and mechanical properties of bulb onions. Miser J. Agric. Eng. 2003, 20, 661–676. [Google Scholar]
  55. Shahbazi, F.; Rajabipour, A.; Mohtasebi, S.; Rafie, S. Simulated in-transit vibration damage to watermelons. J. Agric. Sci. Technol. 2010, 12, 23–34. [Google Scholar]
  56. Pretorius, C.J.; Steyn, W. Influence of road roughness on the transportation of fresh produce. In Proceedings of the 31st Southern African Transport Conference (SATC 2012), Pretoria, South Africa, 9–12 July 2012; Abdollahi, M., Abdoola, S., Eds.; pp. 142–153. [Google Scholar]
  57. Schulte, P.; Timm, E.J.; Brown, G.K.; Marshall, D.E.; Burton, C.L. Apple damage assessment during intrastate transportation. Trans. ASAE 1990, 6, 753–758. [Google Scholar]
Figure 1. Flowchart describing the experimental setup (impact and vibration tests) on cantaloupe fruit.
Processes 10 01187 g001
Figure 2. Experimental setup of impact testing in cantaloupe fruit.
Processes 10 01187 g002
Figure 3. Bruise volume calculation and the shape damage for the flesh cantaloupe.
Processes 10 01187 g003
Figure 4. Schematic layout of the system used for the vibration analysis.
Processes 10 01187 g004
Figure 5. Schematic diagram of a laboratory vibration simulator.
Processes 10 01187 g005
Figure 6. Singular value decomposition of the spectral density matrices for cantaloupe fruit.
Processes 10 01187 g006
Figure 7. The bruising of fruit due to different impact heights at different impacted surfaces.
Processes 10 01187 g007
Figure 8. Bruise volume of fruit due to different impact heights at different impacted surfaces.
Processes 10 01187 g008
Figure 9. Impact energy of fruit due to different impact height at different impacted surfaces.
Processes 10 01187 g009
Figure 10. Bruise volume vs. storage time at different surface for cantaloupe fruit.
Processes 10 01187 g010
Figure 11. Bruising area vs. impact energy for cantaloupe.
Processes 10 01187 g011
Figure 12. Bruise volume vs. impact energy for cantaloupe.
Processes 10 01187 g012
Figure 13. Relationship between the power spectral density, dB2/Hz, and frequency (Hz) of cantaloupe with different packing methods and a duration of 5 min: (a) 0–50 Hz, (b) 50–100 Hz, (c) 100–200 Hz.
Processes 10 01187 g013aProcesses 10 01187 g013b
Figure 14. Relationship between the power spectral density, dB2/Hz, and frequency (Hz) of cantaloupe with different packing methods and a duration 10 min: (a) 0–50 Hz, (b) 50–100 Hz, (c) 100–200 Hz.
Processes 10 01187 g014aProcesses 10 01187 g014b
Figure 15. The effect of the packaging method on the bruise volume of cantaloupe at different vibration frequencies and durations: (a) 5 min; (b) 10 min.
Processes 10 01187 g015
Figure 16. The effect of the vibration frequency on the number of cantaloupe bruised at different packaging method and duration: (a) 5 min; (b) 10 min.
Processes 10 01187 g016
Table 1. Descriptive statistics of vibration analysis for cantaloupes in volume packing at different frequencies.
ItemsDuration TimeMeanRangeSD *SE *CV *
Min.Max.
(0–50 Hz)
P.S.D
(dB2/Hz)
5301.00136.4633.318.6028.66
1031.497.69164.0632.168.3026.36
(50–100 Hz)
P.S.D (dB2/Hz)515.065.1598.3017.224.4529.52
1018.0613.8491.6514.393.7120.58
(100–200 Hz)
P.S.D (dB2/Hz)518.969.9289.3813.743.5518.71
104.092.1516.532.010.5212.67
* Standard Deviation (SD), Standard Error (SE), and Coefficient of Variation (CV).
Table 2. Descriptive statistics of vibration analysis for cantaloupes in paper pulp tray packaging at different frequencies.
ItemsDuration TimeMeanRangeSDSECV
Min.Max.
(0–50 Hz)
P.S.D (dB2/Hz)513.244.6145.718.042.0715.68
1023.7610.3833.203.810.984.14
(50–100 Hz)
P.S.D (dB2/Hz)55.494.0622.062.730.7012.82
109.143.5864.0611.452.9632.36
(100–200 Hz)
P.S.D (dB2/Hz)55.134.069.911.150.305.79
1015.1313.8445.714.251.087.25
Table 3. Descriptive statistics of vibration analysis for cantaloupes in pattern packaging at different frequencies.
ItemsDuration MinMeanRangeSDSECV
Min.Max.
(0–50 Hz)
P.S.D (dB/Hz2)511.491.1485.1116.954.3838.08
1020.356.3758.7713.843.5717.56
(50–100 Hz)
P.S.D (dB/Hz2)512.141.5043.4110.032.5921.35
1019.3916.0840.585.121.326.82
(100–200 Hz)
P.S.D (dB/Hz2)512.722.2485.1113.333.4427.06
108.562.5285.1111.102.8733.48
Table 4. Determining the natural frequency, damping ratio, elasticity, and stiffness factor for cantaloupe fruit for the paper pulp tray packing method.
ModeFrequency, HzDamping Ratio, %Elasticity, MPaStiffness
×104 Hz2 kg2/3
Mode, 125.35.8380.00130.0173
Mode, 245.265.0110.00430.0552
Mode, 385.174.8350.00520.0679
Mode, 4165.094.2370.01580.2045
Mode, 5200.04.2290.08351.0839
Table 5. Determining the natural frequency, damping ratio, elasticity, and stiffness factor for cantaloupe fruit for the pattern packing method.
ModeFrequency, HzDamping Ratio, %Elasticity, MPaStiffness,
×104 Hz2 kg2/3
Mode, 138.762.4380.00310.0405
Mode, 251.41.6230.20672.6821
Mode, 391.31.5210.54117.0211
Mode, 4175.70.99250.71769.3124
Mode, 5197.60.65860.898511.6594
Table 6. Determining the natural frequency, damping ratio, elasticity, and stiffness factor for the cantaloupe fruit volume packing method.
ModeFrequency, HzDamping Ratio, %Elasticity, MPaStiffness,
×104 Hz2 kg2/3
Mode, 152.56.9530.04830.6270
Mode, 291.41.5650.54777.1066
Mode, 3125.31.0310.71189.2365
Mode, 4175.020.51721.159415.0450
Mode, 5195.30.35271.248916.2066
Publisher’s Note: MDPI stays neutral with regard to jurisdictional claims in published maps and institutional affiliations.

